| Energy Engineering |
DOI: 10.32604/ee.2022.018009
ARTICLE
Research on Power Consumption Anomaly Detection Based on Fuzzy Clustering and Trend Judgment
1College of Electricity and New Energy, Three Gorges University, Yichang, 443002, China
2Hubei Provincial Key Laboratory for Operation and Control of Cascaded Hydropower Station, Three Gorges University, Yichang, 443002, China
3Qinzhou Power Supply Bureau of Guangxi Power Grid, Qinzhou, 535000, China
*Corresponding Author: Xianshan Li. Email: xiong_wei66@126.com
Received: 22 June 2021; Accepted: 12 August 2021
Abstract: Among the end-users of the power grid, especially in the rural power grid, there are a large number of users and the situation is complex. In this complex situation, there are more leakage caused by insulation damage and a small number of users stealing electricity. Maintenance staff will take a long time to determine the location of the abnormal user meter box. In view of this situation, the method of subjective fuzzy clustering and quartile difference is adopted to determine the partition threshold. The power consumption data of end-users are divided into three regions: high, normal and low, which can be used to screen users in the area of abnormal power consumption. Then the trend judgment method is used to further accurately screen to improve the accuracy and reduce the number of users in the abnormal range. Finally according to abnormal power consumption auxiliary locate abnormal electricity users list box. Then the simulation environment is set to verify the application of membership fuzzy clustering and trend judgment in power consumption data partition.
Keywords: User power consumption; fuzzy clustering; trend judgment; degree of membership
In the low-voltage distribution network, especially in the rural-urban junction or rural power network, the low-voltage users are many and scattered. Since power network has been used for a long time and the construction is relatively backward, the insulation of some lines is aging, some lines are laid with bare wires, some lines are winding around obstacles, so the fault rate is high. In the user’s home, there are also some unreasonable line layout, mixed wiring of high voltage and low voltage. In addition, insulation surface damage is also one of the reasons for the failure. Therefore, leakage is one of the main faults. Since users in rural areas are scattered and difficult to manage, there are also a small number of users who steal electricity. Based on the above mentioned situation, whether a user reports a leakage fault or the monitoring system finds an abnormality, maintenance staff need to spend a long time to conduct manual inspection, otherwise it is impossible to determine the location of the meter box of the user with abnormal electricity consumption. So we study the automatic screening method of abnormal electricity consumption. With the improvement of smart power grid, it automatically identify abnormal electricity users by big data technology. The research has a wide application prospect. Maintenance staff solve problems quickly with automatic identification technology, which can improve customer satisfaction and standardize the power market.
At present, there are also some researches on that. Part of the study is to detect the local damage of insulation by technical means. The performance of insulation is judged by ultra-low frequency detection of dielectric loss in reference [1], and the insulation condition is judged by partial discharge detection in reference [2]. However, the judgment of fault category is relatively simple. In recent years, researches on abnormal electricity consumption of users are mainly divided into two major aspects. Some studies identify the difference between the collected electricity consumption data and the real value through various methods, that is, identify the false positive rate of data collection. Most of them identify abnormal electricity data collected by various clustering methods [3–5]. There are also studies that identify abnormal electricity consumption data collected by influencing factors such as temperature and holidays [6]. Other studies identify abnormal load data in the whole region [7–9]. These studies only identify the authenticity of the collected data, and do not study the further application of these data to the judgment of fault or electric theft. Another major aspect of electricity consumption research is the determination of power theft by users. How to manually screen abnormal electricity meter box [10]. How to analyze the suspicion degree of power theft by trend offset [11]. There are also some studies on the diagnosis of abnormal demand side power consumption of distribution network by using the method of characteristic algorithm [12–14]. Or the data mining technology of electricity consumption can be used to judge users’ behavior of stealing electricity [15–17]. This kind of research only uses electricity consumption data to identify electric theft, without considering the identification of local leakage faults that are common in low-voltage distribution networks. In addition to the main studies mentioned above, there are also studies on the use of electricity consumption data to analyze the operation of the power grid. Some of them study the application of power consumption data in distribution network line loss anomaly analysis [18]. Some studies use electricity data for user identification [19]. Other studies have analyzed the relationship between the amount of electricity charged and the amount of electricity consumed [20]. The research in this respect will not be elaborated here.
To sum up, the above research did not use the method of user power consumption data partition to simultaneously identify the leakage fault and power theft behavior of low-voltage end users. In this paper, the method of membership fuzzy clustering combined with trend judgment is used to screen abnormal electricity consumption. The position of abnormal meter box is determined by dividing reasonable power consumption interval. The research can not only reduce the inspection scope of operation and maintenance personnel, improve work efficiency, but also facilitate the implementation of computer programs, which has high practical application significance. User’s power consumption behavior can be described by user load data. Due to the large amount of electricity data of users and its randomness, it is always difficult to divide the reasonable range of electricity consumption of users. Abnormal power consumption in residential areas mainly includes two areas in opposite directions: low-voltage failure of power system or power theft by users. Forward high abnormal interval indicates insulation damage and leakage. Reverse low position abnormal interval indicates the suspicion of electric theft. Therefore, this paper mainly studies the division of electricity consumption interval. After the interval threshold is determined, the electricity consumption can be preliminarily judged according to the interval where the user consumes electricity.
2 Theory of Comprehensive Screening for Abnormal Data of Consumer Electricity Consumption
The integrated screening theory process structure includes a preliminary analysis of the data platform, subordinate fuzzy clustering model and trend assistant judgment model [21]. Due to the large base of electricity users, strong randomness of power load and incomplete information, the research of interval fuzzy membership clustering is introduced in order to scientifically characterize whether users have fault or electricity theft behavior. Based on the membership fuzzy clustering model, the clustering interval of membership degree and density was constructed by using the electricity consumption of users in the distribution network station, and the table box of abnormal users was preliminarily determined to reduce the scope of investigation. Considering that the historical power load data of electricity users have a certain sudden irregularity, and the ranges of too high and too low power load represent the abnormal electricity consumption of users. Thus, with the help of the trend-aided judgment model, the statistical window period of power load is determined, and the abnormal user meter box is filtered out more accurately according to the fitting slope, so as to improve the accuracy of electricity consumption analysis. Its hierarchical structure is shown in Fig. 1.
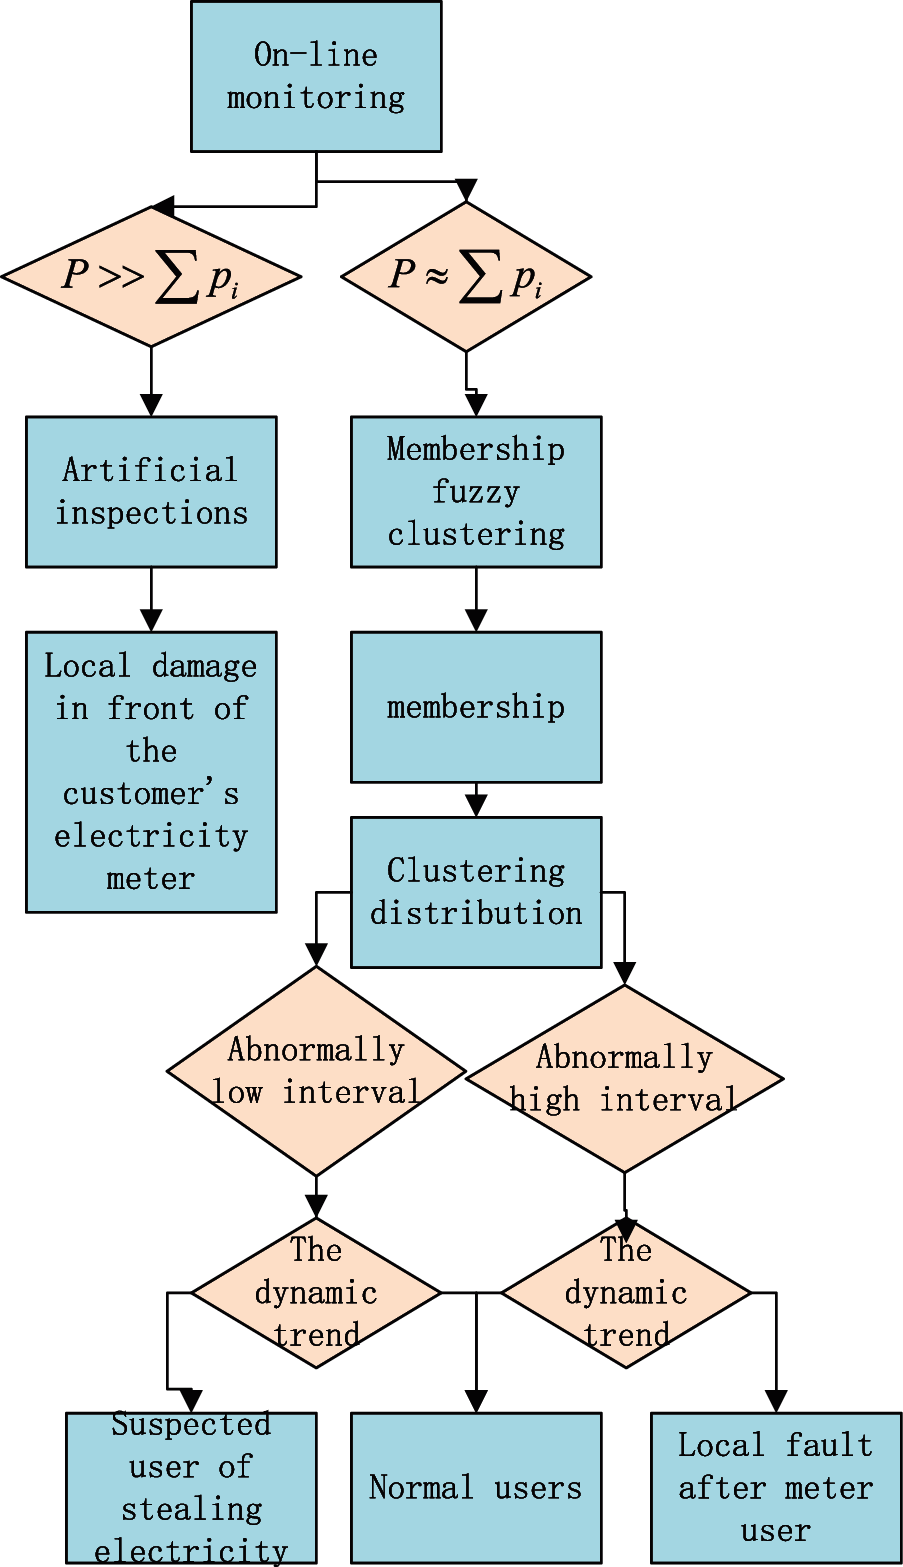
Figure 1: Excavate structure of mining theory
The on-line monitoring platform of power system can monitor and collect the data of master electricity meter and user electricity meter in real time. When the total value of the electricity meter is suddenly much greater than the sum of the user’s electricity meter, it can be judged by manual inspection whether there is local insulation damage or small current earth leakage fault in the low-voltage distribution line before the user’s electricity meter. Data platform In general, the station meter is approximately equal to the sum of the user’s meter readings, because of the line loss, not exactly equal. At this time, the monitoring and identification system has been automatically identifying and judging without manual inspection. The first according to the subordinate fuzzy clustering model can preliminarily divide the abnormal power consumption interval. With the help of membership function, the membership degree of daily load curve of different users is calculated. Combined with the density curve of one-dimensional normal distribution, the division thresholds of different intervals are obtained. Divide high and low power consumption by threshold. As a result, the abnormal interval is determined, and the user meter box of abnormal power consumption is preliminarily determined. The trend-aided judgment model can screen and determine the power failure table box and the suspected power theft table box in the abnormal range. Considering that the electricity consumption of normal users is relatively stable, while the electricity consumption of leakage users shows a rapid upward trend, the power consumption trend of electricity-stealing users tends to slow down after a decline, in view of this, we can consider the electricity load of suspected users in the past few days as the statistical window period, taking into account the downward trend and upward trend during the period. Using the slope obtained by straight-line fitting of electric quantity as a measure, if the slope continues to decrease with time, it is considered to be suspected of stealing electricity. Or the slope rises, it is considered that it is possible that the user has a leakage fault. Finally, filter out the required users to form a list of key table boxes.
3 Application of Membership Fuzzy Clustering Method in Abnormal Power Consumption Screening
3.1 Power Consumption Membership Degree Density Fuzzy Clustering
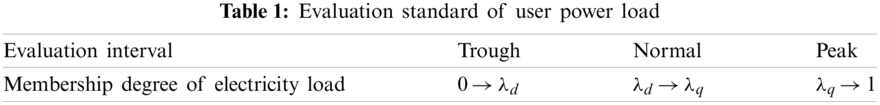
Although users’ electricity consumption is related to users’ behavior patterns, climatic factors, geographical environment and other factors, resulting in different fluctuation ranges, the horizontal comparison at the same time is more accurate. In order to dig out the abnormality of electricity consumption, the interval of user electricity consumption is divided. The membership fuzzy clustering model constructs the membership degree based on the membership function, and divides the membership value into distribution interval, which corresponds to the electricity consumption of users. The customer classification is mainly the electricity interval classification, which divides the evaluation standard interval of “trough”, “normal” and “peak” user load according to the daily electricity consumption of users as the benchmark. Before the evaluation, the electricity consumption of users is unified as the degree of membership, so as to reduce the dispersion of interval division.
P is the maximum power consumption of users in the station area, g is the minimum electricity consumption, and QD is the daily electricity consumption of users,
The electricity consumption of users varies greatly with the change of seasonal temperature, which is larger in winter and summer, but less in spring and autumn. If the electricity consumption is directly used for data analysis and mining, the numerical value varies greatly and is scattered, so here we first convert the electricity consumption value into the membership value. Then in different seasons, the data will not be very different, data analysis methods still apply. Fig. 2 is a schematic diagram, setting a number of users. The horizontal axis represents each user. The vertical axis is the electricity consumption of each user. The red line is the actual electricity consumption, and the blue line is the power consumption membership value. Even at different times of the season the variation range of electricity consumption is larger, while the variation range of membership value is small. It is a relative value which is more concentrated and convenient for analysis. In the calculation of membership value, the values of maximum and minimum power consumption can be artificially adjusted according to the actual value.
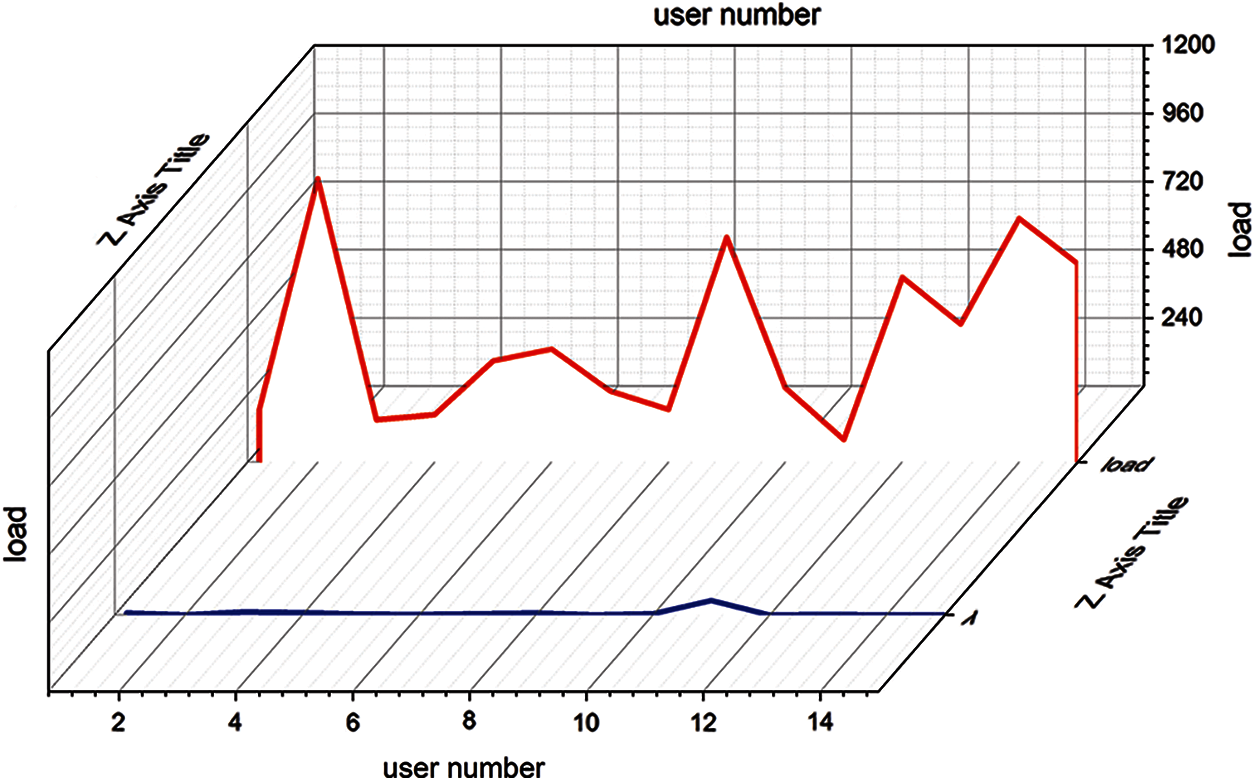
Figure 2: Comparison between electricity consumption and membership value of electricity consumption
According to statistics, the average value of the statistical data of the evaluation index can best reflect the average characteristic of this index. The greater the deviation from the mean value, the greater the deviation from the average characteristic. Therefore, the membership value is used as a variable to describe the three fuzzy interval concepts of “trough”, “normal” and “peak”. According to the historical samples, draw the one-dimensional normal distribution curve by Eq. (2).
Among them,
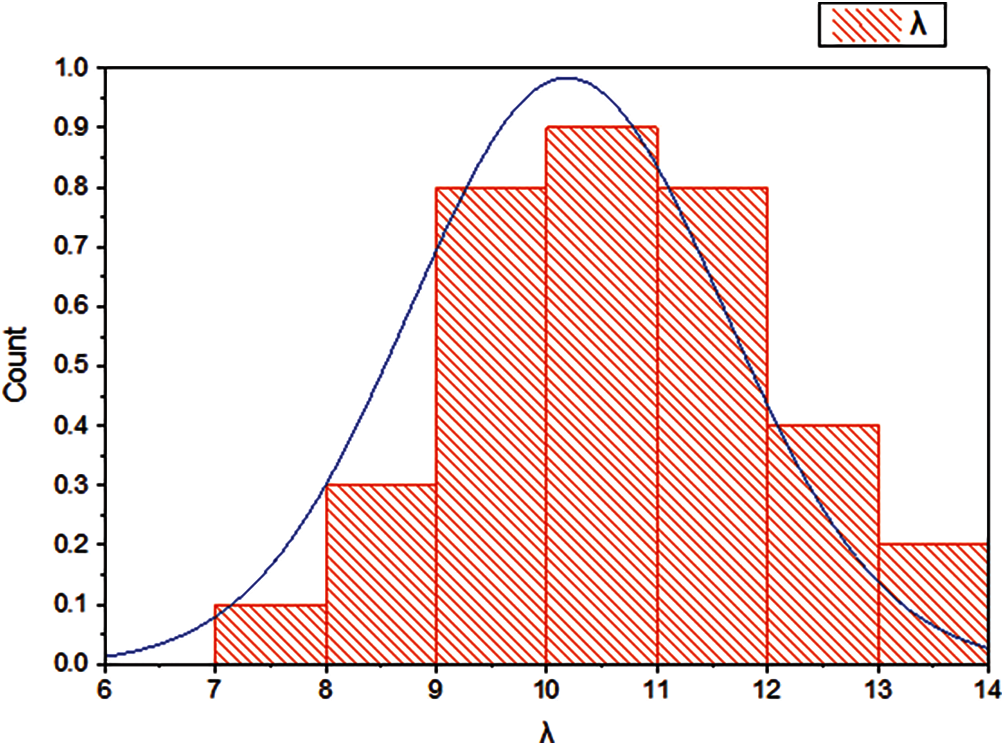
Figure 3: Probability distribution map of membership degree
3.2 Power Consumption Division Based on Interpolation Quartile Difference Method
According to the number of each user in the power station area of the low-voltage distribution network and the actual power consumption, the threshold is divided by probability interpolation quartile difference method [8]. The total number of users in the power station area is N, sorted according to the power consumption. Then, the position of the initial fuzzy value of the low interval threshold is Eq. (3).
The position of the initial fuzzy value of the high interval threshold is in Eq. (4).
Take the position of the threshold as an integer and interpolate it.
According to Eqs. (5) and (6), interval thresholds with abnormally low electricity consumption and interval thresholds with abnormally high electricity consumption can be obtained, as shown in Table 1. If the preliminary probability screening number of users is large, it is not easy to omit, but the further analysis of the calculation is large. If the probability range is small, the number of users is small. Although the amount of calculation and analysis is small in the later stage, it is easy to omit. In practical application, the threshold value can be directly divided manually according to the probability, because the event with 5% occurrence probability is usually a small probability event.
4 Auxiliary Judgment of the Changing Trend of Electricity Consumption
Due to the large scale of the distribution network, complex terminals, local insulation or faults caused by frequent, from the phenomenon, the final result of leakage is reflected in the difference between the total power consumption and the actual electricity consumption. From the investigation experience, the power company needs to compare and analyze the electricity load of the historical time of the abnormal electricity meter box to analyze qualitatively. However, considering that the historical data may have sudden irregularity, this experience cannot improve the accuracy of screening. The trend assistant judgment model is selected, the electricity load of users is compared with historical data periodically, and the upward and downward index of electricity consumption trend is taken as the evaluation index of electricity leakage. Using the electric quantity to do straight line fitting, the slope obtained is measured. If the electricity consumption trend of the user obviously changes to a great extent, then the possibility of leakage of the user is very great. On the contrary, if the trend of electricity consumption is declining, it means that users are suspected of stealing electricity.
The electricity consumption of a user on the first day is f1. When counting the decline trend index of a certain day, set the interval of 5 days before and after the first day as the statistical interval, and calculate the change trend of electricity in these 11 days. The slope of 5 days before and after day i for a total of 11 days is obtained by the least square method.
In the Eqs. (7)--(9) is the average electricity load of the consumer during the statistical window period,
According to the average value, the change trend of electricity consumption of users can be obtained, the slope of electricity consumption of users can be calculated, the change trend of electricity consumption within 11 days can be compared, and the users whose change trends are inconsistent can be listed. From the analysis of periodic calculation results, it can be found that the electricity consumption of normal users is relatively stable, while the electricity consumption of stealing and leakage users shows a downward trend, and then tends to be smooth, and the positive high abnormal interval indicates that the user has insulation breakage, leakage and other fault possibilities. if the electricity consumption trend is continuous decline or rising, it is considered to have a certain suspicion of electricity leakage. Finally, filter out the required users to form a list of troubleshooting.
Taking a typical station in Guangxi Province as the experimental environment, there are both leakage fault users and power theft users in this station. There are a total of 312 households in the station area, among which there are one household with local leakage fault users and one household with stolen electricity users. According to the daily electricity consumption data of all users in a certain area, based on the fuzzy clustering method of membership function, the membership value of electricity consumption of each user is calculated according to Eq. (1). According to the clustering density distribution, the corresponding membership values of consumer electricity consumption by Eqs. (5) and (6).
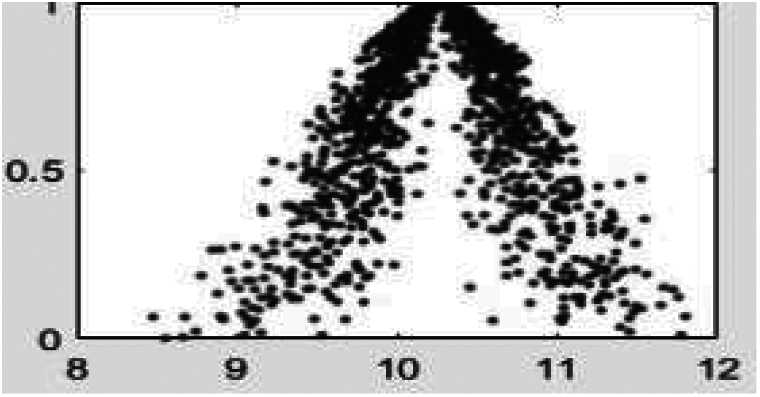
Figure 4: Cloud image of user’s power load membership
According to the interval threshold drawn by the quartile difference method, there are 36 users in the low interval, there are 38 household electricity consumption in high range. If the interval threshold is divided according to small probability events. There are 6 users in the low range and 7 households in the high range. Different threshold partitioning methods will screen out different number of users. The number of selected users is large, so it is not easy to miss target users, but it will affect the efficiency of manual inspection or further calculation. The number of selected users is small, so it is easy to miss target users, but the workload of manual inspection or further calculation is much smaller. Therefore, in the division of interval threshold value, the power grid company can adopt different methods according to the actual needs, or manually set. Since the users of electric theft are in the low range, the electricity consumption data of the users of electric theft are selected for further analysis. In the high range select a leakage user and a normal user to do a comparative analysis. With the help of the membership fuzzy clustering model, it is found that user A is in the low interval, user B and user C is in the high interval. Using the trend assistant judgment model, the consumer electricity consumption No. 1 to No. 11 is selected as the statistical window period, and the slope obtained by straight line fitting is used as the measure. Table 2 shows the downward trend of electricity consumption of user A, Table 3 shows the upward trend of electricity consumption of user C, and Table 4 shows the upward trend of electricity consumption of user B.
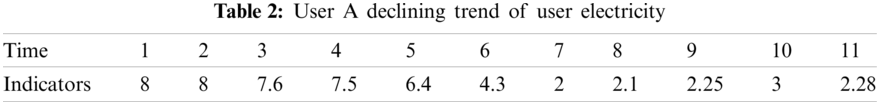
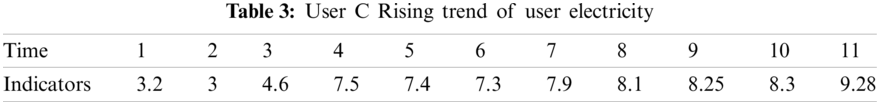
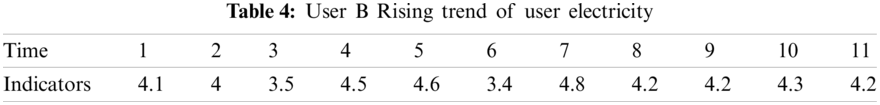
By comparing the daily electricity consumption of this user with the average daily electricity consumption of the community, we find that the electricity consumption level of user A has been in a state of obvious decline, and maintained an obvious level in the later stage. The level of electricity consumption of user C has been in a state of obvious increase, and the trend of electricity consumption has increased significantly in a short period of time. Although the electricity consumption of user B is in a high range, the electricity consumption of user B is always stable. Therefore, according to the forward high abnormal interval indicates the possibility of insulation damage, leakage and other faults, and the reverse low abnormal interval indicates the suspicion of power theft, it can be determined that user A is suspected of power theft and user C is suspected of power leakage. User B is excluded from further screening. Power grid companies can arrange on-site inspection according to the screening results.. Of course, if the grid company has enough manpower and is not willing to miss out on suspected users, it can make door-to-door inspections based on the primary results.
In this paper, the methods of subordinate fuzzy clustering and trend assistant judgment are used to analyze the abnormal power consumption. The following conclusions can be drawn:
(1) The membership fuzzy clustering method can be used to screen the power consumption of users through the historical electricity consumption information of users, and help to distinguish the abnormal power consumption. According to the needs of the actual situation, the interval threshold can be flexibly divided by the quartile difference method or small probability events.
(2) The judgment of power consumption trend can further accurately judge the fault and electricity theft, reduce the workload of staff.
(3) Through the screening of abnormal electricity users, the working efficiency of the staff can be improved and reduced the number of manual inspections. Reduces troubleshooting time by identifying the abnormal use of the meter box.
Funding Statement: This work is supported by Open Fund of Hubei Provincial Key Laboratory for Operation and Control of Cascaded Hydropower Station (2019KJX10) and Open Fund of Key Laboratory of Tsinghua University (SKLD17KM07).
Conflicts of Interest: The authors declare that they have no conflicts of interest to report regarding the present study.
1. Ren, Z., Wei, L., Feng, Z. (2018). Evaluation of cable insulation performance and analysis of its influence factors based on ultra low frequency dielectric loss detection. Insulating Materials, 51(4), 64–74. DOI 10.16790/j.cnki.1009-9239.im.2018.04.013. [Google Scholar] [CrossRef]
2. Zhang, D. H. (2016). Research on partial discharge detection technology of oscillation wave of medium voltage cable in distribution network. Enterprise Technology Development, 35(8), 35–36. DOI 10.16862/j.cnki.1006-8937.2016.05.03. [Google Scholar] [CrossRef]
3. Liang, Y. Q., Wang, H. Y. (2017). Power consumption data recognition based on clustering analysis. Engineering Journal of Wuhan Univertity, 50(4), 542–555. DOI 10.14188/j.1671-8844.2017-04-010. [Google Scholar] [CrossRef]
4. Liang, J., Liang, G. M. (2021). Abnormal electricity consumption data recognition based on ARMA and K-Mands. Hubei Electri Power, 43(4), 65–70. DOI 10.19308/j.hep.2019.04.010. [Google Scholar] [CrossRef]
5. He, K., He, Z. A. (2021). Rerearch on electricity abnormal identification of isolated forest based on PCA. Computng Technology and Automation, 40(2), 76–80. DOI 10.16339/j.cnki.jsjsyzdh.202102016. [Google Scholar] [CrossRef]
6. Zhang, Y. M. (2019). Research on identification and processing method for abnormal data of residential electric power. Proceedings of 2019 IEEE 3rd International Electrical and Energy Conference, pp. 900–904, Beijing, China. [Google Scholar]
7. Tian, L., Xiang, M. (2017). Abnormal analysis algorithm of power system power consumption based on density clustering technology. Power System Automation, 41(5), 64–70. DOI 10.7500/AEPS20160510003. [Google Scholar] [CrossRef]
8. Zhao, T. H., Zhang, Y., Wang, J. X. (2021). Load outlier identification method based on density-based spatial clustering and outlier boundaries. Automation of Electric Power Systems, 10, 97–105. DOI 10.7500/AEPS20200622003. [Google Scholar] [CrossRef]
9. Liu, X. H., Gao, J. C. (2020). Smart grid abnormal power detection framework. Techniques of Automation & Applications, 39(12), 124–128. DOI 10.16349/j.cnki.1003-7241.2020.12.013. [Google Scholar] [CrossRef]
10. Lu, L. S. (2016). Application of integrated system to help check single-phase ground and neutral line live fault. Rural Electrician, 24(5), 33–34. DOI 10.16642/j.cnki.ncdg.2016.05.044. [Google Scholar] [CrossRef]
11. Yang, X. M., Hua, Y. D., Huang, C. Y. (2016). Research on the analysis method of trend suspect degree of electricity theft prevention for users in low-voltage station area. Electrical Appliances and Energy Efficiency Management Technology, 51(10), 28–36. DOI 10.16628/j.cnki.2095-8188.2016.10.006. [Google Scholar] [CrossRef]
12. Hao, F. Z., Sun, Q. Z. (2019). User-side power behavior analysis of distribution network based on high dimensional random matrix. Guangdong Electric Power, 32(11), 33–39. DOI 10.3969/j.issn.1007-290X.2019.011.014. [Google Scholar] [CrossRef]
13. Yuan, X. Y., Zhang, P. H., Xiong, S. Q., Zhao, B., Li, Q. Y. (2021). Identification of abnormal power consumption mode based on combination algorithm. Electrical Measurement & Instrumentation, 58(1), 1–8. DOI 10.16373/j.cnki.1001-1390.2021.01.022. [Google Scholar] [CrossRef]
14. Huang, Y. H., Guo, S. H. (2021). Detection method of abnormal electricity based on elctricity characteristics. Journal of China Three Gorges University, 43(1), 96–101. DOI 10.13393/j.cnki.issn.1672-948X.2021.01.017. [Google Scholar] [CrossRef]
15. Feng, Z. Y. (2020). Data mining for abnormal power consumption pattern detection based on local matrix reconstruction. International Journal of Electrical Power and Energy Systems, 123, 36–49. DOI 10.1016/j.ijepes.2020.106315. [Google Scholar] [CrossRef]
16. Long, Z. Y. (2020). A study of intelligent analysis of abnormal power consumption behavior based on daily load curve. ACM International Conference Proceeding Series, pp. 209–216. Virtual, Online, UK. [Google Scholar]
17. Wang, H. J. (2020). Research on abnormal power consumption detection technology based on decision tree and improved SVM. 2020 IEEE International Conference on Mechatronics and Automation, pp. 1687–1691. Beijing, China. [Google Scholar]
18. Pan, L. Z. (2014). Application of data platform in abnormal analysis and investigation of distribution network line loss. Electronic Test, 5, 8–11. DOI 10.16592/j.cnki.1000-8519.201405002. [Google Scholar] [CrossRef]
19. Zhang, R., Sun, X. L. (2020). A platform user identification method based on outlier detection and improved k-means algorithm. Intelligent Power, 48(1), 23–28. DOI 10.16691/j.cnki.2096-4145.2020.01.003. [Google Scholar] [CrossRef]
20. Zhang, L., Li, A. (2018). Analysis on the power consumption abnormality of customer swith high power consumption based on tableau. Electrical Engineering Technology, 7, 76–77. DOI 10.16860/j.cnki.1002-1388.201807002. [Google Scholar] [CrossRef]
21. Zhang, L. J. (2015). Matlab data analysis and mining practice. Beijing, China: China Machine Press. [Google Scholar]
 | This work is licensed under a Creative Commons Attribution 4.0 International License, which permits unrestricted use, distribution, and reproduction in any medium, provided the original work is properly cited. |