| Energy Engineering |
DOI: 10.32604/ee.2022.015984
ARTICLE
Transient Simulation and Optimization of Regional Integrated Energy System
1State Grid Economic and Technological Research Institute Co., Ltd., Beijing, 102209, China
2Qingdao University of Technology, Qingdao, 266033, China
*Corresponding Author: De-gejirifu. Email: dove@ncepu.edu.cn
Received: 29 January 2021; Accepted: 08 April 2021
Abstract: A modeling method of regional integrated energy system based on bus method and transient simulation is proposed, and the system optimization is based on the dynamic balance of supply and demand in the whole year energy supply cycle. A CCHP system of gas turbine coupled with ground source heat pump and electric refrigeration unit is constructed. The energy relationship of the system is described by bus structure, and the transient calculation model is built on TRNSYS platform. The weighted sum of annual total cost saving rate, primary energy saving rate and environmental pollutant shadow cost saving rate is taken as the optimized objective function, and on the basis of annual dynamic balance, the Hooke-Jeeves algorithm is used for optimization of the system configuration. A complex commercial area in Beijing is taken as an example, and different weighting coefficients are set for optimization of the system configuration. The results show that, from the perspective of economy, environmental benefit and primary energy consumption, performance of the system increases and then decreases with rise of gas turbine power; under the simulated cooling/heating load, the maximum number of optimum configuration is seen in the combination of 35 kW gas turbine + 723 kW GSHP and 1178 kW electric chiller; in comparison with traditional distributed system, the annual cost saving rate, primary energy saving rate and environmental pollutant shadow cost saving rate of the system are 29.4%, 49.6% and 58.2%, respectively.
Keywords: Integrated energy system; transient simulation; multi-objective optimization
Combined with renewable energy, other types of energy and isolated cooling, heating and power supply systems, the integrated energy system is an important means to realize multi-energy complementation, combined cooling, heating and power supply, and optimization and improvement of energy structure [1]. The gas combined cooling, heating and power system (CCHP) is an important part of integrated energy system, which can significantly improve primary energy utilization, realize graded use of energy and reduce pollutant emission [2]. For the comprehensive energy system, putting forward reasonable modeling method and optimization method to optimize the system configuration and operation mode is an effective way to reduce the investment, energy consumption and operation cost of the system, and overcome the development obstacles caused by economy.
At present, the research on integrated energy system mainly focuses on system modeling and optimization. At present, there are mainly three methods for the modeling, energy hub modeling theory, energy network theory and bus method. In 2007, Swedish Federal Institute of Technology [3] proposed the “Energy hub” abstract model, which is known as a unit capable of conversion, regulation and storage of multiple energy carriers and has actually described the functional relationship of multi-energy system from input to output [4]. Chen et al. [5] built the network flow planning model after analysis of source point and meeting point in integrated energy delivery system planning, modeled a distributed energy supply system based on the energy network theory, performed exergy transfer analysis and calculation of various parts of the distributed energy supply system, and finally proposed the analysis method for modeling and simulation of dynamic characteristics of multi-energy complementary system by building the time-varying energy network equation. Wang et al. [6–8] used a new busbar expression form, classifying busbar into power, cooling, heating and gas buses by energy transfer medium; the model shows the energy flow relationship, connection type and coupling relationship between equipment in integrated energy system in detail, and indicates the energy conversion process between different mediums.
In terms of system optimization, Dong et al. [9] used the particle swarm optimization (PSO) algorithm for optimization the combined power-gas energy system model composed of detailed AC power flow model of power network and steady-state model of gas network and obtained the optimum solution of the system. Wang et al. [10] proposed a method for investment evaluation of integrated energy network, which gives overall consideration to return on investment in power supply and heating and has provided the basis for investment in and optimization of integrated energy project. Cardona et al. [11] established the triple power supply system of heat pump coupled gas turbine, and determined the operation mode and system configuration by comparing the electricity price and the fuel price required to generate unit electricity. Yan et al. [12] established a mixed integer nonlinear optimal configuration model with the minimum annual total cost as the objective function, and optimized the original engine capacity and collector area of the CCHP system coupled with solar photothermal. Zhao et al. [13] constructed a photovoltaic coupled electric heating system, established an optimization objective function with the goal of minimizing the investment and operation cost of the whole life cycle of photovoltaic and heat accumulator, and solved it by particle swarm optimization algorithm, optimized the area of photovoltaic panels and the capacity of heat accumulator.
Most of the current studies focus on the level of energy planning, and the optimization was based on design conditions or simulation of typical heating (cooling) daily energy supply system. Three methods, energy hub modeling theory, energy network theory and bus method, can reflect the energy transfer and conversion relationship under a certain set working condition. When the load in the whole year cycle is transient, and the equipment changes dynamically with the different load requirements and meteorological parameters, the above three methods will become complex in the solution, so they have limitations in the system configuration optimization and operation scheduling optimization. In terms of optimization, most of the above studies take the optimal economy as the optimization goal, mainly considering the operating cost and initial investment of the system. However, with the attention of the country to energy conservation and environmental protection in recent years, the economy is no longer the only factor to measure the system performance. At the 75th Session of the United Nations General Assembly, China stated that it would strive to reach a carbon peak by 2030 and become carbon neutral by 2060. Therefore, the influence of economy, energy consumption and pollutant emission should be considered when optimizing the system.
In order to solve the above problems, a modeling method combining the bus method and transient simulation and an optimization method based on the hourly dynamic balance of supply and demand in the annual energy supply cycle are proposed. The energy balance equation of the system was established by the bus method, and the transient simulation model was built on TRNSYS platform. Taking the weighted sum of annual cost saving rate, primary energy saving rate and shadow cost saving rate of environmental pollutants as the optimization objective function, Hooke–Jeeves algorithm was used to optimize the system configuration and the comprehensive energy system. Combined with a practical case, the optimal configuration ratio of the system was explored.
2 Transient Calculation Model of Regional Integrated Energy System
At present, the technology of small and micro gas turbines with power 25–1000 kW develops rapidly, having promoted the development of gas CCHP technology in small regions. For a complex commercial area in Beijing, a CCHP system composed of micro gas turbine, GSHP and electric chiller is built, the busbar approach is used to establish the energy-balance equation of the system, and the transient simulation model is built on the TRNSYS platform. Schematic diagram of the system is shown in Fig. 1.
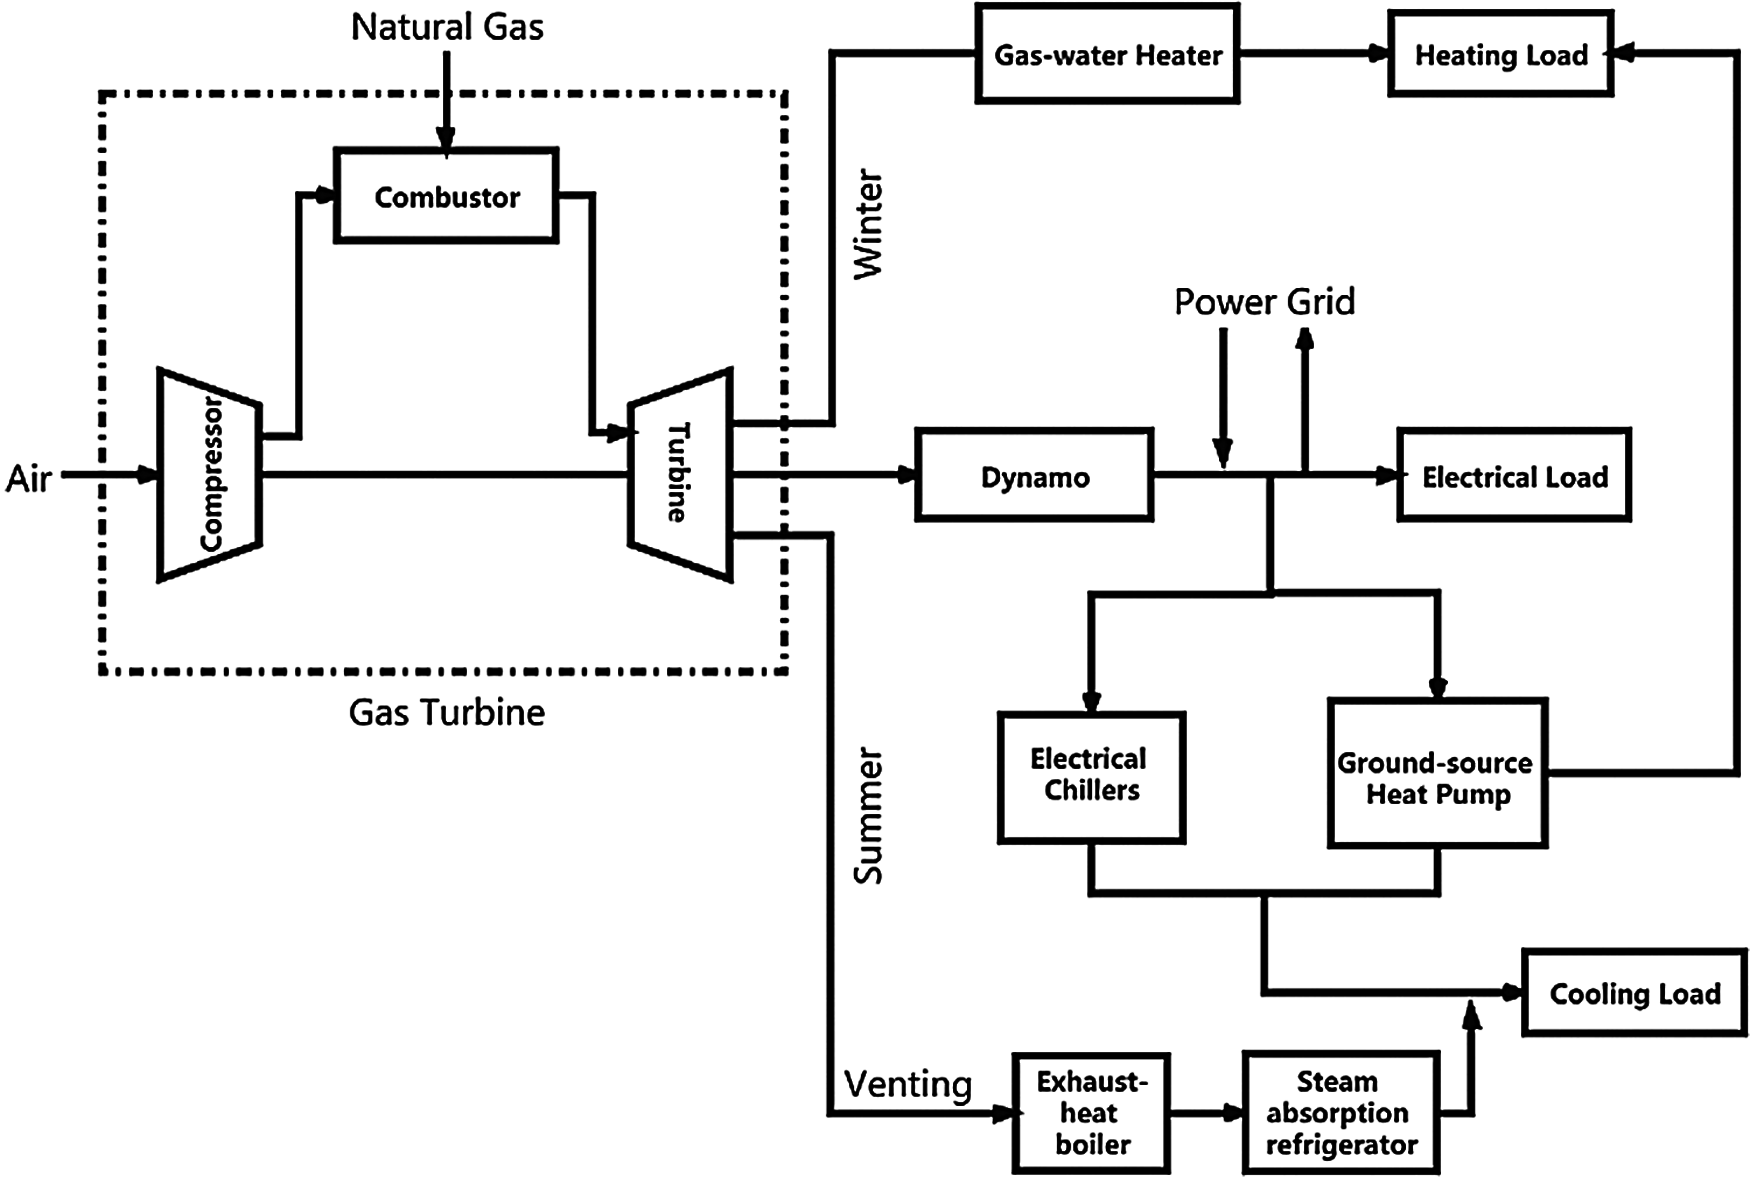
Figure 1: Schematic diagram of system
In winter, flue gas waste heat of gas turbine is supplied to users through flue gas/hot water heat exchanger, and the remaining heating load is supplied by GSHP; in summer, flue gas waste heat is delivered through heat recovery boiler to drive the steam type absorption lithium bromide unit to meet the cooling demand of users, the remaining cooling load is supplied by GSHP, and electric chiller is started up in case of insufficient cooling load. Power generated by gas turbine is firstly supplied to the system, and any excess electricity is connected to power grid. Power supply by the grid is applied when gas turbine does not meet the requirement.
To show internal coupling relation of the system accurately and clearly, this paper adopts the busbar structure for description. In this method, busbar is classified by energy type into electrical, flue gas, steam, hot water and cold water busbars that are connected through various energy equipment, as shown in Fig. 2.
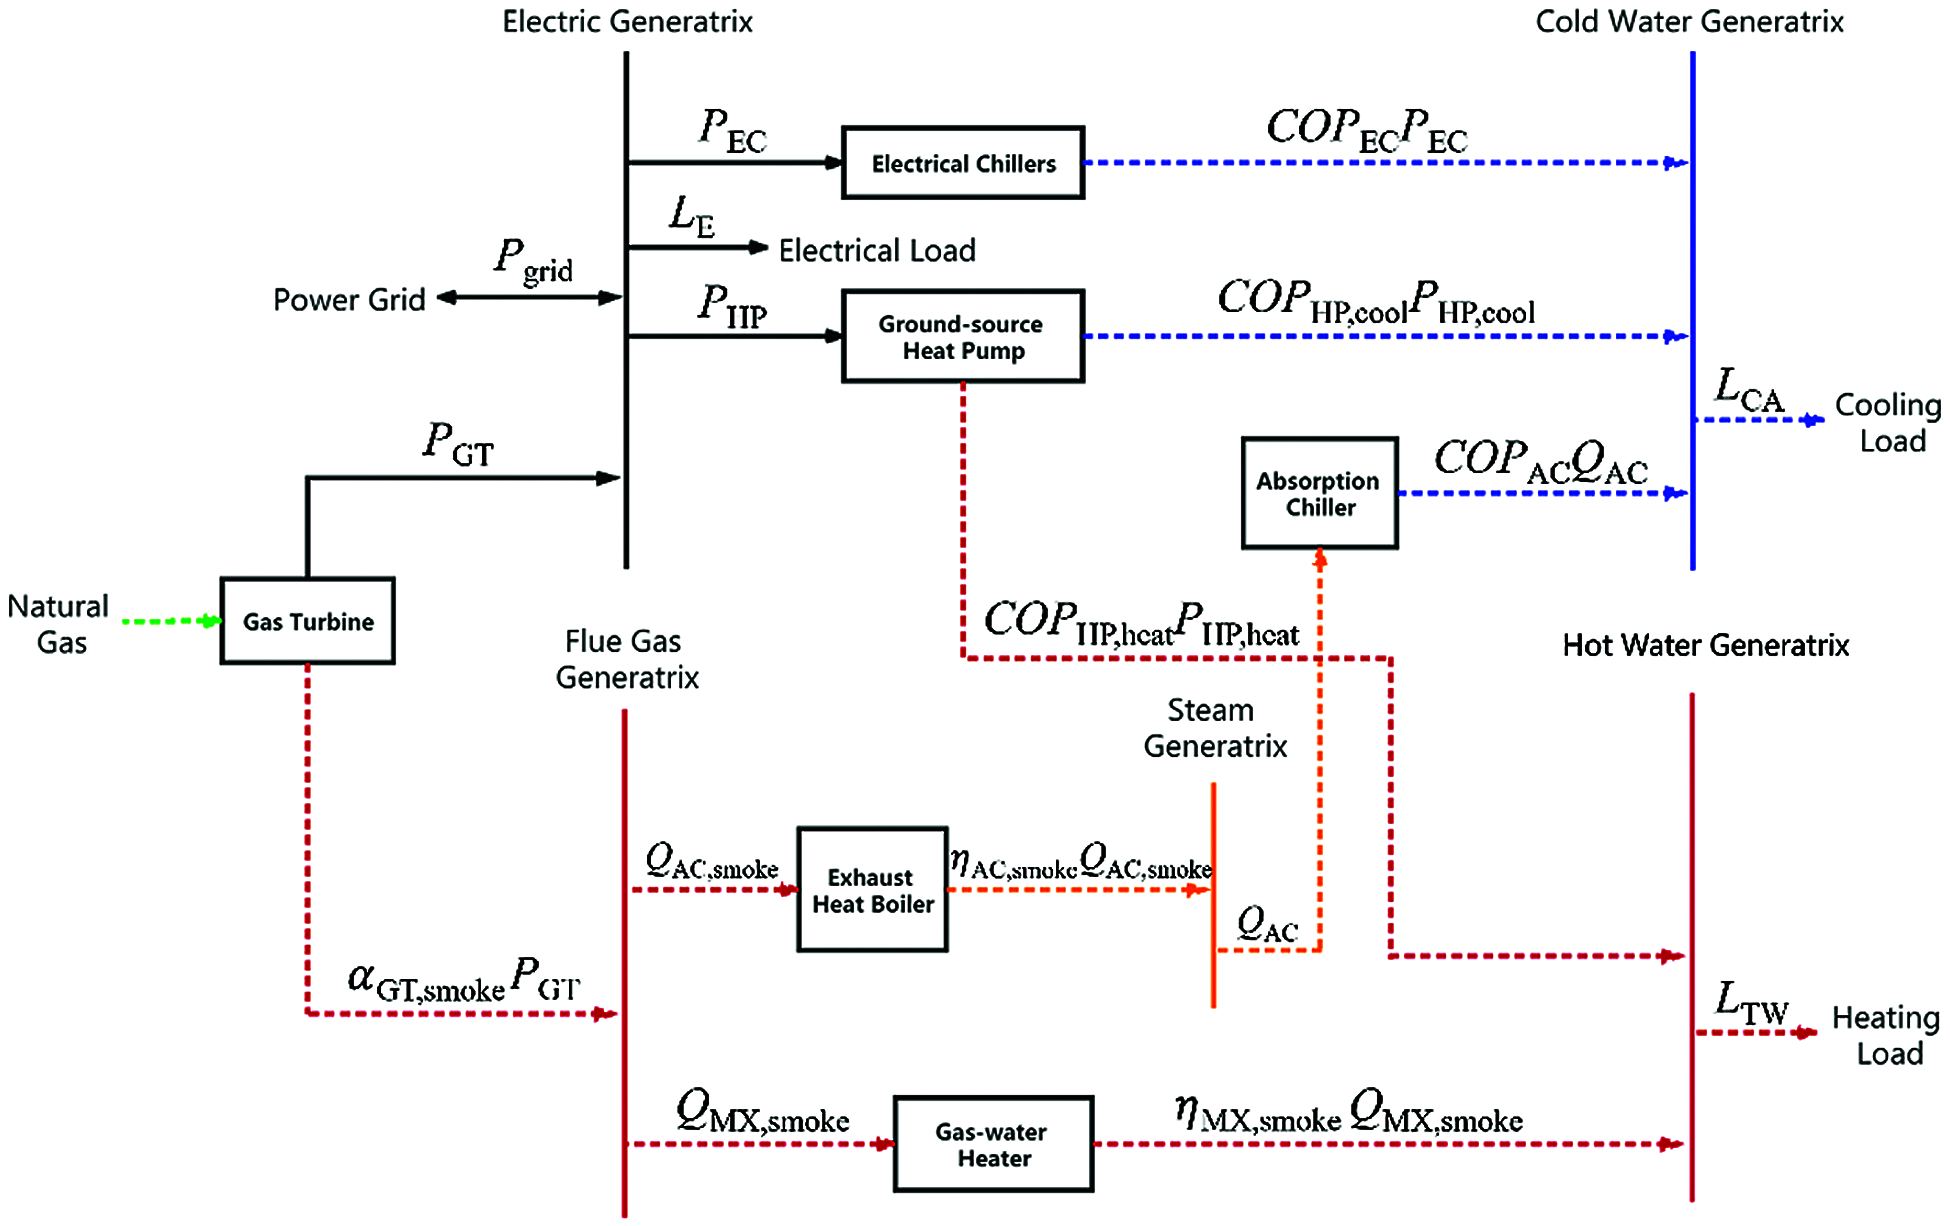
Figure 2: Busbar structure of regional integrated energy system
The balance relations of various busbars are described below.
2.1 Power Balance Relation of Electrical Busbar
where Pgrid—External grid power, kW; PGT—Gas turbine power, kW; LE—Electric power of user, kW; PHP—Power consumption of GSHP, kW; PEC—Power consumption of electric chiller, kW.
2.2 Power Balance Relation of Flue Gas Busbar
where αGT, smoke—Heat-power ratio of gas turbine; QAC, smoke—Thermal power of flue gas through heat recovery boiler, kW; QHX, smoke—Thermal power of flue gas through heat exchanger, kW.
2.3 Power Balance Relation of Steam Busbar
where ηAC, smoke—Heat exchange efficiency of heat recovery boiler; QAC—Cooling efficiency of absorption chiller, kW.
2.4 Power Balance of Hot Water Busbar
where COPHP, heat—Heating energy efficiency ratio of heat pump; PHP, heat—Heating power of heat pump, kW; ηHX, smoke—Heat exchange efficiency of flue gas-hot water heat exchanger; LTW—Heating power required by user, kW.
2.5 Power Balance of Cold Water Busbar
where COPHP, cool—Cooling energy efficiency ratio of heat pump; PHP, cool—Cooling power of heat pump, kW; COPAC—Cooling energy efficiency ratio of absorption chiller; COPEC—Energy efficiency ratio of electric chiller; LCA—Colling power required by user, kW.
The above busbar structure has reflected energy balance relations of the system under certain state; however, cooling/heating load and equipment output vary with meteorological parameters. In order to ensure hourly matching of energy supply and load demand of users, transient simulation model is built on the TRNSYS platform to simulate running condition of the coupled system in a full year, as shown in Fig. 3.
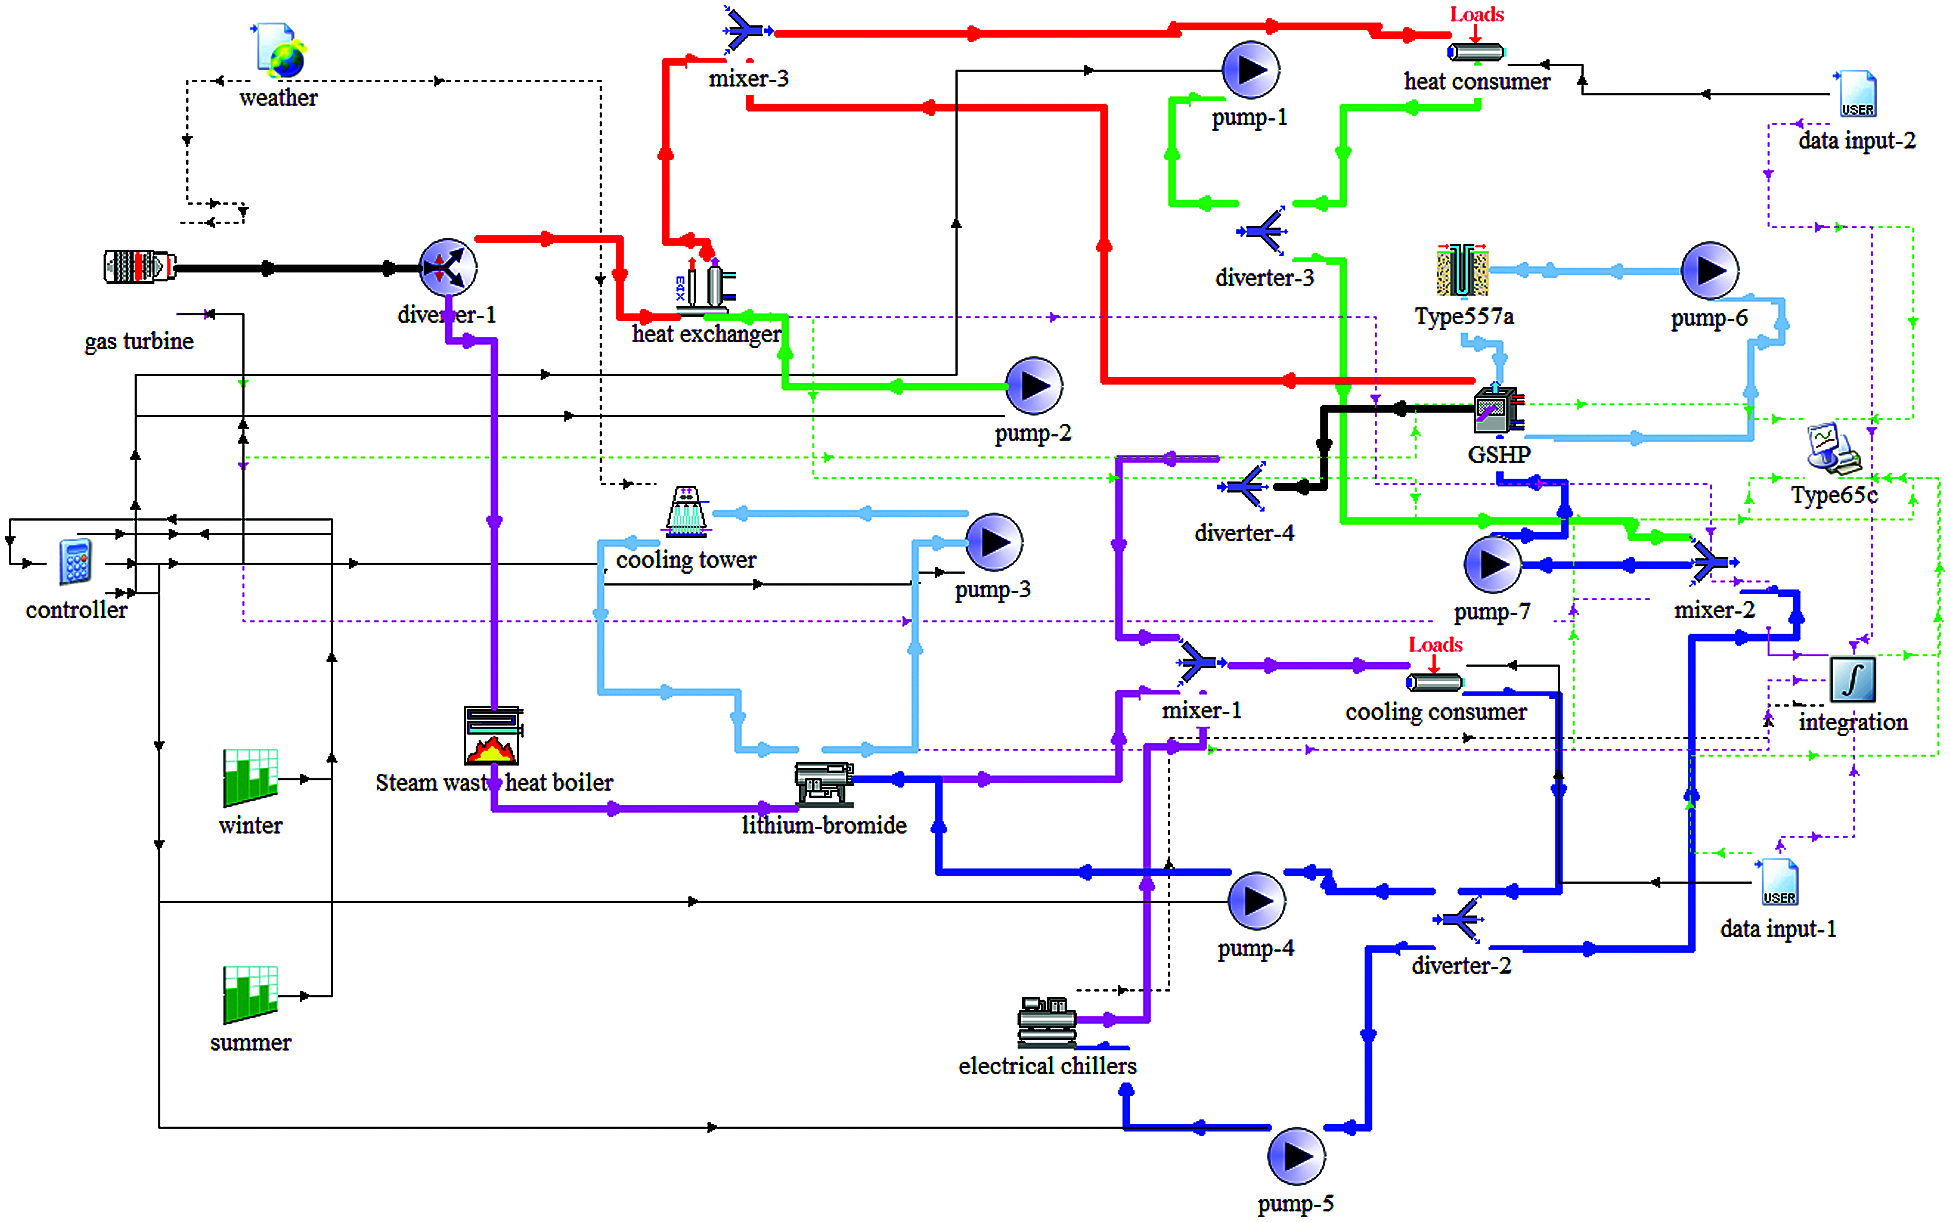
Figure 3: TRNSYS model of gas turbine coupled soil source CCHP system
According to the construction cost and energy level of each energy equipment, the operation strategy of the construction system is as follows:
(1) When the maximum heat load borne by the waste heat of gas turbine flue gas under a certain configuration is greater than the hourly heat load of the building, all the heat loads are borne by the gas turbine. At this time, the ground source heat pump is not turned on. When the cooling capacity of lithium bromide cannot meet the cooling load, the electric refrigeration unit is turned on.
(2) When the maximum heat load that the waste heat of gas turbine flue gas can bear under a certain configuration is less than the hourly building heat load, the ground-source heat pump is turned on to meet the heating demand; when the lithium bromide cooling capacity cannot meet the cooling load, the ground-source heat pump is turned on first, and the electric refrigeration unit is turned on when it is insufficient.
3 Optimization Model of Regional Integrated Energy System
As different equipment configurations will affect system investment, operating cost and pollutant emission during operation, the system configuration is to be optimized.
3.1 Optimized Objective Function of the System
To obtain obvious advantages in economy, energy and environment, various factors should be taken into account for optimization of regional integrated energy system. In this paper, the weighted sum of annual total cost saving rate (M1), primary energy saving rate (M2) and environmental pollutant shadow cost saving rate (M3) is taken as the optimized objective function F.
where α, β and γ are weighting coefficients, the sum of which is 1, 0 ≤ α, β, γ ≤ 1.
A high F value means better economic, energy and environmental benefits of integrated energy system than conventional energy system. The widely applied conventional system is gas boiler and electric chiller system. Different values of the weighting coefficients will affect the optimization result. In this paper, the system is optimized under different values, and the effects of weighting coefficients on the optimization result are analyzed.
The calculation methods of M1–M3 are provided below.
3.1.1 Annual Total Cost Saving Rate
The calculation formula of annual total cost (ATC) is given below:
where CC—Annualized investment in system equipment, Yuan; Cf—Annual operating cost of system, Yuan; Cm—Annual maintenance cost of system, Yuan; P—Total investment in equipment, Yuan; i—Annual loan rate, 0.065; n—Service life of system, 20 years; cgas—Unit price of natural gas, Yuan/m³; Vgas—Gas consumption of system, m³; Cel, sell—Grid selling price, Yuan/kW·h; Cel, buy—Grid purchase price, Yuan/kW·h; μ—Proportionality factor, generally 0.03; ACTRx—ATC of CCHP system of gas turbine coupled with GSHP, ACTR0 being ATC of the benchmark system.
3.1.2 Primary Energy Saving Rate
where PEC—Primary energy consumption, KJ; ηHRB, i—Average power supply efficiency of power plant, 0.92; ηe—Transmission efficiency of power grid, 0.35; PECx—PEC of CCHP system of gas turbine coupled with GSHP; PEC0—PEC of the benchmark system.
3.1.3 Environmental Pollutant Shadow Cost Saving Rate
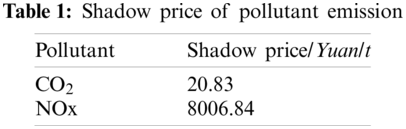
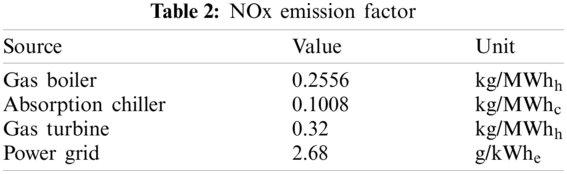
Emission of hazardous substances generated by the system will cause damage to the environment, especially CO2 and NOX. In this paper, emission of two categories of pollutant is calculated, and shadow cost (PSC) is used to quantify economic loss caused by pollutant emission. The calculation method is as follows:
where TC—Shadow cost of CO2 emission, Yuan/t; TN—Shadow cost of NOx emission, Yuan/t; PSCx—PSC of CCHP system of gas turbine coupled with GSHP; PSC0—PSC of the benchmark system [14].
Shadow price of emission of pollutants is listed in Table 1.
CO2 emission of the system includes the emission caused by consumption of natural gas, electricity purchase from the grid and leakage of refrigerant. The calculation formula of CO2 emission is detailed in references [15,16].
NOx emission of various equipment is listed in Table 2.
3.2 Constrain Conditions of Optimization
where Q0, HP, heat—Rated heating power of heat pump, kW; Q0, HP, cool—Rated cooling power of heat pump, kW; Q0, EC—Rated cooling power of electric chiller, kW; P0, GT—Rated power of gas turbine, kW; Q0, AC—Rated power of absorption lithium bromide unit, kW.
To ensure accurate and efficient optimization of the system, the Hooke–Jeeves optimization algorithm, a search pattern method, is used, which can complete search of a group of parameters and make the objective function tend to be minimum without calculation of derivative of the objective function [17,18].
The optimization process of integrated energy system is shown in Fig. 4.
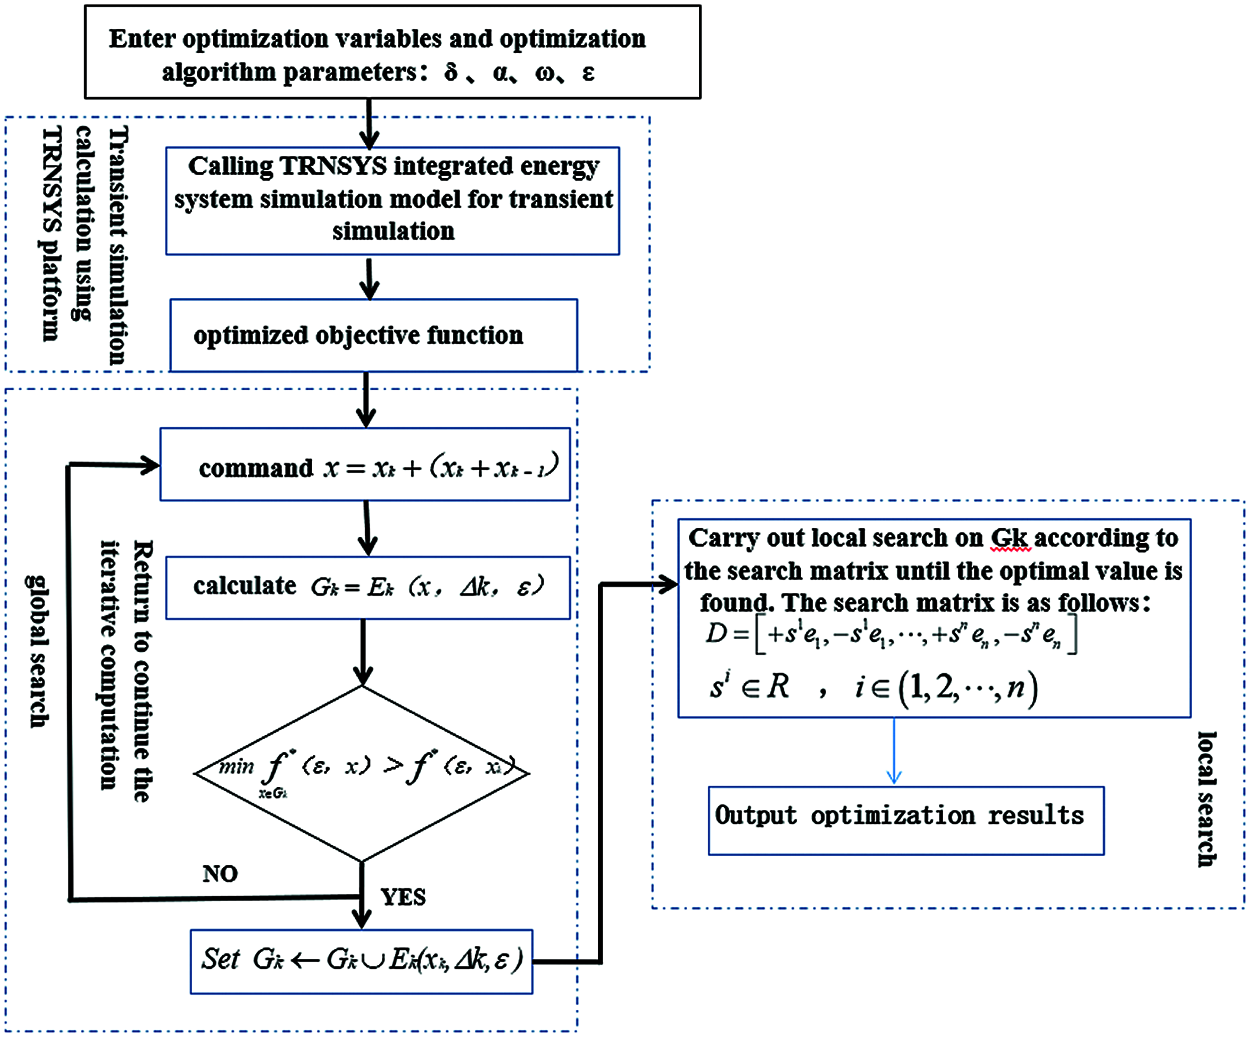
Figure 4: System optimization flow chart
The complex commercial area in Beijing used as an example covers an area of 9600 m2, including air conditioned area 9500 m2, where there are lobby, dining hall, guest rooms, fitness center and other functional zones. The simulated hour cooling/heating load of the building is shown in Fig. 5.
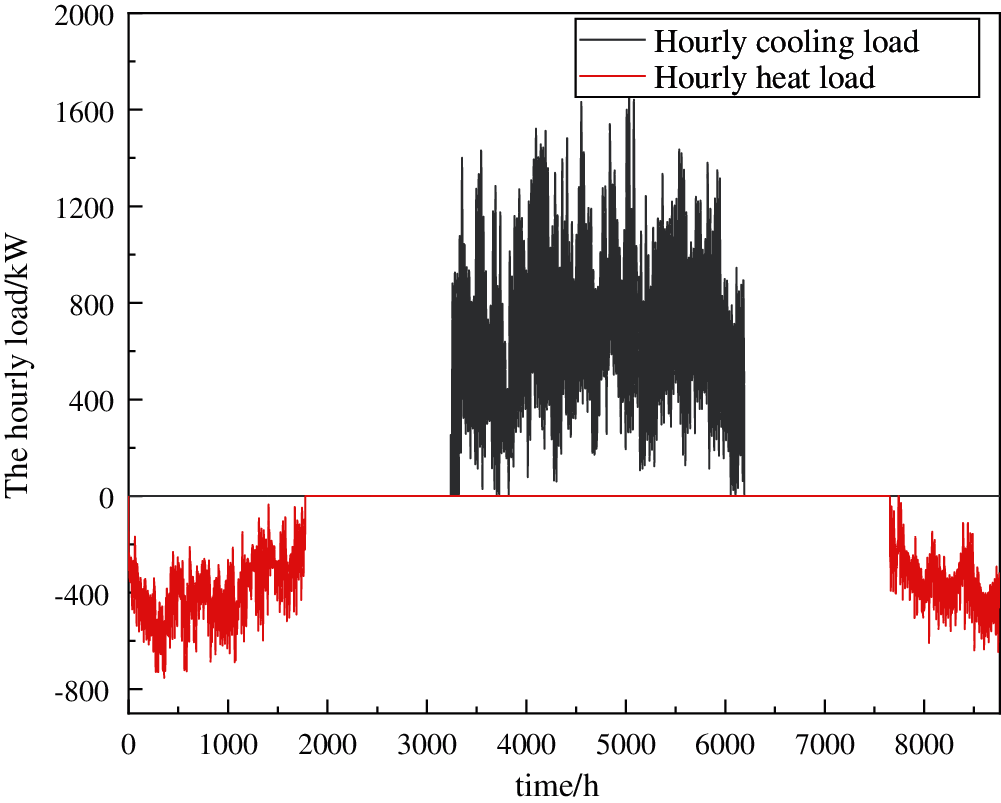
Figure 5: Hourly cold and heat load curve of the building throughout the year
The simulation result shows that hourly heating load peak of the hospital is 753 kW and hourly cooling load peak is 1744 kW. The statistical annual cumulative heating load of the building is 3863 GJ, the statistical annual cumulative cooling load is 7403 GJ.
4.1.1 Natural Gas Price [19]
The price of natural gas for power generation is 2.39 Yuan/m3, and the price of gas for heating and cooling is 2.49 Yuan/m3.
4.1.2 Time-of-Use (TOU) Electricity Price
According to the latest policy, TOU price of non-residential electricity in Beijing is listed in Table 3.
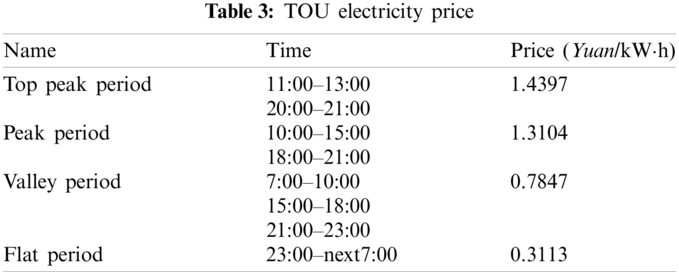
Grid selling price of electricity generated by natural gas is 0.65 Yuan/kW·h [20].
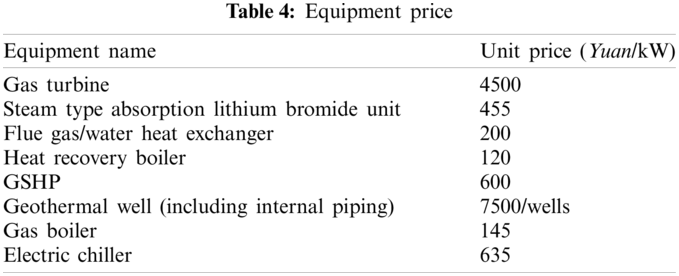
4.1.3 Reference Price of Equipment
Equipment price is an important factor influencing the system investment, which may further affect annual cost of the system. The prices per unit of heat of typical brand equipment related hereto are listed in Table 4. In other projects, prices of equipment may be determined according to actual conditions.
4.2 Simulation and Optimization Results
The selected benchmark system is gas boiler + electric chiller system, efficiency of gas boiler is 0.95 and COP of electric chiller is 3 [21]. Based on cooling and heating loads of the building, the calculated annual power consumption of the distributed system is 685 186 kWh, natural gas consumption is 115356 m³, annual total cost is 997854 Yuan, primary energy consumption is 11800 GJ, and environmental pollutant shadow cost is 36989 Yuan.
Relevant costs and primary energy consumption of the coupled system of different configurations calculated in the TRNSYS model are shown in Fig. 6.
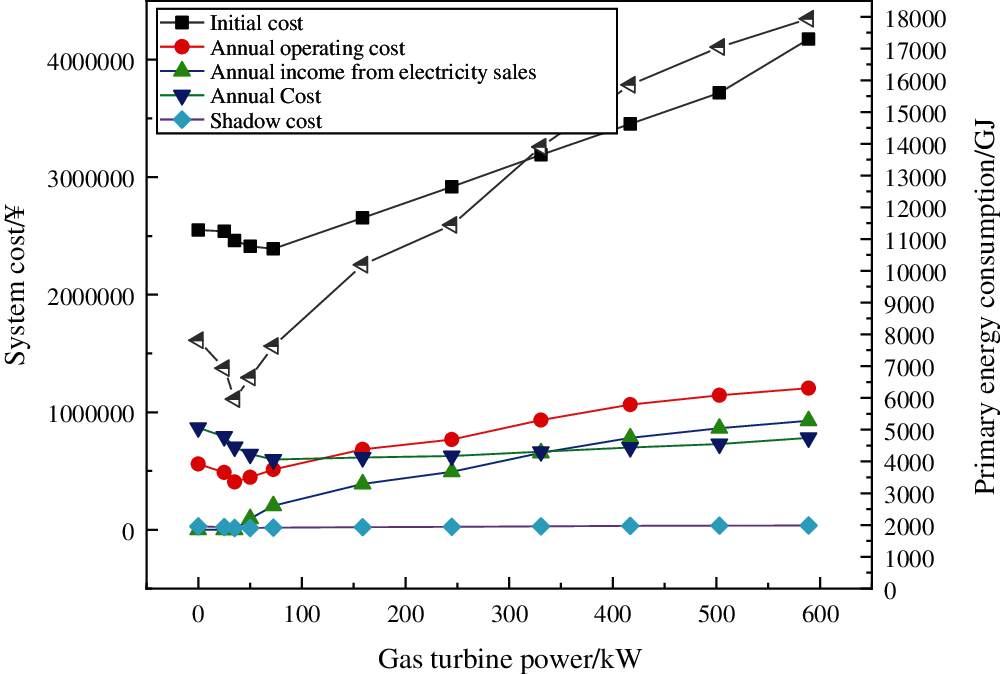
Figure 6: Variation of system cost and energy consumption under different configurations
The objective function can be calculated based on the above data and formulas (6)~(16). A bigger objective function represents more obvious advantages of the coupled system over traditional distributed system. In the optimization process, the value of weighting coefficients represents weight of economy, energy consumption and environment. In practice, the values should be determined according to local policy and other actual conditions. To find out the degree of effect of the above three on the optimization result, different weighting coefficients are used for optimization of the system configuration; the selected ten groups of weighting coefficients are provided in Table 5
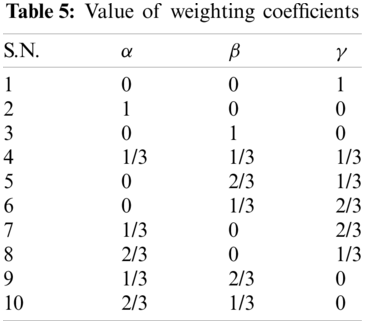
The optimization results under different coefficients are shown in Fig. 7.
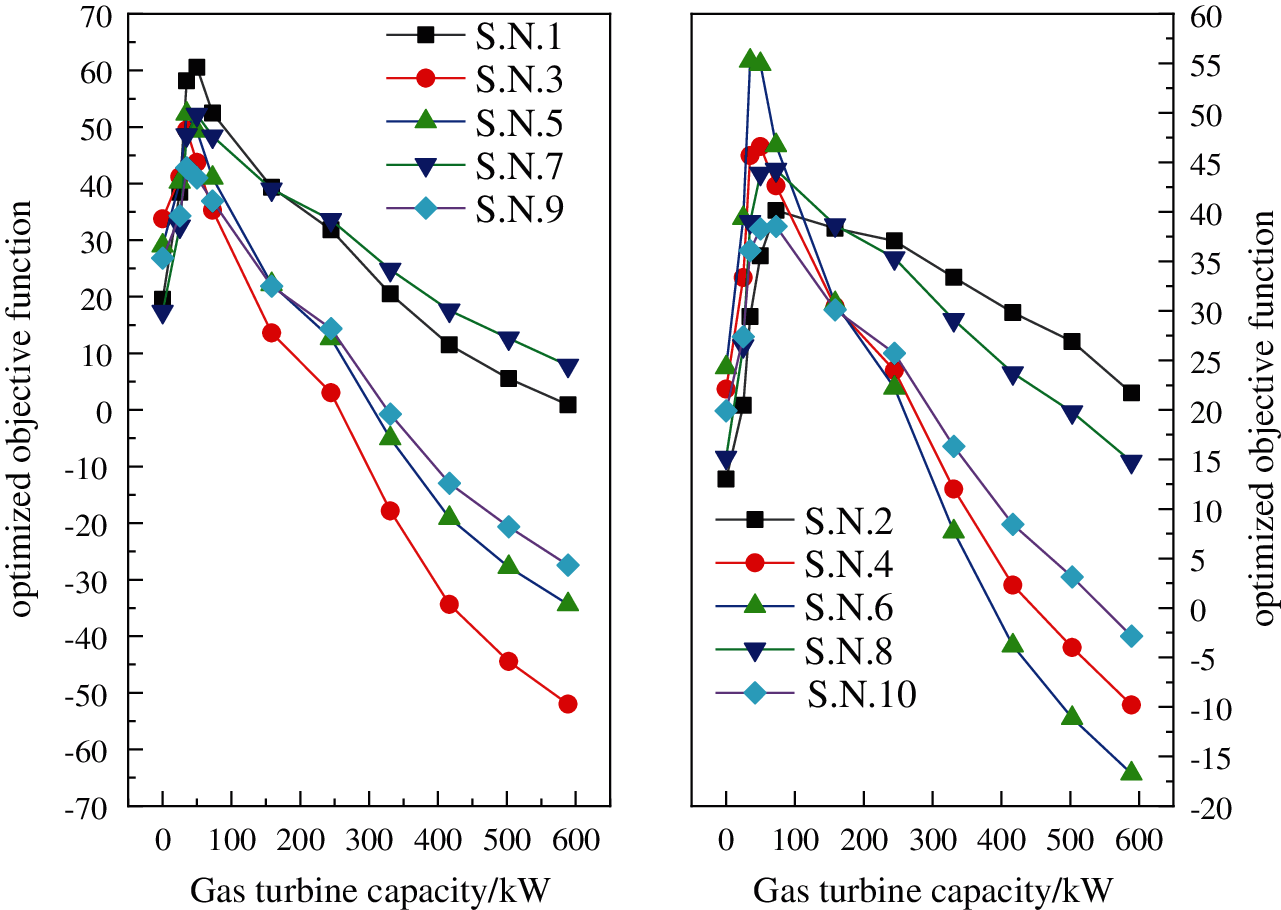
Figure 7: Optimization results under different weighting coefficients
The optimum configuration derived from the ten groups of weighting coefficients is given in Table 6.
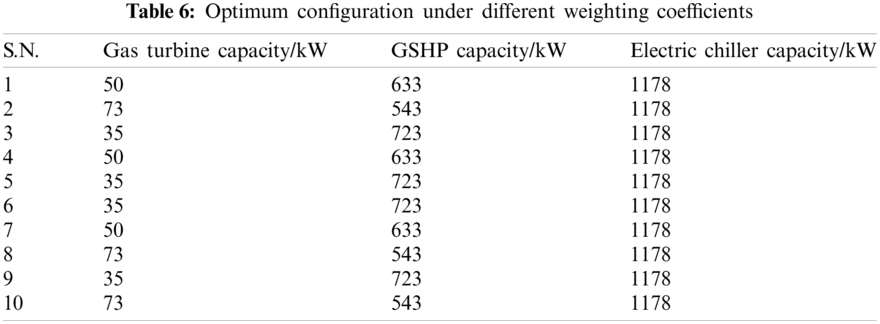
According to the optimization results under different weighting coefficients, the optimum configuration corresponding to S.N. 1, 4 and 7 is defined as optimum condition 1, that corresponding to S.N. 2, 8 and 10 as optimum condition 2, and that corresponding to S.N. 3, 5, 6 and 9 as optimum condition 3. Distribution of cooling and heating loads under the three conditions is shown in Fig. 8.
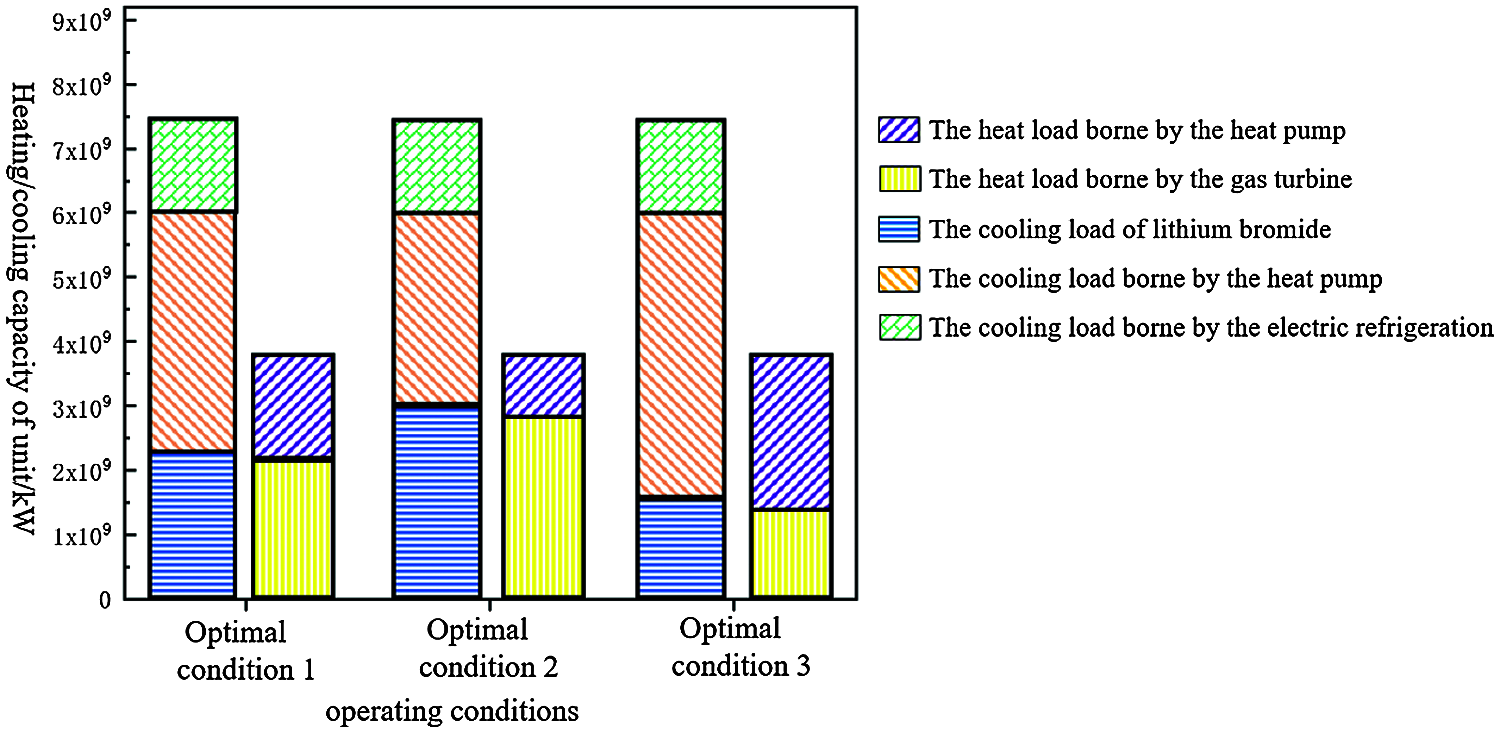
Figure 8: Distribution of cooling and heating loads of the system under the optimum conditions
It can be seen from the optimization results that configuration has significant impact on performance of the coupled system. The system performance increases and then decreases with rise of gas turbine power. Serial Nos. 1–3 in Fig. 8 respectively represent the change curve of the objective function when only the shadow cost of environmental pollutants, the annual cost value and the primary energy consumption are considered. It can be seen that regardless of the configuration of the coupling system, the shadow cost of environmental pollutants and the annual cost value are less than that of the traditional distribution system, so the coupling system has obvious advantages in environmental protection and economy. In terms of time consumption, when the power is less than 250 kW gas turbine, a coupling system energy consumption is less than the supply system, when the gas turbine power greater than 250 kW, with the increase of gas turbine power, energy saving effect of the coupled system compared with points for the system, so in order to ensure the energy saving advantage of coupled systems need to choose the gas turbine power.
The value of weighting coefficients will affect the optimization result. In this case, the optimum power range of gas turbine is 35–75 kW. In comparison with traditional distributed system, the coupled system shows annual total cost saving rate of 35.6%, 40.1% and 29.4%, primary energy saving rate of 43.7%, 35.3% and 49.6% and environmental pollutant shadow cost saving rate of 60.5%, 52.4% and 58.2%, respectively under the three optimum conditions derived hereunder, where gas turbine power 35 kW appears most frequently; this shows that the system has the optimum comprehensive performance under this configuration, when 40% heating load is borne by flue gas waste heat of gas turbine, 21% cooling load by lithium bromide unit, 18.5% cooling load by electric chiller, and the remaining cooling/heating load by GSHP.
This paper proposes a modeling method based on the busbar approach and transient simulation and optimization method based on hourly dynamic balance of supply and demand in annual energy supply cycle. Effectively combined with the energy balance equation established according to the busbar approach and transient simulation of TRNSYS model, this method may realize transient simulation and optimization of regional integrated energy system. The paper states the following conclusions.
(1) Equipment configuration of the coupled system is an important factor influencing the system performance, and optimization of equipment configuration may significantly improve the system performance; from the perspective of economic and environmental benefits, the system performance increases and then decreases with rise of gas turbine power;
(2) Weighted coefficient values will affect the system optimization result, based on this case, the results show that the gas turbine power of 35 kW, soil source heat pump power is 723 kW, 1178 kW electric refrigeration unit is the best configuration of the system. Under the configuration, the system of annual cost saving rate, a energy conservation and environmental pollutants shadow cost savings rates were 29.4%, 49.6% and 58.2%, respectively.
Funding Statement: This research was funded by the Research on Rapid Modeling Methods for Integrated Energy Systems, Grant No. SGTYHT/17-JS-204.
Conflicts of Interest: The authors declare that they have no conflicts of interest to report regarding the present study.
1. Yu, X. D., Xu, X. D., Cheng, S. Y. (2016). A brief review to integrated energy system and energy internet. Transactions of China Electrotechnical Society, 31(1), 1–13. DOI 10.19595/j.cnki.1000-6753.tces.2016.01.002. [Google Scholar] [CrossRef]
2. Zou, C. L., Cui, X., Zhou, B. (2019). Optimal dispatch of combined heat and power system considering flexible load and electric boiler under carbon trading environment. Electrical Measurement & Instrumentation, 56(18), 34–96. DOI 10.19753/j.issn1001-1390.2019.018.005. [Google Scholar] [CrossRef]
3. Geidl, M. (2007). The energy hub-a powerful concept for future energy systems. Proceedings of the Third Annual Carnegie Mellon Conference on the Electricity Industry, pp. 13–14. USA. [Google Scholar]
4. Wang, F., Niu, M., Tong, Y. L. (2010). Application of multi-agent system in energy hub. Power System and Clean Energy, 26(11), 28–32. [Google Scholar]
5. Chen, H. Y., Wen, J. Z., Wang, Z. Y., Yang, X. (2014). Transfer laws and equations of energy networks. Journal of Xi’an Jiaotong University, 48(10), 66–76. DOI 10.7652/Xjtuxb201410011. [Google Scholar] [CrossRef]
6. Wang, C. S., Hong, B. W., Guo, L., Zhang, D. J. (2013). A general modeling method for optimal dispatch of combined cooling, heating and power microgrid. Proceedings of the CSEE, 33(31), 26–36. [Google Scholar]
7. Hong, B. W. (2014). Research on scheduling optimization model and method of micro grid. China: Tianjin University. [Google Scholar]
8. HE, Z. X. (2018). Research on coordinated scheduling method of integrated energy system with multi-energy cooperation. China: Zhejiang University. [Google Scholar]
9. Dong, W. J., Li, J. G., Tian, Z. Q. (2020). Optimal operation method of integrated electric-gas system considering detailed model. Electrical Measurement & Instrumentation, 7, 1–11. [Google Scholar]
10. Wang, Q., Lu, Y. C., Liu, Y. J. X. N., Xu, L. (2020). Investment evaluation method of integrated energy system. Smart Power, 48(6), 20–27. [Google Scholar]
11. Cardona, E., Piacentino, A., Cardona, F. (2006). Matching economical, energetic and environmental benefits: An analysis for hybrid CHCP-heat pump systems. Energy Conversion and Management, 47(20), 3530–3542. DOI 10.1016/j.enconman.2006.02.027. [Google Scholar] [CrossRef]
12. Yan, X. S., Wu, D. (2020). Optimal configuration of CCHP system and performance comparison with traditional cogeneration system. China Measurement & Test, 46(7), 159–168. DOI 10.11857/j.issn1674-5124.2020.020.037. [Google Scholar] [CrossRef]
13. Zhao, T. J., Meng, J., Wang, J. (2020). Optimal allocation strategy of photovoltaic and electric heating thermal storage capacity in interactive mode. Proceedings of the CSU-EPSA, pp. 1–7. China. [Google Scholar]
14. Gao, Y. X. (2012). Study on the external cost of coal power generation in China. China: South China University of Technology. [Google Scholar]
15. Wara, M. W. (2008). Measuring the clean development mechanism's performance and potential. UCLA Law Review, 55(6), pp. 1759. [Google Scholar]
16. Li, M. J. (2015). Research on hybrid based CCHP–GSHP system. China: Huazhong University of Science and Technology. [Google Scholar]
17. Zhou, Q. C., Ju, Y. T., Zhou, C. X. (2015). An effective inverse analysis of cohesive parameters of flexible adhesive joints based on the Hooke-Jeeves algorithm. Engineering Mechanics, 32(4), 1–7. [Google Scholar]
18. Zeng, N. H., Yuan, Y. P., Sun, L. L. (2018). Optimization on air source heat pump assisted solar water heating system based on TRNSYS. Acta Energiae Solaris Sinica, 39(5), 1245–1254. [Google Scholar]
19. National Energy Administration (2018). Notice on adjustment of Beijing non-residential natural gas sales price. Beijing: National Development and Reform Commission. [Google Scholar]
20. National Energy Administration (2014). Notice of Beijing municipal development and reform commission on resolving gas price conflicts in this municipality. Beijing: National Development and Reform Commission. [Google Scholar]
21. Zhou, W. B. (2019). Research on optimal configuration and uncertainty operation of multi-energy collaborative cooling, heating and power system. China: Xi’an University of Architecture and Technology. [Google Scholar]
 | This work is licensed under a Creative Commons Attribution 4.0 International License, which permits unrestricted use, distribution, and reproduction in any medium, provided the original work is properly cited. |