| Energy Engineering |
DOI: 10.32604/ee.2022.016151
ARTICLE
Optimal Decision-Making of Trans-Provincial Electricity Market Subjects with Risks under Renewable Portfolio Standards
School of Economics and Management, Shanghai University of Electric Power, Shanghai, 201306, China
*Corresponding Author: Yishu Chen. Email: chenyishu2021@mail.shiep.edu.cn
Received: 10 February 2021; Accepted: 10 May 2021
Abstract: The randomness and uncertainty of renewable energy generation are expected to significantly change the optimal decision-making of trans-provincial electricity market subjects. Therefore, it is beneficial to optimize the interests of each of these subjects, considering the unpredictable risks of renewable energy under the renewable portfolio standards (RPS) and researching their effects on the optimal decision-making of trans-provincial electricity market multi-subjects. First, we develop a trans-provincial trading market mechanism for renewable energy and clarify the electricity supply and demand relation and the green certificates supply and demand relation of trans-provincial electricity market multi-subjects. Then, under the RPS, we construct a multi-subject game model of the power supply chain that recognizes the risks, and adopt the reverse induction method to discuss the optimum risk-taking judgment of each subject in the trans-provincial electricity market. Finally, we use MATLAB to verify the viability and efficacy of the proposed game model, and obtain a certain reference value for the optimal decision-making of trans-provincial electricity market subjects. In summary, we consider the uncertainty risks of renewable energy under RPS, study the effects of the green certificate price and risk aversion coefficient in the RPS mechanism on the optimal decision-making of trans-provincial electricity market subjects, and obtain the changing trends of two different power products and those of different electricity market subjects under the influence of the green certificate price and risk aversion coefficient, which have a certain reference value for studying the factors affecting the optimal decision-making of trans-provincial electricity market subjects.
Keywords: Renewable portfolio standards; uncertainty risks; CVaR method; trans-provincial electricity market subjects; optimal decision-making
With the implementation of carbon peak and carbon neutral targets and the renewable portfolio standards (RPS), the trading-related decision-making behavior of electricity market subjects is expected to experience significant shifts. The RPS explicitly indicate the obligations of electricity market owners, such as power retailers and power consumers. Trans-provincial power market is a power market based on provinces and regions. In this market, the market subjects of the provincial power market carry out trans- trans-provincial power/electricity trading. In particular, based on China’s underlying realities of the reverse allocation of power load and energy resources [1], the implementation of RPS will directly affect the optimal decision-making of trans-provincial electricity market subjects. In addition to improving the trans-provincial transmission capacity and consumption levels of renewable energy, perfecting the RPS guarantee and consumption mechanism, that is, establishing a complete exchange mechanism for carbon emissions and a green certificate trading market, is of great significance and realistic value for China to achieve the strategic targets of carbon peak by 2030 and carbon neutrality by 2060. However, in the manufacturing process, renewable energy can be easily influenced by man-made and weather conditions, thus making its performance highly random and uncertain. This will affect the transaction process of trans-provincial electricity market subjects, such as power retailers and power consumers, in the power supply chain, and thus, change their transaction decisions. Therefore, discussing and researching the effects of both RPS implementation and uncertainty risks of renewable energy on the transaction decision-making of trans-provincial electricity market subjects will play an important positive role in promoting the development of renewable energy, optimizing energy resource allocation [2], raising the level of trans-provincial renewable energy consumption, and maximizing the interests of electricity market subjects. For the above reasons, we consider the uncertainty risks of renewable energy under RPS, clarify the effects of the green certificate price and risk aversion coefficient in the RPS mechanism on the optimal decision-making of trans-provincial electricity market subjects, further propose the optimal trading decision-making of multi-subjects in the trans-provincial electricity market.
2.1 Research Status of RPS Mechanism Design and Implementation Effect
2.1.1 Design Aspects of RPS Mechanism
RPS, which originated in California, USA, have increasingly become an efficient strategy adopted by nations globally for a robust production of renewable energy. The continuous development of RPS policy functions has been enhancing the production of renewable energy [3] and plays a crucial role in supporting its consumption level. Thus, countries worldwide should continue to develop design functions of RPS and its supporting mechanisms. Given the development background of RPS, to take complete advantage of the positive effect of RPS on renewable energy in the electricity market, China combined its own policy priorities and the existing requirements of each province to devise an electricity market trading system based on RPS [4] and formulated a scheme of distributing RPS indicators in various provinces [5]. A green certificate restores the power and social characteristics of renewable energy, which means that it possesses both electricity value and environmental benefits and can effectively distinguish between renewable and conventional energies. Dong et al. [6] developed a matching green certificate transaction mechanism for the electricity market, which can effectively promote the consumption level of renewable energy. Kim et al. [7] developed technology-specific tools for reserved targets and REC multipliers, which can effectively increase the diversity and versatility of renewable energy sources. The abovementioned studies conducted research and analysis from the perspective of RPS mechanism design, which laid the foundation for a smooth implementation of RPS and promoted the continuous development of renewable energy and an optimal allocation of national resources.
2.1.2 RPS Implementation Effect
To analyze the implementation effect of the RPS mechanism, some previous studies [8–10] analyzed the interaction between the TGC and electricity markets and the incentive effect of the RPS mechanism on TGC, by using a system dynamics model. In addition, some studies [11,12] analyzed the effect of TGC price on electricity market subjects, such as renewable and conventional energy companies, based on the RPS mechanism. Through an empirical analysis of the RPS mechanism, an effective consumption of renewable energy under the RPS mechanism can be promoted. Furthermore, some scholars have presented research results on other policies and institutional supervision. For example, Dong et al. [13] verified that the incremental electricity price supplement policy positively affects RPS implementation. Shayegh et al. [14] indicated that the RPS policy subsidy requirements are affected by whether or not the RPS policy is subjected to market supervision. Zhu et al. [15] and Fang et al. [16] constructed a game model between regulatory agencies and various electricity market subjects, and analyzed the effect of the RPS mechanism on electricity market subjects. With the implementation and promotion of the ET mechanism, the dual role of the RPS and ET mechanisms on electricity market subjects was analyzed [17–19]. In addition, some detailed studies have been conducted on the transition of the FIT mechanism to RPS mechanism. Jiang et al. [20] comparatively analyzed the implementation of the FIT and RPS mechanisms, and reviewed, in detail, the effect of the RPS mechanism on the behavior of electricity market subjects. Cai et al. [21] and Wang et al. [22] identified the optimal combination ratio of the TIP–RPS joint mechanism, which is conducive to promoting the consumption of renewable energy and enhancing social welfare. Zhao et al. [23] and Hao et al. [24] comparatively analyzed the effects of RPS, FIT, and their combination on renewable energy. Ritzenhofen et al. [25] further studied the effectiveness of RPS, FIT, and MP mechanisms and their effects on the electricity market. Some in-depth research has been conducted on the reward and punishment mechanism. Xin [26] analyzed the effects of the static and dynamic reward and punishment mechanisms on RPS policy implementation. Meanwhile, Zhao et al. [27] and Zuo et al. [28] analyzed the effect of unit fines on electricity market subjects. The abovementioned studies mainly analyzed the impact of implementing RPS and its supporting mechanisms on electricity market subjects. A smooth implementation of the RPS mechanism is expected to effect electricity market subjects, especially in terms of optimal decision-making for trans-provincial electricity market subjects. However, the studies conducted so far have not yet considered the effect of uncertainty of renewable energy output on trans-provincial electricity market subjects. Thus, this paper discusses how the decision-making behaviors of trans-provincial electricity market subjects should be changed in the presence of uncertainty risks.
2.2 Research Status Based on RPS with Uncertainty Risks
In terms of uncertainty risks, the RPS mechanism faces higher market risk than the FIT mechanism [29]. Guo et al. [30] used the CVaR method to measure the risks of price fluctuations and constructed a two-stage risk scheduling model for day-ahead and real-time markets. Considering the price factor of renewable energy, Zhang et al. [31] constructed a two-stage stochastic economic dispatch model. Yang et al. [32] used the CVaR method to analyze the effects of risk preference and price fluctuations on the benefits and risk loss of power retailers. Guo et al. [33] and Hou et al. [34] adopted the CVaR method to consider the uncertainty of renewable energy and load, and constructed a two-layer nonlinear optimization model. Guo et al. [35] used a multiscenario method to consider the uncertainty of the renewable energy output, and built a day-ahead and real-time, two-stage market equilibrium model. Based on the abovementioned literature, Li et al. [36] and Chen et al. [37] adopted the CVaR method to consider both uncertainty of demand-side resources and risks of market price fluctuations. Aiming at evaluating the uncertainty of income, Liu et al. [38] adopted the VaR method to measure the benefit risk and developed a power optimization decision model based on medium- and long-term plans. However, the VaR method cannot appropriately measure all risk situations. Considering the volatility of unit renewable energy consumption settlement, Li et al. [39] constructed a time-varying settlement optimization model for renewable energy consumption. Jiang et al. [40] adopted the behavioral portfolio theory to consider the risks and risk-free strategies of power retailers. Some studies have also considered power producer [41] and political [42] uncertainties. Compared with the above risks, Ji et al. [43] constructed a two-stage planning model with explicit risk intervals by considering numerous uncertainty factors. The abovementioned studies mainly analyzed the effects of uncertainties related to price fluctuations, load, and benefits on various electricity market subjects from the perspective of measuring risk objects. The trans-provincial electricity market subjects in the power supply chain have not been studied so far. Moreover, the effects of RPS and uncertainty risks on the decision-making behaviors of trans-provincial electricity market subjects have not been discussed. This issue will be comprehensively addressed in the present study.
2.3 Research Status of Optimal Decision-Making of Trans-Provincial Electricity Market Subjects Ba- sed on RPS
In terms of optimal decision-making of electricity market subjects, Zhu et al. [44] established an electricity market equilibrium model based on the combined FIT–RPS mechanism, which can effectively improve the total efficiency of the electricity market and balance the equilibrium effect of electricity price fluctuations. Lin et al. [45] established a two-tier optimization model of renewable and conventional energies in day-ahead and real-time markets, and determined that RPS can affect the supply and demand relation of GTC; thus, the GTC price affects the equilibrium solution of the electricity market. Wang et al. [46] considered two factors, RPS and consumer preference, and constructed an optimal decision-making model for the following three main electricity market subjects: power consumers, power retailers, and power generation companies. Wang et al. [47] innovatively introduced power insurance, accounted for the uncertainty of the renewable energy output, and built an optimal decision-making model of electricity market subjects for bundled and nonbundled energies. Productive power insurance is important for electricity market subjects. It has a positive effect on them, stimulates the power generation companies’ production, saves the cost of power retailers, and motivates the electricity market subjects to implement the RPS, which lays the foundation for our study on trans-provincial electricity market subjects’ optimal decision-making. The above literature mainly analyzed the effects of various factors on electricity market subjects’ optimal decision-making. However, they neither considered the risk factors resulting from the randomness and volatility of renewable energy output on the power generation side nor their effects on trans-provincial electricity market multi-subjects. Moreover, in terms of trans-provincial transactions [48–50], considering the uncertainty risks of renewable energy under the RPS mechanism, only a few studies have been conducted on the optimal decision-making of trans-provincial electricity market multi-subjects. To promote the national optimal allocation of renewable energy, Wang et al. [51] established a cross-regional coordinated and optimized power transmission plan model, which improved the cross-regional consumption capacity of wind power, reduced the economic operation cost of the power grid, and fully took advantage of the complementarity of load characteristics and the mutual benefit of wind power supply structure across regions. To solve the challenges brought by the volatility and intermittency of wind power to the security of the power grid, Niu et al. [52] analyzed the capacity of cross-regional wind power consumption and put forward some suggestions and related measures on the capacity of cross-regional wind power consumption. To solve the adverse effects of the cross-regional direct current delivery mode, Han et al. [53] proposed a two-phase day-ahead power generation plan that was coordinated and optimized across regions, which greatly promoted the effective consumption of conventional energy and renewable energy. Xu et al. [54] first constructed a DC link power stepped operation model, and then considered the complementarity of the load characteristics and the capacity of renewable energy consumption, and finally realized the coordinated operation of both sides of supply and demand, which promoted the effective consumption of renewable energy.
Moreover, there are also studies on optimization decision-making models in other fields. Salehizadeh et al. [55] provided a combination of a leader–follower game theoretical mechanism and multiattribute decision-making for the operator to choose his best strategy by considering congestion-driven and environmental attributes. Soltaniyan et al. [56] developed a combination of multi-criteria decision-making approach and multi-agent modelling technique to obtain the maximum possible profits for an intended renewable generation plan and also direct the investment to be located in a way to improve electricity market indices besides supporting renewable energy promotion. Salehizadeh et al. [57] proposed fuzzy Q-learning approach for hour-ahead electricity market modeling in presence of renewable resources. Simulation results indicate that the proposed approach is able to model electricity market for a range of continuous multidimensional renewable power penetration in considerably less iterations compared with Q-learning approach. Kiannejad et al. [58] proposes a novel approach for modeling and revealing the competitors’ behavior from perspective of an intended player (IP). Kiannejad et al. [59] proposed a two-stage artificial neural network based adaptive bidding strategy pro-cedure for an LA by revealing, modelling, and predicting the aggregative behaviour of the competitors in an hourly electricity market. Additionally, this paper develops the concept of decentralized equivalent rival whose behaviour in the electricity market reflects the aggregation of behaviours of all individual competitors.
2.4 Research Status of the Green Certificates
With the promulgation and implementation of the green certificate policy, Peng et al. [60] designed a coordination and equilibrium mechanism between the national green certificate trading market and the provincial day-ahead power market, established a green certificate issuance evaluation system based on the entropy method, and constructed the clearing model of the provincial day-ahead power market and the clearing model of the national green certificate trading market. The results of the calculation example verify the feasibility and effectiveness of the mechanism in this paper. To maximize the benefits of integrated energy generators, including thermal power and wind power, Zhou et al. [61] constructed a joint optimization model of the day-ahead market and the green certificate market, in which generators participate in the bidding, and established a node-based electricity price model minimizing the cost of transmission congestion for the problem of transmission congestion. Results show the accuracy and rationality of this model and method. To stimulate the enthusiasm of auxiliary service providers, Liu et al. [62] proposed a green certificate calculation method based on the deviation theory of the forecast curve in view of the unfairness of the cost allocation of auxiliary services and designed a quantitative allocation method of green certificates for frequency modulation auxiliary services. The method promotes the fair development of the ancillary service market. With the continuous development of blockchain technology, some scholars have conducted exploratory research on blockchain technology in the green certificate and electricity markets. Cai et al. [63] indicated that green certificates can effectively alleviate the financial subsidies for renewable energy through the market, proposed a bilateral trading mechanism for green certificates, and designed the full life cycle of green certificate circulation. To solve the problem of consistency and security of the green certificate data ledger, a green certificate trading platform based on Hyperledger Fabric 1.1 was built and the feasibility and practicality of the platform were verified. To further alleviate the pressure of government financial subsidies for renewable energy, Luo et al. [64] constructed an integrated energy system model for cross-chain transactions of green certificates and designed the cross-chain transaction structure and transaction process of green certificates based on blockchain technology, breaking the barriers between data and value in the traditional green certificate market. Results show that cross-chain transactions of green certificates improve the transaction efficiency and openness of the green certificate market, reduce the operating costs of the integrated energy system, and greatly promote the effective consumption of renewable energy. In addition, Qu et al. [65] constructed a medium- and long-term secondary trading model for green certificates and used Lagrangian dual relaxation method to decouple the uncertainty scenarios. Results show that the secondary trading of green certificates effectively promotes the development of renewable energy and the implementation of the green certificate policy. Abovementioned studies have performed a detailed analysis from the issuance and implementation of the green certificates to the issuance evaluation, and then to the impact of the green certificates on the participation enthusiasm and profit maximization of the transaction subjects. The green certificate market transaction is performed rationally and effectively, which has a positive role in promoting the effective consumption of renewable energy. However, abovementioned studies have not considered the uncertainty of renewable energy and its effect on the optimal decision-making of trans-provincial electricity market multi-subjects. Therefore, under the effect of the risk factors of renewable energy, considering the effect of green certificate price on the optimal decision-making of trans-provincial electricity market multi-subjects will have important practical significance.
In summary, considering the unpredictable uncertainties of renewable energy and evaluating their effects on trans-provincial electricity market multi-subjects’ optimal decision-making, this study constructs an optimal decision-making model for these subjects both at risks and under RPS. First, this paper introduces, in detail, the trans-provincial trading market framework for renewable energy and clarifies the electricity supply and demand relation and the green certificates supply and demand relation of trans-provincial electricity market multi-subjects. Then, a multi-subject power supply chain game model, which accounts for the RPS with risks, is developed on the basis of the abovementioned trading market framework, and the utility function of power consumers and profit function of electricity market subjects are analyzed. Next, this paper uses the reverse induction method to address the optimal decision-making of trans-provincial electricity market subjects under the RPS with risks. Finally, the paper determines the variables that affect the optimal decision-making of trans-provincial electricity market subjects and the risk indicators.
3 Trans-Provincial Market Framework for Renewable Energy
RPS implementation plays an important and constructive role in achieving sustainable and green energy. It supports the transition of conventional energy to green energy and promotes optimization of the allotment of renewable energy in China. As shown in Fig. 1, a renewable energy power generation company, which sends renewable energy to the receiving province, sells bundled renewable energy (i.e., a green certificate is attached to each unit of electricity). The power retailers are required to sign a medium- and long-term conventional energy power purchase agreement with the conventional energy power generation company. The power retailers can purchase two power products—bundled renewable energy and nonbundled energy (i.e., combine a green certificate from the green certificate market with conventional energy power)—in the electricity market. In this market, to meet the RPS quota requirements, power retailers and consumers complete the RPS quota by purchasing the two power products. In the green certificate market, the power retailers and consumers who have surpassed the RPS quota requirements can sell the over-green certificates, whereas those who have not completed the RPS quota requirements can obtain green certificates from the green certificate market to satisfy the RPS quota requirements of the province. Finally, the power retailers sell two types of power products—bundled renewable energy and nonbundled energy—to help power consumers in meeting the power requirements and the demand for green certificates.
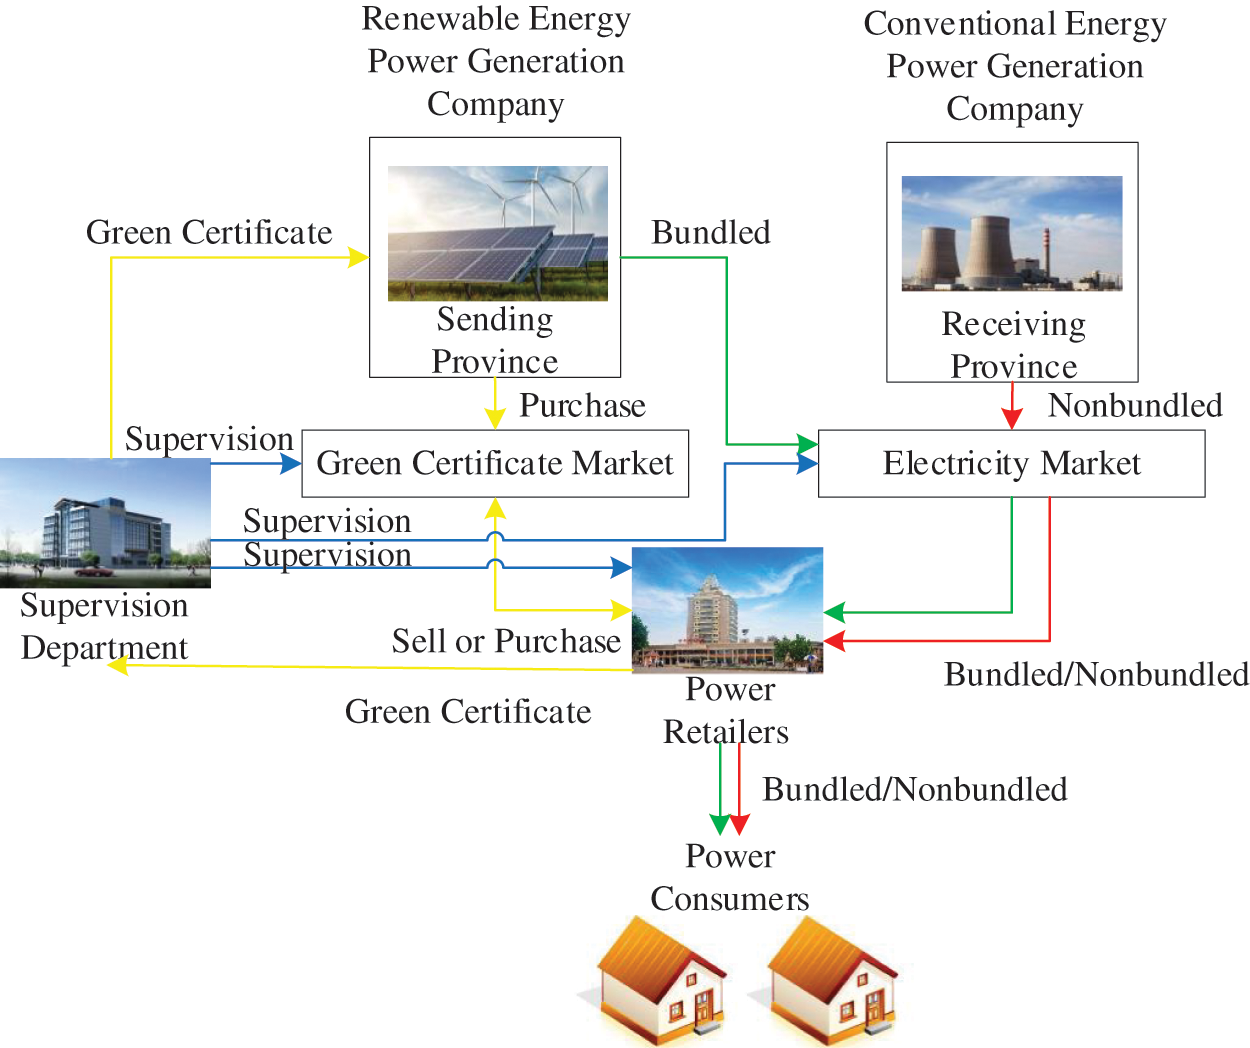
Figure 1: Trans-provincial trading market framework for renewable energy under RPS
4 Multi-Subjects’ Power Supply Chain Game Model under RPS with Risks
To alleviate the pressure of the China’s financial subsidies for renewable energy, the green certificate, as the only certificate of non-aqueous renewable energy consumption, reflects the green power attributes of the generated electricity, and plays an important role in trans-provincial market transactions. In addition, the implementation of excess consumption transactions has increased the market activity for voluntary subscription of green certificates. Electricity market subjects purchase and sell green certificates to meet the requirements of their provinces. Therefore, setting the price of green certificates reasonably and researching its effect on the optimal decision-making of trans-provincial electricity market multi-subjects can effectively promote the transaction of green certificates and the trans-provincial market transactions of renewable energy.
4.1 Utility Function of Power Consumers
The renewable energy power is influenced by man-made and weather conditions, and has a high degree of randomness and uncertainty [66]. To investigate the effect of uncertainty of renewable energy on electricity market subjects, this paper introduces random variables x1 and x2, where the cumulative distribution function of random variables either follow a single distribution, such as normal or uniform distribution, or follow a mixed distribution (i.e., the superposition of several single distributions). This paper assumes that x1 and x2 ∈ [0,1] are non-negative, continuous random variables and separately and uniformly distributed, denoting F(0) = 0, F(1) = 1, and E(x) = μ. In this paper, the utility function is used to represent the satisfaction degree of power consumers for purchasing bundled renewable energy and nonbundled energy. Generally, the better the utility function, the more pleased are the power consumers with this mix. According to [67], the utility function of power consumers can be expressed as follows:
where u1 and u2 indicate the utility functions of power consumers purchasing bundled renewable energy and nonbundled energy, respectively; p1 and p2 indicate their retail prices; q1 and q2 represent the amounts of contract electricity of these consumers; λ1 and λ2 are their environmental preference coefficients; Q1, and Q2 represent the amounts of actual electricity of these consumers; a1 and b1 represent the correlation coefficients between the utility function of power consumers and the amount of contract electricity of power consumers purchasing bundled renewable energy, respectively; and a2 and b2 represent the correlation coefficients between the utility function of power consumers and the amount of contract electricity of power consumers purchasing nonbundled energy, respectively. This paper assumes that the power consumers’ utility ui and contract electricity qi are quadratic nonlinear functions [46], where aiqix and piqixi are both random terms. For the first term aiqixi, the symmetry axis of the quadratic nonlinear utility function qi = aixi/bi is also a random term, that is, the qi corresponding to the maximum value changes with a change in the random variable xi. For the second term piqixi, the relation between the utility function ui and actual electricity qixi can also be regarded as that between the utility function ui and actual retail price pixi. To truly reflect the externality of renewable energy, that is, the environmental benefits of reducing carbon dioxide emissions, this paper introduces the environmental benefit function of renewable energy e(qi) = θiqipc, where pc is the carbon trading price in the provincial carbon trading market, and θ1 and θ2 are the carbon emission coefficients of power consumers purchasing bundled renewable energy and nonbundled energy, respectively. The total utility function of power consumers is expressed as
In addition to considering the quantity of electricity and the price and external attractiveness of renewable energy, as power consumers choose between bundled renewable energy and nonbundled energy, we also account for the risk of power consumer utility. Due to the uncertain factors of renewable energy, the utility function of power consumers will also have randomness and uncertainty. To ensure the satisfaction of power consumers, this paper adopts the CVaR method, which considers all unfavorable situations below the quantile point and can more accurately and effectively measure the risks [68]. According to the basic definition of CVaR [47], the utility risk objective function of power consumers can be expressed as
where η represents the risk aversion coefficient of power consumers. In general, η ∈ (0,1). The closer the value of η is to 0, the more the power consumers are afraid of the risks. Conversely, when the value of η is 1, they are not worried about risks at all. v represents the ηth quantile of the random variable xi in the total utility function. Considering the constraints (29) and (30), q2x2 = qload − q1x1 and q2 = q∑ − q1 are substituted into the above expression to simplify and facilitate the discussion and analysis:
Let
where [φ(x1,v)]+ means max{φ(x1,v), 0}, that is, the function φ(x1,v) satisfies a set of values greater than 0. For the above expression, we need to classify and discuss the positive and negative conditions of the integrand function:
① When
② When
③ When
let
1) When v = −φ(0, 0), we obtain
2) When v = −φ(1, 0), we obtain
Therefore, let
that is,
4.2 Profits of Power Retailers
Power retailers, as an intermediate primary component in the power supply chain, must comply with not only the provincial RPS quota requirements but also the green certificates requirements of provincial power consumers. In the electricity market, when a power retailer chooses two power products, bundled renewable energy and nonbundled energy, if it merely purchases bundled renewable energy power products, its RPS quota requirements or green certificates requirements cannot be satisfied. In contrast, nonbundled energy expands the diversity and flexibility of the purchase and sale strategies of power retailers.
4.2.1 Profits of Bundled Renewable Energy
For bundled renewable energy, power retailers directly purchase renewable energy and the corresponding green certificates, where the profit function of bundled renewable energy can be expressed as follows:
where
The expected profit function of bundled renewable energy can be expressed as
where
4.2.2 Profits of Nonbundled Energy
For nonbundled energy, power retailers purchase conventional energy and green certificates, where the profit function of nonbundled energy can be expressed as
where
The expected profit function of nonbundled energy can be expressed as
where
4.2.3 Total Expected Profits of Power Retailers
The total expected profit function of power retailers can be expressed as
4.3 Profits of Renewable Energy Power Generation Companies
A renewable energy power generation company directly produces renewable energy along with the corresponding green certificates. The profit function of these companies can be expressed as follows:
where
The expected profit function of these companies can be expressed as
where
4.4 Profits of Conventional Energy Power Generation Companies
The conventional energy power generation companies directly sell conventional power, and their profit function can be expressed as
where
The expected profit function of conventional energy power generation companies can be expressed as
where
The game model must meet the following constraints. The total actual electricity must be equal to the total load, as expressed in (29); the total contract electricity must be equal to the planned total electricity, as expressed in (30); the green certificate price must be priced within a range to avoid generating greater risks in the electricity market, as expressed in (31); the derivative of the utility function of power consumers is a constraint of quantity and price, as expressed in (32); and the trans-provincial tie lines must meet their own physical characteristics, as expressed in (33).
where qload represents the total actual load of the power consumers; qsum represents the total contract electricity of the power consumers; pRPS.min and pRPS.max represent the lower and upper limits of the green certificate price; α and β represent the correlation coefficient of the power and the price; and
5 Optimal Decision-Making of Trans-Provincial Electricity Market Subjects under RPS with Risks
5.1 Method of Solving the Optimal Decision-Making
The main idea of the reverse induction method is “Looking Forward, Reasoning Backward”, i.e., considering all subsequent decision-making behaviors that may be caused by decision-making behaviors, and subsequent decision-making behaviors of subsequent decision-making behaviors, until the end of the game; then, starting from the last step, and reversing to find the optimal strategy for each step, which has been widely used in solving dynamic games. In the power supply chain presented in this paper, the upstream and downstream players of the electricity market are part of a game. The mathematical model of the power supply chain game is shown in Eq. (34).
The upstream and downstream game relationship can be briefly described as: Firstly, the power consumers consider the uncertainty of renewable energy to maximize the utility. We can obtain the optimal contract electricity of the power consumers. Secondly, the power retailers determine the retail price with the maximum profits of power retailers as the objective function. We can obtain the optimal retail prices of the power retailers. And they are substituted into the above expression of the optimal contract electricity of the power consumers. Thirdly, the sending provincial renewable energy power generation company and the receiving provincial conventional energy power generation company determine their respective wholesale prices with the maximum profits as the objective function. We can obtain the optimal wholesale prices of the power retailers. And they are substituted into the above expression of the optimal contract electricity of the power consumers and the optimal retail prices of the power retailers. The specific solution process is shown in Appendix A.
5.2 Analytic Solutions of the Optimal Decision-Making
In this paper, the reverse induction method [46] is used to address the above power supply chain game mode, as shown in Appendix A, where the optimal decision-making is expressed as
where
where
To better verify the viability and efficacy of the above game model, this paper uses MATALB to numerically analyze its equilibrium analytical expression, as well as the RPS variables that affect the optimal decision-making of electricity market subjects and risk indicators. We assume that this electricity market comprises a renewable energy power generation company in the sending province, a conventional energy power generation company in the receiving province, a power retailer, and a power consumer. The basic parameters are set as follows [46,47]: a1 = 0.550586; a2 = 0.453246; b1 = 0.000707; b2 = 0.001774; λ1 = 0.8; λ2 = 0.2; θ1 = 0.92; θ2 = 0; pc = 42.58 $/MWh; Cq = 100 $/MWh; and qsum = 10000 MWh.
6.2 Analysis of Transaction Results of Electricity Market Subjects under Different Indicators
6.2.1 Analysis of Transaction Results under Risk Aversion Coefficient and Environmental Preference Coefficient
Fig. 2 shows that the wholesale price of bundled renewable energy is positively correlated with the environmental preference coefficient, and the wholesale price of nonbundled energy is negatively correlated with the environmental preference coefficient. This is attributed to, as power consumers’ environmental consciousness increases, the larger environmental preference coefficient, the more power consumers tend to purchase bundled renewable energy, and the wholesale price of bundled renewable energy will also increase appropriately, but not significantly. The wholesale price of bundled renewable energy is negatively correlated with the risk aversion coefficient, and the wholesale price of nonbundled energy has a relatively complicated relationship with the risk aversion coefficient. When the environmental preference coefficient is greater than 0.1, the wholesale price of nonbundled energy is negatively correlated with the risk aversion coefficient. When the environmental preference coefficient is less than 0.1, the wholesale price of nonbundled energy is positively correlated with the risk aversion coefficient. This is attributed to, as the environmental preference coefficient is small, the risk aversion coefficient plays a leading role and has a greater impact on the wholesale price of nonbundled energy. In addition, the risk aversion coefficient has a far greater impact on bundled renewable energy than it has on nonbundled energy. This is attributed to the smaller the risk aversion coefficient is, the more power consumers are afraid of risks and reduce the purchase of bundled renewable energy. According to the supply and demand of power products, the wholesale price of power products will increase more than that of nonbundled energy.
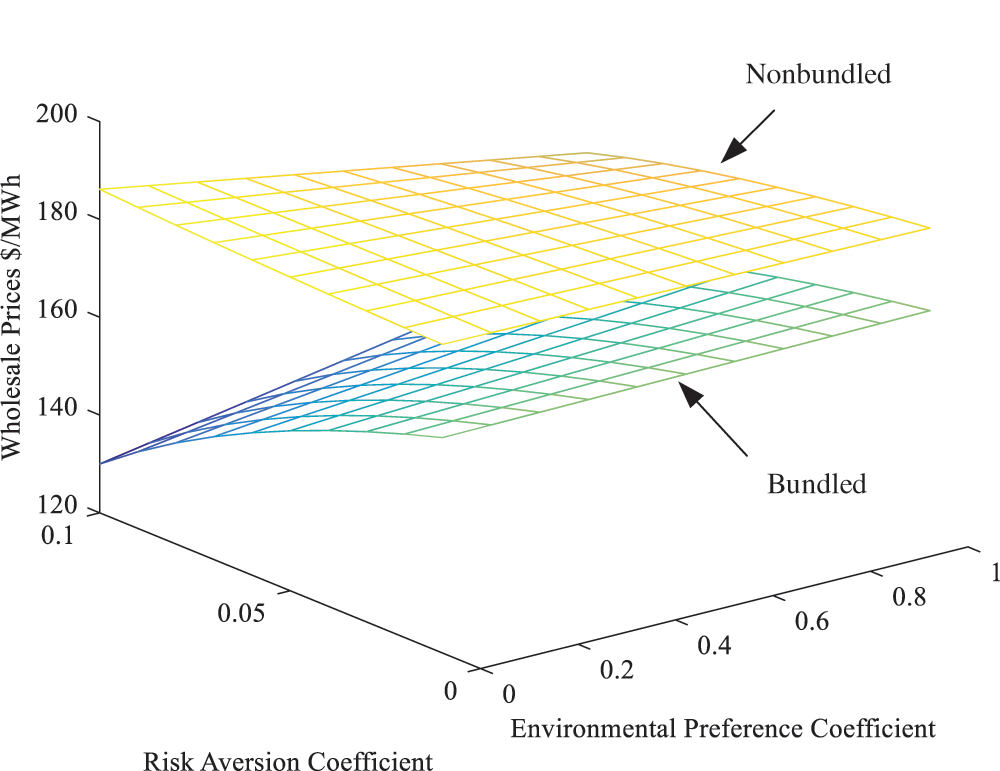
Figure 2: Wholesale prices under the influence of risk aversion coefficient and environmental preference coefficient
Fig.3 shows that the retail price of bundled renewable energy is positively correlated with the environmental preference coefficient, and the retail price of nonbundled energy is negatively correlated with the environmental preference coefficient. This is attributed to the increase in the wholesale price, which is transmitted along the power supply chain and to the receiving end, will also cause an increase in the retail price, but not significantly. The retail price of bundled renewable energy is negatively correlated with the risk aversion coefficient, while the relationship between the retail price of nonbundled energy and the risk aversion coefficient is relatively complicated. When the environmental preference coefficient is greater than 0.4, the retail price of nonbundled energy is negatively correlated with the risk aversion coefficient. When the environmental preference coefficient is less than 0.4, the retail price of nonbundled energy is positively correlated with the risk aversion coefficient. This is attributed to, as the environmental preference coefficient is small, the risk aversion coefficient plays a leading role and has a greater impact on the retail price of nonbundled energy.
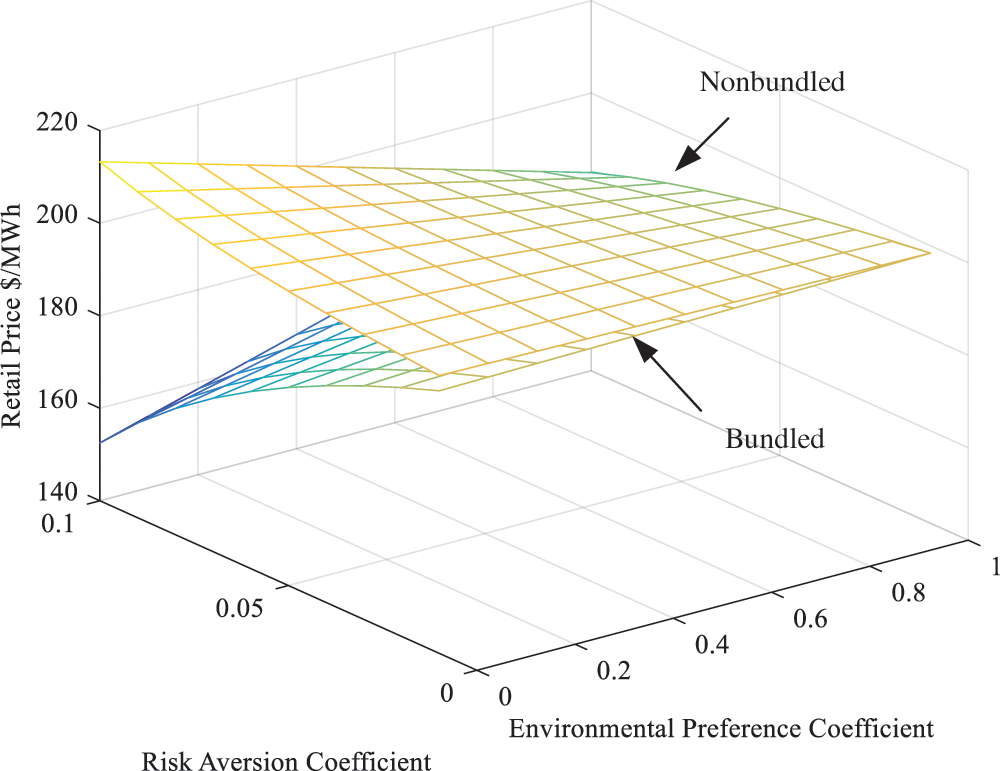
Figure 3: Retail prices under the influence of risk aversion coefficient and environmental preference coefficient
Fig. 4 shows that with the increase of the environmental preference coefficient, the transaction power of bundled renewable energy continues to increase. On the contrary, the transaction power of nonbundled renewable energy continues to decrease. This is attributed to the increment of the power consumers’ environmental consciousness. The larger the environmental preference coefficient, the more power consumers tend to purchase bundled renewable energy. In addition, the sum of the two power products is a fixed value, the demand for one power product increases, while that for the other inevitably decreases. As the risk aversion coefficient increases, the transaction power of bundled renewable energy continues to decrease. On the contrary, the transaction power of nonbundled renewable energy continues to increase. This is attributed to the impact of wholesale price and retail price is far greater than that of the risk aversion coefficient. And the wholesale price and retail price of bundled renewable energy are lower than those of nonbundled energy. Power consumers and retailers will be more inclined to purchase bundled renewable energy to reduce the purchase cost.
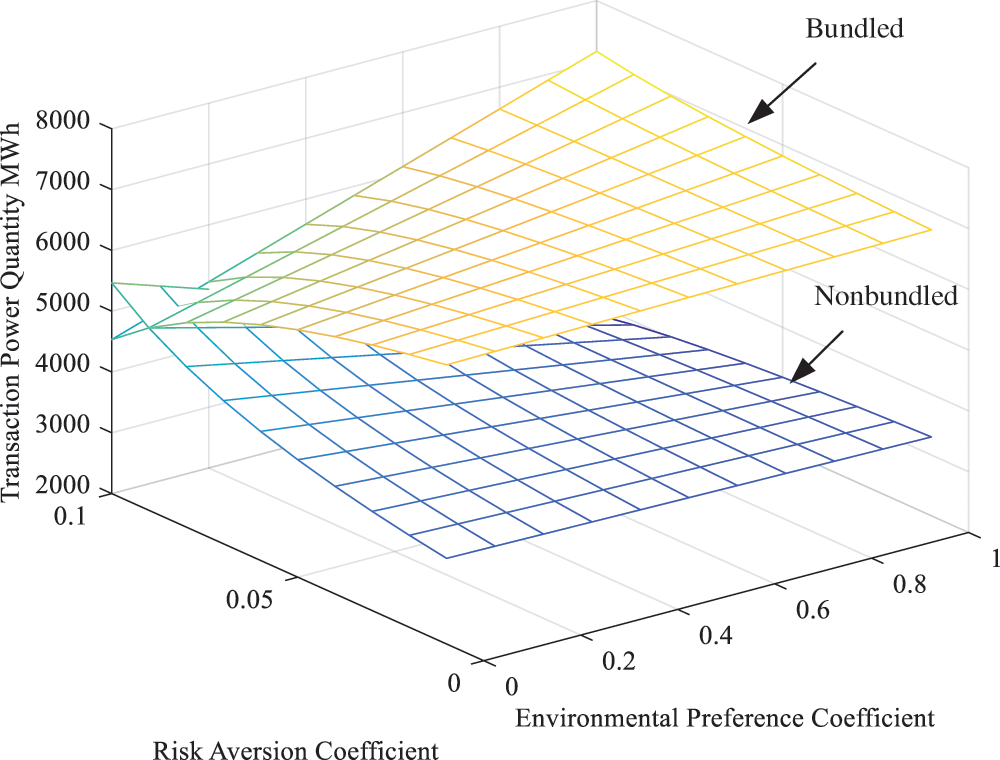
Figure 4: Transaction power quantity under the influence of risk aversion coefficient and environmental preference coefficient
Fig. 5 shows that as the environmental preference coefficient increases, the expected profit of renewable energy power generation companies continues to increase, while the expected profit of conventional energy power generation companies continues to decrease. As the environmental preference coefficient increases, the expected profit of power retailers gradually increases. This is attributed to the transaction power, wholesale price, and retail price of bundled renewable energy continue to increase with the increase of the environmental preference coefficient, and the economic benefits brought by the bundled renewable energy power products account for the main part of the renewable energy power generation companies and power retailers. As the risk aversion coefficient decreases, the expected profit of renewable energy power generation companies continues to increase, and the expected profit of power retailers generally continues to increase. However, the relationship between the expected profit of conventional energy and the risk aversion coefficient is relatively complicated. When the environmental preference coefficient is greater than 0.5, as the risk aversion coefficient decreases, the expected profit of conventional energy power continues to increase. This is because the risk aversion coefficient plays a leading role. Although the power consumers prefer renewable energy, they reduce the purchase of renewable energy power products because of the greater risks, and instead purchase conventional energy power products, therefore, the risk aversion coefficient have a greater impact on the expected profit of conventional energy.
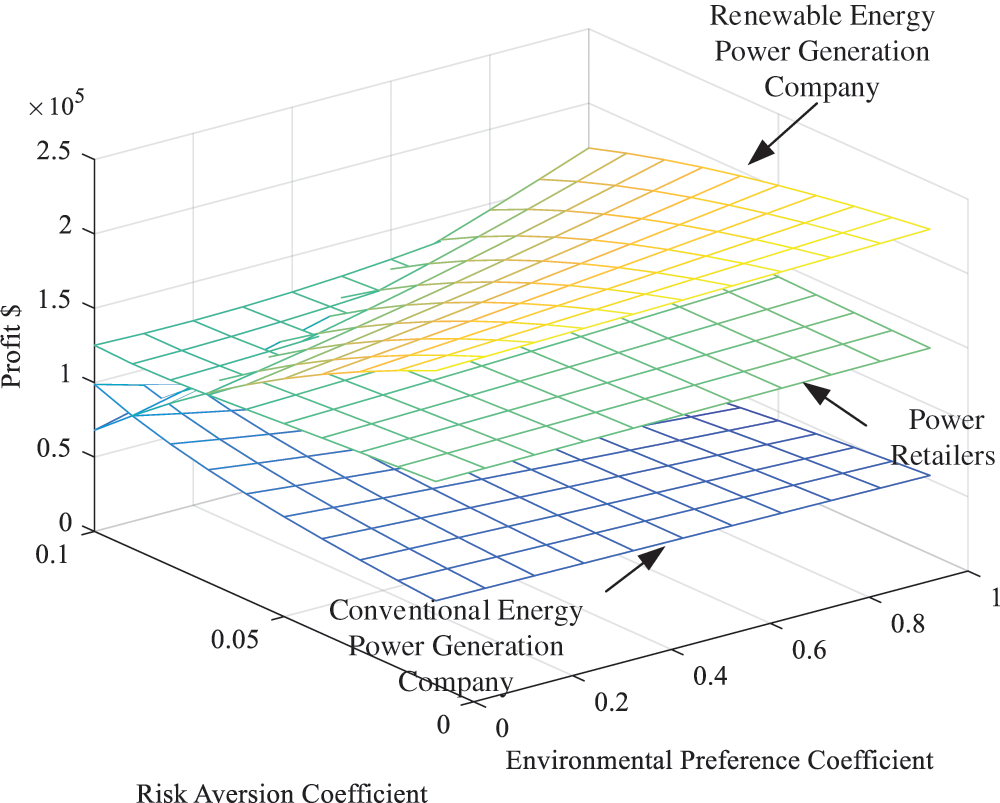
Figure 5: Profits of electricity market subjects under the influence of risk aversion coefficient and environmental preference coefficient
6.2.2 Analysis of Transaction Results under Risk Aversion Coefficient and Green Certificate Price
Fig. 6 shows that the wholesale prices of both bundled renewable energy and nonbundled energy are positively correlated with the green certificate price, which is consistent with the results obtained from the above Eqs. (39) and (40). This is attributed to the wholesale price of nonbundled energy, as well as the purchase cost of conventional energy, also including the cost of purchasing green certificates corresponding to conventional energy in the green certificate market, which is considerably affected by the cost of green certificates. The bundled renewable energy does not purchase the green certificates from the green certificate market and the wholesale price is relatively fixed, which is less affected by the cost of green certificates. The wholesale prices of both bundled renewable energy and nonbundled energy are negatively correlated with the risk aversion coefficient, the wholesale price of bundled renewable energy and nonbundled energy will first decrease gradually and then rapidly. This is attributed to the smaller the risk aversion coefficient, the more risky are the renewable energy generators. Therefore, the bundled renewable energy power will decrease. According to the supply and demand of power products, the wholesale price of bundled renewable energy will increase beyond that of nonbundled energy.
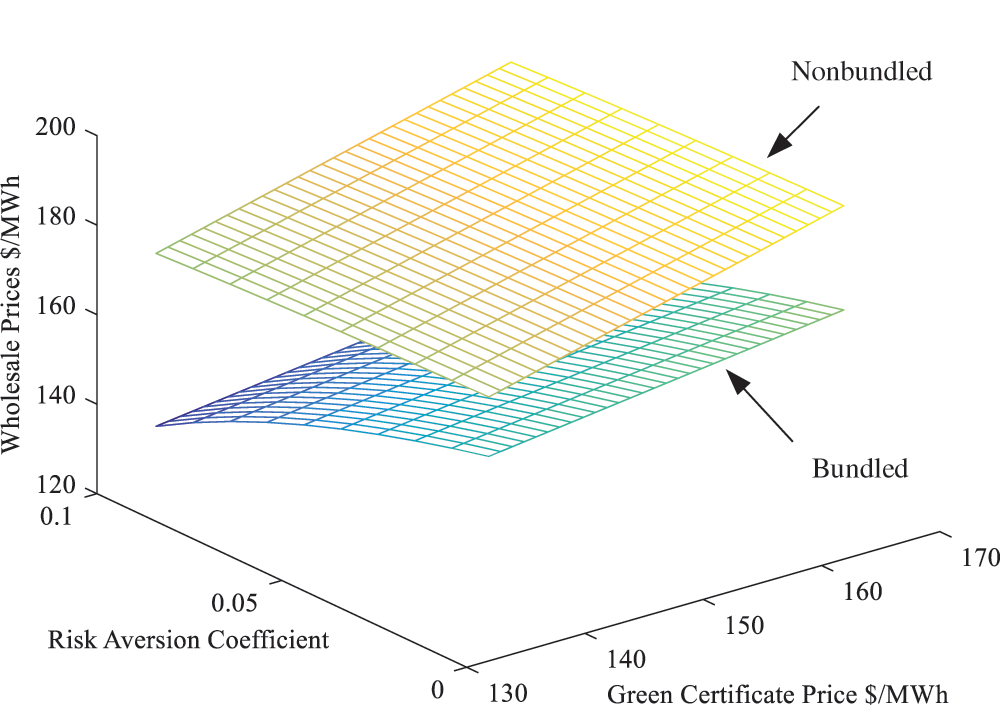
Figure 6: Wholesale prices under the influence of risk aversion coefficient and green certificate price
Fig. 7 shows that the retail prices of bundled renewable energy and nonbundled energy are both positively correlated with the price of green certificates. The price of green certificates affects both power products. Because the cost of the green certificates is apportioned to the retail prices of the two power products and passed to the receiving end, the power consumers will bear the cost of the green certificates. The retail price of bundled renewable energy is negatively correlated with the risk aversion coefficient, and the retail price of nonbundled energy is positively correlated with the risk aversion coefficient. The retail price of bundled renewable energy will decrease gradually first and then rapidly, and the retail price of nonbundled energy will increase slowly first and then rapidly. Because the smaller the risk aversion coefficient, the more risky are the renewable energy generators, the bundled renewable energy power quantity decreases, the wholesale price increases, and is transmitted to power consumers along the power supply chain, which increases the retail price of bundled renewable energy beyond those of nonbundled energy.
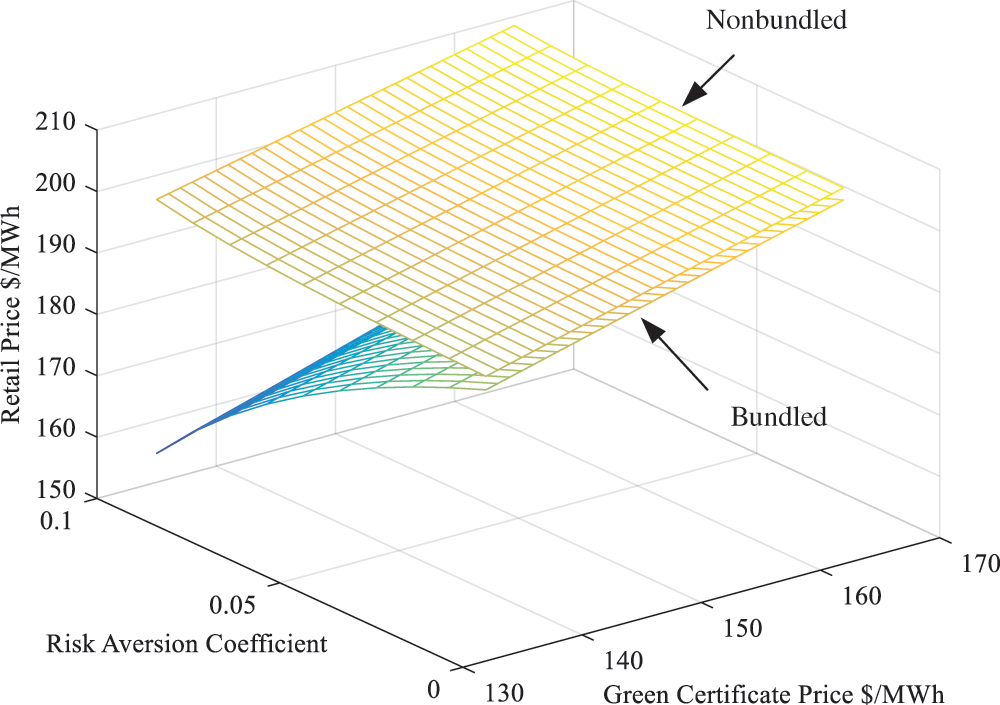
Figure 7: Retail prices under the influence of risk aversion coefficient and green certificate price
Fig. 8 shows that with an increase in the price of green certificates and a decrease in the value of the risk aversion coefficient, the transaction power of bundled renewable energy continues to increase. Because the price of green certificates increases, power consumers and retailers will be more pleased to buy bundled renewable energy to reduce the purchase cost of green certificates, thereby increasing their respective profits. In contrast, with an increase in the price of green certificates and a decrease in the value of the risk aversion coefficient, the transaction power of nonbundled energy continues to decrease. Because the sum of the two power products is a fixed value, the demand for one power product increases, while that for the other inevitably decreases. As the risk aversion coefficient increases, the decline rate of the transaction power of bundled renewable energy is first slow and then rapid. On the other hand, the increase rate of the transaction power of nonbundled energy is first slow and then rapid.
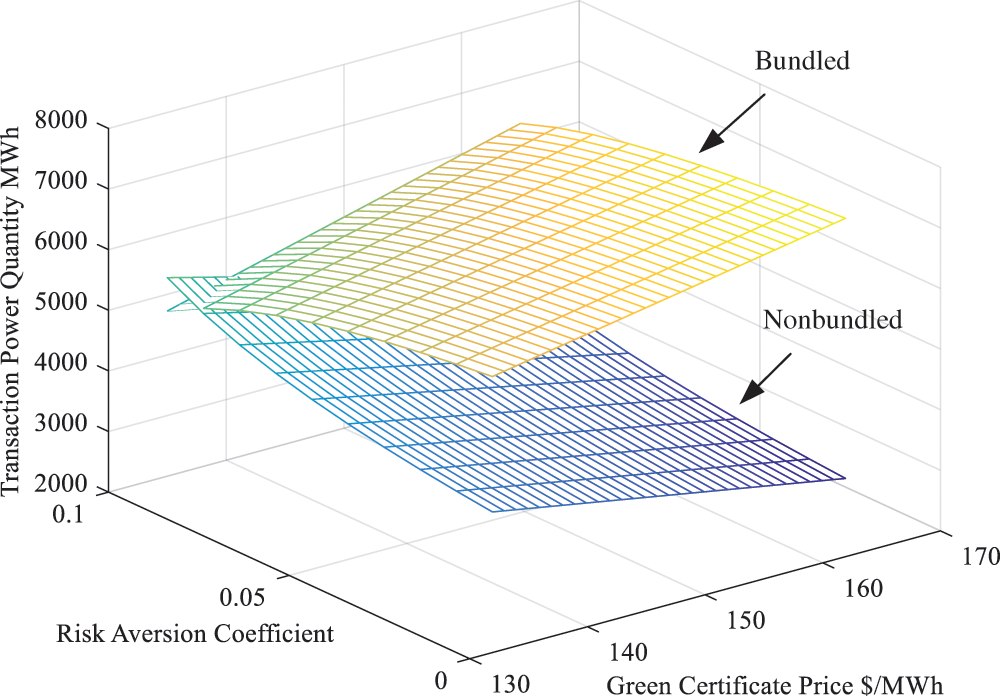
Figure 8: Transaction power quantity under the influence of risk aversion coefficient and green certificate price
Fig. 9 shows that as the price of green certificates increases and the risk aversion coefficient decreases, the expected profits of renewable energy power generation companies selling bundled renewable energy continues to increase. As shown in Figs. 6 and 8, as the green certificate price increases or the risk aversion coefficient decreases, the transaction power and wholesale price of bundled renewable energy continue to increase, while the production cost remains fixed; thus, the expected profits continues to increase. In contrast, with an increase in the price of green certificates and a decrease in the risk aversion coefficient, the expected profits of conventional energy power generation companies directly selling conventional power continues to decrease. As shown in Figs. 6 and 8, as the green certificate price increases or the risk aversion coefficient decreases, the decrease of the transaction power is greater than the increase of the wholesale price of nonbundled energy, while the production cost is fixed; thus, the expected profits continues to decrease. With an increase in the price of green certificates and a decrease in the risk aversion coefficient, the total expected profits of power retailers gradually increase, which is less than that of renewable energy power generation companies. This is because the higher the price of green certificates or smaller the risk aversion coefficient. As observed from Figs. 6 and 7, the average increase in retail price of bundled renewable energy is greater than that in the wholesale price, whereas the average increase in the retail price of nonbundled energy is less than that in the wholesale price; thus, the total expected profits increases, which is less than the expected profits of renewable energy power generation companies.
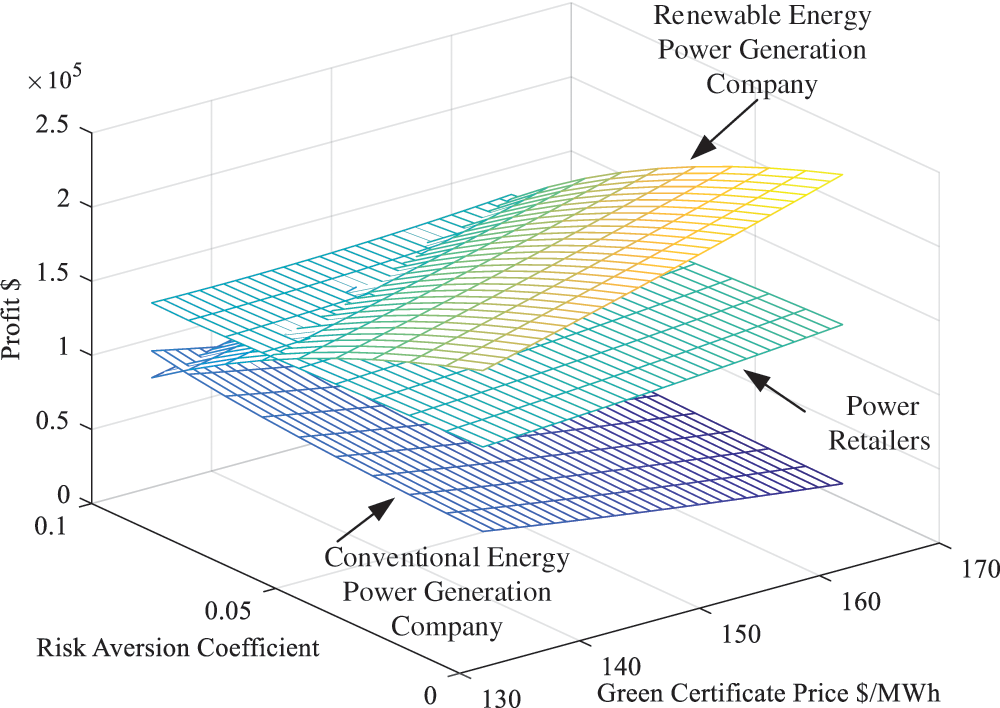
Figure 9: Profits of electricity market subjects under the influence of risk aversion coefficient and green certificate price
Fig. 10 shows that the utility function of bundled renewable energy decreases with an increase in the green certificate price and a decrease in the risk aversion coefficient. The utility function of nonbundled energy indicates an opposite trend. With an increase in the risk aversion coefficient, the price of the green certificates increases and the total utility function of power consumers becomes complicated. As shown in Fig. 11, when the price of the green certificates is below 148 $/MWh, the risk aversion coefficient increases, the utility function of power consumers increases first and then decreases. In contrast, when the price of the green certificates exceeds 148 $/MWh, the utility function of power consumers will increase with the risk aversion coefficient. This is because the increase in the utility function of nonbundled energy caused by the increase in the price of green certificates is greater than the decrease in the utility function of bundled renewable energy. When the risk aversion coefficient has a value below 0.09, the utility function of power consumers decreases with an increase in the green certificate price. In contrast, when this value exceeds 0.09, the utility function of power consumers increases with the price of the green certificates. This is because the increase in the utility function of nonbundled energy caused by the increase in the risk aversion coefficient is smaller than the increase in the utility function of the bundled renewable energy. In summary, under the dual effects of green certificate price and risk aversion coefficient, as shown in Figs. 10 and 11, if the value of the risk aversion coefficient is too large and the price of the green certificates is too high, the utility function of power consumers is satisfied to the maximum possible extent, whereas the power retailers and renewable energy power generation companies have lower profits. Therefore, when the green certificate price is 135 $/MWh and the risk aversion coefficient is 0.08, the power consumers achieve an optimal utility value of −758766.580.
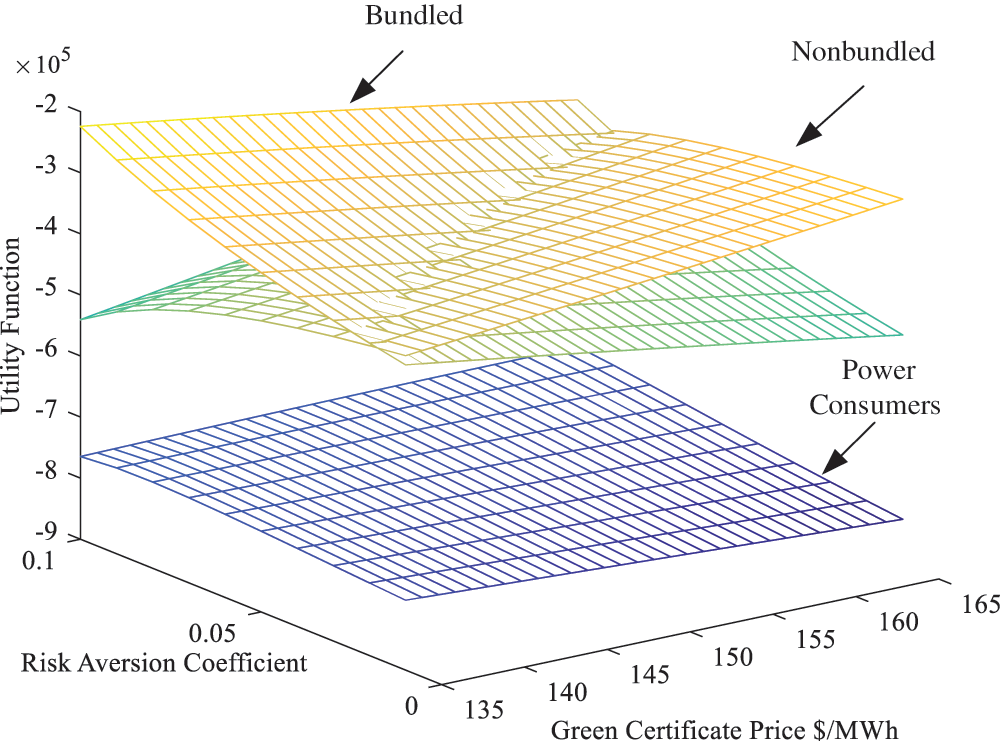
Figure 10: Utility function under the influence of risk aversion coefficient and green certificate price
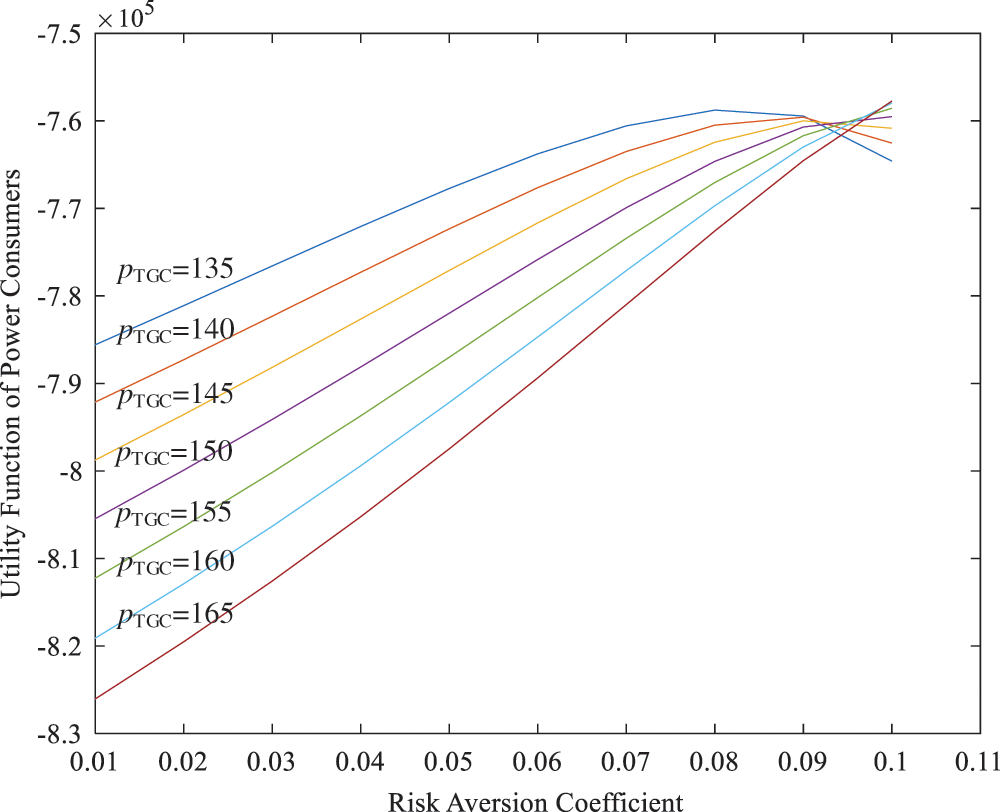
Figure 11: Relation between the risk aversion coefficient and total utility function of power consumers under the influence of different green certificate prices
This paper considers the uncertainty risks of renewable energy under RPS, clarifies the relation between the power supply and demand of trans-provincial electricity market subjects, and that between the green certificates supply and demand. This paper constructs an optimal decision-making model for trans-provincial electricity market subjects under RPS considering the risks. The calculation examples of the decision-making model show that: Power consumers pay more and more attention to the environmental consciousness, the more power consumers tend to purchase bundled renewable energy, which is conducive to promoting the trans-provincial trading of renewable energy; As the wholesale price of nonbundled energy includes the cost of purchasing green certificates corresponding to conventional energy in the green certificate market, it is considerably affected by green certificate; however, bundling renewable energy does not require purchasing green certificates from the green certificate market and the wholesale price is relatively fixed; The risk aversion coefficient reflects the degree of risk aversion of power consumers. The smaller the risk aversion coefficient is, the more the power consumers are afraid of risks and reduce their purchase of bundled renewable energy; To reduce the purchase costs and increase their respective profits, power consumers and retailers will be more inclined to purchase bundled renewable energy. The transaction power of bundled renewable energy continues to increase, which is conducive to promoting the trans-provincial consumption of renewable energy.
This paper considers the uncertainty risks of renewable energy under RPS, studies the effects of the green certificate price and risk aversion coefficient in the RPS mechanism on the optimal decision-making of trans-provincial electricity market subjects, and obtains the changing trends of two different power products and those of different electricity market subjects under the influence of the green certificate price and risk aversion coefficient, which have a certain reference value for studying the factors affecting the optimal decision-making of trans-provincial electricity market subjects. However, the actual situation will be much more complicated in the research related risk identification and risk sharing process, this paper does not consider the type of risks, and instead, uses uniform distribution in the probability model. In the following research, we will consider the load probabilistic scenario on the demand side or the power supply scenarios on the supply side.
Funding Statement: This work was supported by Project of Philosophy and Social Science Foundation of Shanghai, China (Grant No. 2020BGL011).
Conflicts of Interest: The authors declare that they have no conflicts of interest to report regarding the present study.
1. Fan, J. L., Wang, J. X., Hu, J. W., Wang, Y., Zhang, X. (2019). Optimization of China’s provincial renewable energy installation plan for the 13th five-year plan based on renewable portfolio standards. Applied Energy, 254, 113757. DOI 10.1016/j.apenergy.2019.113757. [Google Scholar] [CrossRef]
2. Zhou, S., Solomon, B. D. (2020). Do renewable portfolio standards in the United States stunt renewable electricity development beyond mandatory targets? Energy Policy, 140(2), 111377. DOI 10.1016/j.enpol.2020.111377. [Google Scholar] [CrossRef]
3. Carley, S., Davies, L. L., Spence, D. B., Zirogiannis, N. (2018). Empirical evaluation of the stringency and design of renewable portfolio standards. Nature Energy, 3(9), 754–763. DOI 10.1038/s41560-018-0202-4. [Google Scholar] [CrossRef]
4. Zhang, X., Chen, Z., Ma, Z. M., Xia, Q., Dai, X. J. et al. (2019). Study on electricity market trading system adapting to renewable portfolio standard. Dianwang Jishu/Power System Technology, 43(8), 2682–2690. DOI 10.13335/j.1000-3673.pst.2019.1190. [Google Scholar] [CrossRef]
5. Wang, G., Zhang, Q., Li, Y., McLellan, B. C. (2019). Efficient and equitable allocation of renewable portfolio standards targets among China’s provinces. Energy Policy, 125, 170–180. DOI 10.1016/j.enpol.2018.10.044. [Google Scholar] [CrossRef]
6. Dong, F. G., Shi, L. (2019). Design and simulation of renewable portfolio standard and tradable green certificate mechanism. Dianli Xitong Zidonghua/Automation of Electric Power Systems, 43(12), 113–121. DOI 10.7500/AEPS20180610004. [Google Scholar] [CrossRef]
7. Kim, J. E., Tang, T. (2020). Preventing early lock-in with technology-specific policy designs: The renewable portfolio standards and diversity in renewable energy technologies. Renewable and Sustainable Energy Reviews, 123(3), 109738. DOI 10.1016/j.rser.2020.109738. [Google Scholar] [CrossRef]
8. Zhou, Y., Zhao, X. G., Wang, Z. (2020). Demand side incentive under renewable portfolio standards: A system dynamics analysis. Energy Policy, 144(6), 111652. DOI 10.1016/j.enpol.2020.111652. [Google Scholar] [CrossRef]
9. Shang, B., Huang, T. Z., Du, X. Y. (2020). Impact of government regulation of RPS on China’s power market under carbon abatement constraints. Journal of Intelligent & Fuzzy Systems, 39(3), 2947–2975. DOI 10.3233/JIFS-191470. [Google Scholar] [CrossRef]
10. Zhao, X. G., Zhou, Y., Zuo, Y., Meng, J., Zhang, Y. Z. (2019). Research on optimal benchmark price of tradable green certificate based on system dynamics: A China perspective. Journal of Cleaner Production, 230(SEP 1), 241–252. DOI 10.1016/j.jclepro.2019.04.408. [Google Scholar] [CrossRef]
11. An, X. N., Zhang, S. H., Li, X., Du, D. J. (2019). Two-stage joint equilibrium model of electricity market with tradable green certificates. Transactions of the Institute of Measurement and Control, 41(6), 1615–1626. DOI 10.1177/0142331217718619. [Google Scholar] [CrossRef]
12. Zhao, X. G., Ren, L. Z., Zhang, Y. Z., Wan, G. (2018). Evolutionary game analysis on the behavior strategies of power producers in renewable portfolio standard. Energy, 162(4), 505–516. DOI 10.1016/j.energy.2018.07.209. [Google Scholar] [CrossRef]
13. Dong, F. G., Shi, L., Ding, X. H., Li, Y., Shi, Y. P. (2019). Study on China’s renewable energy policy reform and improved design of renewable portfolio standard. Energies, 12(11), 2147. DOI 10.3390/en12112147. [Google Scholar] [CrossRef]
14. Shayegh, S., Sanchez, D. L. (2021). Impact of market design on cost-effectiveness of renewable portfolio standards. Renewable & Sustainable Energy Reviews, 136(7411), 110397. DOI 10.1016/j.rser.2020.110397. [Google Scholar] [CrossRef]
15. Zhu, C. P., Fan, R. G., Lin, J. C. (2020). The impact of renewable portfolio standard on retail electricity market: A system dynamics model of tripartite evolutionary game. Energy Policy, 136, 111072. DOI 10.1016/j.enpol.2019.111072. [Google Scholar] [CrossRef]
16. Fang, D. B., Zhao, C. Y., Kleit, A. N. (2019). The impact of the under enforcement of RPS in China: An evolutionary approach. Energy Policy, 135(8), 111021. DOI 10.1016/j.enpol.2019.111021. [Google Scholar] [CrossRef]
17. Bao, J. T., Zhao, W. H., Wang, X. M., Tan, Z. F. (2019). Impact of policy mix concerning renewable portfolio standards and emissions trading on electricity market. Renewable Energy, 135(Supplement C), 761–774. DOI 10.1016/j.renene.2018.12.005. [Google Scholar] [CrossRef]
18. Zhao, W. H., Bao, J. T., Yuan, G. H., Wang, X. M., Bao, H. B. (2019). The equilibrium model for the coexistence of renewable portfolio standards and emissions trading: The supply chain analysis. Energies, 12(3), 439. DOI 10.3390/en12030439. [Google Scholar] [CrossRef]
19. Son, D., Kim, J., Jeong, B. (2019). Optimal operational strategy for power producers in Korea considering renewable portfolio standards and emissions trading schemes. Energies, 12(9), 1667. DOI 10.3390/en12091667. [Google Scholar] [CrossRef]
20. Jiang, Y. C., Cao, H. X., Yang, L., Fei, F., Li, J. et al. (2020). Mechanism design and impact analysis of renewable portfolio standard. Dianli Xitong Zidonghua/Automation of Electric Power Systems, 44(7), 187–199. DOI 10.7500/AEPS20190602001. [Google Scholar] [CrossRef]
21. Cai, H. L., Chen, J. G., Dong, C. J., Li, J., Lin, Z. M. et al. (2019). Power market equilibrium under the joint FIP-RPS renewable energy incentive mechanism in China. Sustainability, 11(18), 4964. DOI 10.3390/su11184964. [Google Scholar] [CrossRef]
22. Wang, B., Wei, Y. M., Yuan, X. C. (2018). Possible design with equity and responsibility in China’s renewable portfolio standards. Applied Energy, 232(3), 685–694. DOI 10.1016/j.apenergy.2018.09.110. [Google Scholar] [CrossRef]
23. Zhao, X. G., Li, P. L., Zhou, Y. (2020). Which policy can promote renewable energy to achieve grid parity? Feed-in tariff vs. renewable portfolio standards. Renewable Energy, 162(8), 322–333. DOI 10.1016/j.renene.2020.08.058. [Google Scholar] [CrossRef]
24. Hao, P., Guo, J. P., Chen, Y., Xie, B. C. (2020). Does a combined strategy outperform independent policies? Impact of incentive policies on renewable power generation. Omega-International Journal of Management Science, 97, 102100. DOI 10.1016/j.omega.2019.08.007. [Google Scholar] [CrossRef]
25. Ritzenhofen, I., Birge, J. R., Spinler, S. (2016). The structural impact of renewable portfolio standards and feed-in tariffs on electricity markets. European Journal of Operational Research, 255(1), 224–242. DOI 10.1016/j.ejor.2016.04.061. [Google Scholar] [CrossRef]
26. Xin, X. (2020). Can a dynamic reward-penalty mechanism help the implementation of renewable portfolio standards under information asymmetry? Symmetry, 12(4), 670. DOI 10.3390/sym12040670. [Google Scholar] [CrossRef]
27. Zhao, X. G., Ren, L. Z., Wan, G. (2019). Renewable portfolio standards, the strategic behavior of power producers and evolution. Chinese Journal of Management Science, 27(3), 168–179. DOI 10.16381/j.cnki.issn1003-207x.2019.03.017. [Google Scholar] [CrossRef]
28. Zuo, Y., Zhao, X. G., Zhang, Y. Z., Zhou, Y. (2019). From feed-in tariff to renewable portfolio standards: An evolutionary game theory perspective. Journal of Cleaner Production, 213(3), 1274–1289. DOI 10.1016/j.jclepro.2018.12.170. [Google Scholar] [CrossRef]
29. Kwon, T. H. (2015). Is the renewable portfolio standard an effective energy policy? Early evidence from South Korea. Utilities Policy, 36(1), 46–51. DOI 10.1016/j.jup.2015.09.002. [Google Scholar] [CrossRef]
30. Guo, H. X., Gao, R., Yang, P. (2019). Two-stage dispatch of microgrid based on CVaR theory under electricity spot market. Dianwang Jishu/Power System Technology, 43(8), 2665–2673. DOI 10.13335/j.1000-3673.pst.2019.0252. [Google Scholar] [CrossRef]
31. Zhang, B., Rajagopal, R., Tse, D. (2014). Network risk limiting dispatch: Optimal control and price of uncertainty. IEEE Transactions on Automatic Control, 59(9), 2442–2456. DOI 10.1109/TAC.2014.2325640. [Google Scholar] [CrossRef]
32. Yang, M., Ai, X., Tang, L., Guo, S., Luo, G. Y. (2016). Optimal trading strategy in balancing market for electricity retailer considering risk aversion. Dianwang Jishu/Power System Technology, 40(11), 3300–3308. DOI 10.13335/j.1000-3673.pst.2016.11.004. [Google Scholar] [CrossRef]
33. Guo, L. B., Ding, Y., Bao, M. L., Zeng, D. (2019). An optimal power purchase model of inter-provincial traders in two-level electricity market considering risk management. Dianwang Jishu/Power System Technology, 43(8), 2726–2733. DOI 10.13335/j.1000-3673.pst.2019.0668. [Google Scholar] [CrossRef]
34. Hou, J. X., Zhang, Z., Lin, Z. Z., Yang, L., Liu, X. Y. et al. (2019). An energy imbalance settlement mechanism considering decision-making strategy of retailers under renewable portfolio standard. IEEE Access, 7, 118146–118161. DOI 10.1109/ACCESS.2019.2936459. [Google Scholar] [CrossRef]
35. Guo, H., Chen, Q. X., Xia, Q., Kang, C. Q. (2020). Modeling strategic behaviors of renewable energy with joint consideration on energy and tradable green certificate markets. IEEE Transactions on Power Systems, 35(3), 1898–1910. DOI 10.1109/TPWRS.2019.2953114. [Google Scholar] [CrossRef]
36. Li, B. S., Wang, X., Jiang, C. W., Zhao, Y. (2018). Market strategy modeling and risk profit analysis of demand-side resource aggregator. Dianli Xitong Zidonghua/Automation of Electric Power Systems, 42(16), 119–126. DOI 10.7500/AEPS20170511006. [Google Scholar] [CrossRef]
37. Chen, Z. Y., Su, Y. W., Yan, H. M. (2012). Optimal purchasing process for electricity and renewable energy credits with price and demand uncertainty. Journal of Systems Science and Systems Engineering, 21(2), 184–203. DOI 10.1007/s11518-012-5192-3. [Google Scholar] [CrossRef]
38. Liu, F., Zhang, L. Z. (2018). Optimization model and method of cascade hydropower scheduling transaction considering stochastic and risk factors. Dianwang Jishu/Power System Technology, 42(3), 870–877. DOI 10.13335/j.1000-3673.pst.2017.0943. [Google Scholar] [CrossRef]
39. Li, C. Y., Yao, Y. M., Zhao, R. S., Xie, K. G. (2021). Optimization model for time-varying settlement of renewable energy consumption considering accommodation difficulty and supply-demand interaction. International Journal of Electrical Power & Energy Systems, 125(24), 106469. DOI 10.1016/j.ijepes.2020.106469. [Google Scholar] [CrossRef]
40. Jiang, Y. C., Liu, S. Y., Yang, L., Lin, Z. Z., Ding, Y. et al. (2020). Bi-layer portfolio selection model for electricity retailers based on behavioural portfolio theory under quota obligation of RPS. IET Generation Transmission & Distribution, 14(14), 2857–2868. DOI 10.1049/iet-gtd.2019.1574. [Google Scholar] [CrossRef]
41. Zhao, X. G., Zhou, Y. Q. (2021). Analysis of the effectiveness of renewable portfolio standards: A perspective of shared mental model. Journal of Cleaner Production, 278, 124276. DOI 10.1016/j.jclepro.2020.124276. [Google Scholar] [CrossRef]
42. Shahnazari, M., McHugh, A., Maybee, B., Whale, J. (2017). Overlapping carbon pricing and renewable support schemes under political uncertainty: Global lessons from an Australian case study. Applied Energy, 200(11), 237–248. DOI 10.1016/j.apenergy.2017.05.038. [Google Scholar] [CrossRef]
43. Ji, L., Huang, G. H., Xie, Y. L., Niu, D. X., Song, Y. H. (2017). Explicit cost-risk tradeoff for renewable portfolio standard constrained regional power system expansion: A case study of Guangdong Province, China. Energy, 131(4), 125–136. DOI 10.1016/j.energy.2017.05.017. [Google Scholar] [CrossRef]
44. Zhu, J. Z., Feng, Y. Q., Xie, P. P., Xuan, P. Z., Zou, J. (2019). Equilibrium model of chinese electricity market considering renewable portfolio standard. Dianli Xitong Zidonghua/Automation of Electric Power Systems, 43(1), 168–175. DOI 10.7500/AEPS20180621004. [Google Scholar] [CrossRef]
45. Lin, X. F., Zeng, J. N., Feng, D. H. (2021). Optimization decision model of electricity market under renewable portfolio standards. https://kns.cnki.net/kcms/detail/32.1180.TP.20201217.1136.004.html. [Google Scholar]
46. Wang, H., Chen, B. B., Zhao, W. H., Liao, K., Bao, J. T. (2019). Optimal decision-making of trans-provincial power transaction subjects under renewable portfolio standard. Dianwang Jishu/Power System Technology, 43(6), 1987–1994. DOI 10.13335/j.1000-3673.pst.2018.1836. [Google Scholar] [CrossRef]
47. Wang, T. F., Wang, H., Leng, Y. J., Chen, B. B., Wang, J. J. et al. (2020). Power insurance based support optimal decision of electricity market subjects. Dianli Xitong Zidonghua/Automation of Electric Power Systems, 44(12), 56–63. DOI 10.7500/AEPS20190426003. [Google Scholar] [CrossRef]
48. Ding, Y., Xie, K., Pang, B., Li, Z., Guo, L. B. (2020). Key issues of national unified electricity market with chinese characteristics (1Enlightenment, comparison and suggestions from foreign countries. Dianwang Jishu/Power System Technology, 44(7), 2401–2410. DOI 10.13335/j.1000-3673.pst.2020.0422. [Google Scholar] [CrossRef]
49. Xia, Q., Chen, Q. X., Xie, K., Pang, B., Li, Z. et al. (2020). Key issues of national unified electricity market with chinese characteristics (2Development path, trading varieties and policy recommendations for inter-regional and inter-provincial electricity markets. Dianwang Jishu/Power System Technology, 44(8), 2801–2808. DOI 10.13335/j.1000-3673.pst.2020.0392. [Google Scholar] [CrossRef]
50. Zeng, D., Xie, K., Pang, B., Li, Z., Yang, Z. L. (2020). Key issues of national unified electricity market with chinese characteristics (3Transaction clearing models and algorithms adapting to the coordinated operation of provincial electricity markets. Dianwang Jishu/Power System Technology, 44(8), 2809–2818. DOI 10.13335/j.1000-3673.pst.2020.0435. [Google Scholar] [CrossRef]
51. Wang, B., Xia, Y., Xia, Q., Zhang, H. L., Han, H. W. (2016). Model and methods of generation and transmission scheduling of inter-regional power grid via HVDC tie-line. Dianli Xitong Zidonghua/Automation of Electric Power Systems, 40(3), 8–13+26. DOI 10.7500/AEPS20150508015. [Google Scholar] [CrossRef]
52. Niu, D. X., Li, J. F., Wei, L. J., Chi, Y. N. (2016). Study on technical factors analysis and overall evaluation method regarding wind power integration in trans-provincial power grid. Dianwang Jishu/Power System Technology, 40(4), 1087–1093. DOI 10.13335/j.1000-3673.pst.2016.04.016. [Google Scholar] [CrossRef]
53. Han, H. W., Tu, M. F., Zhang, H. L., Ding, Q., Xu, F. (2015). Day-ahead generation scheduling method considering adjustable HVDC plan and its analysis. Dianli Xitong Zidonghua/Automation of Electric Power Systems, 39(16), 138–142. DOI 10.7500/AEPS20140909004. [Google Scholar] [CrossRef]
54. Xu, F., Ding, Q., Han, H. W., Xie, L. R., Lu, M. Y. (2017). Power optimization model and analysis of HVDC tie-line for promoting integration of inter-regional renewable energy accommodation. Dianli Xitong Zidonghua/Automation of Electric Power Systems, 41(18), 152–159. DOI 10.7500/AEPS20170401001. [Google Scholar] [CrossRef]
55. Salehizadeh, M. R., Ashkan, R. K., Kjell, H. (2015). A leader–follower game on congestion management in power systems. In: Game theoretic analysis of congestion, safety and security. Springer series in reliability engineering, pp. 81--112. Cham: Springer. DOI 10.1007/978-3-319-13009-5. [Google Scholar] [CrossRef]
56. Soltaniyan, S., Salehizadeh, M. R., Taşcıkaraoğlu, A., Erdinç, O., Catalão Jão, P. S. et al. (2021). An interactive multi-criteria decision-making framework between a renewable power plant planner and the independent system operator. Sustainable Energy, Grids and Networks, 26(4), 100447. DOI 10.1016/j.segan.2021.100447. [Google Scholar] [CrossRef]
57. Salehizadeh, M. R., Salman, S. (2016). Application of fuzzy Q-learning for electricity market modeling by considering renewable power penetration. Renewable and Sustainable Energy Reviews, 56(3), 1172–1181. DOI 10.1016/j.rser.2015.12.020. [Google Scholar] [CrossRef]
58. Kiannejad, M., Salehizadeh, M. R., Oloomi-Buygi, M., Shafie-khah, M. (2020). Artificial neural network approach for revealing market competitors’ behaviour. IET Generation, Transmission & Distribution, 14(7), 1292–1297. DOI 10.1049/iet-gtd.2019.1612. [Google Scholar] [CrossRef]
59. Kiannejad, M., Mohammad, R. S., Majid, O. B. (2021). Two-stage ANN-based bidding strategy for a load aggregator using decentralized equivalent rival concept. IET Generation, Transmission & Distribution, 15(1), 56–70. DOI 10.1049/gtd2.12007. [Google Scholar] [CrossRef]
60. Peng, Q., Zhou, X. J., Yang, R. (2020). Design of coordination and balance mechanism between national green power certificate trading market and provincial day-ahead power market. Dianwang Jishu/Power System Technology, 44(7), 2565–2571. DOI 10.13335/j.1000-3673.pst.2019.1913. [Google Scholar] [CrossRef]
61. Zhou, X. J., Peng, Q., Yang, R., Han, Z. Y., Wang, M. (2020). Power price marketing strategy of comprehensive energy-based electricity sales company participating in electricity market competition under ubiquitous environment of Internet of Things. Dianwang Jishu/Power System Technology, 44(4), 1317–1324. DOI 10.13335/j.1000-3673.pst.2019.1906. [Google Scholar] [CrossRef]
62. Liu, Q. H., Yuan, H., Yang, Z. L., Fan, H. F., Xu, C. L. (2020). Discussion on compensation ancillary service scheme of green certificates based on renewable portfolio standard. Dianli Xitong Zidonghua/Automation of Electric Power Systems, 44(6), 1–8. DOI 10.7500/AEPS20191108007. [Google Scholar] [CrossRef]
63. Cai, Y. J., Gu, Y. X., Luo, G., Zhang, X., Chen, Q. X. (2020). Blockchain based trading platform of green power certificate: Concept and practice. Dianli Xitong Zidonghua/Automation of Electric Power Systems, 44(15), 1–9. DOI 10.7500/AEPS20200222003. [Google Scholar] [CrossRef]
64. Luo, Z., Qin, J. H., Liang, J. Y., Zhao, M., Wang, H. et al. (2021). Operation optimization of integrated energy system with green certificate cross-chain transaction. http://kns.cnki.net/kcms/detail/11.24-10.TM.20210203.1542.007.html. [Google Scholar]
65. Qu, M., Ding, T., Bai, J. W., He, Y. K., Liu, R. F. et al. (2020). Green certificate transaction analysis in china under responsibility for non-water renewable energy integration ratio. Dianwang Jishu/Power System Technology, 44(10), 3885–3892. DOI 10.13335/j.1000-3673.pst.2019.2405. [Google Scholar] [CrossRef]
66. Wan, C., Song, Y. H. (2021). Theories, methodologies and applications of probabilistic forecasting for power systems with renewable energy sources. Dianwang Jishu/Power System Technology, 45(1), 2–16. DOI 10.7500/AEPS20200811008. [Google Scholar] [CrossRef]
67. Xiong, Z. K., Zhang, P., Guo, N. (2014). Impact of carbon tax and consumers’ environmental awareness on carbon emissions in supply chains. Xitong Gongcheng Lilun yu Shijian/System Engineering Theory and Practice, 34(9), 2245–2252. DOI 10.12011/1000-6788(2014)9-2245. [Google Scholar] [CrossRef]
68. Wang, R., Shang, J. C., Feng, Y., Zhou, X. Y., Zhang, Y. C. et al. (2005). Combined bidding strategy and model for power suppliers based on CVaR risk measurement techniques. Dianli Xitong Zidonghua/Automation of Electric Power Systems, 29(14), 5–9. DOI 10.3321/j.issn:1000-1026.2005.14.002. [Google Scholar] [CrossRef]
Appendix A. The reverse induction method
The reverse induction method is used to address the above power supply chain game mode. Firstly, power consumers consider the uncertainty of renewable energy to maximize the utility. The optimal contract electricity of the power consumers can be expressed as
Let
where
Secondly, power retailers determine the retail prices with the maximum profits of power retailers as the objective function. Eqs. (A-2) and (A-3) are substituted into the above expression Eq. (23). The optimal retail prices of the power retailers can be expressed as
where
Eqs. (A-4) and (A-5) are substituted into the above expression Eqs. (A-2) and (A-3), namely
Finally, the sending provincial renewable energy power generation company and the receiving provincial conventional energy power generation company determine their respective wholesale prices with the maximum profits as the objective function. Eqs. (A-4)–(A-7) are substituted into the above expression Eqs. (26) and (28). The optimal wholesale prices of the power retailers can be expressed, as shown in Eqs. (39) and (40).
 | This work is licensed under a Creative Commons Attribution 4.0 International License, which permits unrestricted use, distribution, and reproduction in any medium, provided the original work is properly cited. |