| Energy Engineering |
DOI: 10.32604/ee.2022.017273
ARTICLE
Establishment of a Coupling Model for the Prediction of Heat Dissipation of the Internal Combustion Engine Based on Finite Element
1College of Power and Energy Engineering, Harbin Engineering University, Harbin, 150001, China
2Engine Department, R&D Center, Harbin Dongan Auto Engine Co., Ltd., Harbin, 150066, China
*Corresponding Author: Hongyu Mu. Email: muhongyu@hrbeu.edu.cn
Received: 27 April 2021; Accepted: 12 August 2021
Abstract: The aerodynamics and heat transfer performance in the rear-mounted automobile cabin have an important influence on the engine's safety and the operational stability of the automobile. The article uses STAR-CCM and GT-COOL software to establish the 3D wind tunnel model and engine cooling system model of the internal combustion engine. At the same time, we established a 3D artificial coupling model through parameter transfer. The research results show that the heat transfer coefficient decreases with the increase of the comprehensive drag coefficient of the nacelle. This shows that the cabin flow field has an important influence on the heat transfer coefficient. The mainstream temperature rise of the engine room increases with the increase of the engine load. It is proved that vehicle speed affects the amount of heat dissipation of the engine room internal combustion engine under certain load conditions. The article provides a more effective and fast calculation method for the research on the heat dissipation of the internal combustion engine and the optimization of the cooling system equipment.
Keywords: Internal combustion engine; coupled model; prediction; heat dissipation; heat dissipation of the whole machine
The heat dissipation of the whole internal combustion engine and the heat dissipation of various internal combustion engines are affected by many complicated factors. Factors include combustion in the cylinder, the flow of air, coolant, lubricating oil, fuel, internal combustion engine structure, working conditions, external cooling system, environment, and so on. The academic circle has a set of mature theories and methods in internal combustion engine heat dissipation research. The primary method is to rely on the combination of experiment and simulation analysis to provide a design basis and optimization method for the engine compartment heat dissipation in the automotive development process. This paper conducts an experimental study on the performance of the internal combustion engine radiator, and the process will be explained in detail later [1]. This paper conducts an experimental study on the performance of the internal combustion engine radiator, and the process will be explained in detail later. Due to the high cost of the experimental test and the extended period [2], it is impossible to analyze the heat flow field of the engine room comprehensively. We used CFD technology to simulate the flow field of the engine room [2], and this method successfully improved the heat dissipation performance of the engine room. It comprehensively considers convective heat transfer and radiation heat transfer in the engine room [3]. They did further research on the heat dissipation performance of the engine room. However, the calculation results are not ideal due to the consideration of radiation factors. Unreasonable radiation model settings may cause this. The flow field outside the car has an important influence on the air in the cabin. Considering the influence of the external flow field, when it established a CFD model of the entire vehicle external flow field, including the internal flow field of the engine room [4]. It accurately simulated the airflow conditions outside the engine room and inside the engine room.
Current internal combustion engine problems include calculation of internal combustion engine performance, including fluid flow and combustion, heat transfer and temperature field of components, lubrication and cooling systems, etc. Mature software is available now. We can directly use these local problem models and the coupling relationship between the boundary conditions of each model to establish a unified coupling model. This can significantly reduce the demand for thermal boundary conditions and improve the accuracy of calculation estimates. In addition, to further improve the availability of calculation results, we still need test data of similar reference prototypes. Based on the test data of the existing high-supercharged 4-cylinder internal combustion engine, this paper adjusts the coupling model to calculate the boundary conditions to estimate the heat dissipation of the internal combustion engine.
2 Multi-Model Coupling Method of Internal Combustion Engine
Fig. 1 shows the block diagram of the coupling relationship among the leading local models in the prediction and calculation of the heat dissipation of the internal combustion engine. It uses computer programs to realize data processing, connection, and adjustment between models.
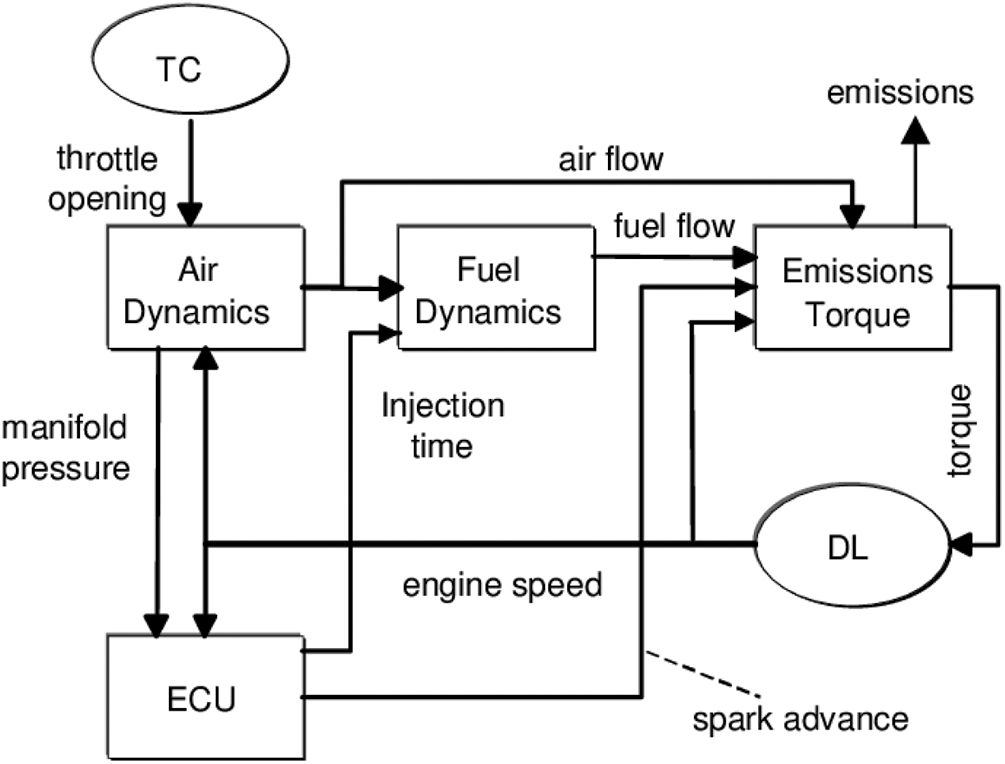
Figure 1: Block diagram of the coupling relationship between the main models of internal combustion engines
The heat flow of the whole machine and its distribution are calculated by loop iteration. Many boundary conditions of each local model are interrelated. For example, the time and space average temperature of the surface of the combustion chamber parts required for the performance calculation of the internal combustion engine can be obtained by the integral calculation of the spatial temperature distribution of the parts obtained by the finite element calculation of the temperature field of the parts. The transient temperature and heat transfer coefficient in the cylinder obtained by the performance calculation can be processed by time average and spatial distribution to obtain the boundary temperature and heat transfer conditions required for the finite element calculation of the part.
2.1 Empirical Parameter Method for Internal Combustion Engine Heat Dissipation
The empirical parameter method takes the rated power of the engine as the design working condition. The calculation of the target heat dissipation of the internal combustion engine is shown in Eq. (1). According to the engine's rated power, the windward area of the internal combustion engine is designed as shown in Eq. (2). The calculation of the total heat exchange area of the internal combustion engine is shown in Eq. (3).
Q represents the target heat dissipation of the internal combustion engine, kW;
The thesis assumes that
The formula
2.2 The Coupling Relationship between Internal Combustion Engine Performance and Piston, Cylinder Head, and Valve
2.2.1 Calculation Requirements for Internal Combustion Engine Performance
The average temperature
2.2.2 The Steady-State Temperature Field and Heat Flow Calculation Requirements of the Heated Parts of the Internal Combustion Engine
The time average temperature and time average heat transfer coefficient
For the calculation requirements of the temperature field of the parts:
Among them, T represents temperature, T represents surface heat transfer coefficient, and B represents pressure. W stands for oil film thickness
The meanings of the superscripts appearing here in the text are as follows: s stands for spatial average; t stands for time average; subscripts: z stands for in-cylinder; w stands for part wall; p stands for piston; h stands for cylinder head; v stands for valve; c stands for cylinder liner; r stands for piston ring; g stands for valve sealing surface; o stands for lubricating oil [8].
2.3 Coupling Relationship among Internal Combustion Engine Performance, Valve and Cylinder Head
Let's take the exhaust valve as an example for analysis. The thermal coupling relationship between the valve and the cylinder head is mainly on the valve seat surface [9]. If the heat transfer coefficient function
For the sealing surface of the cylinder head valve seat ring:
2.4 The Coupling Relationship among Internal Combustion Engine Performance, Piston, Piston Ring, Piston Ring Lubricant Film, and Cylinder Liner
The temperature
We use the finite difference method to solve the Reynolds lubrication equation to calculate the thickness of the lubricating oil film between the piston ring and the cylinder liner. Fig. 2 is a schematic diagram of the heat transfer and heat conduction relationship between the piston ring groove-ring-oil film-cylinder liner of an internal combustion engine.
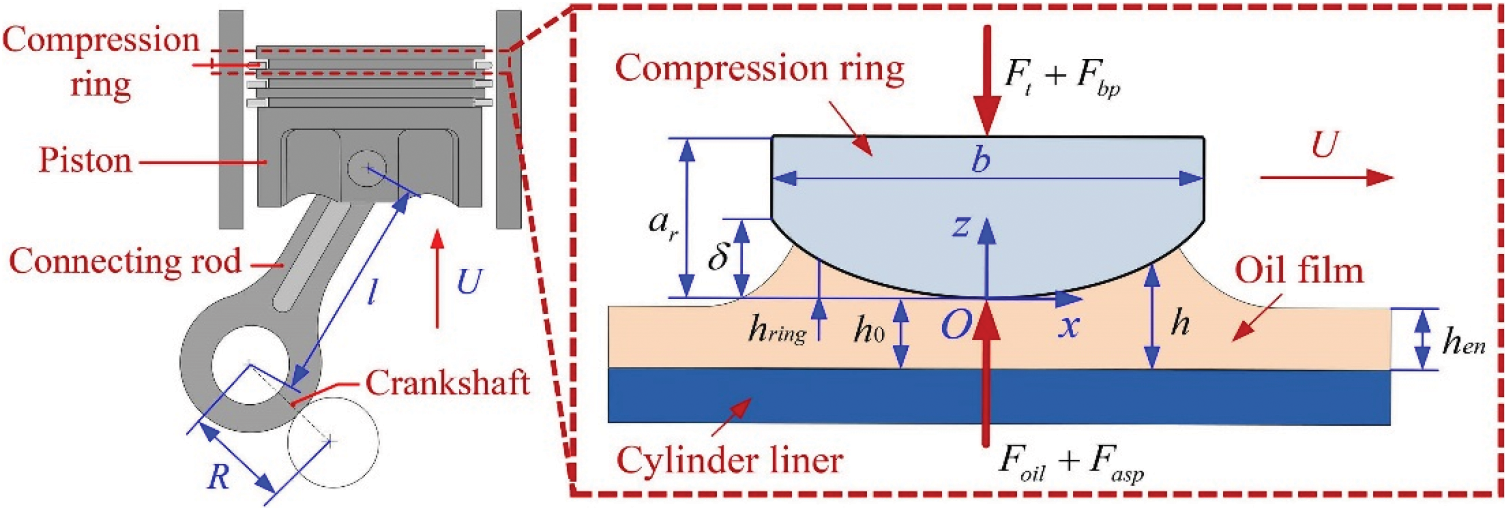
Figure 2: Coupling relationship of heat transfer and heat conduction of internal combustion engine piston ring groove-ring-oil film-cylinder liner
The coupling relationship between the bottom of the ring groove and the piston ring can adopt the first type boundary condition of complete contact. The heat transfer coefficient
2.5 Mathematical Model of Internal Combustion Engine Heat Transfer Coefficient
The mathematical model of internal combustion engine heat dissipation is based on the
In the formula:
3.1 Model-Based Optimization Design Scheme
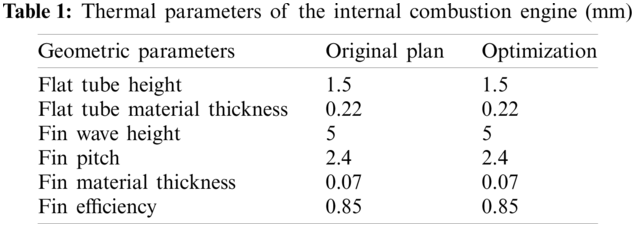
In the original scheme, the low-speed climbing engine has a low equilibrium water temperature, and the internal combustion engine has a large heat dissipation margin. Initially, the optimized size of the internal combustion engine heat dissipation core was set at 703 mm × 440 mm × 16 mm. We reduced the core thickness of internal combustion engine heat dissipation by 11 mm. The size comparison of the two schemes is shown in Table 1 [14]. We substitute the performance data and geometric dimensions of the optimized solution into the model for calculation.
3.2 Fitting of the Heat Transfer Coefficient of the Internal Combustion Engine Optimization Scheme
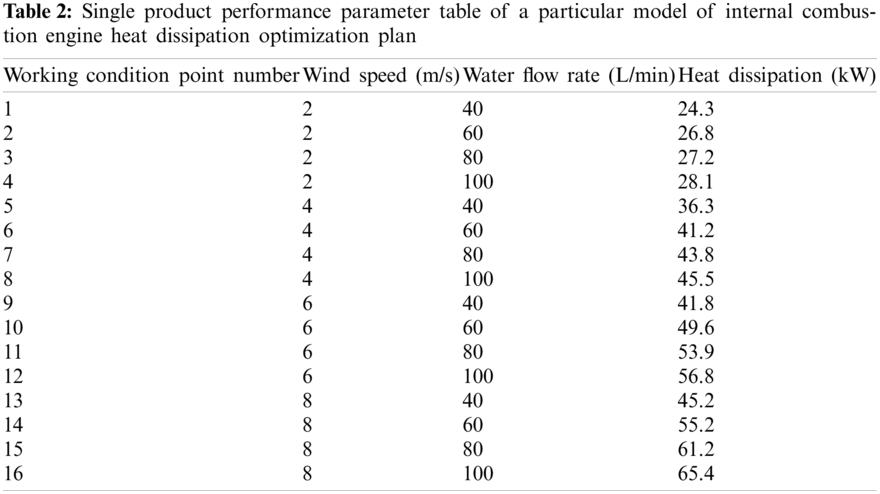
Table 2 shows the single product performance data of the internal combustion engine optimization program. The performance is tested according to national standards on the heat transfer performance test bench under the condition of a temperature difference between liquid and gas inlet of 60°C. The Nusselt number calculation formula is fitted by the performance data of the single product of the internal combustion engine heat dissipation bench test, as shown in Eqs. (20)–(23) [15]. Then calculate the simulated heat dissipation. This can be used to calculate the heat transfer in actual road conditions [16].
In the formula:
4.1 Limit Steady-State Simulation and Test Results Analysis
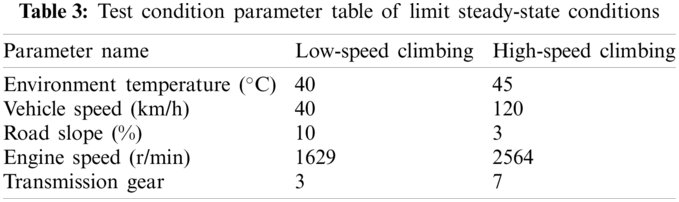
The parameters of low-speed climbing conditions and high-speed climbing conditions are shown in Table 3. The wind speed and wind temperature distribution of the internal combustion engine before the heat is dissipated are input by the 3D CFD simulation analysis results [18].
The simulation result of the equilibrium water temperature of the engine water outlet is shown in Fig. 3. The balanced water temperature at the outlet of the engine for low-speed climbing is 113.4°C, and for high-speed climbing, it is 114.8°C, which meets the design water temperature limit (115°C).
We load the new sample into a car for a ring mold test [19]. The results of the actual car test are shown in Fig. 4. In the optimized scheme, the equilibrium water temperature of the engine outlet for low-speed climbing is 113.1°C, and that for high-speed climbing is 115.0°C, which meets the design water temperature limit (115°C). The balance water temperature error of low-speed climbing is 0.26%, and the error of high-speed climbing conditions is 0.17%, indicating that the simulation results are more accurate.
Figure 3: Simulation curve of the equilibrium temperature of engine water outlet under steady-state conditions
Figure 4: Test curve of the equilibrium temperature of engine water outlet under steady-state conditions
The balance water temperature of the low-speed climbing of the new internal combustion engine heat dissipation scheme designed in the thesis has increased by 16.3°C, while meeting the design limit of 115°C. The heat dissipation quality of the internal combustion engine is reduced by 1.2 kg. This achieves the goal of reducing the heat dissipation of the internal combustion engine and the optimal cooling system performance.
4.2 Prediction Basis and Simulation of Prediction Results
The article calculates the performance and boundary conditions of the newly designed diesel engine to extrapolate and predict the heat dissipation of the whole engine and the distribution of heat dissipation of various parts. The heat dissipation of the whole machine is calculated from formulas (1) to (12). Table 4 shows the calculation results of heat dissipation adjustment of the existing 4-cylinder supercharged 290 kW diesel engine. Table 5 shows the prediction results of the heat dissipation of the newly designed 4-cylinder supercharged 360 kW diesel engine. Fig. 5 shows the results of finite element analysis to predict heat dissipation of the internal combustion engine.
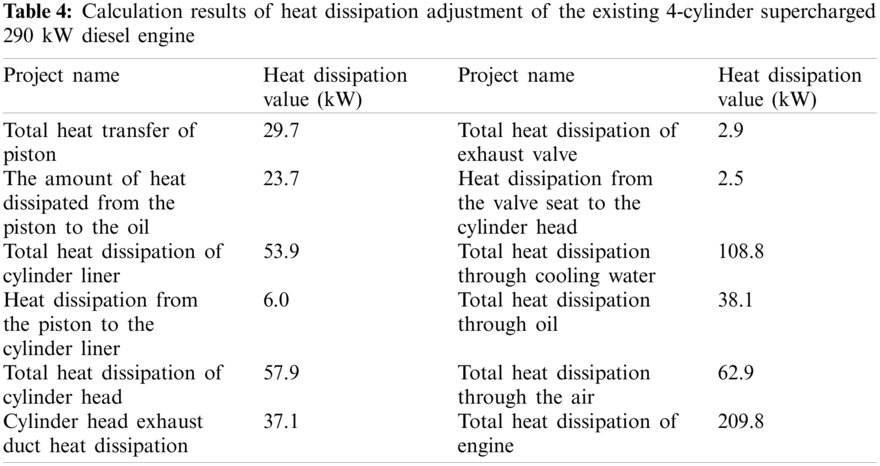
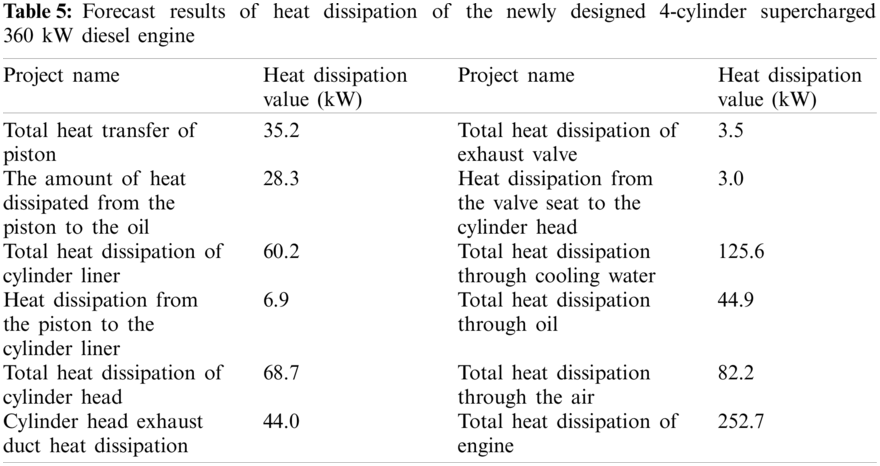
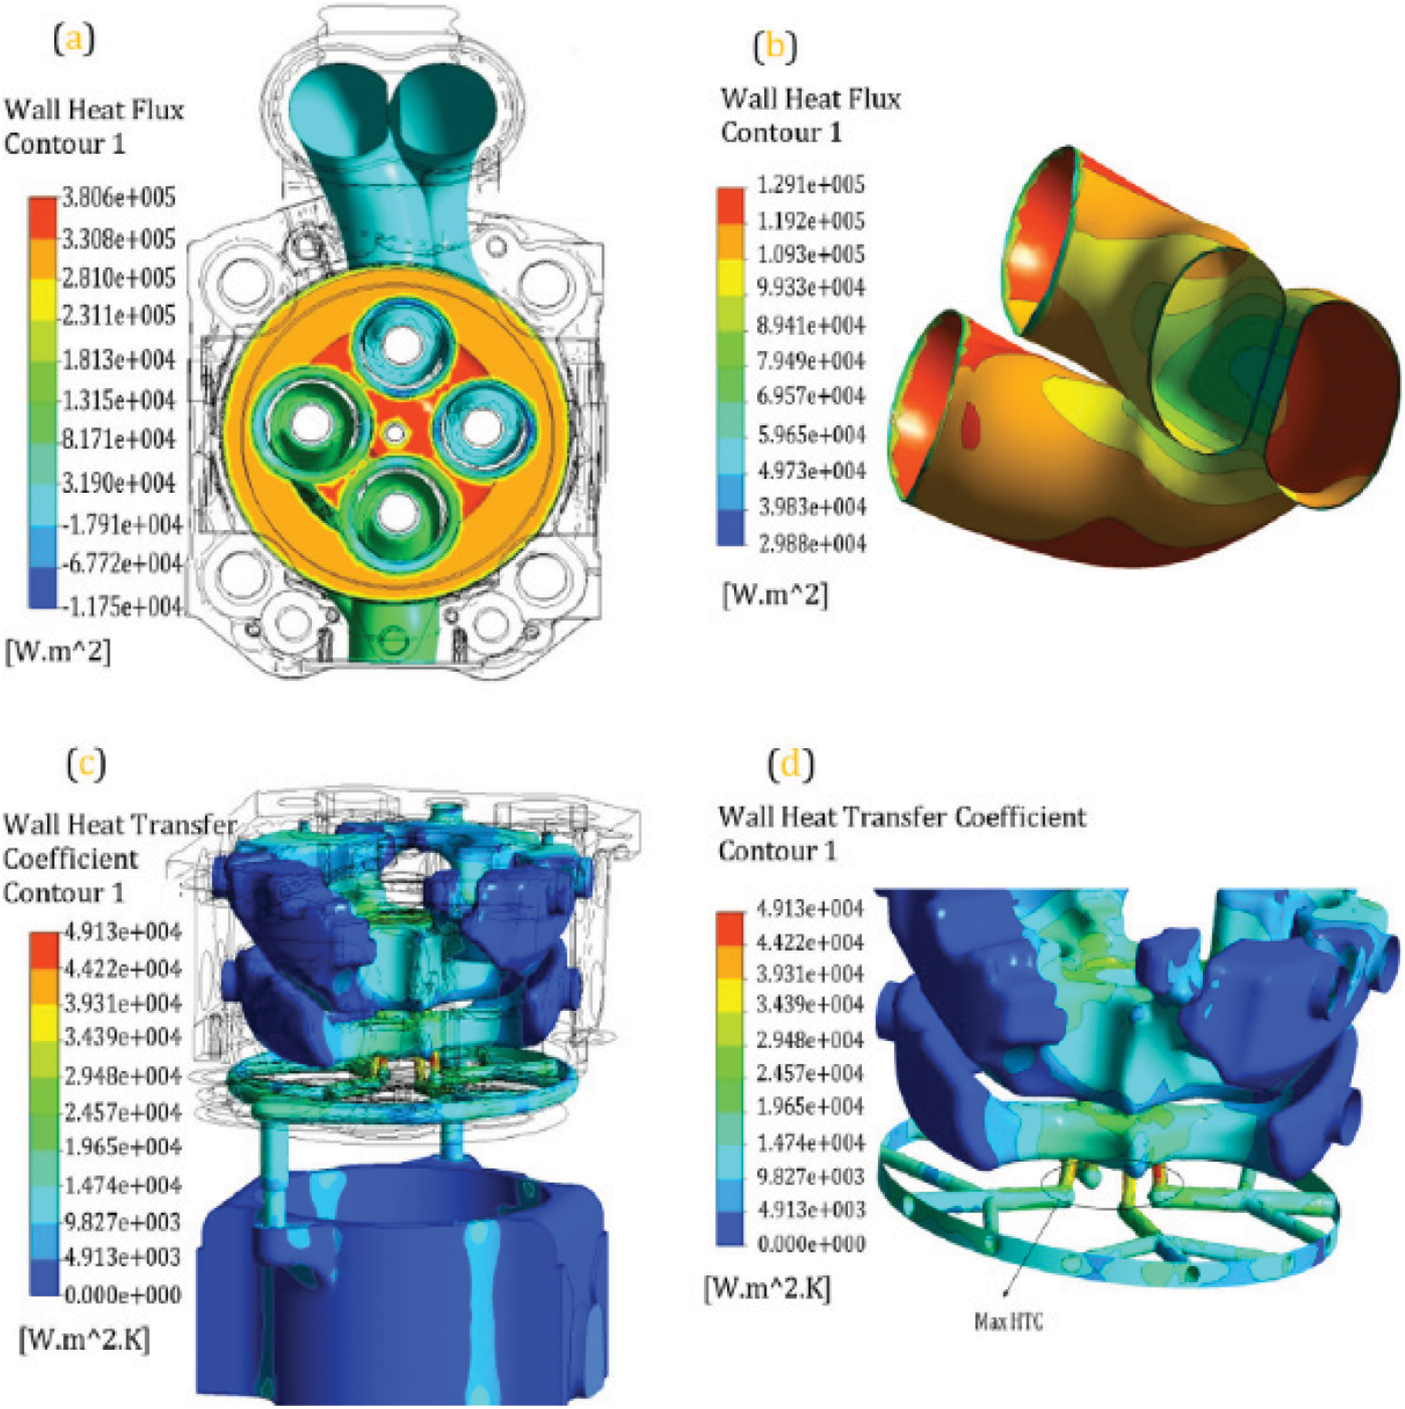
Figure 5: Finite element analysis results for the prediction of heat dissipation of the entire internal combustion engine
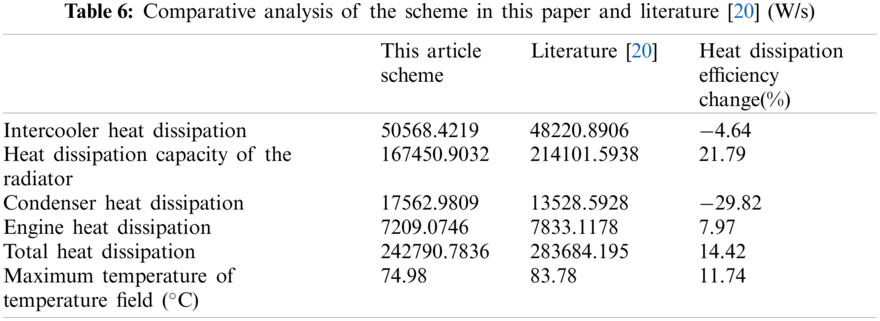
It can be seen from Table 6 that after adopting the scheme in this paper, compared with the algorithm proposed in [20]. The heat dissipation efficiency of the radiator has increased. About 20%, the heat dissipation efficiency of the entire cooling system and engine has also increased by about 15%. In the entire cooling system in the engine compartment, the intercooler and radiator are used most frequently.
In the process of predicting the heat dissipation of the whole machine, the coupling boundary conditions between the models and parts can be determined more accurately through the coupling relationship between the models and calculation iterations. This shows that the analysis model and analysis method are correct. The cooling constant of the radiator at the rated power point is lower than the design index. This shows that the selection of the parameters of the fan and the radiator matching the engine is not feasible. The maximum temperature of the engine compartment temperature field at the rated power point and the maximum torque point did not reach the maximum allowable operating temperature of the engine compartment 90°C. The maximum temperature of the air in the engine compartment is controlled within the design index value. This shows that the temperature field characteristics in the engine compartment meet the design requirements.
Funding Statement: The study was partly supported by the Grant SC2021ZX05A0013 of the Heilongjiang Province “hundred, thousand, thousand” Engineering Science and Technology Major Special Project.
Conflicts of Interest: The authors declare that they have no conflicts of interest to report regarding the present study.
1. Polat, S., Solmaz, H., Calam, A., Yilmaz, E. (2020). Estimation of the COVIMEP variation in a HCCI engine. Politeknik Dergisi, 23(3), 721–727. DOI 10.2339/politeknik.567865. [Google Scholar] [CrossRef]
2. ElBahloul, M. A., Aziz, E. S., Chassapis, C. (2019). Mechanical efficiency prediction methodology of the hypocycloid gear mechanism for internal combustion engine application. International Journal on Interactive Design and Manufacturing, 13(1), 221–233. DOI 10.1007/s12008-018-0508-2. [Google Scholar] [CrossRef]
3. ElBahloul, M. A., Aziz, E. S., Chassapis, C. (2021). Performance study of the hypocycloid gear mechanism for internal combustion engine applications. International Journal of Engine Research, 22(4), 1222–1238. DOI 10.1177/1468087419893583. [Google Scholar] [CrossRef]
4. Luján, J. M., Dolz, V., Monsalve-Serrano, J., Bernal Maldonado, M. A. (2021). High-pressure exhaust gas recirculation line condensation model of an internal combustion diesel engine operating at cold conditions. International Journal of Engine Research, 22(2), 407–416. DOI 10.1177/1468087419868026. [Google Scholar] [CrossRef]
5. Zhu, H., Zhang, Y., Liu, F., Wei, W. (2020). Effect of excess hydrogen on hydrogen fueled internal combustion engine under full load. International Journal of Hydrogen Energy, 45(39), 20419–20425. DOI 10.1016/j.ijhydene.2019.12.022. [Google Scholar] [CrossRef]
6. Pla, B., de la Morena, J., Bares, P., Jiménez, I. (2020). Cycle-to-cycle combustion variability modelling in spark ignited engines for control purposes. International Journal of Engine Research, 21(8), 1398–1411. DOI 10.1177/1468087419885754. [Google Scholar] [CrossRef]
7. Wang, X., Sun, B. G., Luo, Q. H. (2019). Energy and exergy analysis of a turbocharged hydrogen internal combustion engine. International Journal of Hydrogen Energy, 44(11), 5551–5563. DOI 10.1016/j.ijhydene.2018.10.047. [Google Scholar] [CrossRef]
8. Malé, Q., Staffelbach, G., Vermorel, O., Misdariis, A., Ravet, F. et al. (2019). Large eddy simulation of pre-chamber ignition in an internal combustion engine. Flow, Turbulence and Combustion, 103(2), 465–483. DOI 10.1007/s10494-019-00026-y. [Google Scholar] [CrossRef]
9. Li, Y., Gao, W., Zhang, P., Ye, Y., Wei, Z. (2019). Effects study of injection strategies on hydrogen-air formation and performance of hydrogen direct injection internal combustion engine. International Journal of Hydrogen Energy, 44(47), 26000–26011. DOI 10.1016/j.ijhydene.2019.08.055. [Google Scholar] [CrossRef]
10. Gainey, B., Longtin, J. P., Lawler, B. (2019). A guide to uncertainty quantification for experimental engine research and heat release analysis. SAE International Journal of Engines, 12(5), 509–290. DOI 10.4271/03-12-05-0033. [Google Scholar] [CrossRef]
11. Thawko, A., Yadav, H., Eyal, A., Shapiro, M., Tartakovsky, L. (2019). Particle emissions of direct injection internal combustion engine fed with a hydrogen-rich reformate. International Journal of Hydrogen Energy, 44(52), 28342–28356. DOI 10.1016/j.ijhydene.2019.09.062. [Google Scholar] [CrossRef]
12. Zhu, H., Duan, J. (2019). Research on emission characteristics of hydrogen fuel internal combustion engine based on more detailed mechanism. International Journal of Hydrogen Energy, 44(11), 5592–5598. DOI 10.1016/j.ijhydene.2018.08.044. [Google Scholar] [CrossRef]
13. Franken, T., Klauer, C., Kienberg, M., Matrisciano, A., Mauss, F. (2020). Prediction of thermal stratification in an engine-like geometry using a zero-dimensional stochastic reactor model. International Journal of Engine Research, 21(9), 1750–1763. DOI 10.1177/1468087418824217. [Google Scholar] [CrossRef]
14. Liu, X., Reddi, K., Elgowainy, A., Lohse-Busch, H., Wang, M. et al. (2020). Comparison of well-to-wheels energy use and emissions of a hydrogen fuel cell electric vehicle relative to a conventional gasoline-powered internal combustion engine vehicle. International Journal of Hydrogen Energy, 45(1), 972–983. DOI 10.1016/j.ijhydene.2019.10.192. [Google Scholar] [CrossRef]
15. Rajak, U., Verma, T. N. (2020). Influence of combustion and emission characteristics on a compression ignition engine from a different generation of biodiesel. Engineering Science and Technology, an International Journal, 23(1), 10–20. DOI 10.1016/j.jestch.2019.04.003. [Google Scholar] [CrossRef]
16. Han, D., Zhai, J., Huang, Z. (2019). Autoignition of n-hexane, cyclohexane, and methylcyclohexane in a constant volume combustion chamber. Energy & Fuels, 33(4), 3576–3583. DOI 10.1021/acs.energyfuels.9b00003. [Google Scholar] [CrossRef]
17. Nigay, N. A., Kuznetsov, G. V., Syrodoy, S. V., Gutareva, N. Y. (2020). Estimation of energy consumption for drying of forest combustible materials during their preparation for incineration in the furnaces of steam and hot water boilers. Energy Sources, Part A: Recovery, Utilization, and Environmental Effects, 42(16), 1997–2005. DOI 10.1080/15567036.2019.1604910. [Google Scholar] [CrossRef]
18. Arat, H. T. (2019). Alternative fuelled hybrid electric vehicle (AF-HEV) with hydrogen enriched internal combustion engine. International Journal of Hydrogen Energy, 44(34), 19005–19016. DOI 10.1016/j.ijhydene.2018.12.219. [Google Scholar] [CrossRef]
19. Namar, M. M., Jahanian, O. (2019). Energy and exergy analysis of a hydrogen-fueled HCCI engine. Journal of Thermal Analysis and Calorimetry, 137(1), 205–215. DOI 10.1007/s10973-018-7910-7. [Google Scholar] [CrossRef]
20. Piscaglia, F., Onorati, A., Marelli, S., Capobianco, M. (2019). A detailed one-dimensional model to predict the unsteady behavior of turbocharger turbines for internal combustion engine applications. International Journal of Engine Research, 20(3), 327–349. DOI 10.1177/1468087417752525. [Google Scholar] [CrossRef]
 | This work is licensed under a Creative Commons Attribution 4.0 International License, which permits unrestricted use, distribution, and reproduction in any medium, provided the original work is properly cited. |