| Energy Engineering |
DOI: 10.32604/ee.2022.019118
ARTICLE
A New Proximity Indicator for Assessment of Voltage Stability and Critical Loadability Point
Department of Electrical Engineering, Ujjain Engineering College, Ujjain, India
*Corresponding Author: Chandrakant Dondariya. Email: parth.ckd@uecu.ac.in
Received: 04 September 2021; Accepted: 22 November 2021
Abstract: This paper presents a newly developed proximity indicator for voltage stability assessment which can be used to predict critical real system load and voltages at various load buses at critical loading point. The proximity indicator varies almost parabolic with total real load demand and reaches orthogonally to real load axis. This relation has been utilized to predict critical loading point. It has been shown that two operating points are needed for estimating critical point and proper selection of operating points and variation of proximity indicator near collapse point highly affect the accuracy of estimation. Simulation is based on load flow equations and system real and reactive loadings have been increased in proportion with base case scenario for IEEE 14 and IEEE 25 bus test systems to demonstrate the behaviour of proposed proximity indicator. CPF has been used as benchmark to check the accuracy of estimation.
Keywords: Voltage stability; voltage collapse; proximity indicator; critical loading; CPF
Abbreviations & Symbols
| VSM | Voltage stability margin |
| Substitution error function | |
| PI | Proximity Indicator |
| Total real system demand | |
| Total real demand at critical loading point | |
| Critical value of ith bus | |
| CPF | Continuation Power Flow |
Transmission of bulk power over long distances using existing network has forced power systems to operate closed to their extreme capabilities. This causes heavy stress even in mature systems and leads to voltage instability. It is always required to have control over voltage in system operation especially when the system is stressed. Voltage stability problem is load driven and considered as a major threat to power system security. Static voltage stability analysis is used to assess the margin to voltage instability and also to identify weak buses and lines of any system. It helps system planners and operators to identify voltage instability prone areas of the system where attention is needed and also to exercise corrective actions to maintain suitable real and reactive margins in case of heavy loading conditions. Real and reactive power transfer from generators to load buses is the main focus of voltage stability analysis. Continuous monitoring of the system status and fast and accurate determination of proximity to voltage collapse point is a necessary requirement to prevent voltage instability.
In static analysis, power flow simulations have been carried out with various loading conditions. The analysis checks the real and reactive power flows and voltages at various load buses when the system loading has been increased up to critical loading. Static voltage stability may be direct or indirect. P-V and V-Q curves are widely used as a fundamental tool to assess the voltage stability margin (VSM) at any operating point [1]. These curves give direct insight about the voltage stability standing at any load bus. But this needs repetitive simulations and hence significant computational time. Various researchers have proposed indirect static techniques for voltage stability assessment and estimating maximum loadability point. CPF has been a very powerful tool in static voltage stability studies and simulation studies often take reference to results as obtained by CPF [2,3].
Load flow Jacobian which is available at the end of Newton Rapson power flow convergence, contains many useful information about voltage stability and hence it has been area of interest for many researchers. It is well established that Jacobian becomes singular at collapse point [4]. The minimum magnitude of the eigen values of the power flow jacobian matrix is zero at this point [5]. Accurate prediction of collapse point is not possible with these methods because they show very nonlinear behaviour near the critical point [6]. Some researchers have used test functions based on load flow Jacobian for assessment of voltage stability margin by predicting the voltage collapse point using quadratic model [7,8]. Test functions show more reliability than eigen/singular value of Jacobian matrix [9].
In order to have fast and accurate estimation of voltage collapse point, many researchers have proposed various voltage stability indices. A voltage stability index with inverse Jacobian matrix has been proposed in [7], which can be used to estimate voltage stability margin due to its linear behaviour. Maximum elements of system tangent vector has been used in [10] as voltage stability index. When the system is stressed, inverse of the maximum element of tangent vector becomes zero at collapse point. This index can also be used to estimate maximum loadability point [11]. Some researchers have used bus voltages and elements of admittance matrix for checking the system status [12]. Thevenin.s equivalent impedance to load impedances ratio has been taken as proximity indicator by [13], Energy functions have also been considered for estimation of critical power point [14,15]. Tangential angle based voltage stability indicator suitable to complex load models has also been proposed. It can be used for both measurement and model based voltage stability assessment [16]. Artificial neural network based techniques have also been proposed for voltage stability assessment [17]. Bus impedance matrix has also been used for static voltage stability assessment by reducing it to equivalent two bus model [18]. Some authors proposed two bus equivalent system based computation algorithms for assessing active and reactive power limits for voltage stability [19]. PMU measurement based estimation of voltage stability margin has also been proposed [20]. Generalized voltage stability indicator based on tangential angles of PV curves has also been proposed considering voltage dependent load model [21].
Continuous monitoring of the system status and fast and accurate determination of proximity to voltage collapse point is a necessary requirement to prevent voltage instability. Various researchers have proposed proximity indicators based on load flow Jacobian [4,5,8], Many techniques for the prediction of critical point and maximum loadability margins have also been proposed. It has been established that behavior of proximity indicator near the critical point is the key parameter for accurate estimation of critical point. Linear and parabolic plots of proximity indicator with respect to total real power are in preference for such estimations [8].
The objective of the presented research is to develop a methodology for estimation of critical loading point based on a new proximity index and to investigate accuracy of proposed algorithm.
In static analysis, solution of these of linearised load flow equation is obtained by iterative techniques. It provides a solution in stable operating region. Ill-conditioning of Jacobian based linearised load flowequation results in falling to obtain solution in the stable region. This fact has been utilised for the development of a load flow equations based proximity indicator and the proposed algorithm to investigate voltage stability.
3.1 Derivation of Proposed Proximity Indicator
Consider a set of n linear homogenous equations for
Such that
If
In Eq. (1), Let
Excluding
Now,
If
And
The substitution error function
It can be seen that if
The concept is applied to load flow Jacobian
Jacobian is computed in N-R load flow solution when the load flow is converged to final solution.
Let
At solution point, we get linearised power flow equation as
When the system is stressed up to critical loading, one of the eigen value of load flow jacobian becomes zero and the Jacobian becomes singular.
The substitution error function
Hence this function has been taken as proximity indicator for system wise assessment of voltage stability.
As
3.2 Estimation of Critical System Load and Knee Voltage at Load Bus
As discussed earlier, the magnitude of function
where
Let us assume that two system loading conditions are available in stable equilibrium region
Further, the
Eqs. (8) and (9) provide the loading condition at critical loading point. It has been shown that the selection of loading condition
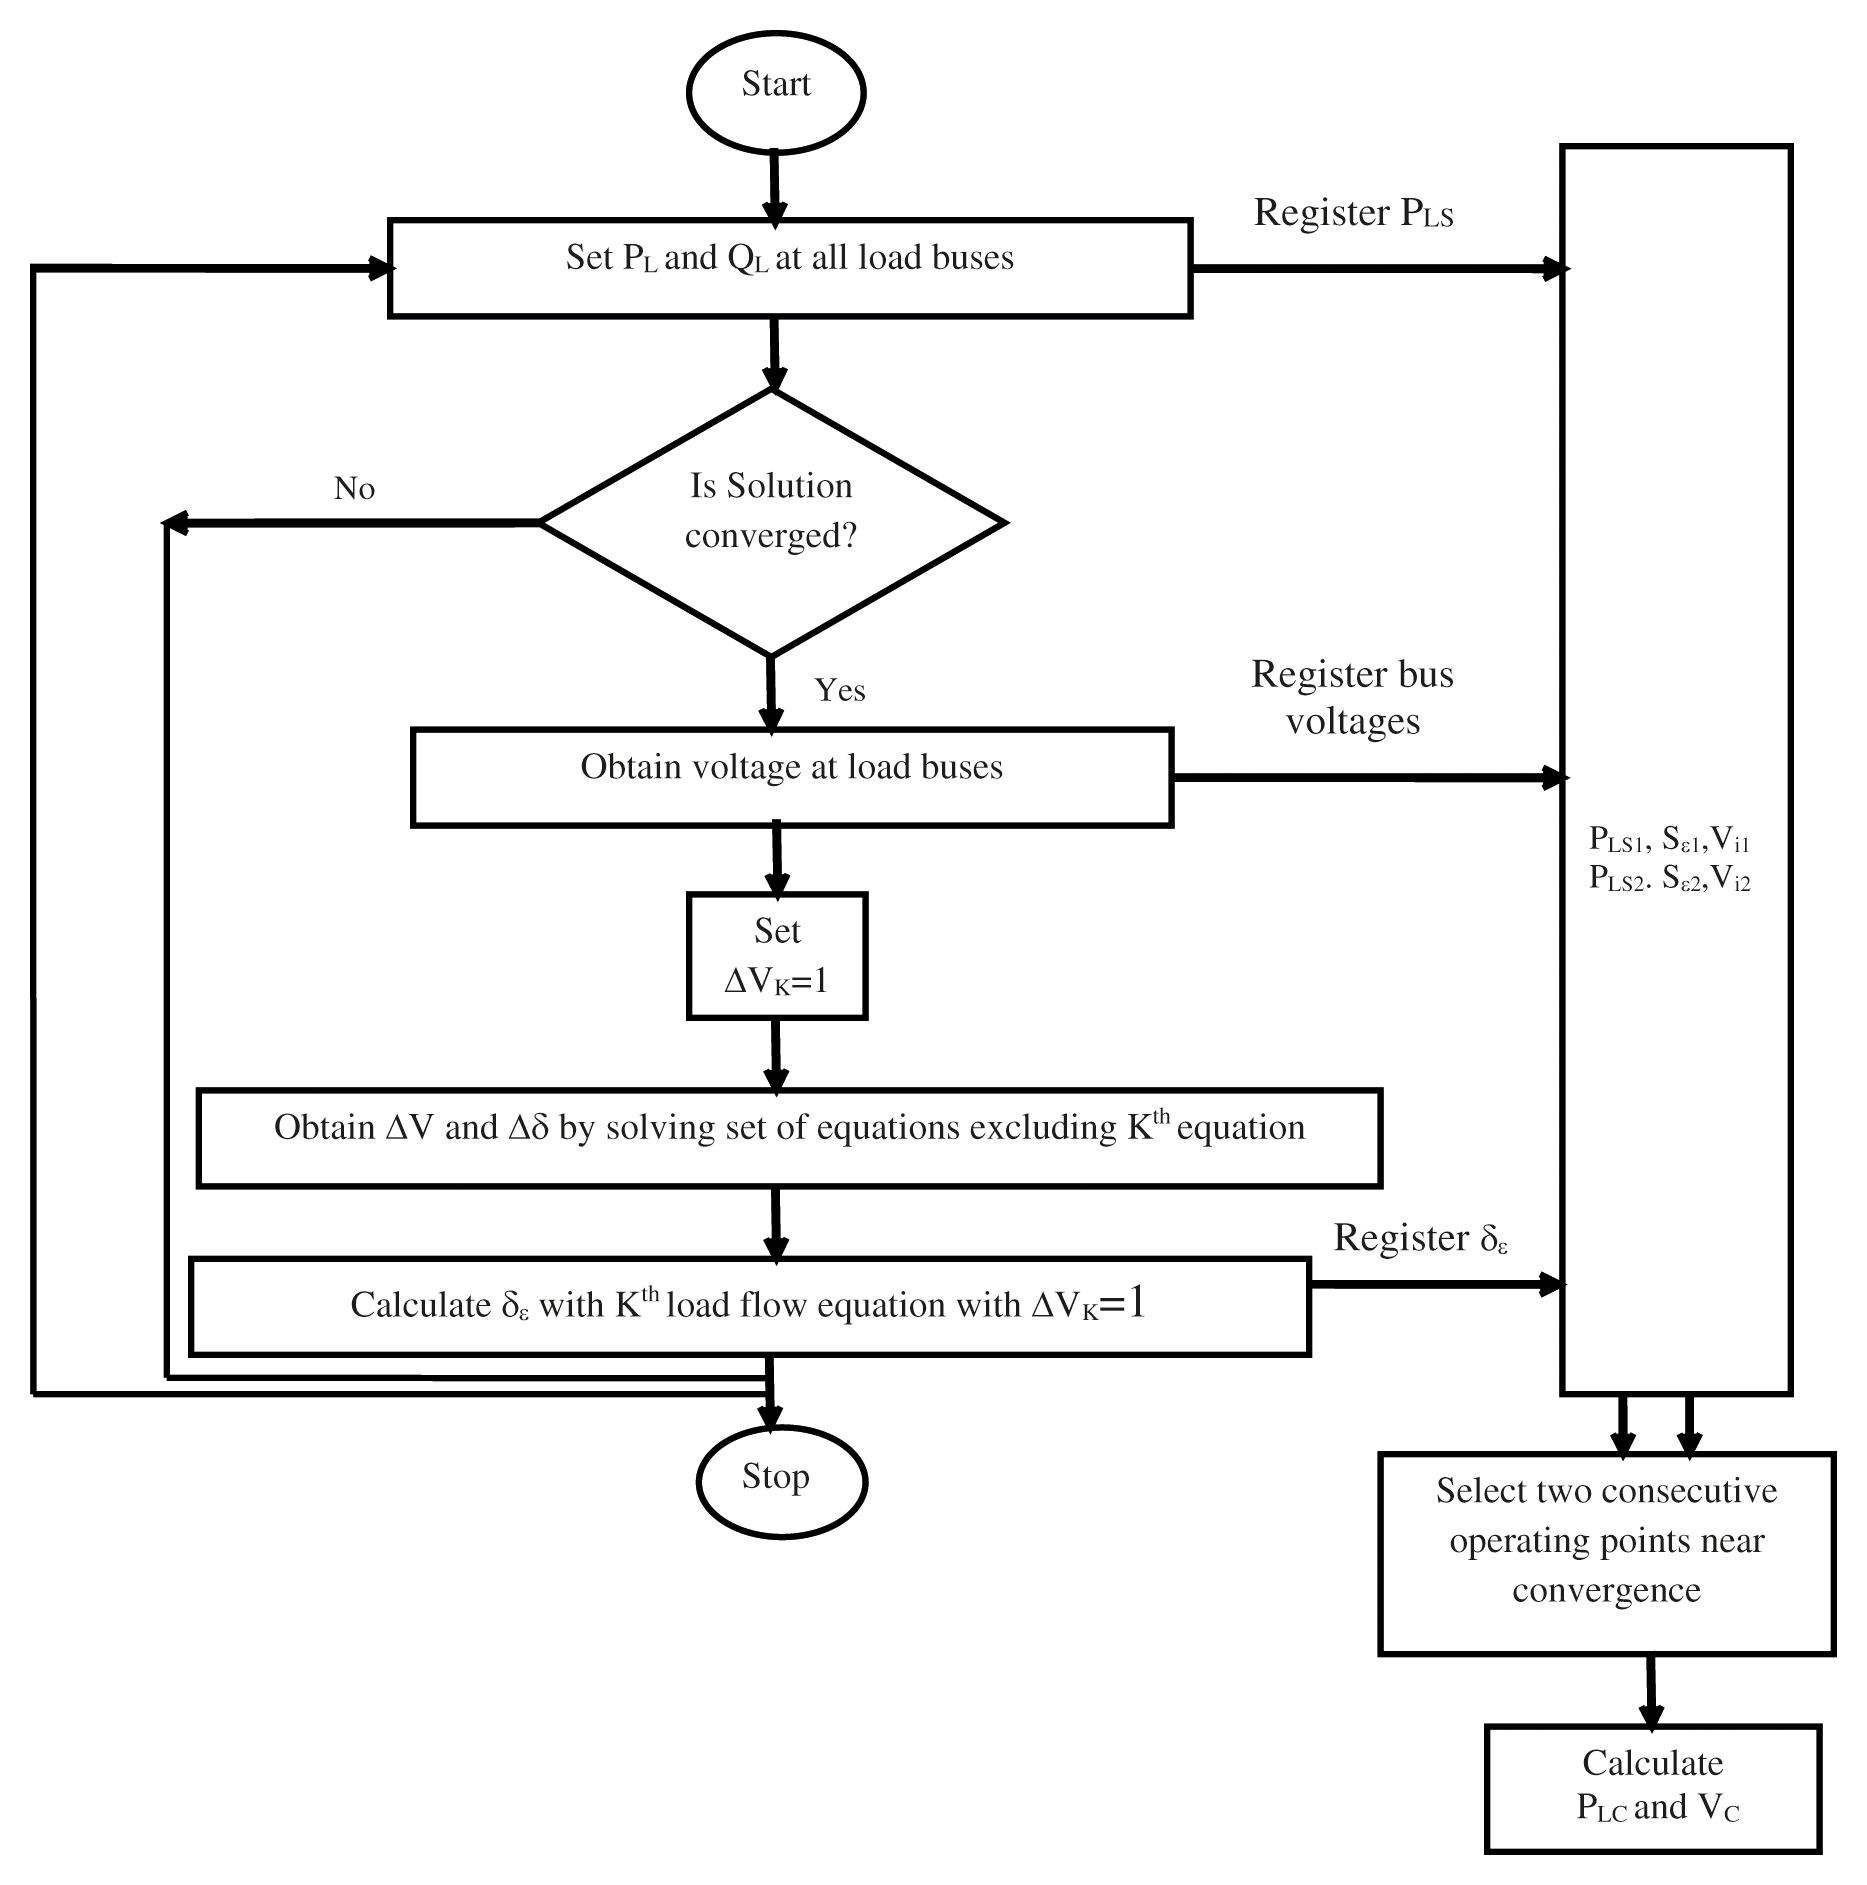
Figure 1: Flow chart for estimating critical loading point
The developed algorithm has been used to estimate the critical loading point for IEEE 14 bus and IEEE 25 bus test systems [22]. Voltages at each generator bus are set to 1.0 pu. Real and reactive at all load buses have been increased in proportion to base case loading.
The first operating condition is taken as half of base case loading to demonstrate the importance of selection of two loading conditions for enhancing accuracy of estimation of SNBP.
Table 1 shows the variation in proposed proximity indicator and voltage magnitudes of various load buses at various loading conditions for IEEE 14 bus system. As the system is stressed maintaining constant power factor at all load buses, the value of proximity indicator decreases and becomes almost zero near the critical loading condition. It is clear that bus no. 14 has minimum voltage as the proximity indicator approaches to zero. Hence it is the most critical bus from voltage stability viewpoint and needs special attention. Fig. 2 shows the plot of proposed proximity indicator with real system demand ‘PLS’. The curve is almost orthogonal near the critical loading. The variation of voltage magnitude of most critical bus is also shown in the same figure for better insight.
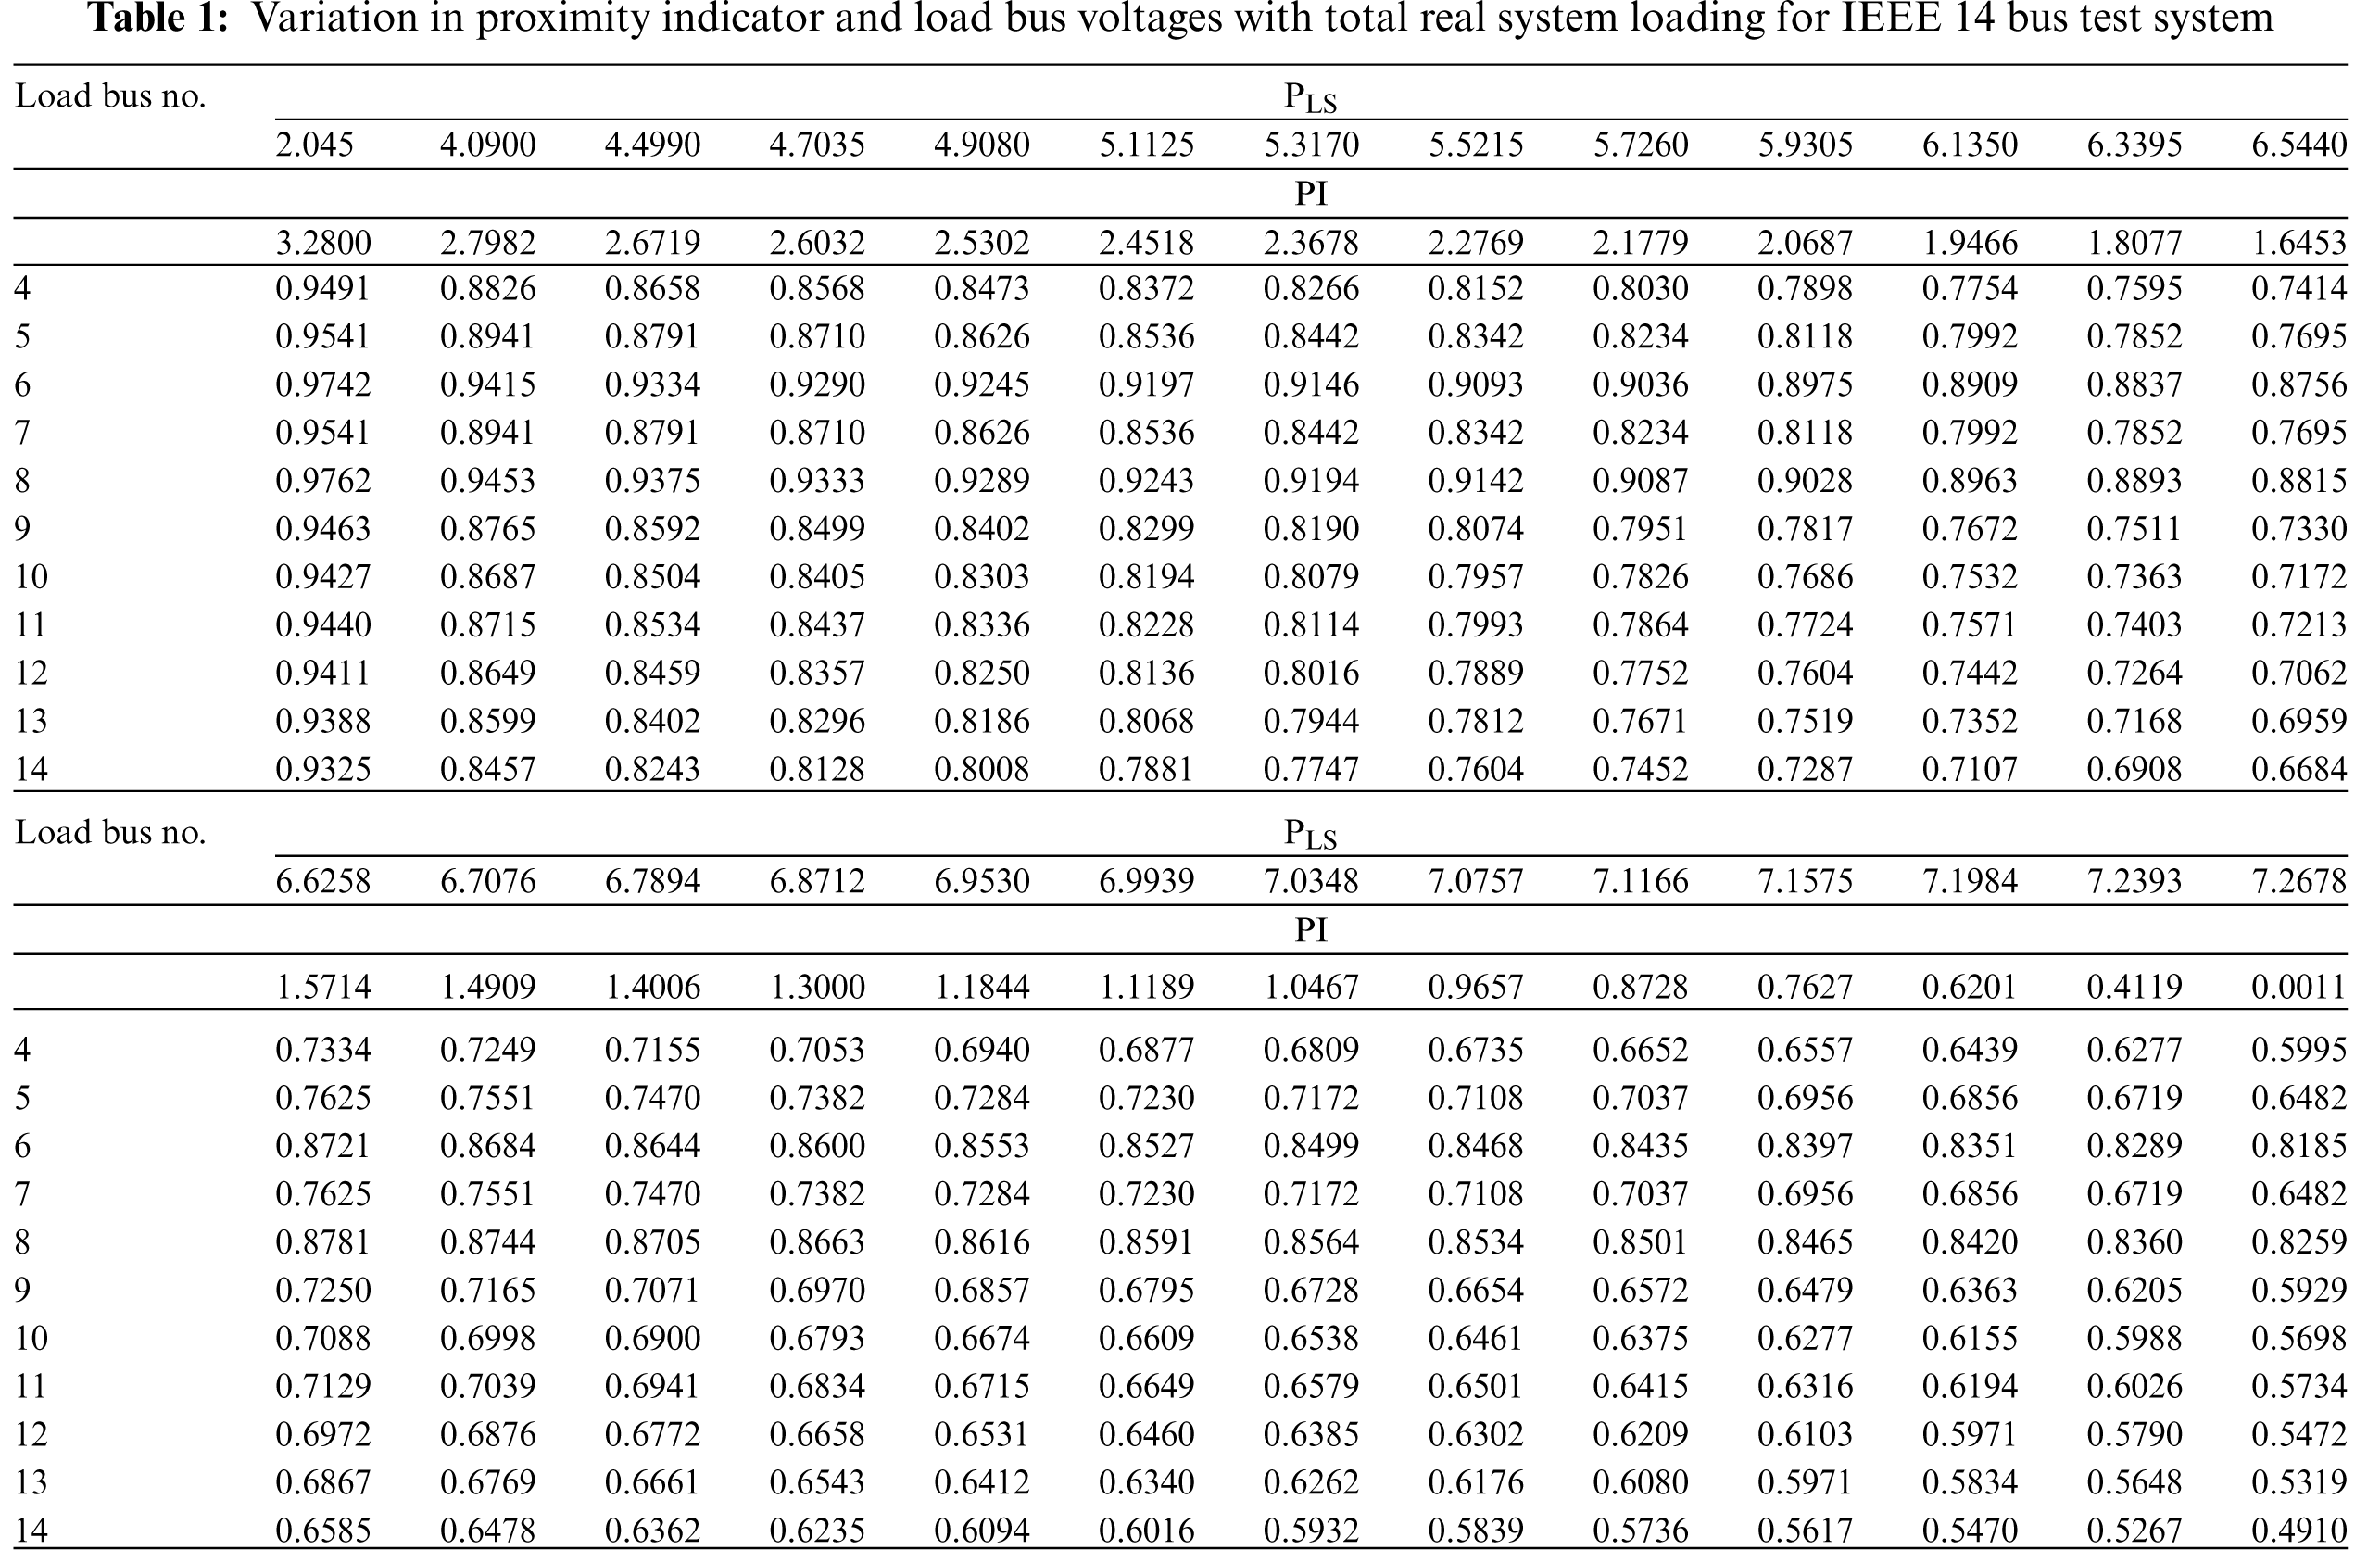
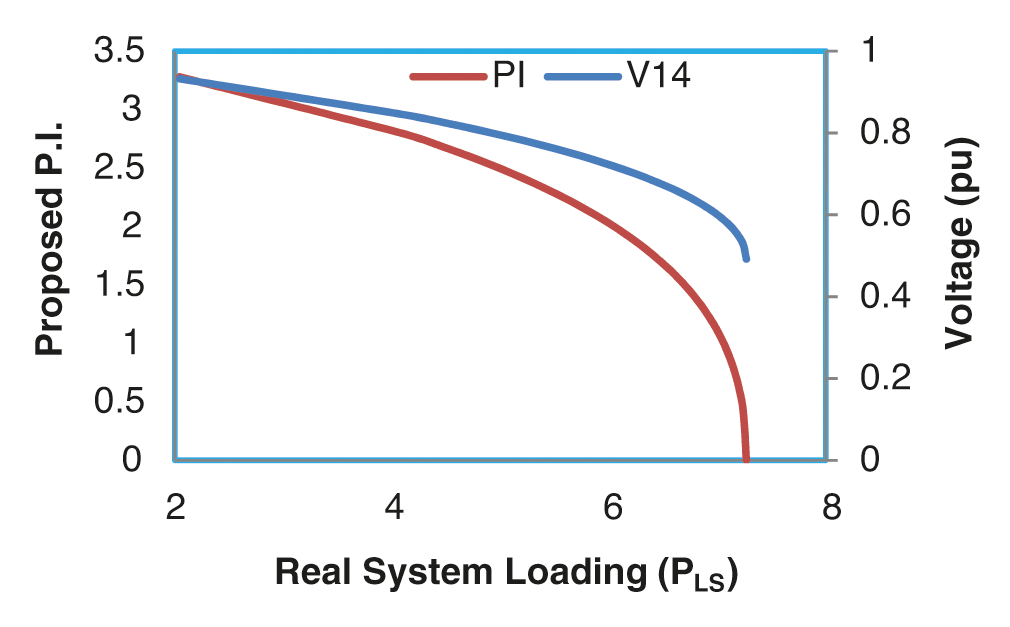
Figure 2: Variation in proximity indicator and voltage V14 with total real system load for IEEE 14 bus test system
As discussed, the proposed proximity indicator has been used to estimate the critical loading point of the system. Table 3 shows the values of proximity indicator and voltage magnitude of bus no.14, which is the weakest bus. Two loading conditions are needed to estimate critical loading point for the system. According to [3], which uses CPF method to obtain critical loading condition for IEEE 14 bus test system, suggests that the maximum PLS is 7.3029 and the knee voltage of bus no. 14 is 0.5145. These values have been taken as reference to assess the accuracy of proposed method [3].
As shown in Table 3, two consecutive operating points have been taken to predict maximum loadability point. Percentage errors to estimation are also shown in the Table. It has been found that the accuracy is increased when operating points are taken near to critical loading. Minimum error in estimating maximum real system loading is obtained with loading corresponds to points 20 and 21 and the percentage error is 0.05. Maximum load is estimated as 7.2990 which is very close to that as obtained from CPF. It is also interesting to note that if we take two operating points as 1 and 26, the maximum loadability is calculated as 7.2676 and the percentage error is less than 0.5. These are two loading extremes considered for simulation. Voltage of bus no. 14 has also been estimated based on proposed proximity indicator. Minimum percentage error in estimating voltage at bus no. 14 is 0.74 and the closest value of voltage V14 is 0.5107. If half of base case loading point (point 1) and the extreme point near critical point (point 26) have been selected, the percentage error in estimating V14 is less than 5%.
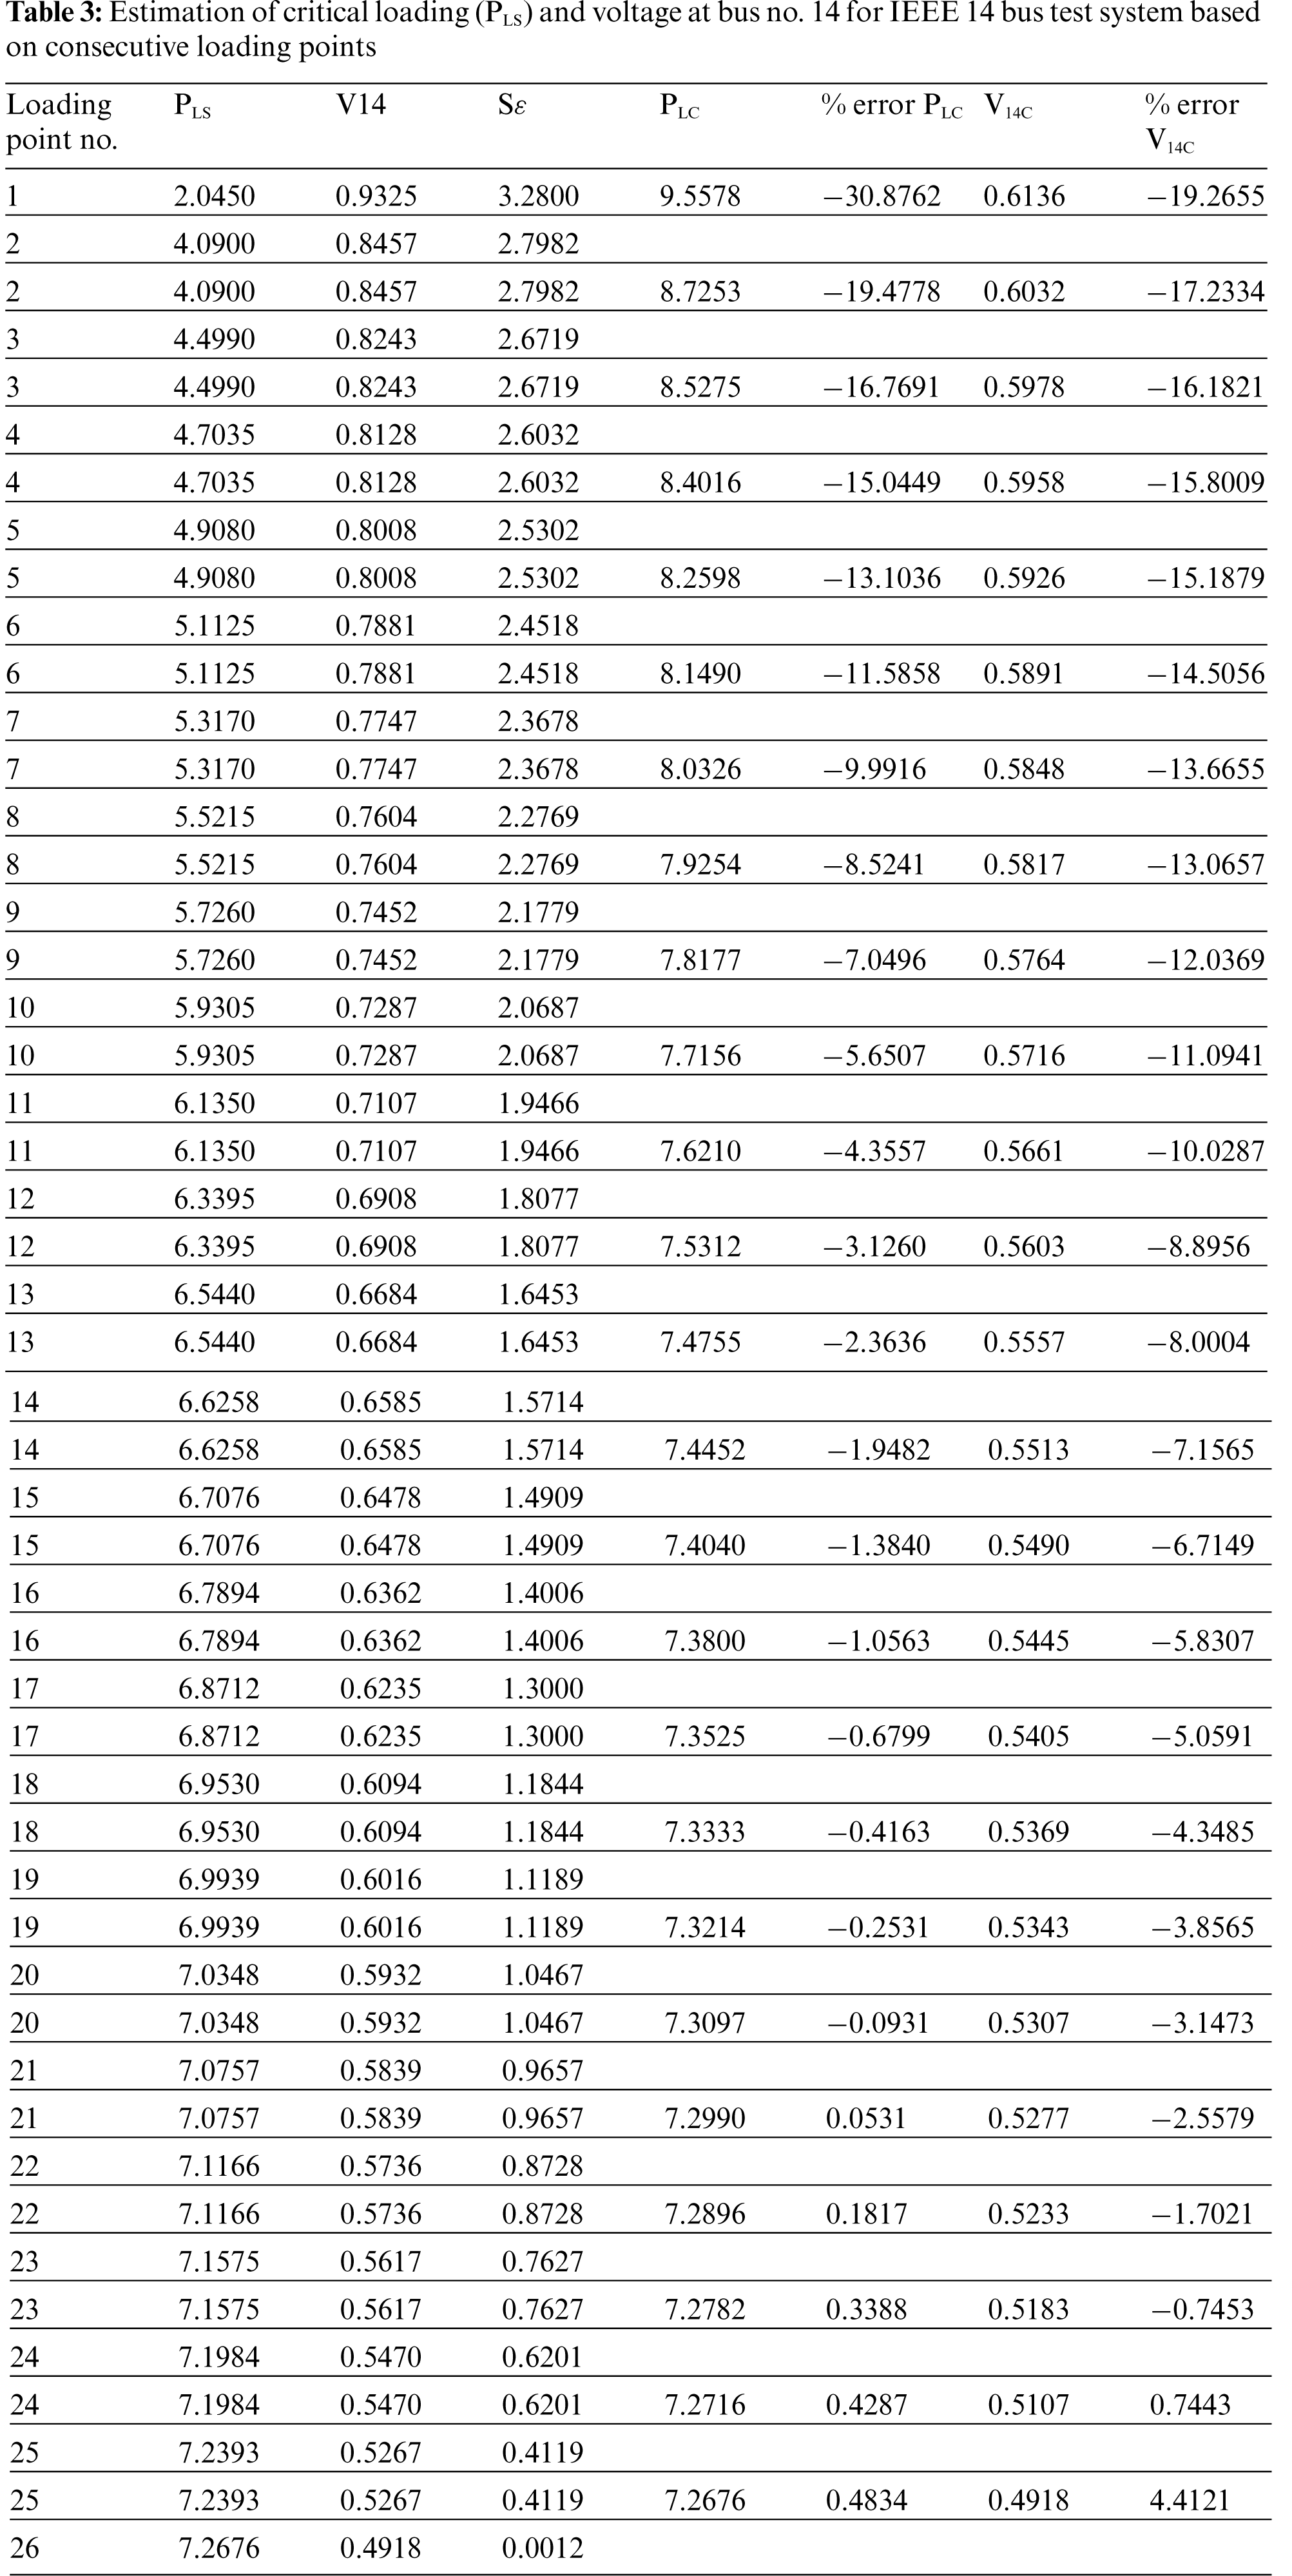
Table 2 shows the variation in proximity indicator and load bus voltages at various loading conditions for IEEE 25 bus system. Real and reactive loads have been increased at all load buses in proportion to base case loading from half of base case load (point 1) till the solution is converged (point 30). Bus no. 24 is identified as weakest bus as it has lowest voltages as the system load is increased.
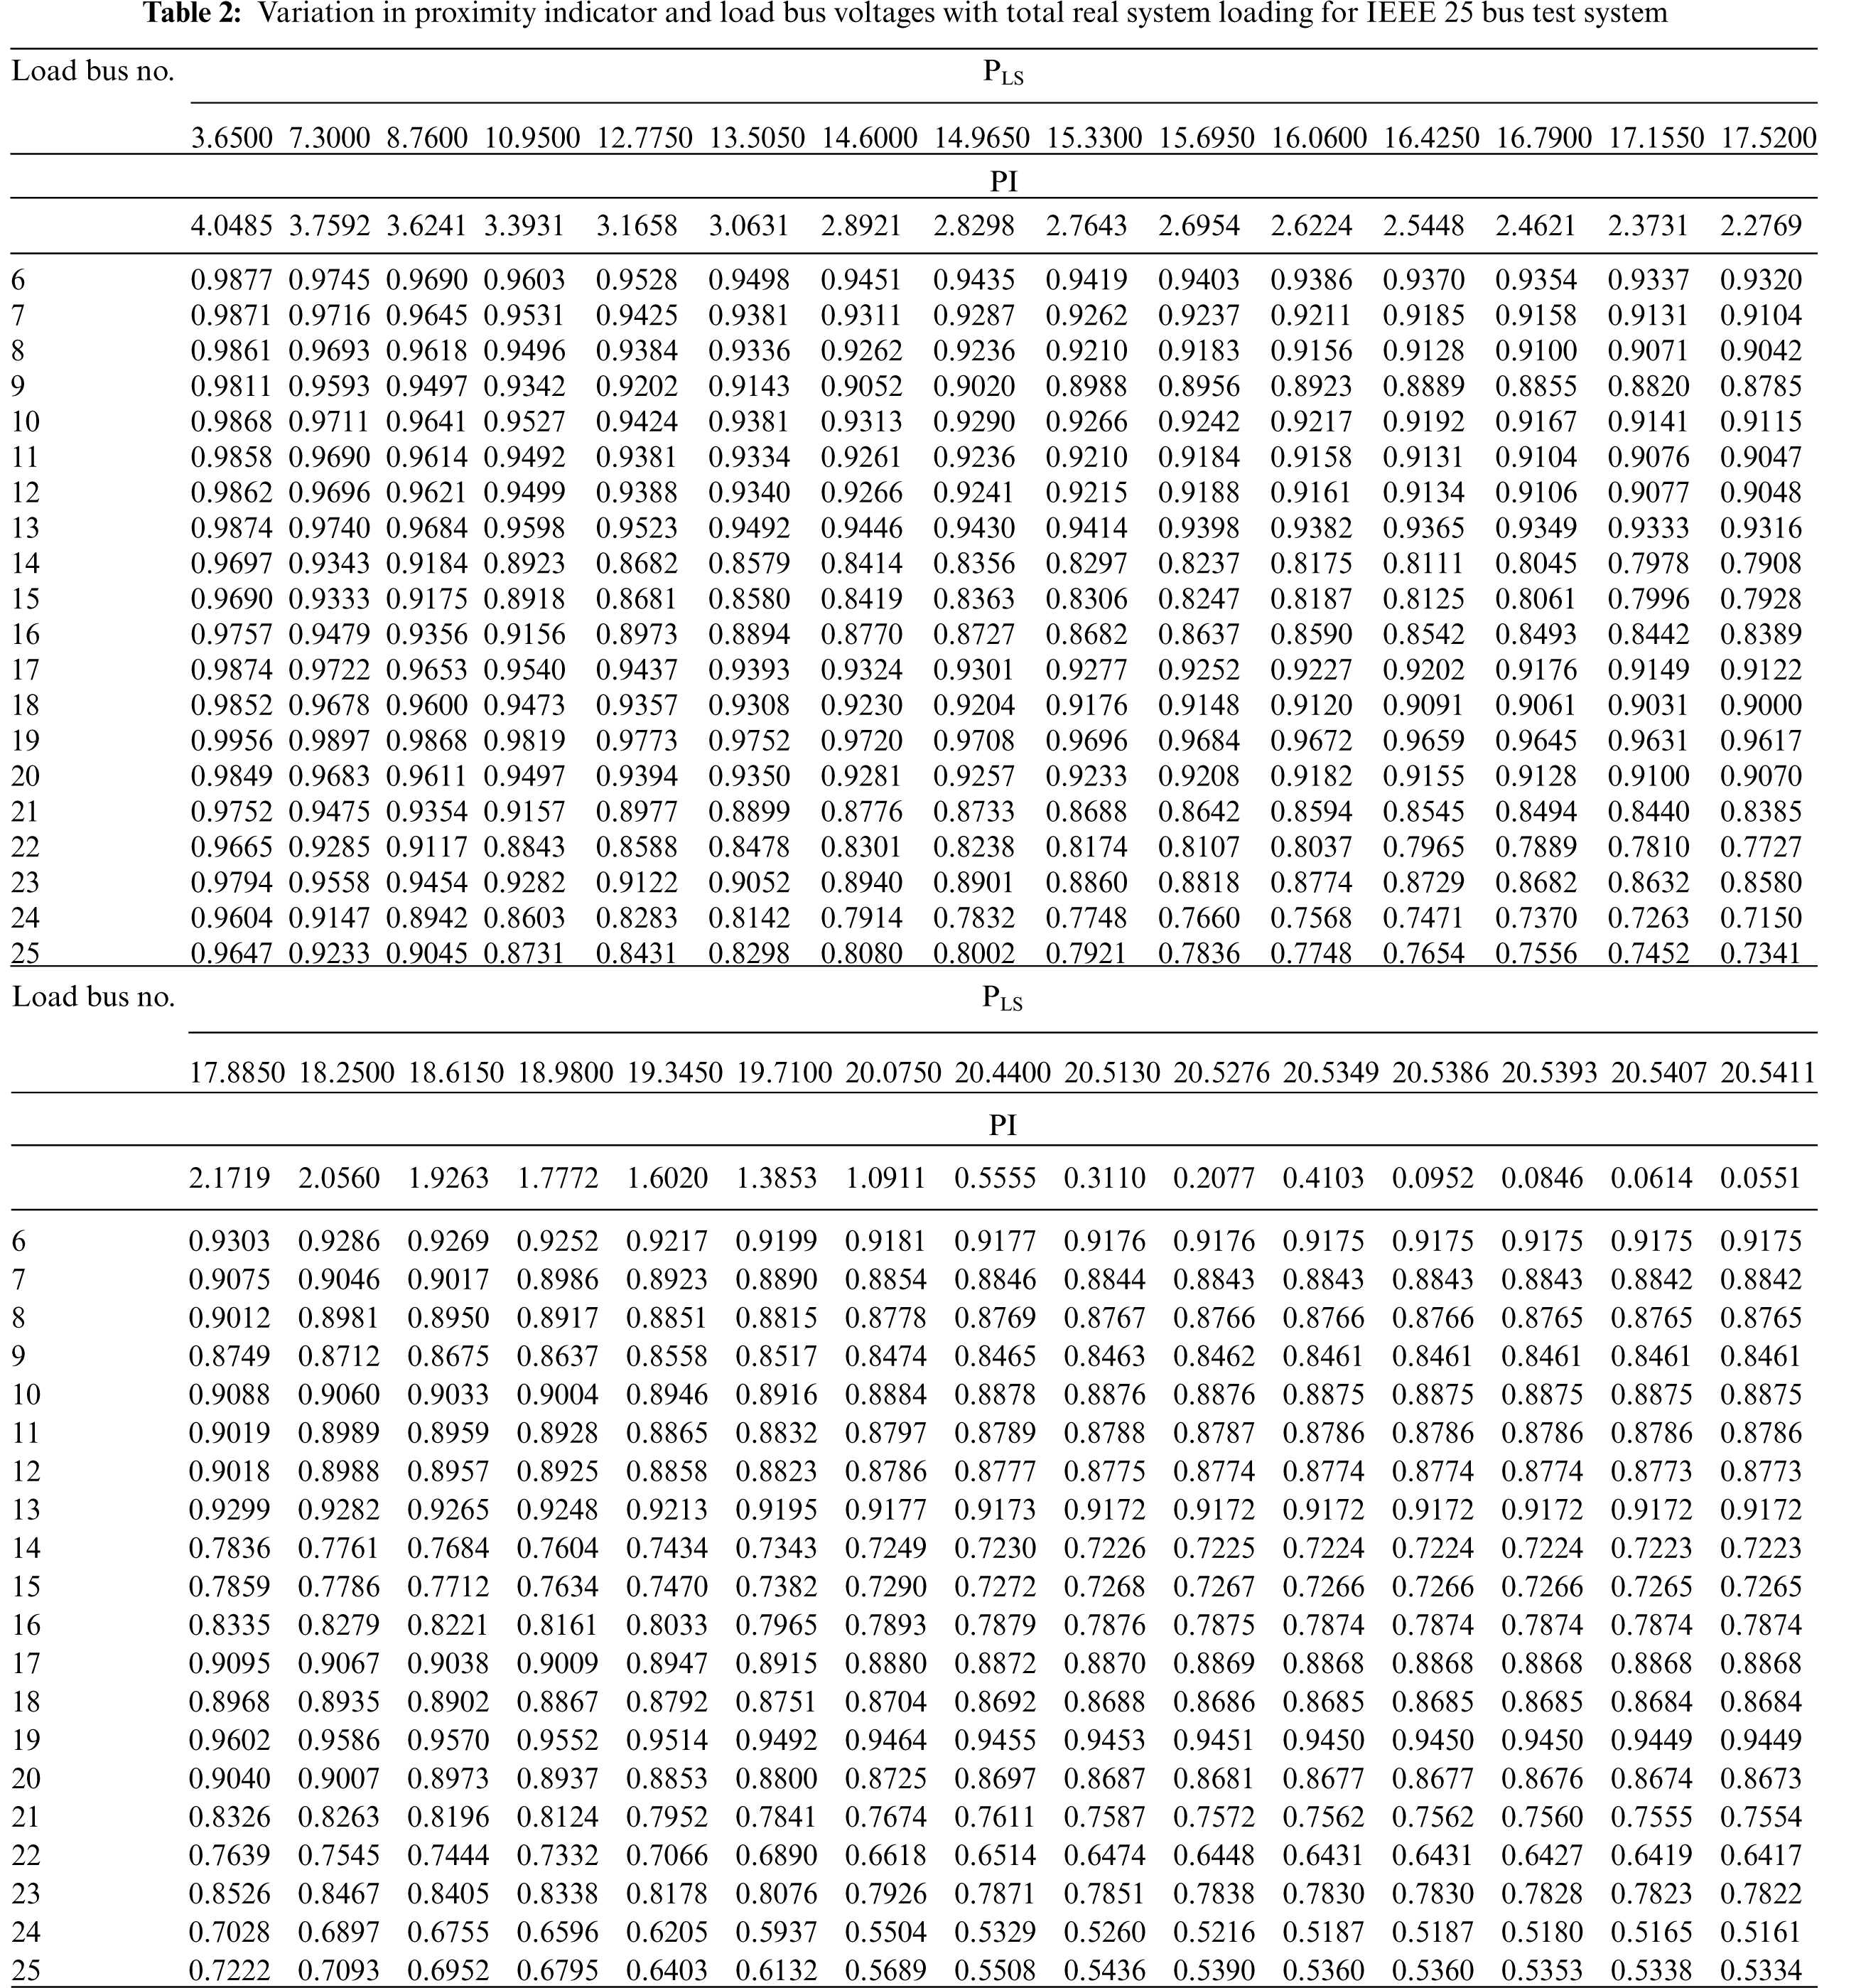
Fig. 3 shows the graph of proximity index and voltage at weakest bus (bus no. 24) with total real loading (PLS). The curve of proximity indicator approaches to PLS orthogonally as the system real load obtains its maximum value. CPF suggests the maximum real power demand of the system is 20.4629 pu and the critical voltage at bus no. 24 is 0.5271 pu [3].
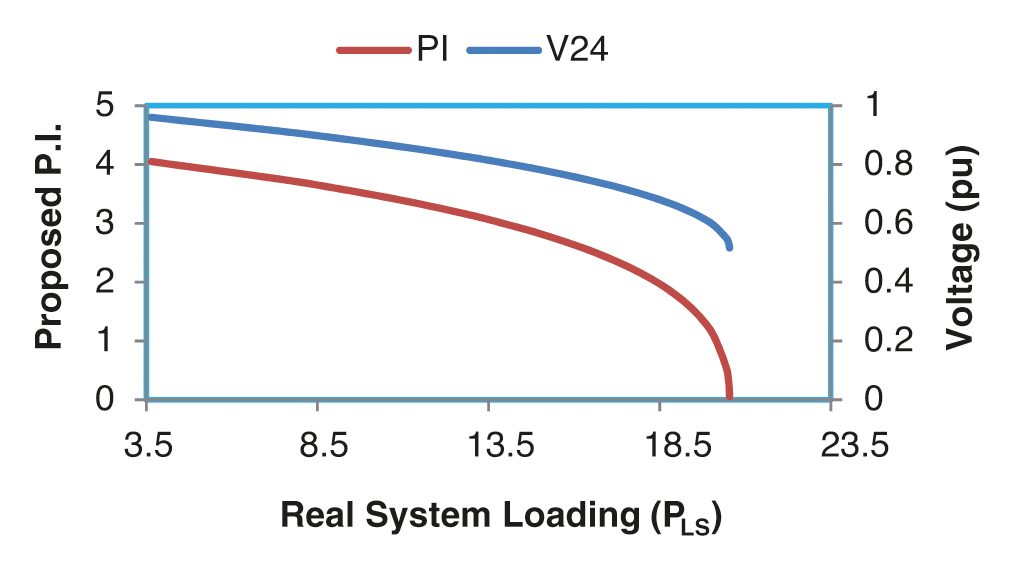
Figure 3: Variation in proximity indicator and voltage V24 with total real power load for IEEE 25 bus test system
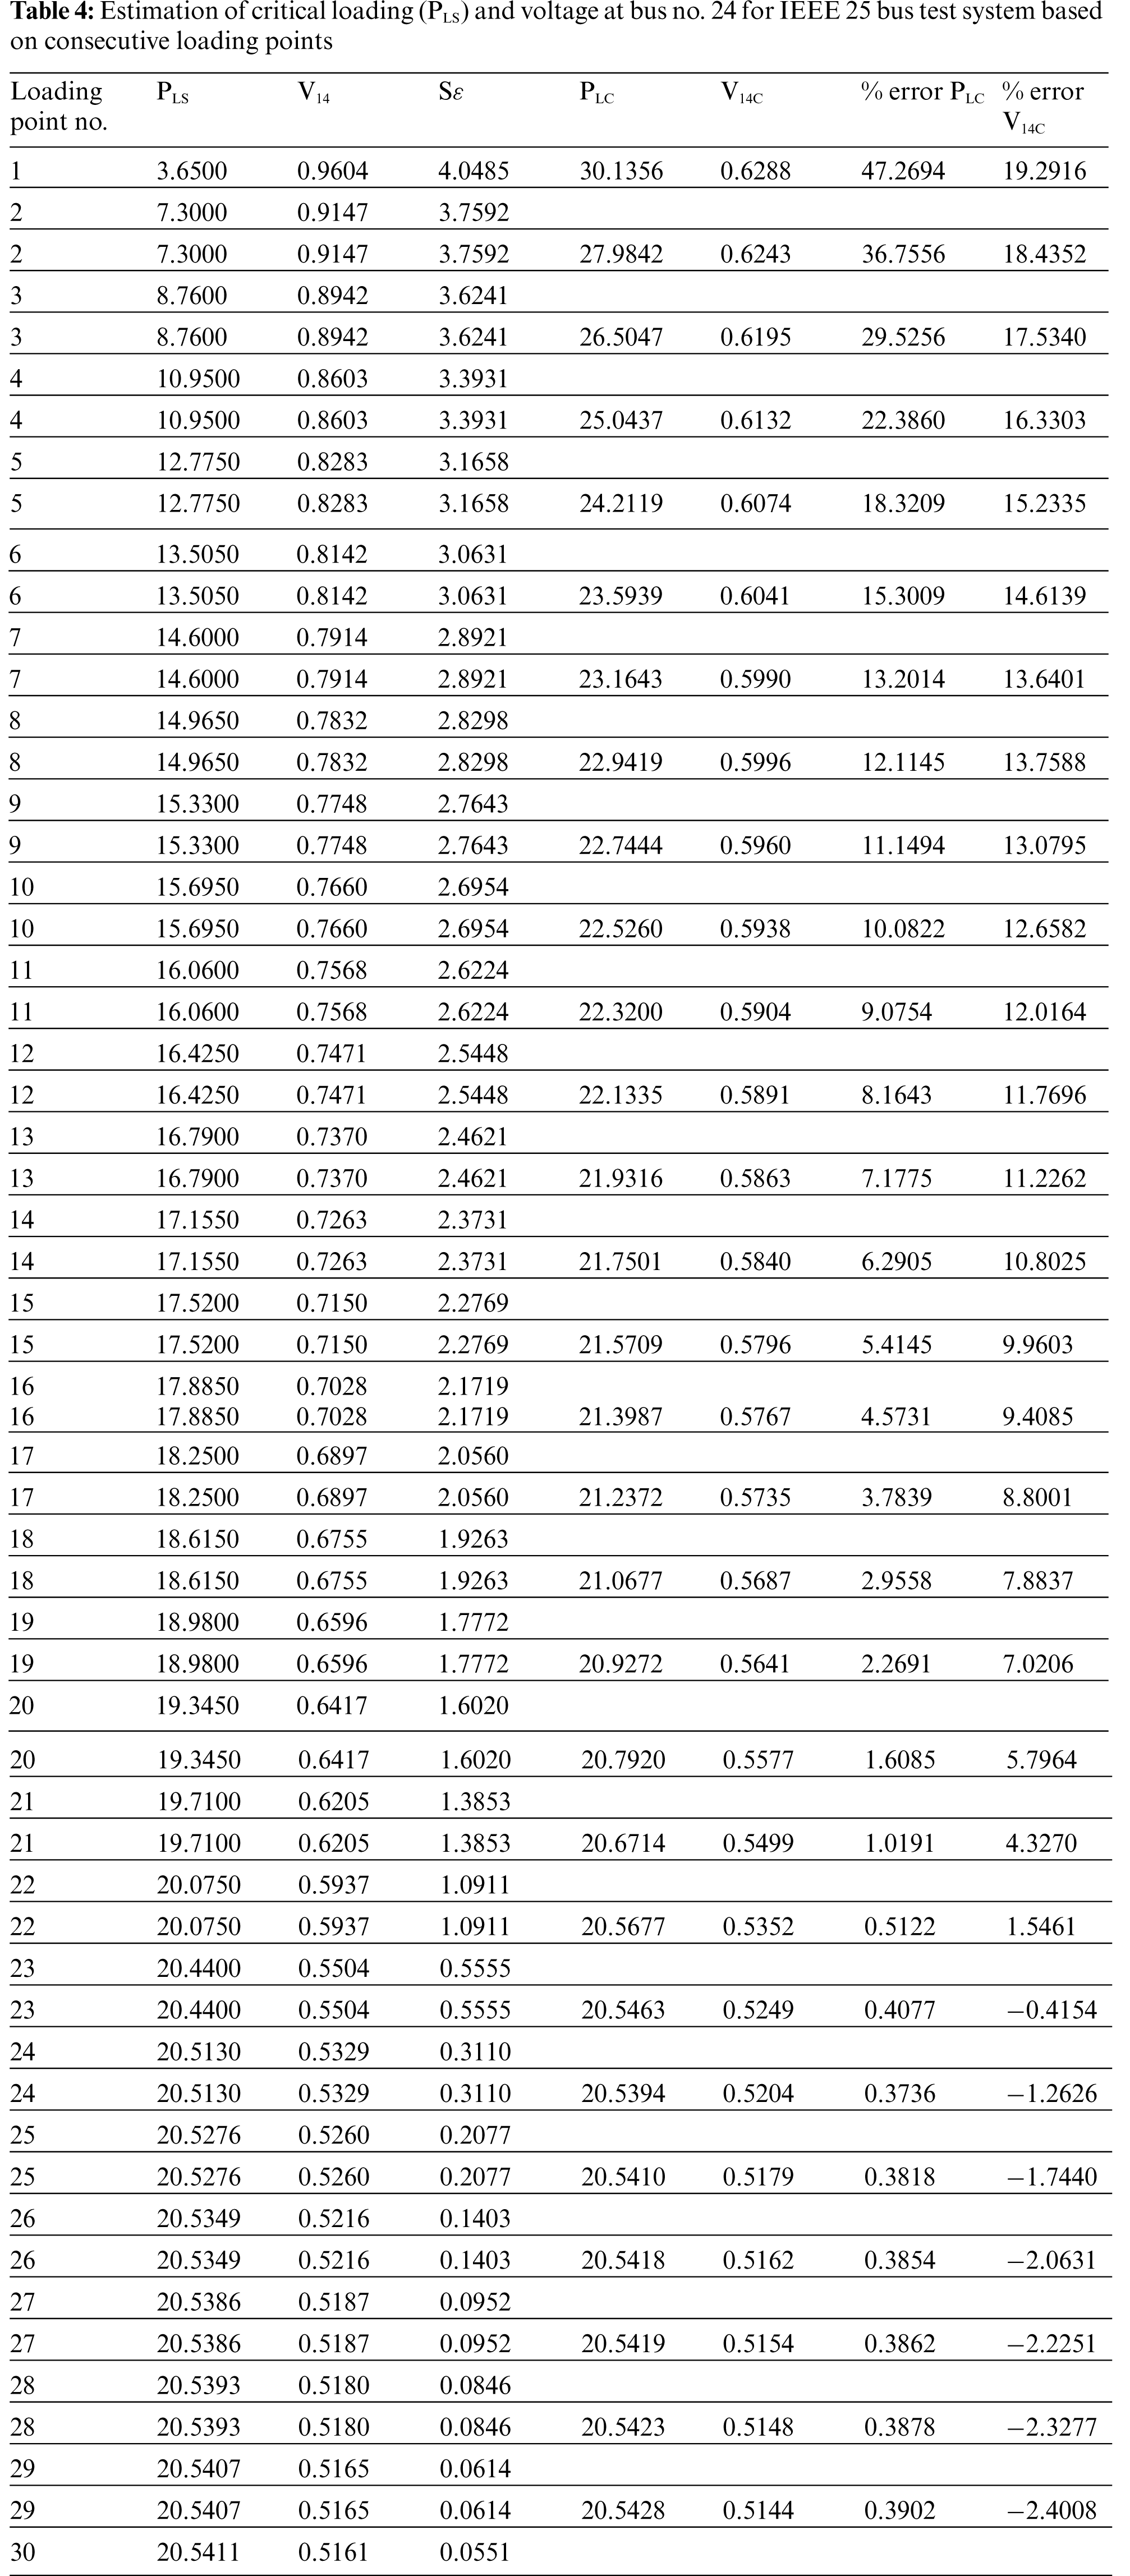
Estimation of critical loading point has been done with the help of proposed Proximity indicator. As shown in Table 4, two consecutive points have been taken in calculating critical power (PLC) and the voltage of most critical bus (V24). Closest value of critical load is obtained as 20.5394 pu with minimum percentage error of 0.37 between points 23 and 24. The voltage of bus no. 24 calculated between these operating points is 0.5249 and the percentage error is 0.41. If point 1 and point 30 are selected, the estimated critical power is 20.5442 with an error of 0.39%. Voltage at bus no. 24 at critical loading is 0.5160 with an error of 2.1%.
In view of above results, it can be concluded that proposed proximity indicator is useful in estimating the maximum loadability of the system and voltages at various load buses at critical point. The approximation of Sε-PLS plots as parabolic works well if two operating points taken are very near to collapse point and preferably near to convergence limit of NR power flow program. The estimation is even fair if half of base case loading point (light loading) and operating point of last convergence are taken.
This paper has proposed a new load flow equation based proximity indicator and simulation study has been carried out with the help of developed algorithm (Fig. 1) by considering IEEE 14 bus and IEEE 25 bus test systems to demonstrate the behaviour of proposed proximity indicator as the system load is increased till the convergence of NR based load flow program, The PLS-Sε plots obtained for both systems are approximated as parabolic as seen in Figs. 2 and 3 and hence an approximate relationship has been formulated between system active load and proximity indicator. Voltage magnitudes at all load buses are also recorded and bus 14 is identified as weakest bus in IEEE 14 bus system (Table 1) and bus 24 is identified as weakest bus in IEEE 25 bus test system (Table 2).
For estimation of critical power and voltage two loading points are taken and computed values of proximity index at these points are used. It has been concluded from Tables 3 and 4 that for both the test systems, the accuracy of estimating critical power and critical voltage at the weakest bus is increased when the points are taken near the point of last convergence of NR based load flow program,
With the work in this paper, it is concluded that:
• The proximity index variation with system loading can be approximated as regular curve.
• Linear and parabolic plots are suitable for simple and quick estimation of critical loading point.
• The variation of proximity indicator near critical point and its close matching with the approximated curve is the key factor for accurate prediction of critical loading point on PV curve.
• Accuracy of estimation could be increased by taking two loading points near the point of extreme convergence of NR load flow program.
As the voltage stability phenomenon is load driven and depends upon how system reactive power varies with real system power, the proportionate load increase scenario as taken only give only an insight. Load P-Q characteristics can vary at each load bus and must be considered in simulation for accurate prediction with the proposed algorithm.
To avoid voltage instability, continuous system monitoring and accurate prediction of critical loading point is necessary. In this study, two operating points preferably near the point of last convergence are taken to reduce the error in estimating critical point with the help of proposed proximity indicator. Newton's divided difference formula can also be used by selected more number of points. Artificial neural networks can also be used to predict the collapse point. Load P-Q characteristics must be considered in simulation to improve the accuracy of estimation.
Acknowledgement: We are very thankful to Administration of Ujjain Engineering College Ujjain, India, Faculty and Staff of Department of Electrical Engineering, Ujjain Engineering College, Ujjain, India and RGPV Bhopal India providing us all support to complete this research work. Valuable guidance from Dr. L. D. Arya, Retd. Professor, S.G.I.T.S Indore, India is also acknowledged.
Funding Statement: The author declare that no specific funding has been received for this study.
Conflicts of Interest: The authors declare that they have no conflicts of interest to report regarding the present study.
1. Taylor, C. W. (1994). Power system voltage stability. New York: McGraw Hills. [Google Scholar]
2. Eady, S. I., Christy, C. (1992). The continuation power flow: A tool for steady state voltage stability analysis. Institute of Electrical and Electronics Engineers. Transactions on Power Systems, 7, 416–423. DOI 10.1109/59.141737. [Google Scholar] [CrossRef]
3. Arya, L. D., Sakravdia, D. K., Choubey, S. C. (2003). Continuation power flow with tangent predictor and pseudo-arc length parameterization. Journal of the Institution of Engineers (IndiaElectrical Engineering Division, 83, 291–295. [Google Scholar]
4. Gao, B., Morison, G. K., Kundur, P. (1992). Voltage stability evaluation using modal analysis. Institute of Electrical and Electronics Engineers Transactions on Power Systems, 7(4), 1529–1541. DOI 10.1109/59.207377. [Google Scholar] [CrossRef]
5. Lof, P. A., Smed, T., Andersson, G., Hill, D. J. (1992). Fast calculation of a voltage stability index. Institute of Electrical and Electronics Engineers Transactions on Power Systems, 7(1), 54–64. DOI 10.1109/59.141687. [Google Scholar] [CrossRef]
6. Berizzi, A., Finazzi, P., Dosi, D., Marannino, P., Corsi, S. (1998). First and second order methods for voltage collapse assessment and security enhancement. Institute of Electrical and Electronics Engineers Transactions on Power Systems, 13(2), 543–551. DOI 10.1109/59.667380. [Google Scholar] [CrossRef]
7. Chiang, H. D., Jumeau, R. J. (1995). Toward a practical performance index for predicting voltage collapse in electric power systems. Institute of Electrical and Electronics Engineers Transactions on Power Systems, 10(2), 584–592. DOI 10.1109/59.387892. [Google Scholar] [CrossRef]
8. Arya, L. D., Sakravdia, D. K., Choube, S. C. (2001). Development of a proximity indicator and its application for estimating maximum loadability point. Journal of Institution of Engineers (India), 82, 87–91. [Google Scholar]
9. Canizares, C. A., De Souza, A. C. Z., Quintana, V. H. (1996). Comparison of performance indices for detection of proximity to voltage collapse. Institute of Electrical and Electronics Engineers Transactions on Power Systems, 11(3), 1441–1450. DOI 10.1109/59.535685. [Google Scholar] [CrossRef]
10. Chen, K., Hussein, A., Bradley, M. E., Wan, H. (2003). A Performance-index guided continuation method for fast computation for saddle-node bifurcation in power systems. Institute of Electrical and Electronics Engineers Transactions on Power Systems, 18(2), 753–760. DOI 10.1109/TPWRS.2003.811203. [Google Scholar] [CrossRef]
11. Kessel, P., Glavitsch, H. (1986). Estimating the voltage stability of a power system. Institute of Electrical and Electronics Engineers Transactions on Power Systems, 1(3), 346–354. DOI 10.1109/TPWRD.1986.4308013. [Google Scholar] [CrossRef]
12. Balamourougan, V., Sidhu, T. S., Sachdev, M. S. (2004). Technique for on line prediction of voltage collapse. IEE Proceedings-Generation, Transmission and Distribution, 151(4), 453–460. DOI 10.1049/ip-gtd:20040612. [Google Scholar] [CrossRef]
13. Chebbo, A. M., Irving, M. R., Sterling, M. J. H. (1992). Voltage collapse proximity indicator: Behaviour and implications. IEE Proceedings (Generation, Transmission and Distribution), 139, 241–252. DOI 10.1049/ip-c.1992.0037. [Google Scholar] [CrossRef]
14. Cifci, A., Uyaroglu, Y., Yalcin, M. A. (2012). Voltage stability via energy function analysis on reduced order model of power system. Turkish Journal of Electrical Engineering & Computer Science, 20(1), 1031–1043. DOI 10.3906/elk-1105-12. [Google Scholar] [CrossRef]
15. Overbye, T. J., Demarco, C. L. (1991). Improved techniques for power system voltage stability assessment using energy methods. Institute of Electrical and Electronics Engineers Transactions on Power Systems, 6, 1446–1452. DOI 10.1109/59.116988. [Google Scholar] [CrossRef]
16. Hecke, V. J., Hatziargyriou, N. D., van, C. T. (1994). Indices predicting voltage collapse including dynamic phenomena, vol. 91, pp. 91–94. CIGRE: Paris, France, http://www.montefiore.ulg.ac.be/services/stochastic/pubs/1994/HHV94. [Google Scholar]
17. Salama, M. M., Saied, E. M., Abou-Elsaad, M. M., Ghariany, E. F. (2001). Estimating the voltage collapse proximity indicator using artificial neural network. Energy Conversion and Management, 42(1), 69–79. DOI 10.1016/S0196-8904(00)00023-6. [Google Scholar] [CrossRef]
18. Lee, D. H. A. (2016). Voltage stability assessment using equivalent nodal analysis. Institute of Electrical and Electronics Engineers Transactions on Power Systems, 31(1), 454–463. DOI 10.1109/TPWRS.2015.2402436. [Google Scholar] [CrossRef]
19. Haque, M. H. (1995). A fast method for determining the voltage stability limit of a power system. Electric Power Systems Research: Hecke, 32(1), 35–43. DOI 10.1016/0378-7796(94)00893-9. [Google Scholar] [CrossRef]
20. Su, H., Liu, C. (2016). Estimating the voltage stability margin using PMU measurements. IEEE Transactions on Power Systems, 31(4), 3221–3229. DOI 10.1109/TPWRS.2015.2477426. [Google Scholar] [CrossRef]
21. Kamel, M., Li, F., Bu, S., Wu, Q. (2021). A generalized voltage stability indicator based on the tangential angles of PV and load curves considering voltage dependent load models. International Journal of Electrical Power & Energy Systems, 127, 106624. DOI 10.1016/j.ijepes.2020.106624. [Google Scholar] [CrossRef]
22. Wallach, Y. (1986). Calculations and programs for power system networks. PHI. [Google Scholar]
 | This work is licensed under a Creative Commons Attribution 4.0 International License, which permits unrestricted use, distribution, and reproduction in any medium, provided the original work is properly cited. |