| Energy Engineering |
DOI: 10.32604/ee.2022.019248
ARTICLE
Effect of Varying Temperature and Oxygen on Particulate Matter Formation in Oxy-Biomass Combustion
1Fujian Provincial Higher–Educational Engineering Research Centre of Intelligence and Automation in Construction, College of Civil Engineering, Huaqiao University, Xiamen, China
2Kenya Industrial Research and Development Institute, Nairobi, Kenya
3Hello Renewables, Ltd., Kigali, Rwanda
4Mount Kenya University, Thika, Kenya
5African Centre of Excellence in Energy for Sustainable Development, University ofRwanda, Kigali, Rwanda
6Morayo College, Nairobi, Kenya
7Fujian Baichuan Construction Technology Co., Ltd., Xiamen, China
8Haoqi (Xiamen) Construction Technology Co., Ltd., Xiamen, China
9University of Rwanda, College of Science and Technology, Kigali, Rwanda
*Corresponding Author: Cicilia Kemunto Mesa. Email: cessmesa83@gmail.com
Received: 11 September 2021; Accepted: 12 January 2022
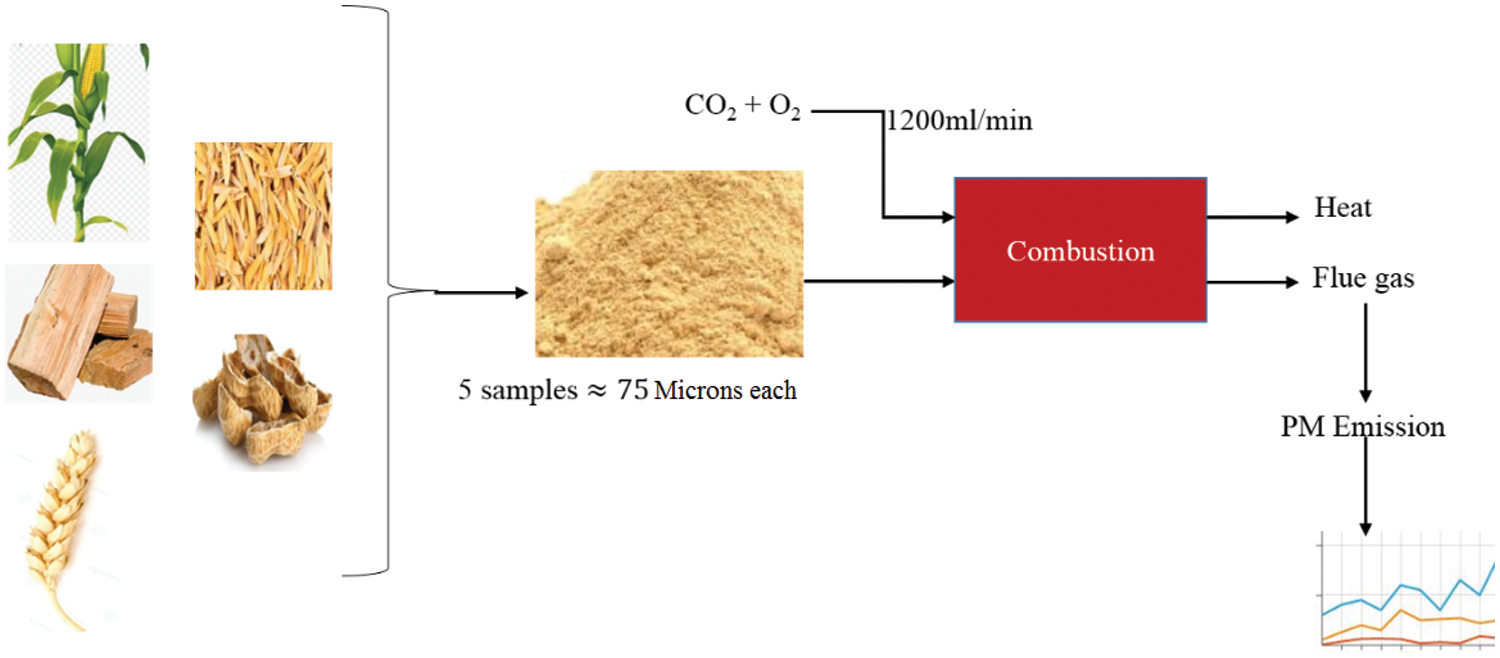
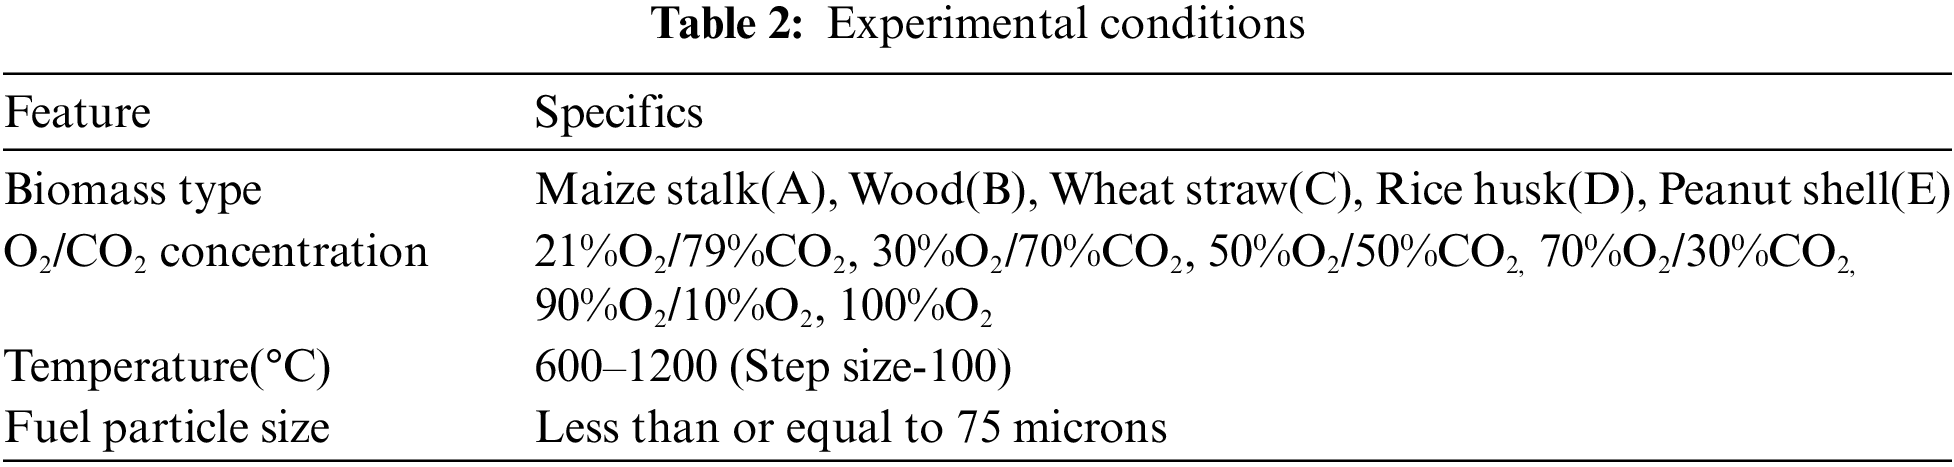
Abstract: Offsetting particulate matter emissions has become a critical global aim as there are concerted efforts to deal with environmental and energy poverty challenges. This study consists of investigations of computing emissions of particulate matter from biomass fuels in various atmospheres and temperatures. The laboratory setup included a fixed bed electric reactor and a particulate matter (PM) measuring machine interfaced with the flue gas from the fixed bed reactor combustion chamber. The experiments were conducted at seven different temperatures (600°C–1200°C) and six incremental oxygen concentrations (21%–100%). Five biomass types were studied; A-cornstalk, B-wood, C-wheat straw, D-Rice husk, E-Peanut shell, each pulverized to a size of approximately 75 microns. The study shows that PM emitted during char combustion is consistently higher than that emitted during the de-volatilization. During de-volatilization, increase in temperature leads to linear decrease in PM emission between atmospheres of 21%O2 to 50%O2, thereafter, between 70%O2 to 100%O2; increase in temperature leads to a rise in PM emission. The average PM formation from all the five considered biomass is relatively comparable however, with differing atmospheres and temperatures, the fibrous and low-density biomass forms more PM. During char combustion, the study shows that at oxygen levels of 21%, 70%, 90% and 100%, increase in temperature leads to increased PM emission. The increase in oxygen concentration and temperature increases the rate of combustion hence diminishing the time of combustion.
Keywords: Oxy-fuel combustion; particulate matter (PM); volatiles; char combustion
Graphical Abstract
Particulate Matter (PM) is directly associated with several health complications besides the prominent environmental effects. PM10 and PM2.5 is monitored in indoor spaces and outdoor environments as exposure to them has been linked to respiratory illnesses and carcinogenic effects [1–3]. Extensive research has been conducted on the impact of particles on human health and its contribution to global warming using chemical transport simulations and experimental work [4–6]. The amount of particulate matter emitted from biomass and coal combustion is dependent on certain factors. On account of biomass combustion, particulates formation undergoes different pathways; In the first one non-volatile inorganic elements like calcium and silica are collected upon coarse ash particles (>1 μm) therefore transformed into particulate matter. The second pathway collects inorganic vapors on fine ash particles of less than1 μm, then after a series of alterations including nucleation, condensation coagulation and others, particulate matter is formed. The third pathway is the evolution of volatile organic compounds and soot from incomplete combustion into particulate matter. In consideration of particle emission causing activities, it has been established that fuel combustion in domestic devices is a major source of PM2.5 in several parts of the world [7,8].
Oxy-fuel combustion is a recent technology that has been recognized for multiple benefits. It increases the partial pressure of CO2 in the flue gas hence making CO2 sequestration more economical, moreover, the CO2 in the flue gas can be recycled for combustion purposes [9]. Additionally, it reduces the pollutants and precursors that cause adverse health complications like lung diseases and mutagenic component in the emissions thought to be cancer causing [10–12]. Owing to the effects of particle pollution, study on PM formation, emission and its control has attracted more attention, the combustion gas mixture being crucial as well.
Several studies carried out have shown the impact of various conditions on PM emissions during both biomass and coal combustion investigations. Several studies have been done including the impact of solid fuel [13–15], the impact of temperature [16,17], residence time [15,18] and gas environment [19,20]. Studies on impact of operating conditions on PM emission have been done but to the best of our knowledge, a complete parametric study using a fixed bed reactor and oxygen/carbon dioxide atmosphere has not yet been performed.
The objectives of this study were to find out how PM formation is related to the combustion temperature and combustion atmosphere and fuel type. In this study, the emission behavior of PM during oxy-biomass combustion was investigated using available materials such as cornstalk, wood, wheat straw, rice husk, and peanut shell.
Cornstalk (A)
Cornstalk is the tough fibrous stem of the corn plant. China is the second largest producer of cornstalk in the world. Cornstalk energy can be exploited to produce power therefore eliminating the effects of open burning and dumping.
Wood (B)
Wood is composed of cellulose (40% to 50%), hemicellulose (15% to 25%) and lignin (15%–30%).
Wheat straw (C)
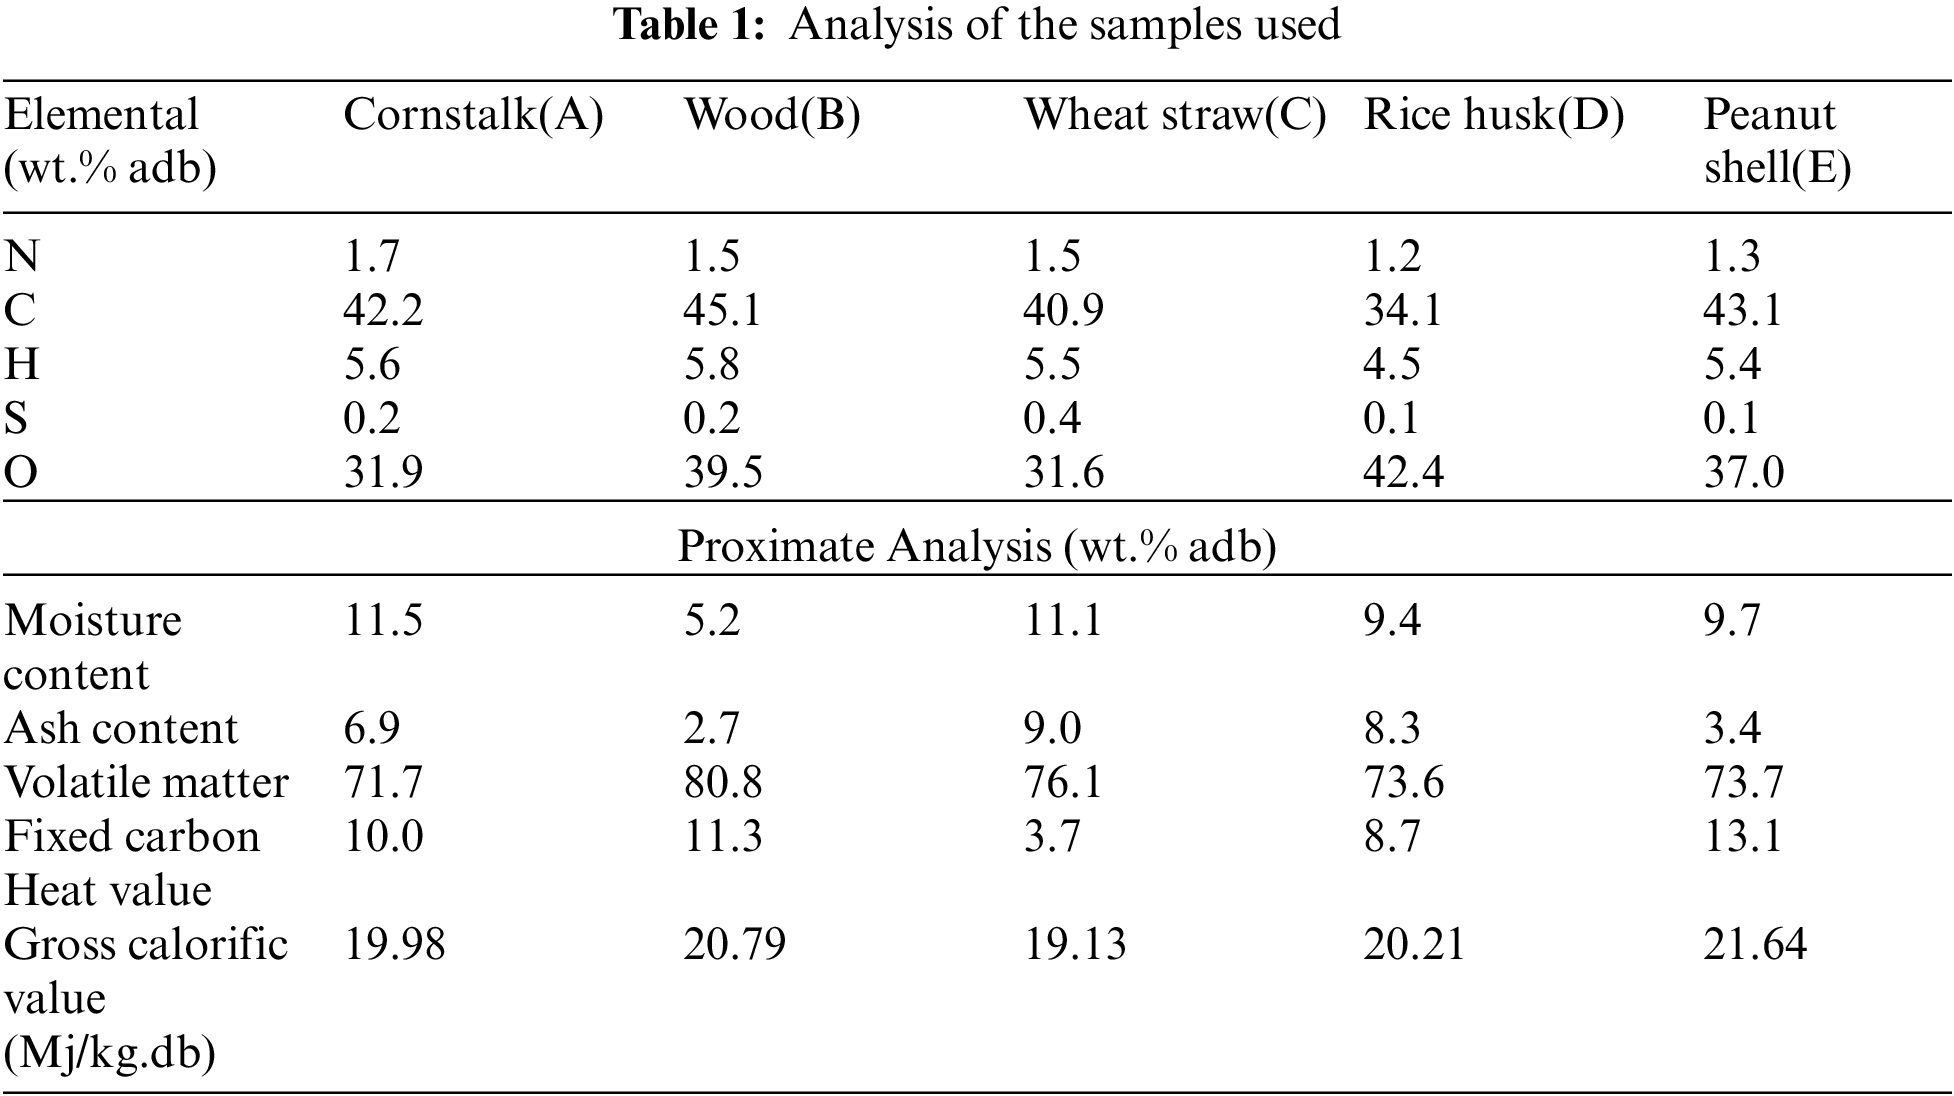
Wheat straw is the dry stalk of the wheat plant after the removal of grain and chaff. As gathered from the elemental analysis, the sulphur at 0.4 is the highest of the five biomass types, therefore pausing a significant pollution potential.
Rice husk (D)
Rice husk is the outer sheath covering of the rice crop, it has low density, high moisture content and low energy density as opposed to wood.
Peanut shell (E)
Peanut shells are generally herbaceous biomass fuel with composition of raw peanut shell determined to be lignin, cellulose, minimal compositions of protein, ash and moisture. The shells have a fibrous ‘skeleton’ supporting a cellulose-lignin layer.
The ultimate analysis for carbon and hydrogen was done according to the ASTME 777 standard. Nitrogen and sulphur were done using the ASTME 778 and ASTME 775 standard, respectively. Oxygen was determined by difference.
Proximate analysis was performed on the biomass samples for the determination of the moisture, volatile and ash content according to the British and European standards respectively (BSI 2009 a, b, c). The fixed carbon content was determined by difference. The moisture content was determined using oven method at 105°C.
The heating values of the samples were both determined by bomb calorimeter measurements and calculated by formulae available in literature. The bomb calorimeter was used according to the ASTM D 2015 standard method.
2.3 Combustion Facilities and Appliance
Five types of biomass which are readily available: maize stalk(A), wood(B), wheat straw(C), rice husk(D), and peanut shell(E) were combusted to produce PM. Investigations were conducted in an electric fixed bed reactor with ability to perform in a constant pre-determined temperature and airflow for stable and complete combustion as illustrated in Fig. 1. The fixed bed combustion reactor was made of a cylindrical horizontal ceramic pipe of about 30 mm in diameter and 200 mm in length fixed in a horizontal position. It had orifices for gas supply and at its centre was an electric furnace with a thermal regulator to control the temperature. To mimic normal conditions, the combustion gas was delivered to the combustion furnace through steel piping with a gauge for measuring the gas in ml/min. The PM concentration per cubic metre of gas measurement was recorded using a portable soot analyser (Foedisch PFM 92 K) having a stainless-steel probe with a pre-amplifier. The measuring principle was dependent on the friction electric sensor with a measuring range of 0.1–1000 mg/m³. Investigations were carried out for various parameters as indicated in Tables 1 and 2.
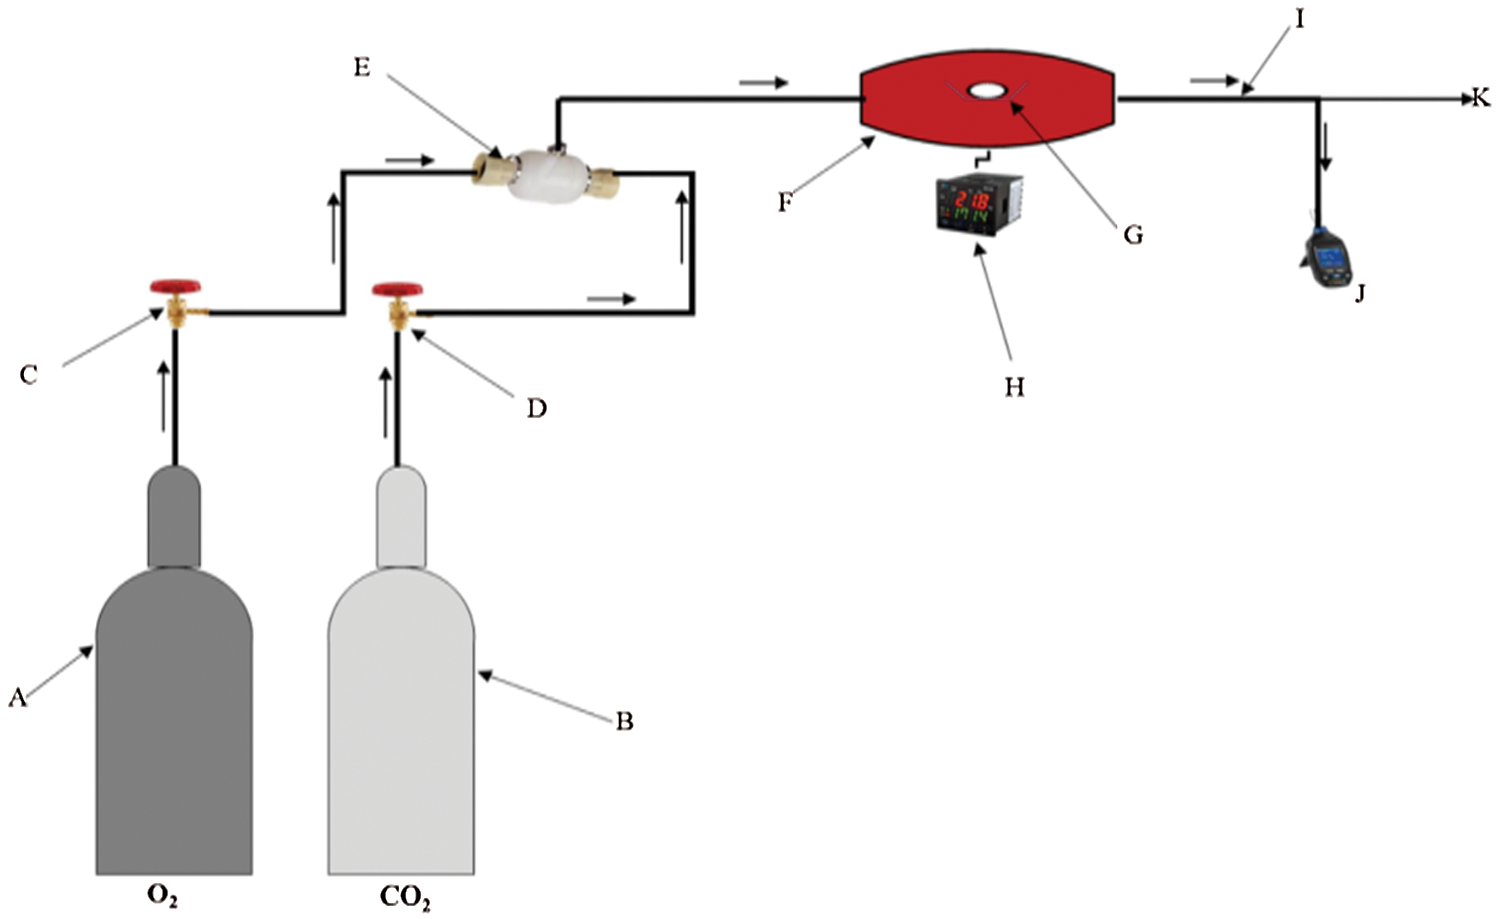
Figure 1: Illustration of the experimental setup. A: Oxygen, B: Carbon dioxide, C: Pressure valve for oxygen, D: Pressure valve for carbon dioxide, E: Gas mixing chamber, F: Combustion chamber, G: Ceramic boat with fuel sample, H: Thermal regulator, I: Flue gas, J: PM measuring device, K: To vent
After attaining the predetermined temperature in the combustion furnace at the set airflow of 20 ml/sec, a ceramic boat with approximately 30 mg of sample fuel was introduced and the combustion started instantly in the combustion zone. Both readings were simultaneously recorded by the portable soot analyser and flue gas analyser. After a considered period, the concentration of the flue gases in the exhaust stream decreased to normal at which point the experiment was terminated. All emissions parameters were recorded from the moment when the samples were introduced into the combustion furnace up to when the experiment was terminated. All samples were kept under the same ambient conditions. All PM measurements were done at least twice after which a mean emission value was calculated from results obtained.
The values for PM in mg/g were derived from the following equation:
where, WZ is the mass of pollutant in mg/g of fuel, which is measured by a portable soot analyser, q is the flow rate of gas (O2 and CO2) supplied to the combustion chamber in m³/s while t is the time considered in seconds. CP is the PM concentration during combustion in mg/m3 that was recorded once per second during the experiment. Finally, mf is the mass of fuel sample in grams.
All data was examined for outliers using MATLAB using the code as shown in Fig. 2 below, all outliers were excluded from the final data considered.
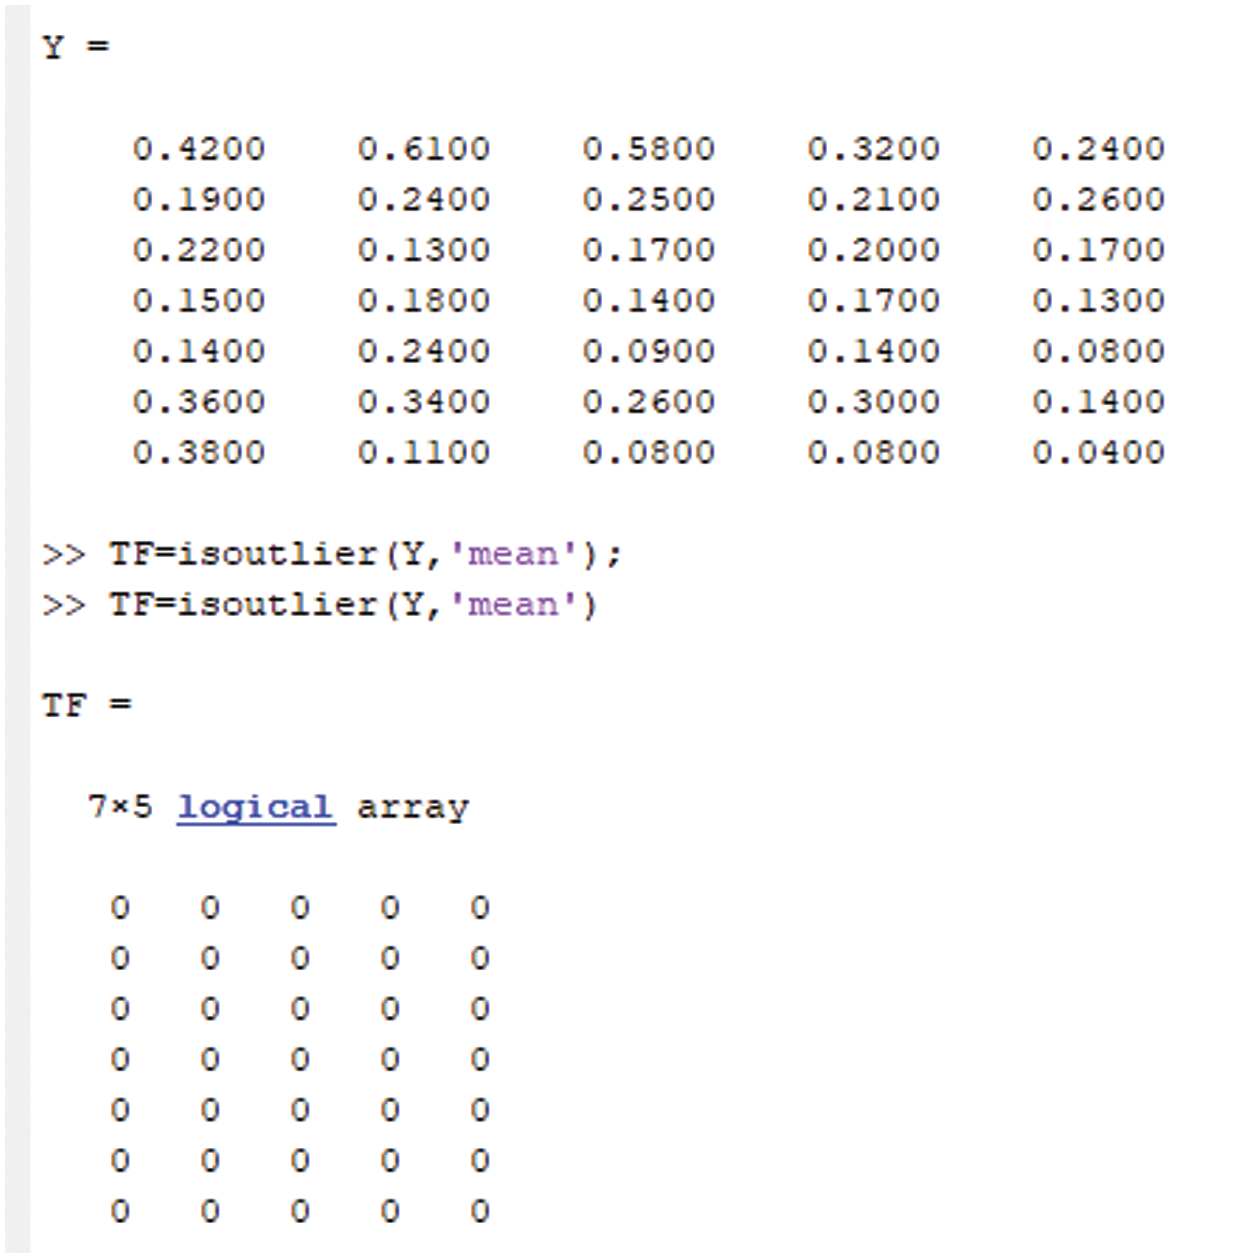
Figure 2: Print screen showing the outlier identification process
3.1 Effect of Temperature and Combustion Atmosphere on Total PM Emission
During the entire temperature profile considered in the investigation, the amount of PM emitted during char combustion is consistently higher than that emitted during de-volatilization (Figs. 3A & 3B to 8A & 8B). Therefore, char combustion is the dominant pathway for PM formation during oxy-biomass combustion which does not differ with natural thermochemical conversion outcomes. PM formed during de-volatilization is mainly composed of unburnt carbon, tar and poly aromatic hydrocarbons (PAH) while PM formed during char combustion is dominantly composed of inorganic ash particles [21,22]. Carbonyl and aromatic compounds account for majority of volatile organic compound at 50% and 30%, respectively [23]. As the oxidant remains constant as shown in Fig. 3A, the temperature varies, the peculiar rise at 1100°C is against the trend and could be attributed to either the onset melting of major and minor elements due to the high temperature or the volatilization of a fraction of the ash forming compounds in the fuel followed by successive nucleation and condensation forming more emissions of PM [24].
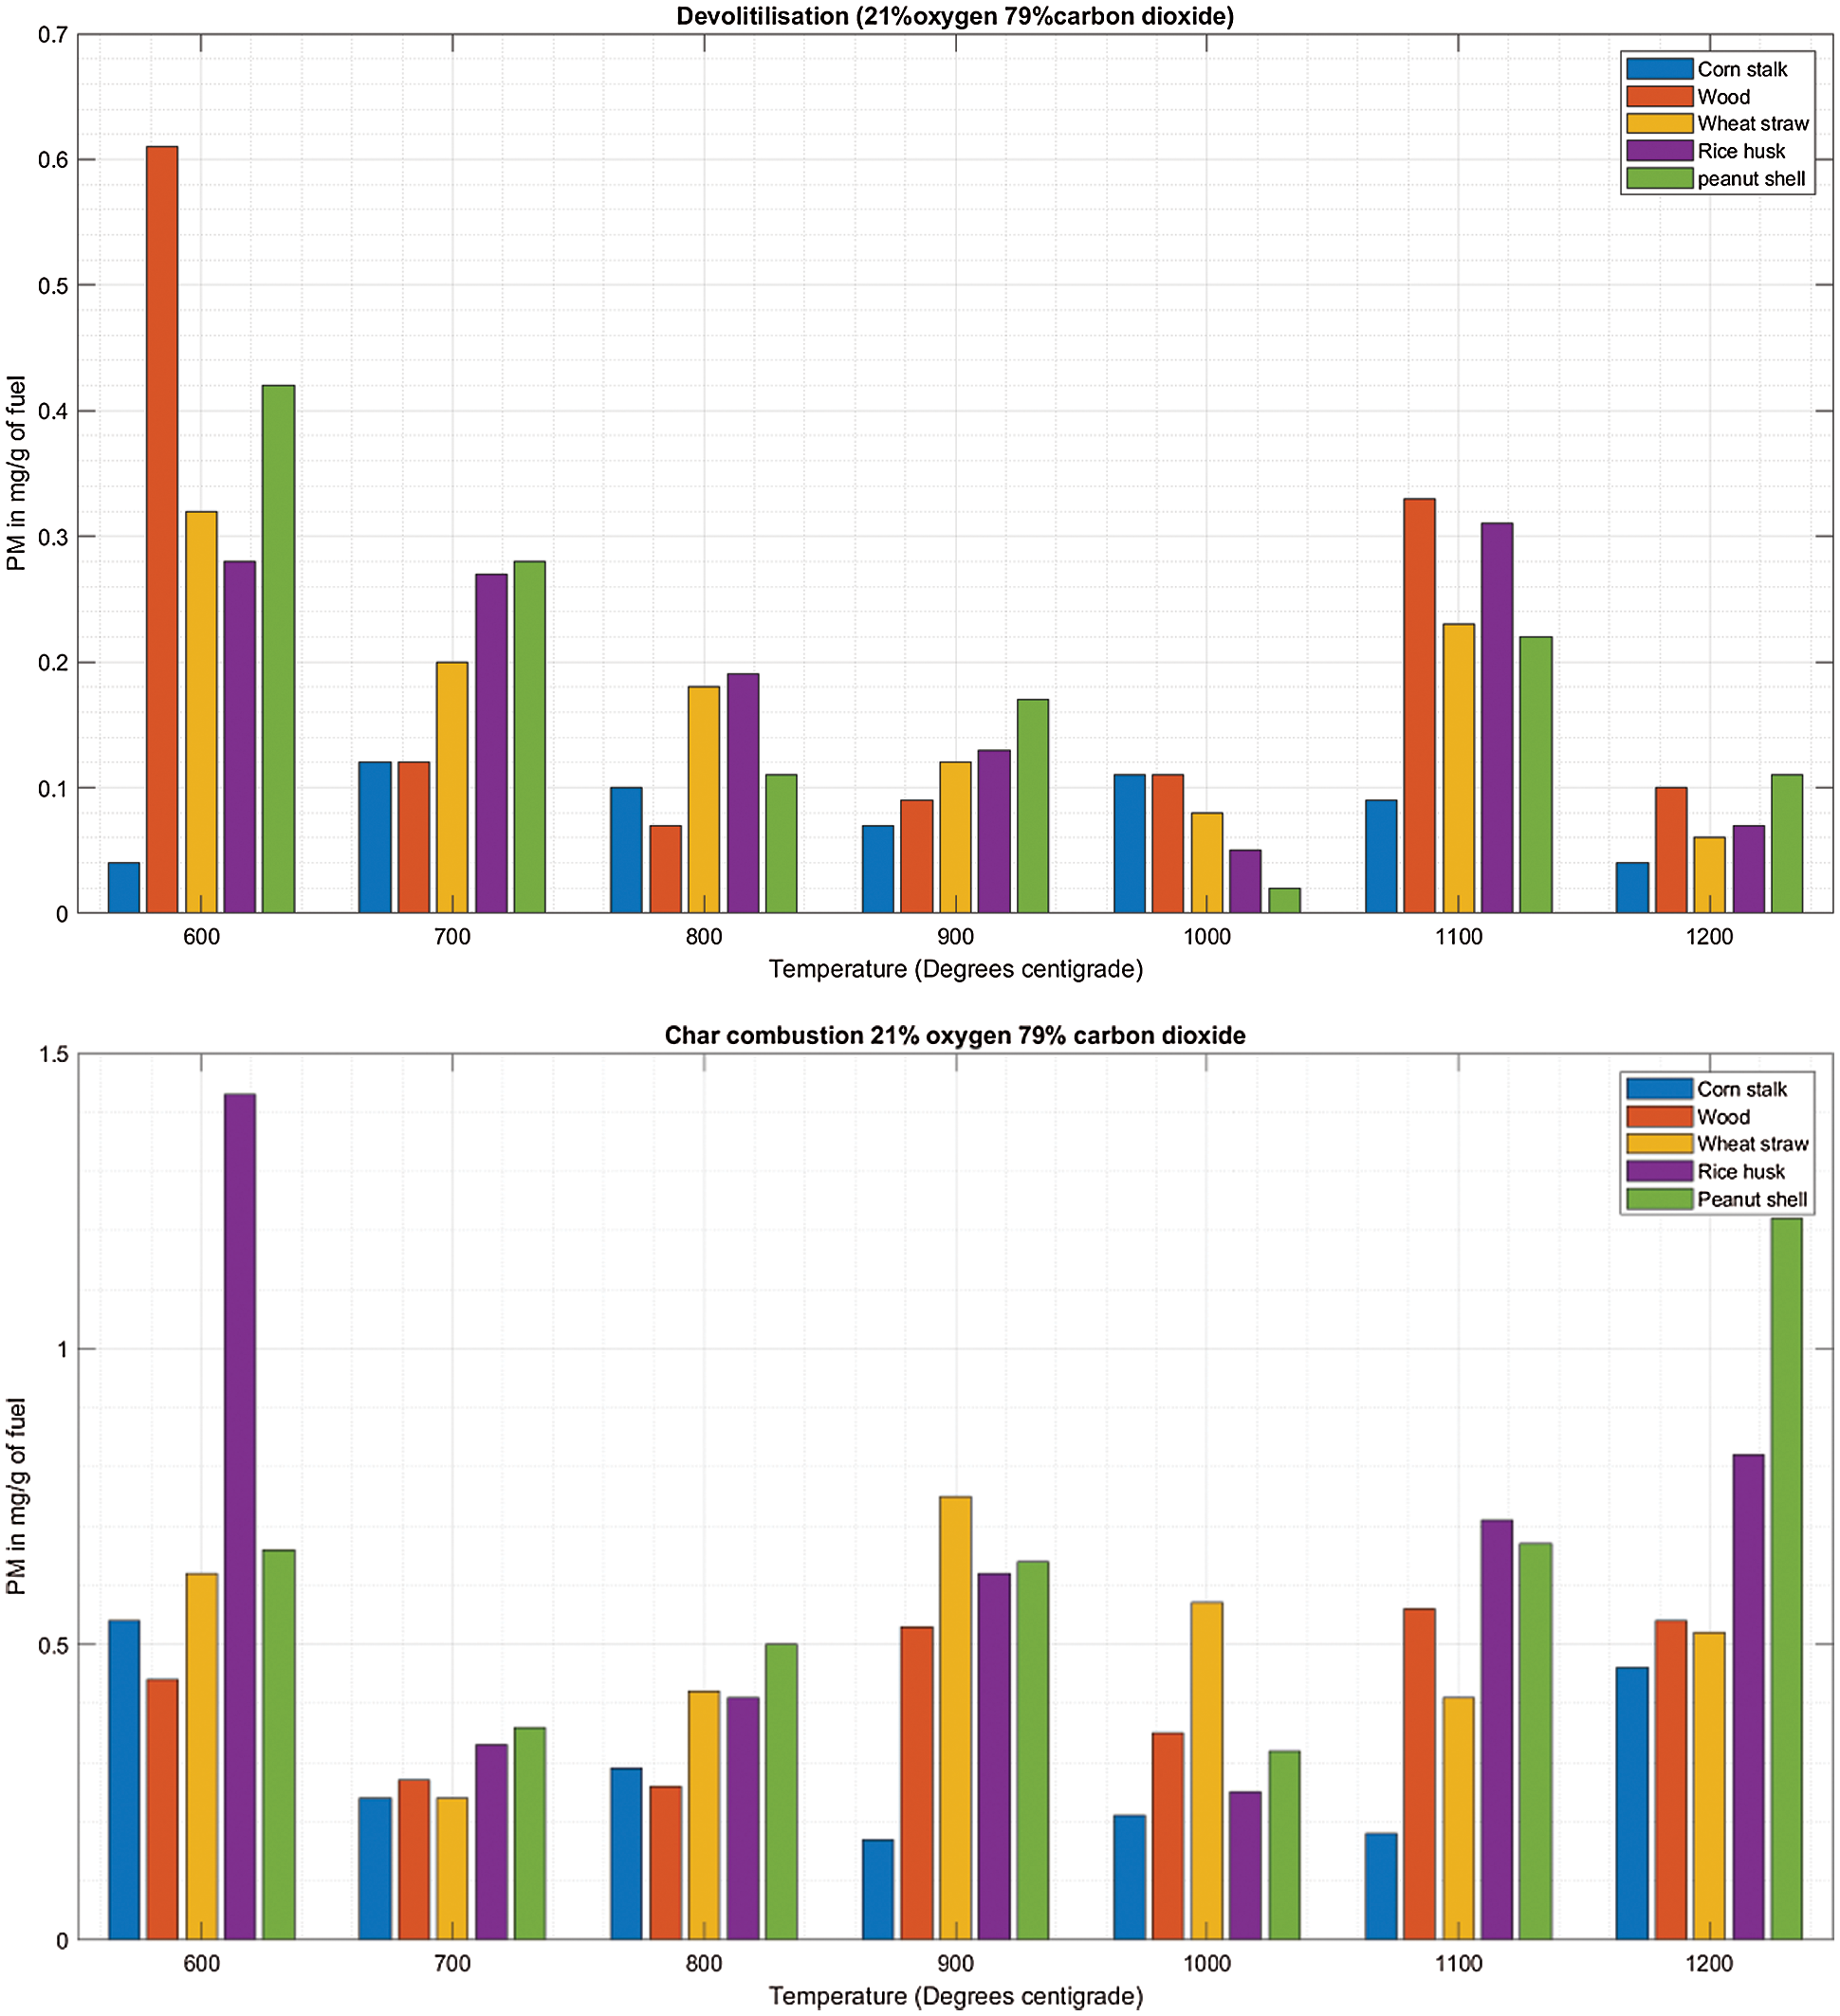
Figure 3: A & B: PM vs. Temperature during de-volatilization and char combustion
The cornstalk trend shows little variation as the temperature increases, during both de-volatilization and char combustion (Figs. 3A & 3B) the range is almost equal to the mean at 0.8 mg/g of fuel for de-volatilization and 0.3 mg/g of fuel for char combustion respectively as shown in Table 3. Wood shows a very high range of 0.54 illustrated in Table 3 during de-volatilization with major PM emission at 600°C and 1100°C (Fig. 3A). However, according to Table 3, there is very little difference in PM formation during char combustion with a range of 0.3 which is less than the mean of 0.4 mg/g of fuel; this shows that temperature increase has very little impact on PM emission during char combustion for wood at an atmosphere of 21%O2/79%CO2.
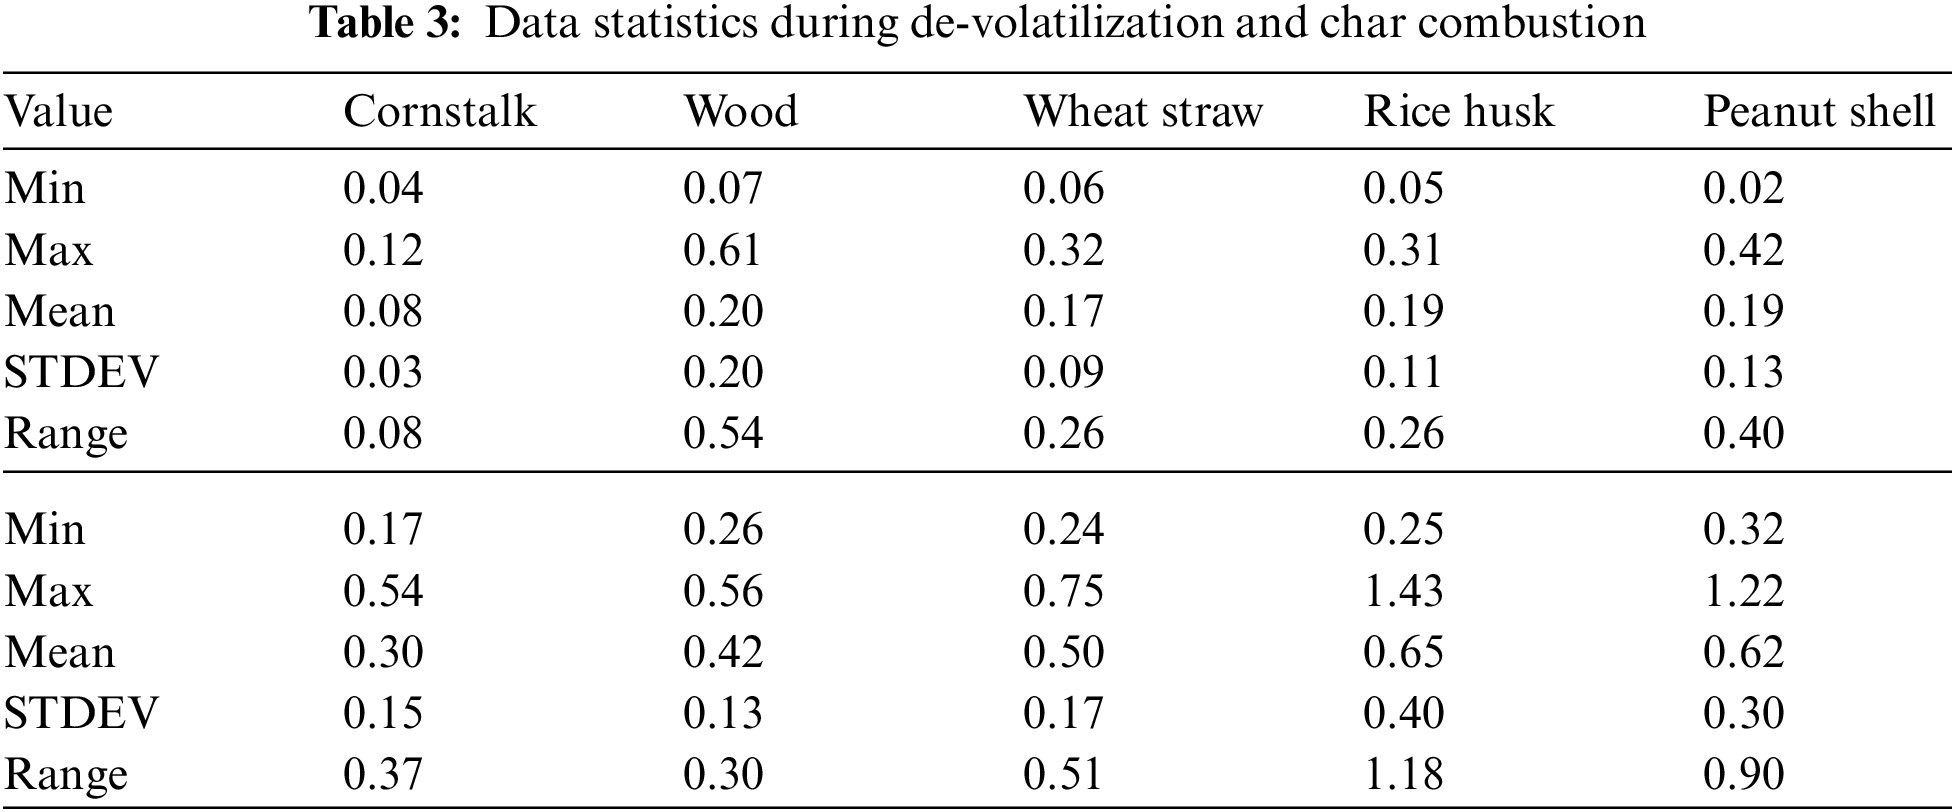
During de-volatilization, wheat straw, rice husk and peanut shell show a linear decrease in PM emission as temperature increases specifically between 600°C and 1000°C, exceptionally high PM emission is experienced at 1100°C (Fig. 3A). During char combustion, wheat straw shows no variation with a mean almost equal to the range of 0.51; therefore no major impact paused by the temperature variance. The rice husk and peanut shell shows a linear increase in PM emission from 700°C to 1200°C and 600°C to 1000°C, respectively. Of the five fuels considered, wheat straw, wood and peanut shell had a maximum PM emission at 600°C during de-volatilization while the cornstalk and rice husk had maximum PM emission at the same temperature during char combustion.
During de-volatilization there is a linear decrease as the temperature increases with inconsistent spikes at 1100°C (Fig. 4A). Cornstalk shows a slightly different trend with major PM emissions at 600°C, 1100°C and 1200°C, however there exists a linear decrement as the temperature increases between 600°C and 1000°C (Fig. 4A). Combustion at the gas atmosphere of 30%O2/70%CO2 shows a significantly high PM emissions at 1100°C zone as observed in Fig. 4A.
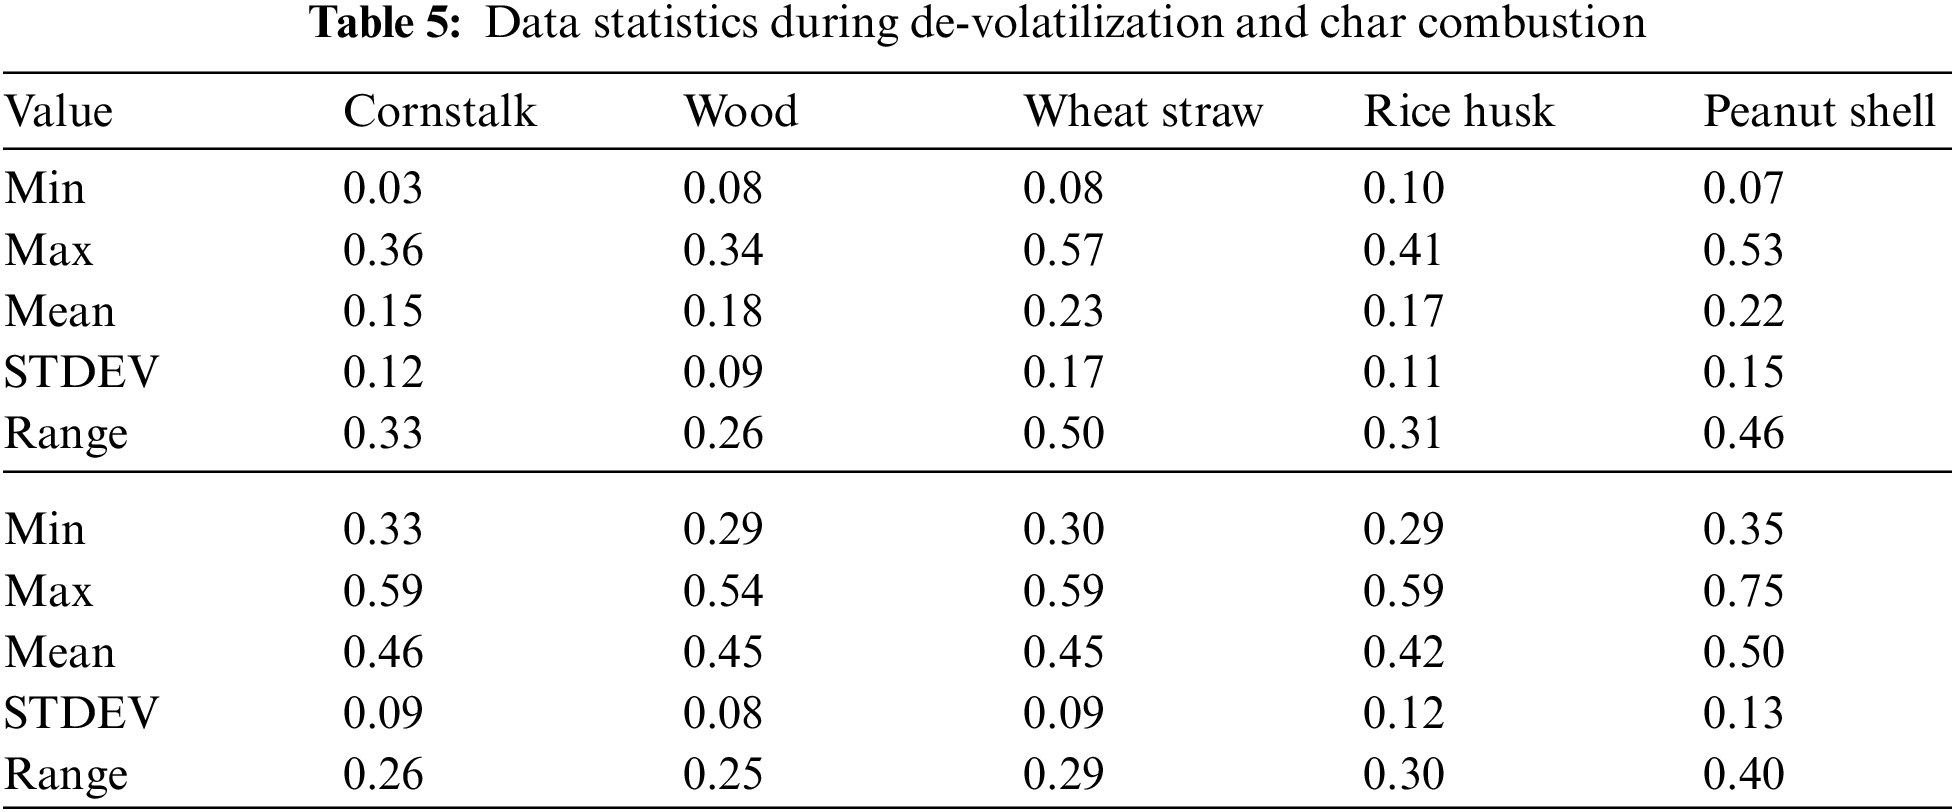
There is significantly high PM emission during char combustion with mean values of approximately 0.5 mg/g of fuel which are quite high compared to values of 0.2 mg/g of fuel during de-volatilization as seen in Table 4. There is an upward trend of PM emission during char combustion with exceptional low emissions at 1100°C as shown in Fig. 4B.
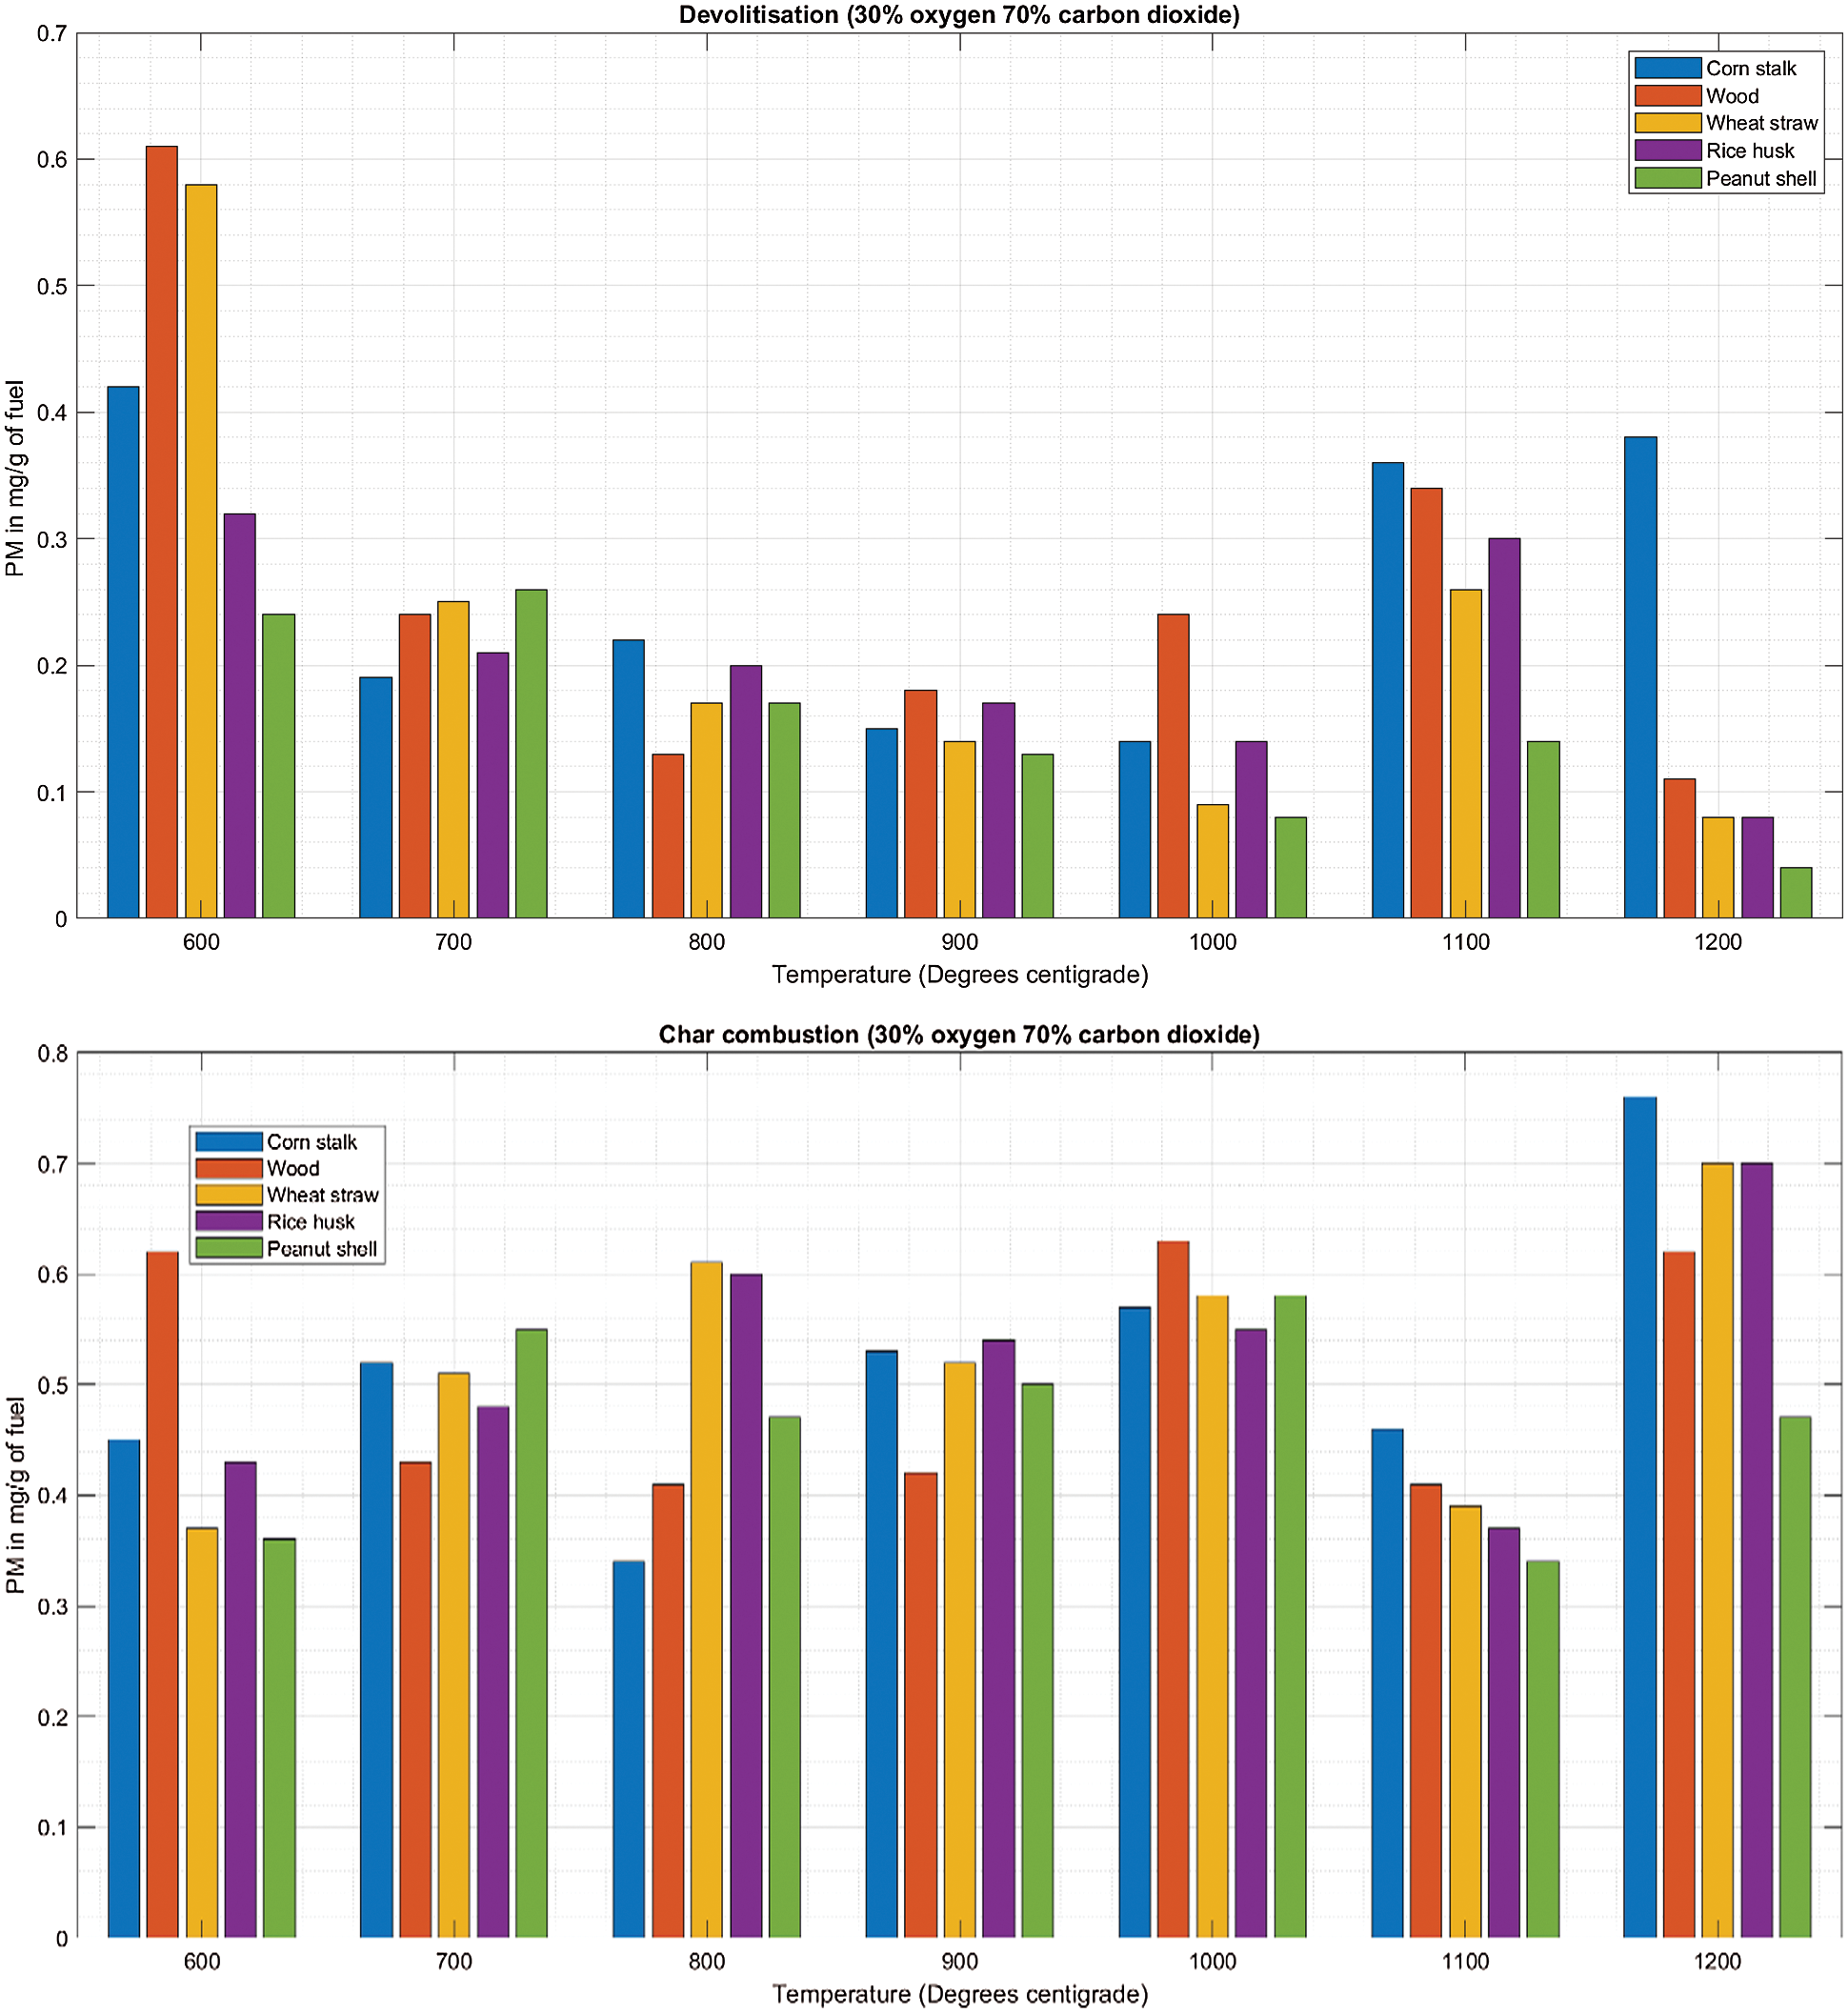
Figure 4: A & B PM vs. temperature during de-volatilization and char combustion
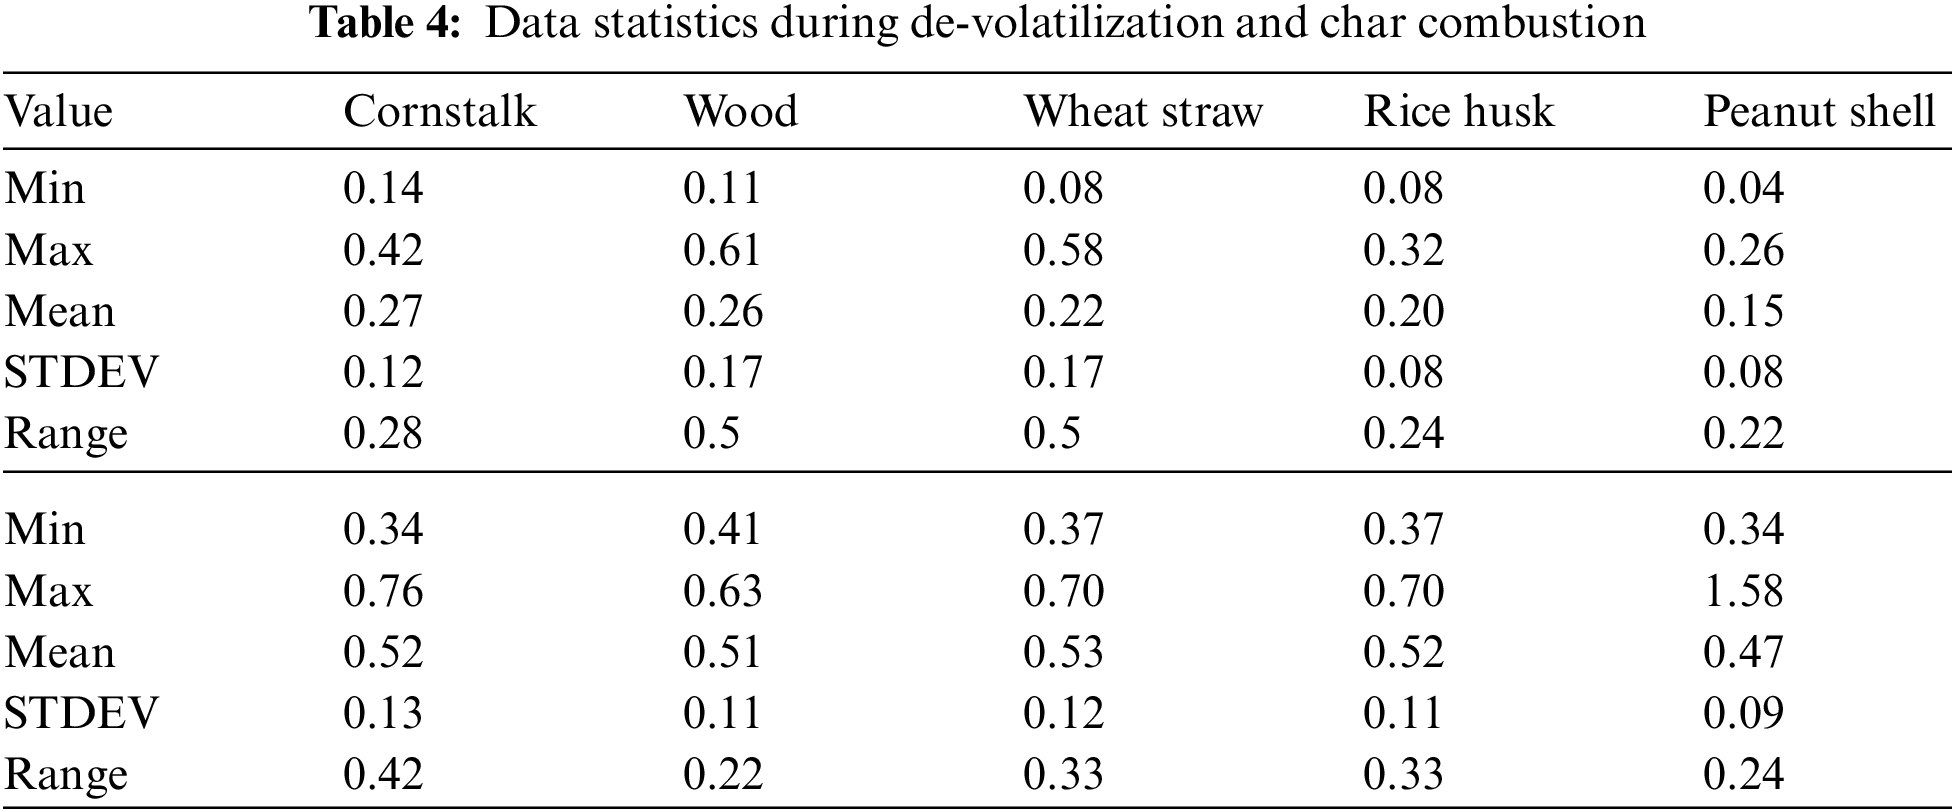
The increase in temperature leads to a decrease in PM emission during de-volatilization with exceptional trend at 1100°C and 900°C except for peanut shell where the decreasing trend is perfectly linear as seen in Fig. 5A. Fig. 5A shows that all biomass considered during de-volatilization has maximum emission ranging from 0.34 mg/g for wood to 0.57 mg/g (Table 5) for wheat straw at 600°C.
The observation made during char combustion at Fig. 5B indicates a high PM emission for all biomass with no remarkable consistent impact paused by the increasing temperature at this gas combination of 50% O2/50%CO2.
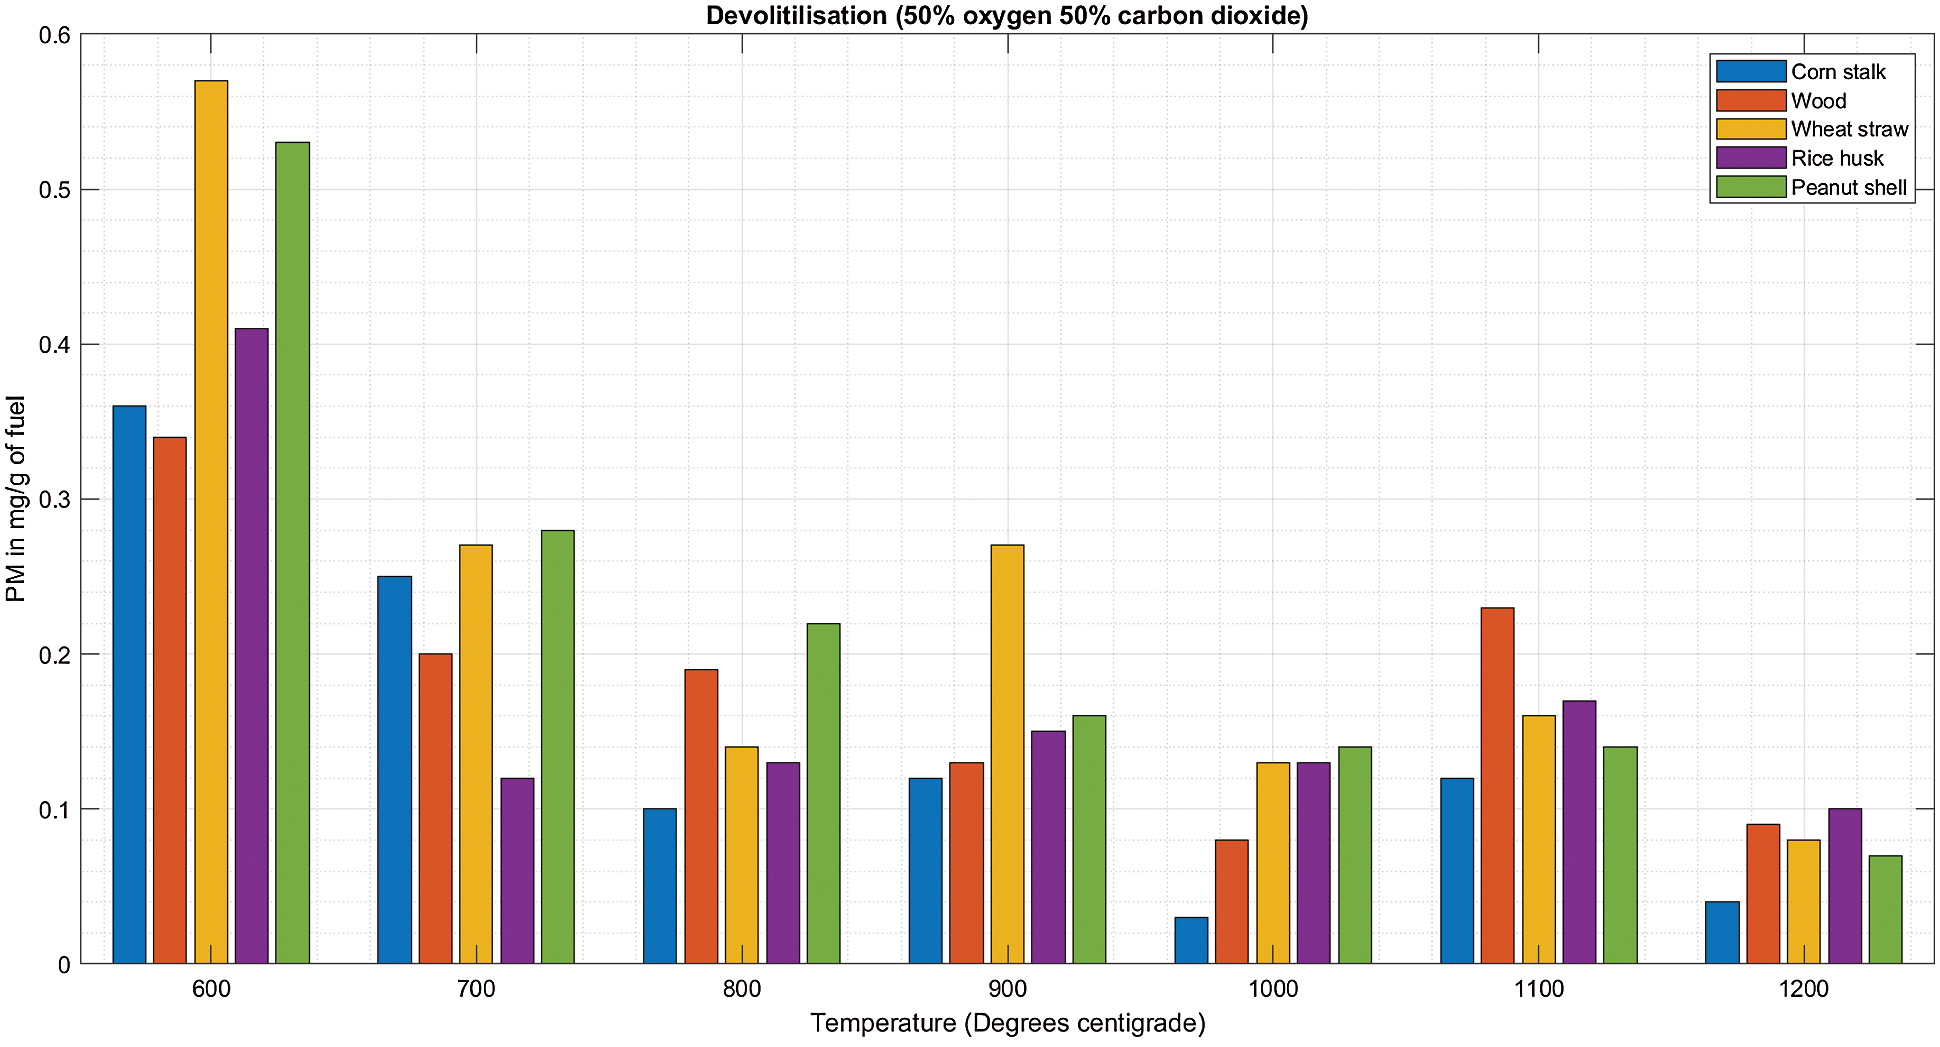
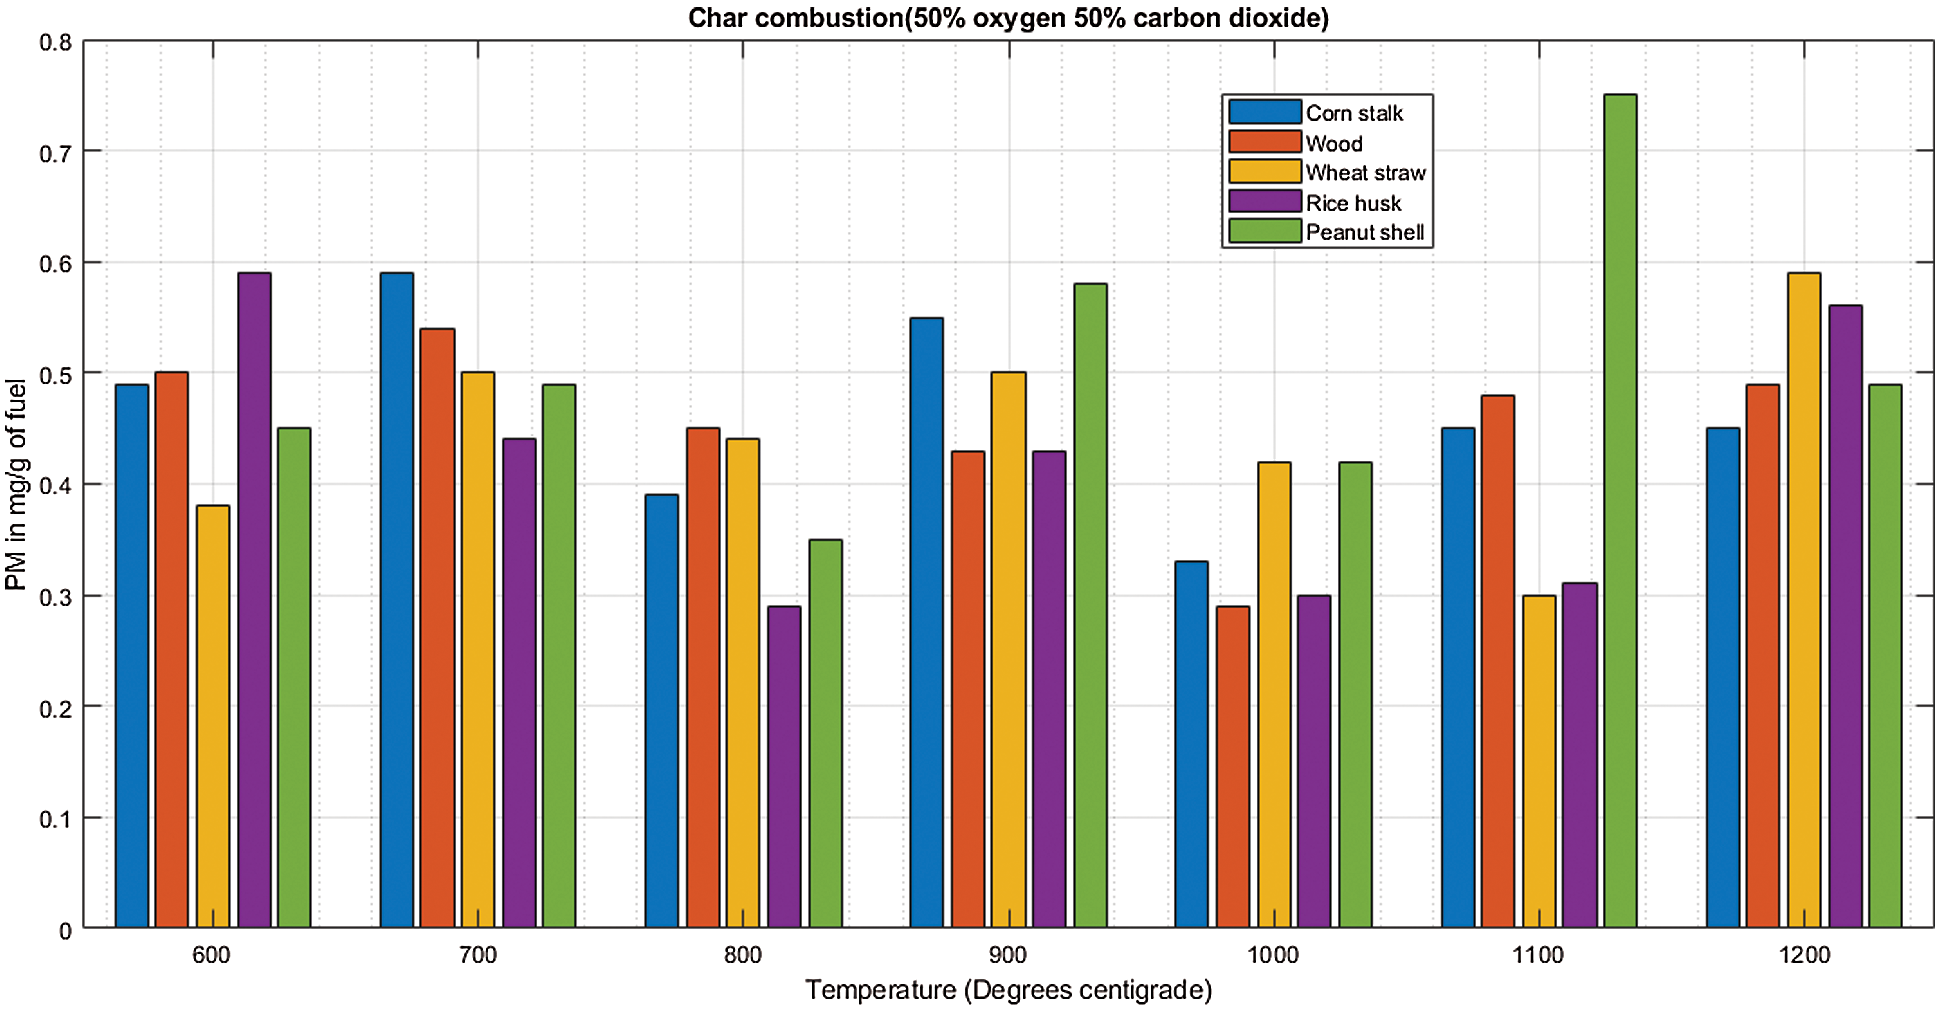
Figure 5: A & B PM vs. temperature during de-volatilization and char combustion
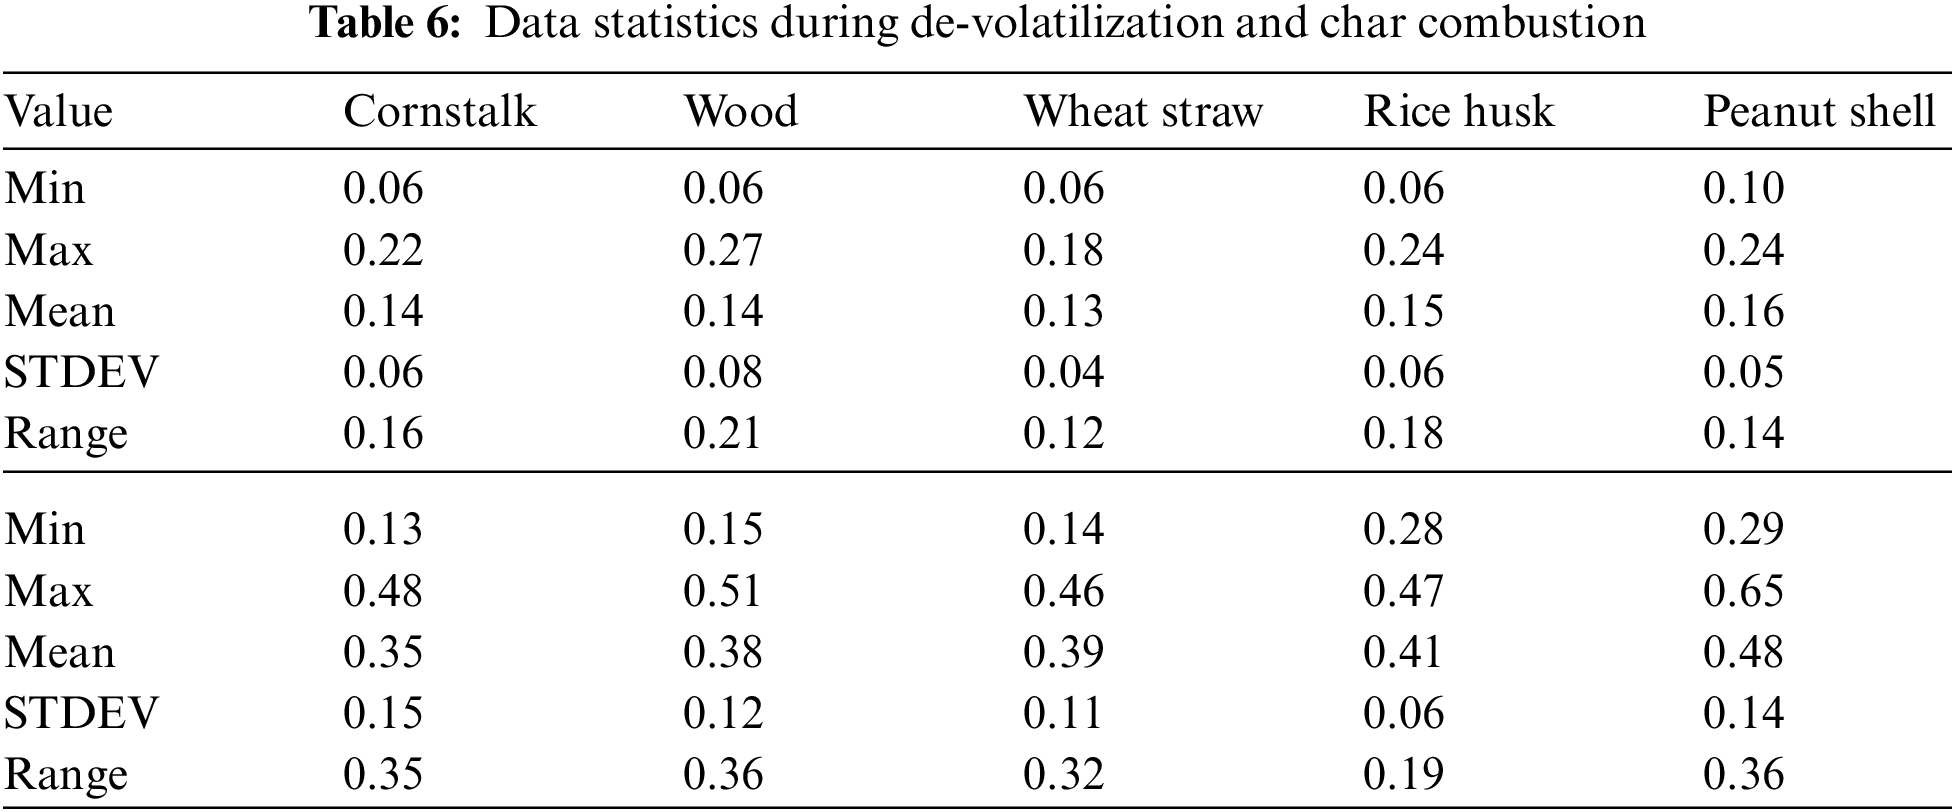
There is a linear increment in PM emission as temperature increases from 600°C to 800°C concurrently for the five biomass fuels during de-volatilization as shown in Fig. 6A. There is a following decrease in PM emission as temperature increases further between 1100°C to 1200°C. At 1200°C, wood (0.6 mg/g), wheat straw (0.6 mg/g), rice husk (0.6 mg/g) and peanut shell (0.1 mg/g) emitted their least PM during de-volatilization as shown in Table 6 and Fig. 6A. At 70%O2 and 30%CO2 in Fig. 6B, there was a converse observation compared to observations made when the O2 concentration was below 70%, i.e., in Figs. 4B and 5B, significantly high PM emissions were observed at 600°C during both de-volatilization and char combustion. The initial cases record a mean of more than 0.3 mg/g of fuel for all fuel at 600°C while at 70% oxidant onwards, the emission of PM is at 0.2 mg/g and below at the same temperature with scanty differing outcomes. At this point the atmosphere of 70%O2/30%CO2 starts to register its effect significantly. The abundant oxidant makes the combustion reaction efficient enough to eliminate the excessive emissions of PM formed earlier on when the oxidizer and the temperature were deficient making the combustion incomplete.
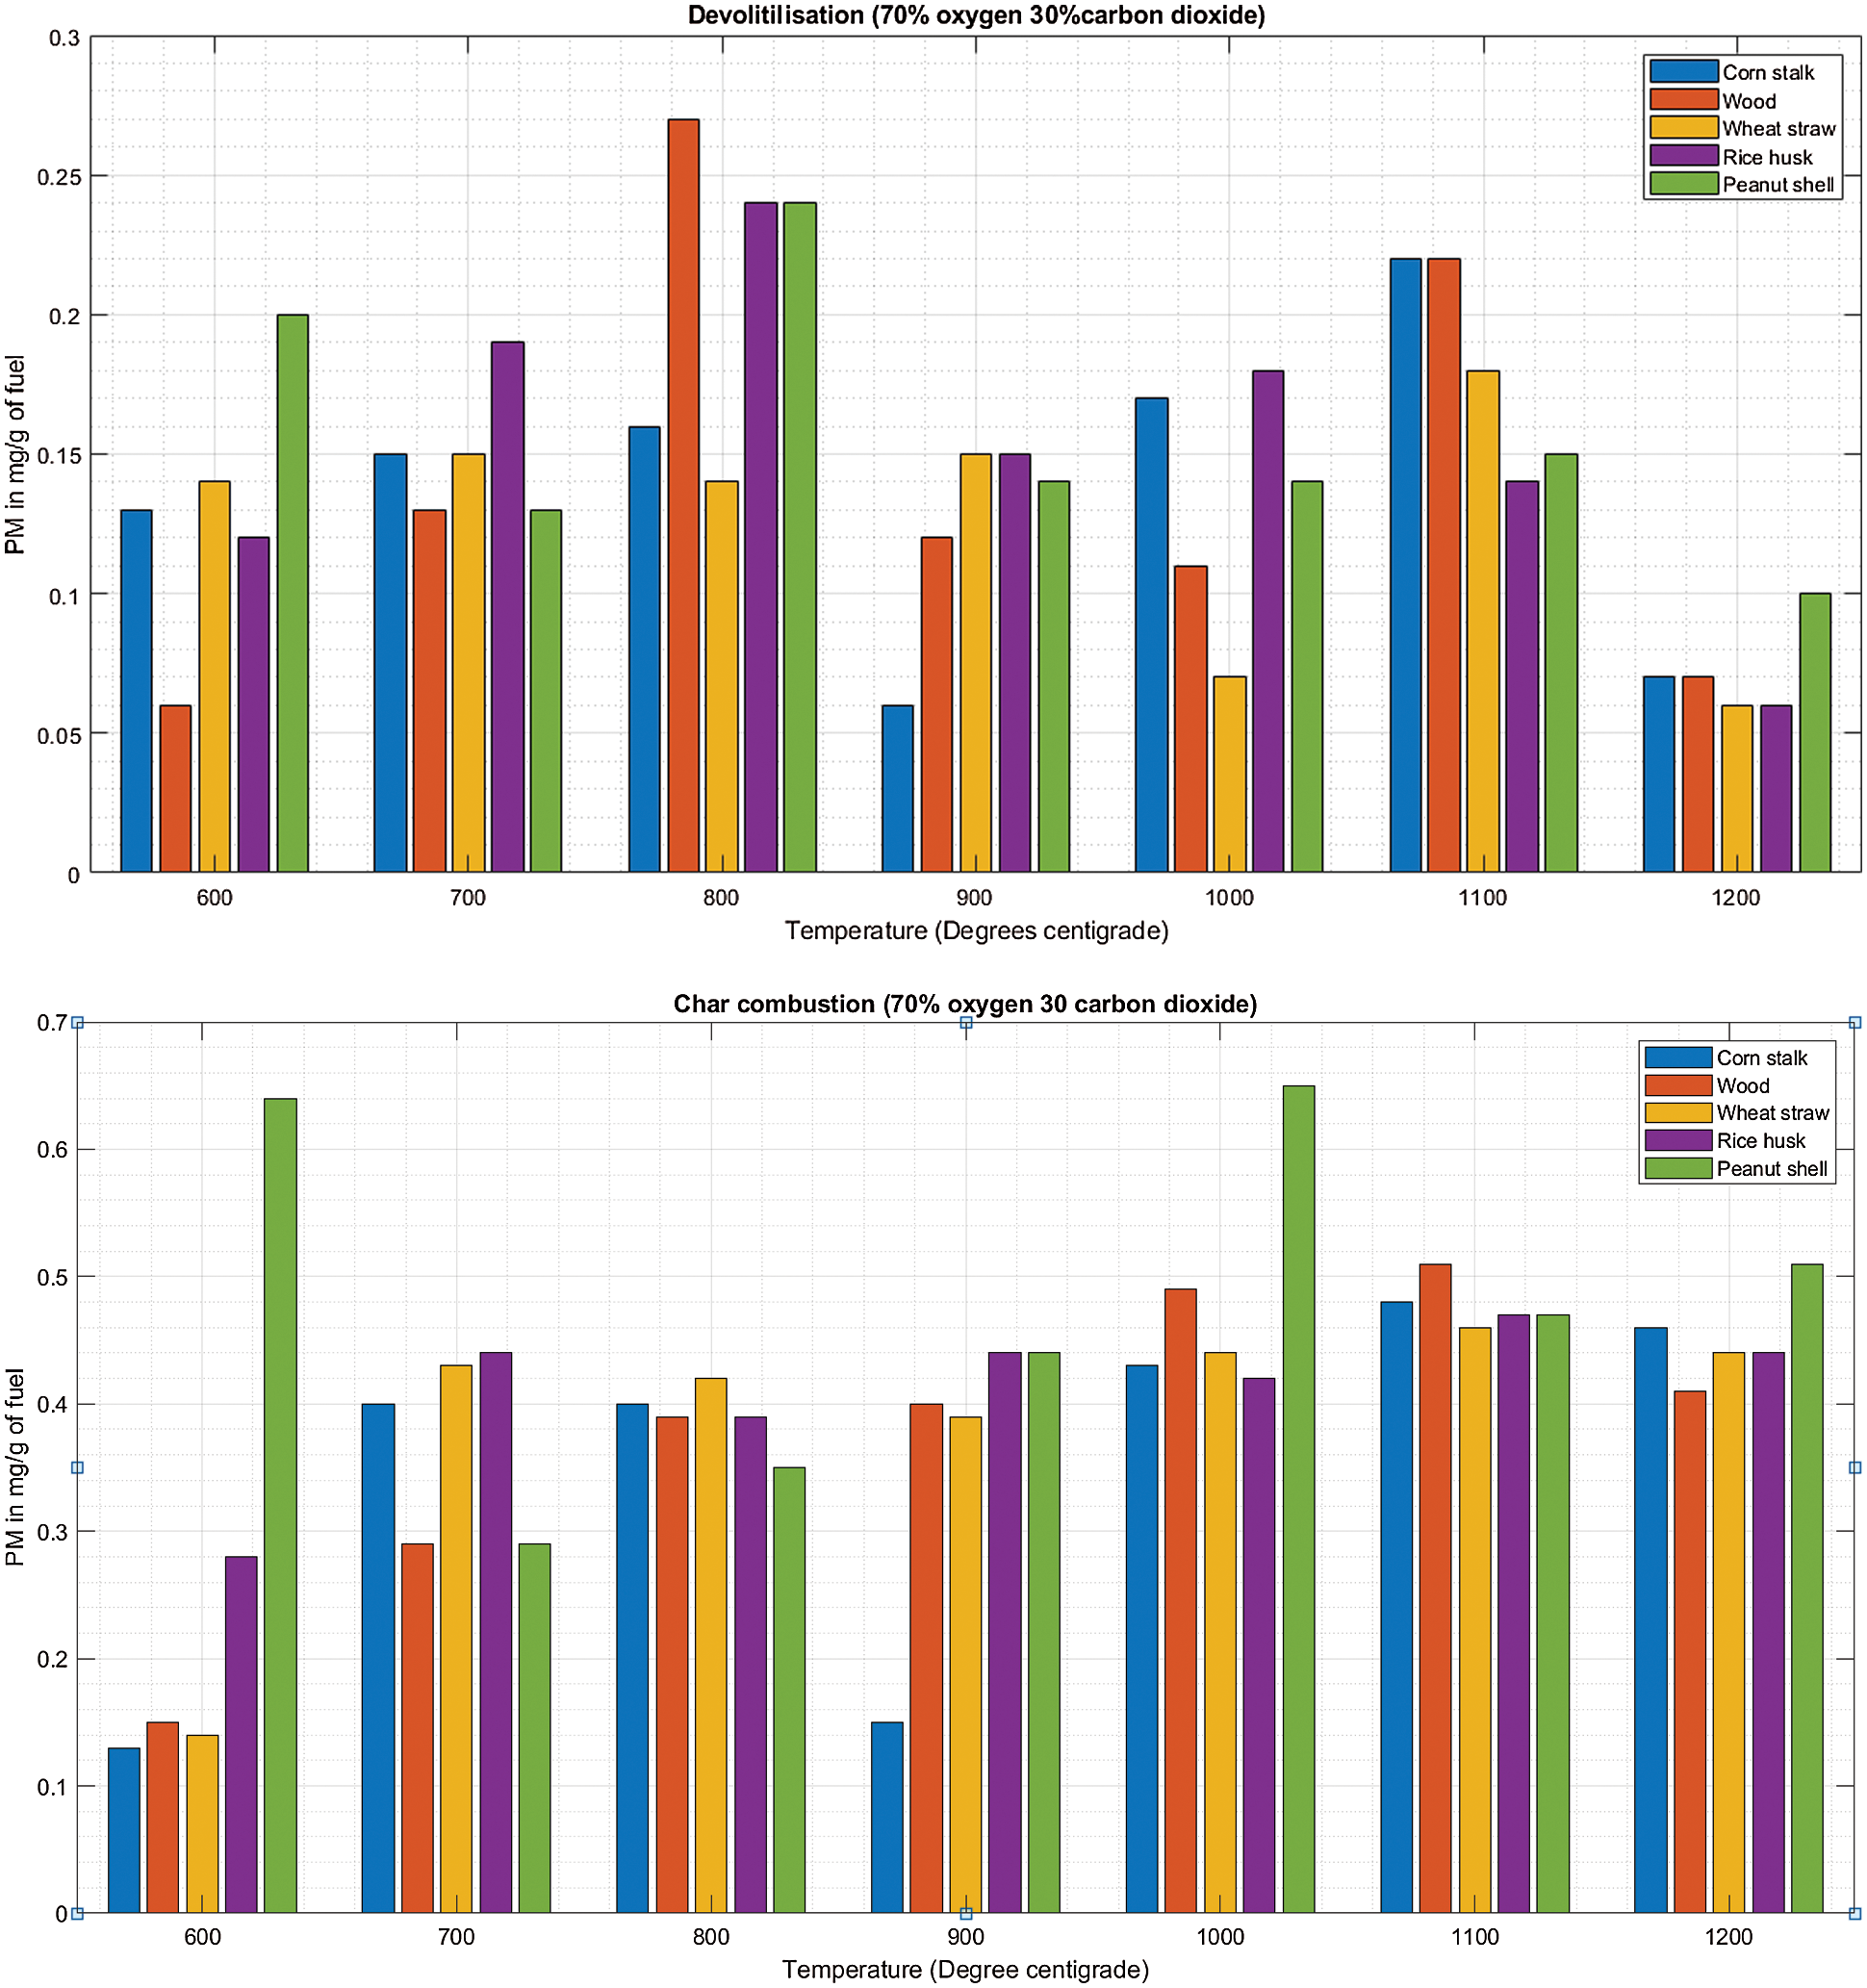
Figure 6: A & B PM vs. temperature during de-volatilization and char combustion
There is significantly low PM at 700°C and 1200°C during de-volatilization as shown in Fig. 7A. During char combustion (data statistics during devolatilization and char combustion summarized in Table 7), all biomass increases steadily with increase in temperature as shown in Fig. 7B with slight inconsistencies at 600°C and 1100°C. Special observations were severally observed at 600°C and 1100°C showing exceptional emissions that seem to break the pattern. This could be linked to the thought that at 600°C the biomass is not efficiently burned especially the volatile organic compounds giving rise to high emissions in several de-volatilization investigations. At 1100°C, studies have shown that there is marginal or no unburnt volatile organic compounds at this temperature, the temperature is efficient for combustion however, the high emissions observed in several occasions at this thermal zone could be associated to the volatilization and melting of major and minor biomass elements as well as sublimation of refractory species followed by nucleation and coagulation giving rise to high emissions of PM [25].
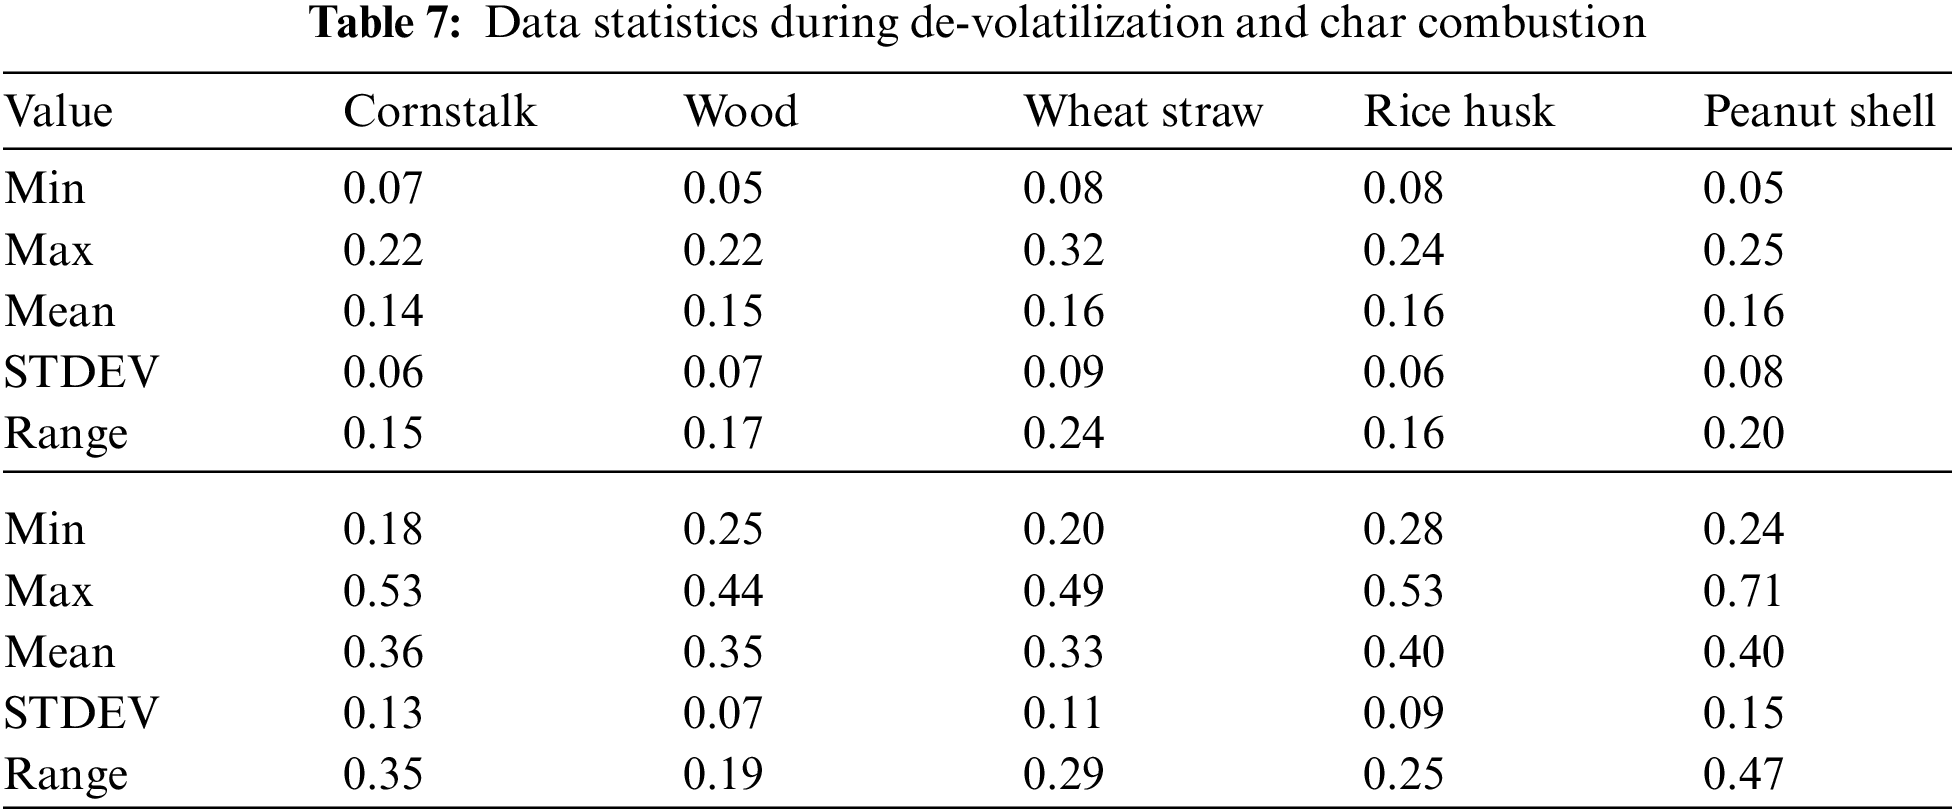
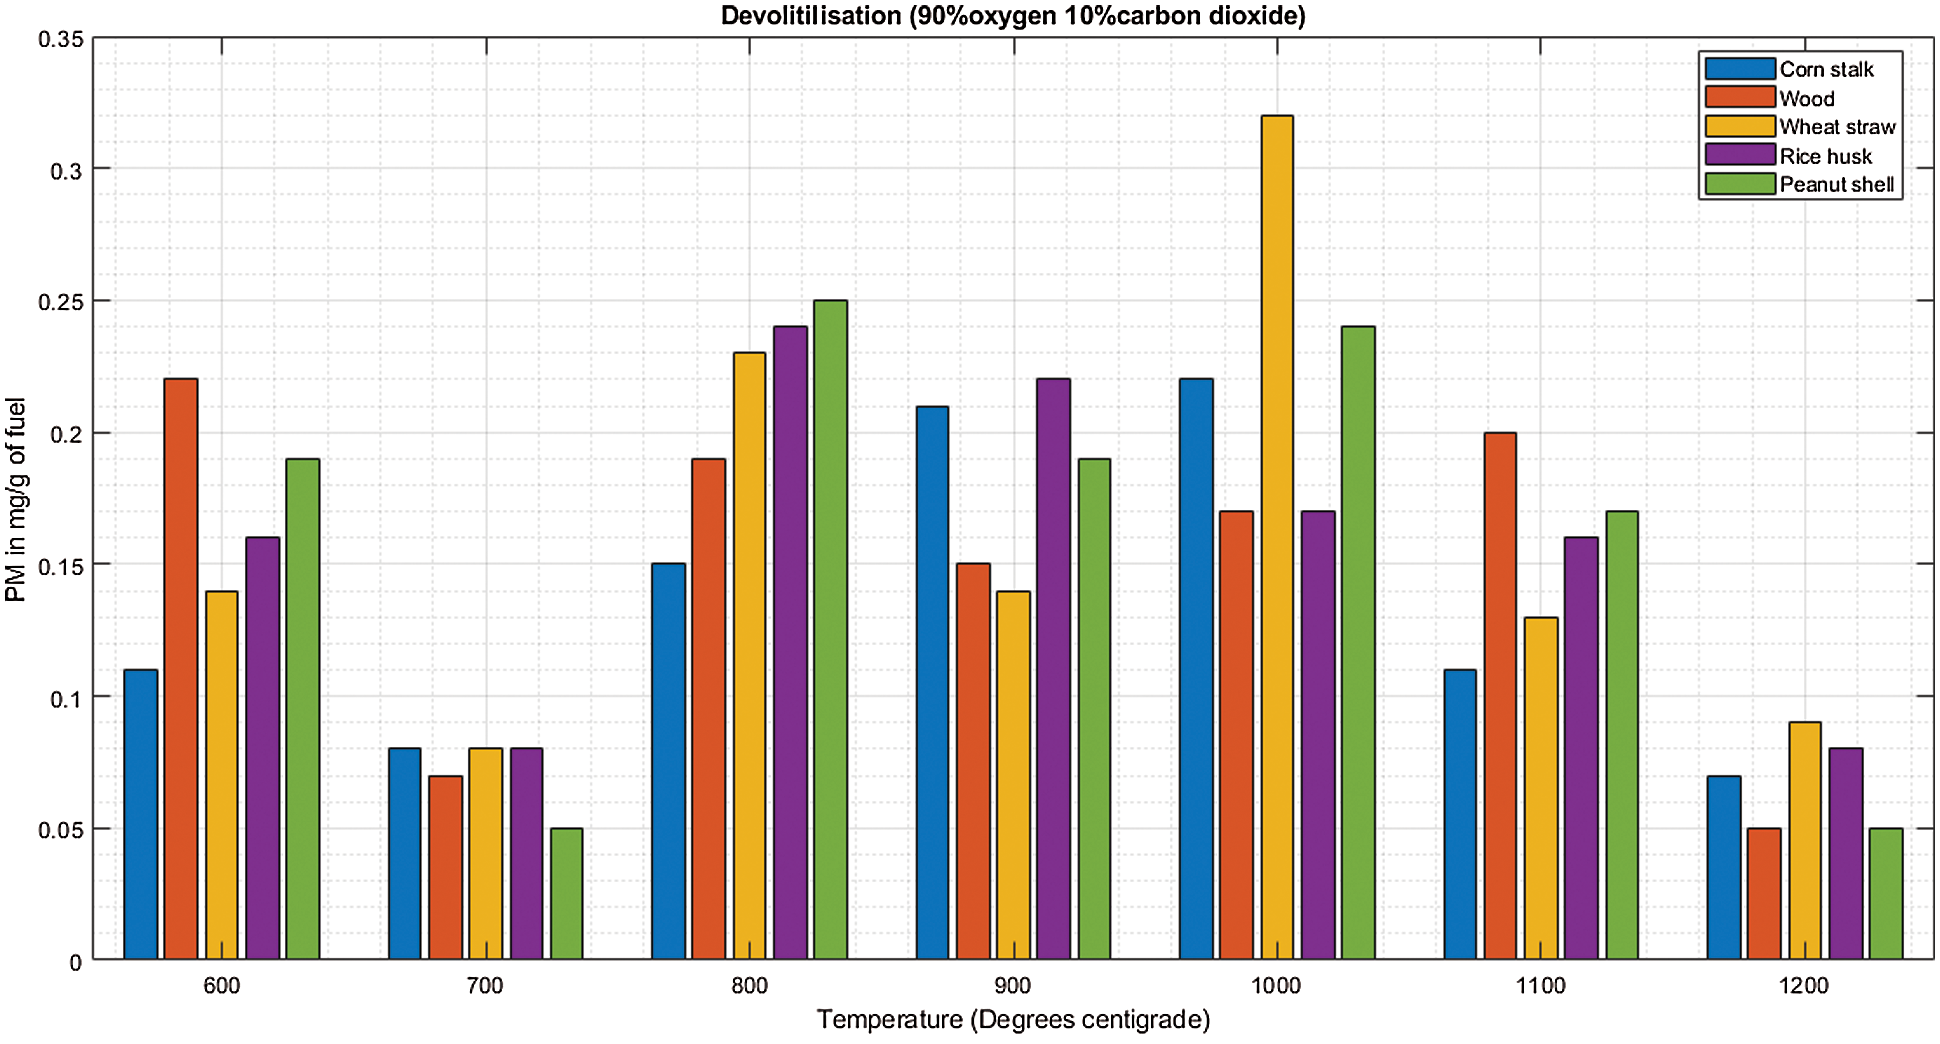
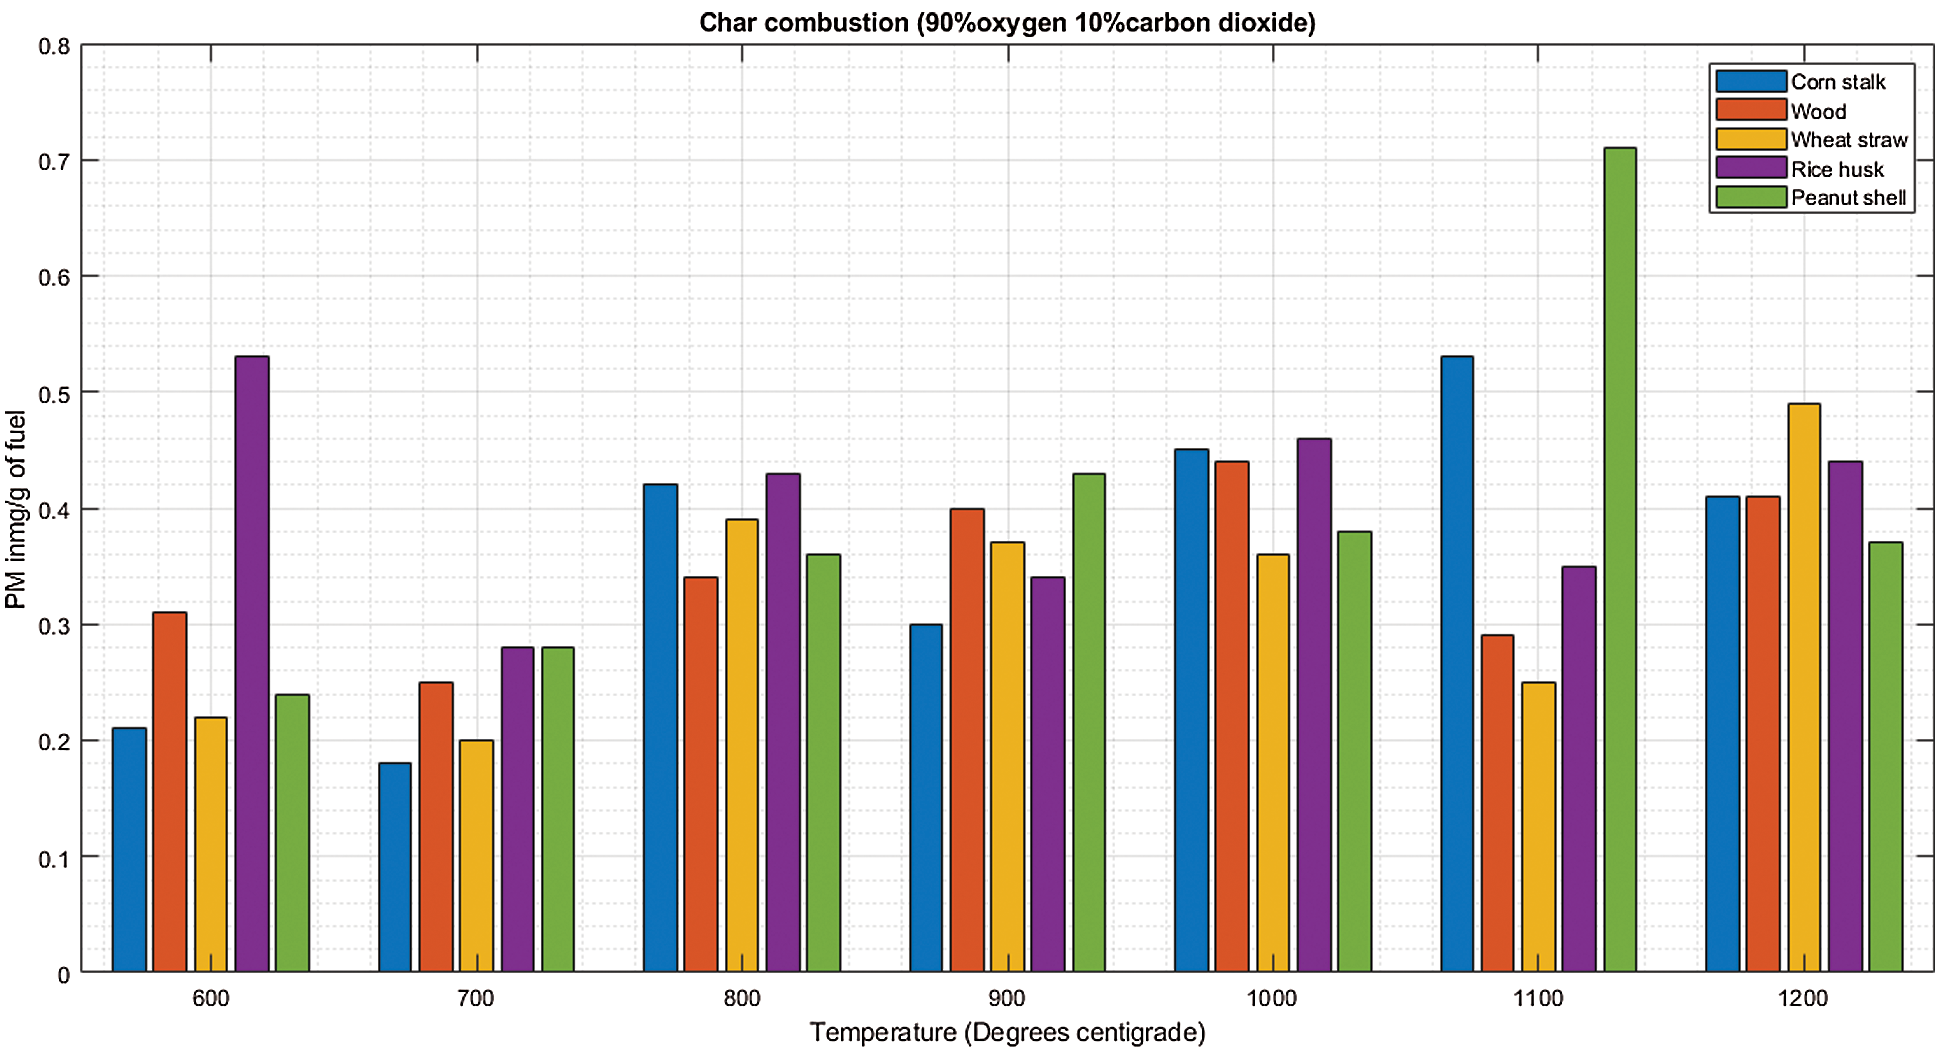
Figure 7: A & B PM vs. temperature during de-volatilization and char combustion
There is a consistent increase in PM emission as temperature increases from 600°C to 1100°C during char combustion as shown in Fig. 8B. The mean PM emitted was 0.28 ± 0.019 mg/g of cornstalk, 0.30 ± 0.018 mg/g of wood, 0.31 ± 0.018 mg/g of wheat straw, 0.32 ± 0.023 mg/g of rice husk, 0.33 ± 0.023 mg/g of peanut shell.
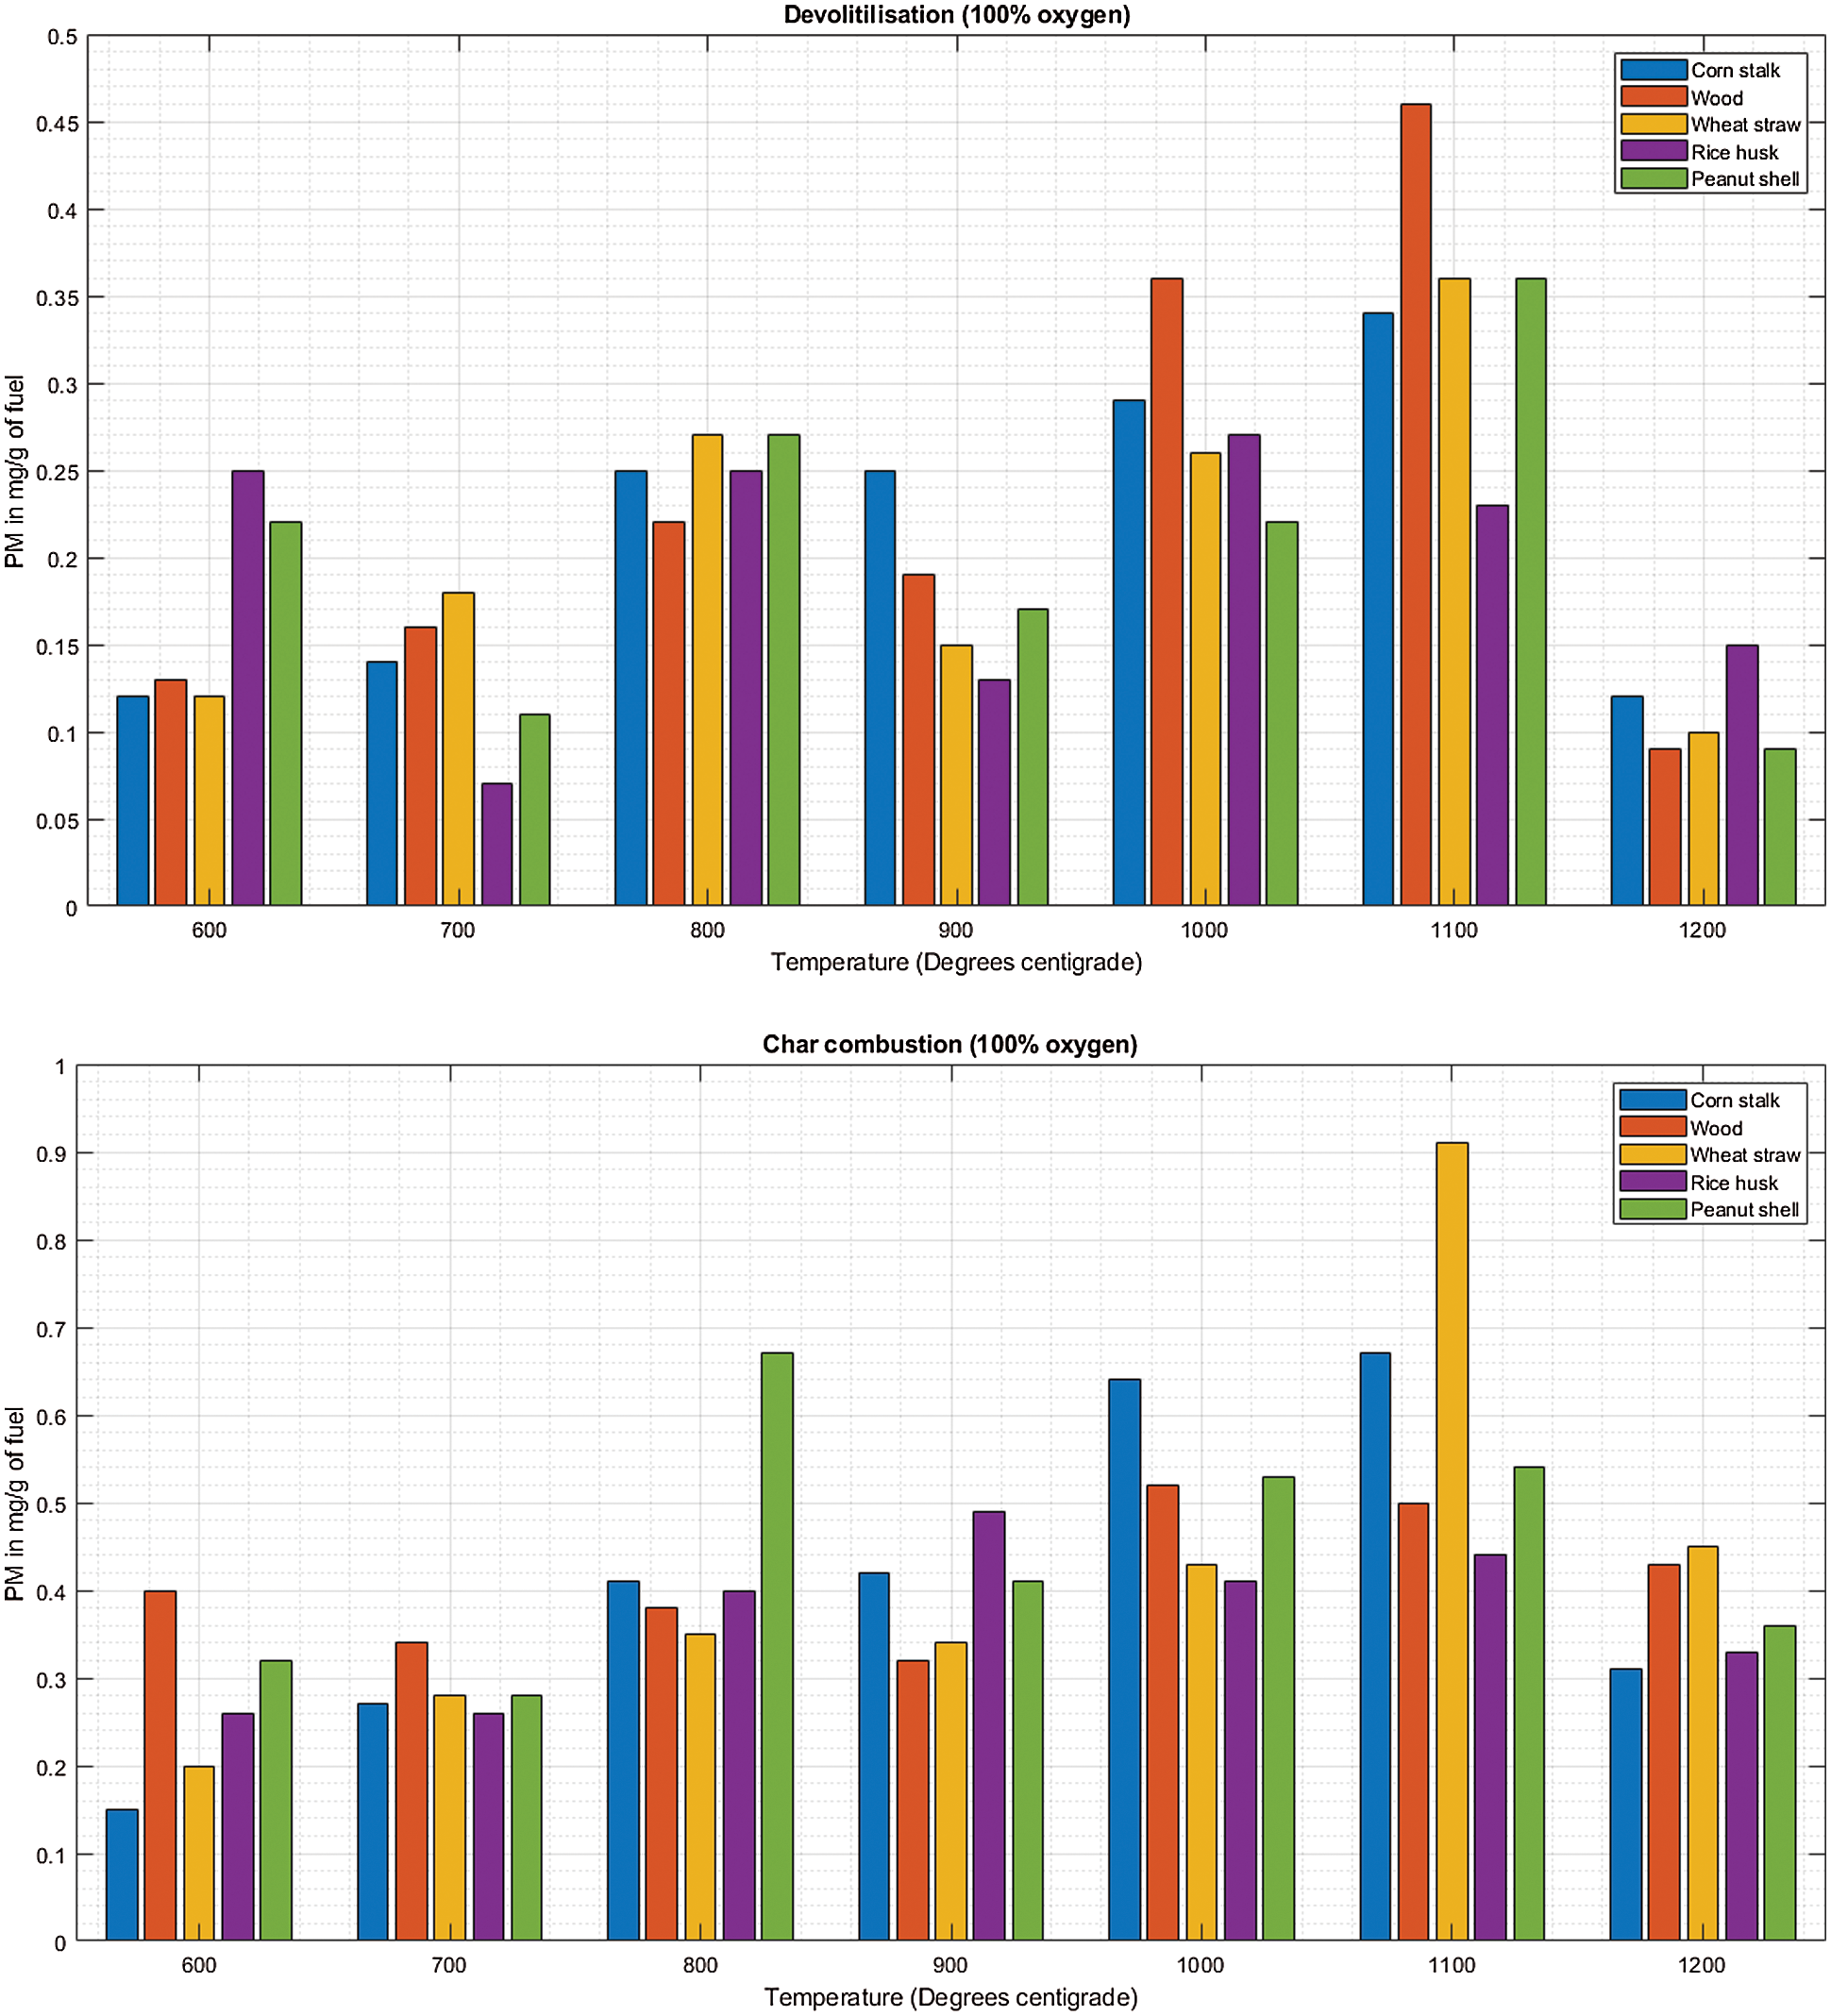
Figure 8: A & B PM vs. temperature during de-volatilization and char combustion
The trend shows higher PM potential for the herbaceous, low density fuels. During combustion, a fraction of the inorganic compounds in the fuel is volatilized, i.e., potassium. Some refractory species that are copious in burnt herbaceous plants like silica and calcium are also sublimed to gaseous state making the herbaceous plants more likely to form fly ash depending also on other contributing factors [24].
The increase in oxygen concentration and temperature increases the rate of combustion hence decreasing the time of combustion. Increasing the temperature from 600°C to 700°C decreases the time by approximately 40% in low oxygen content (21%/79%) and by 15% in high oxygen content (100%) as shown in Figs. 9a–9e.
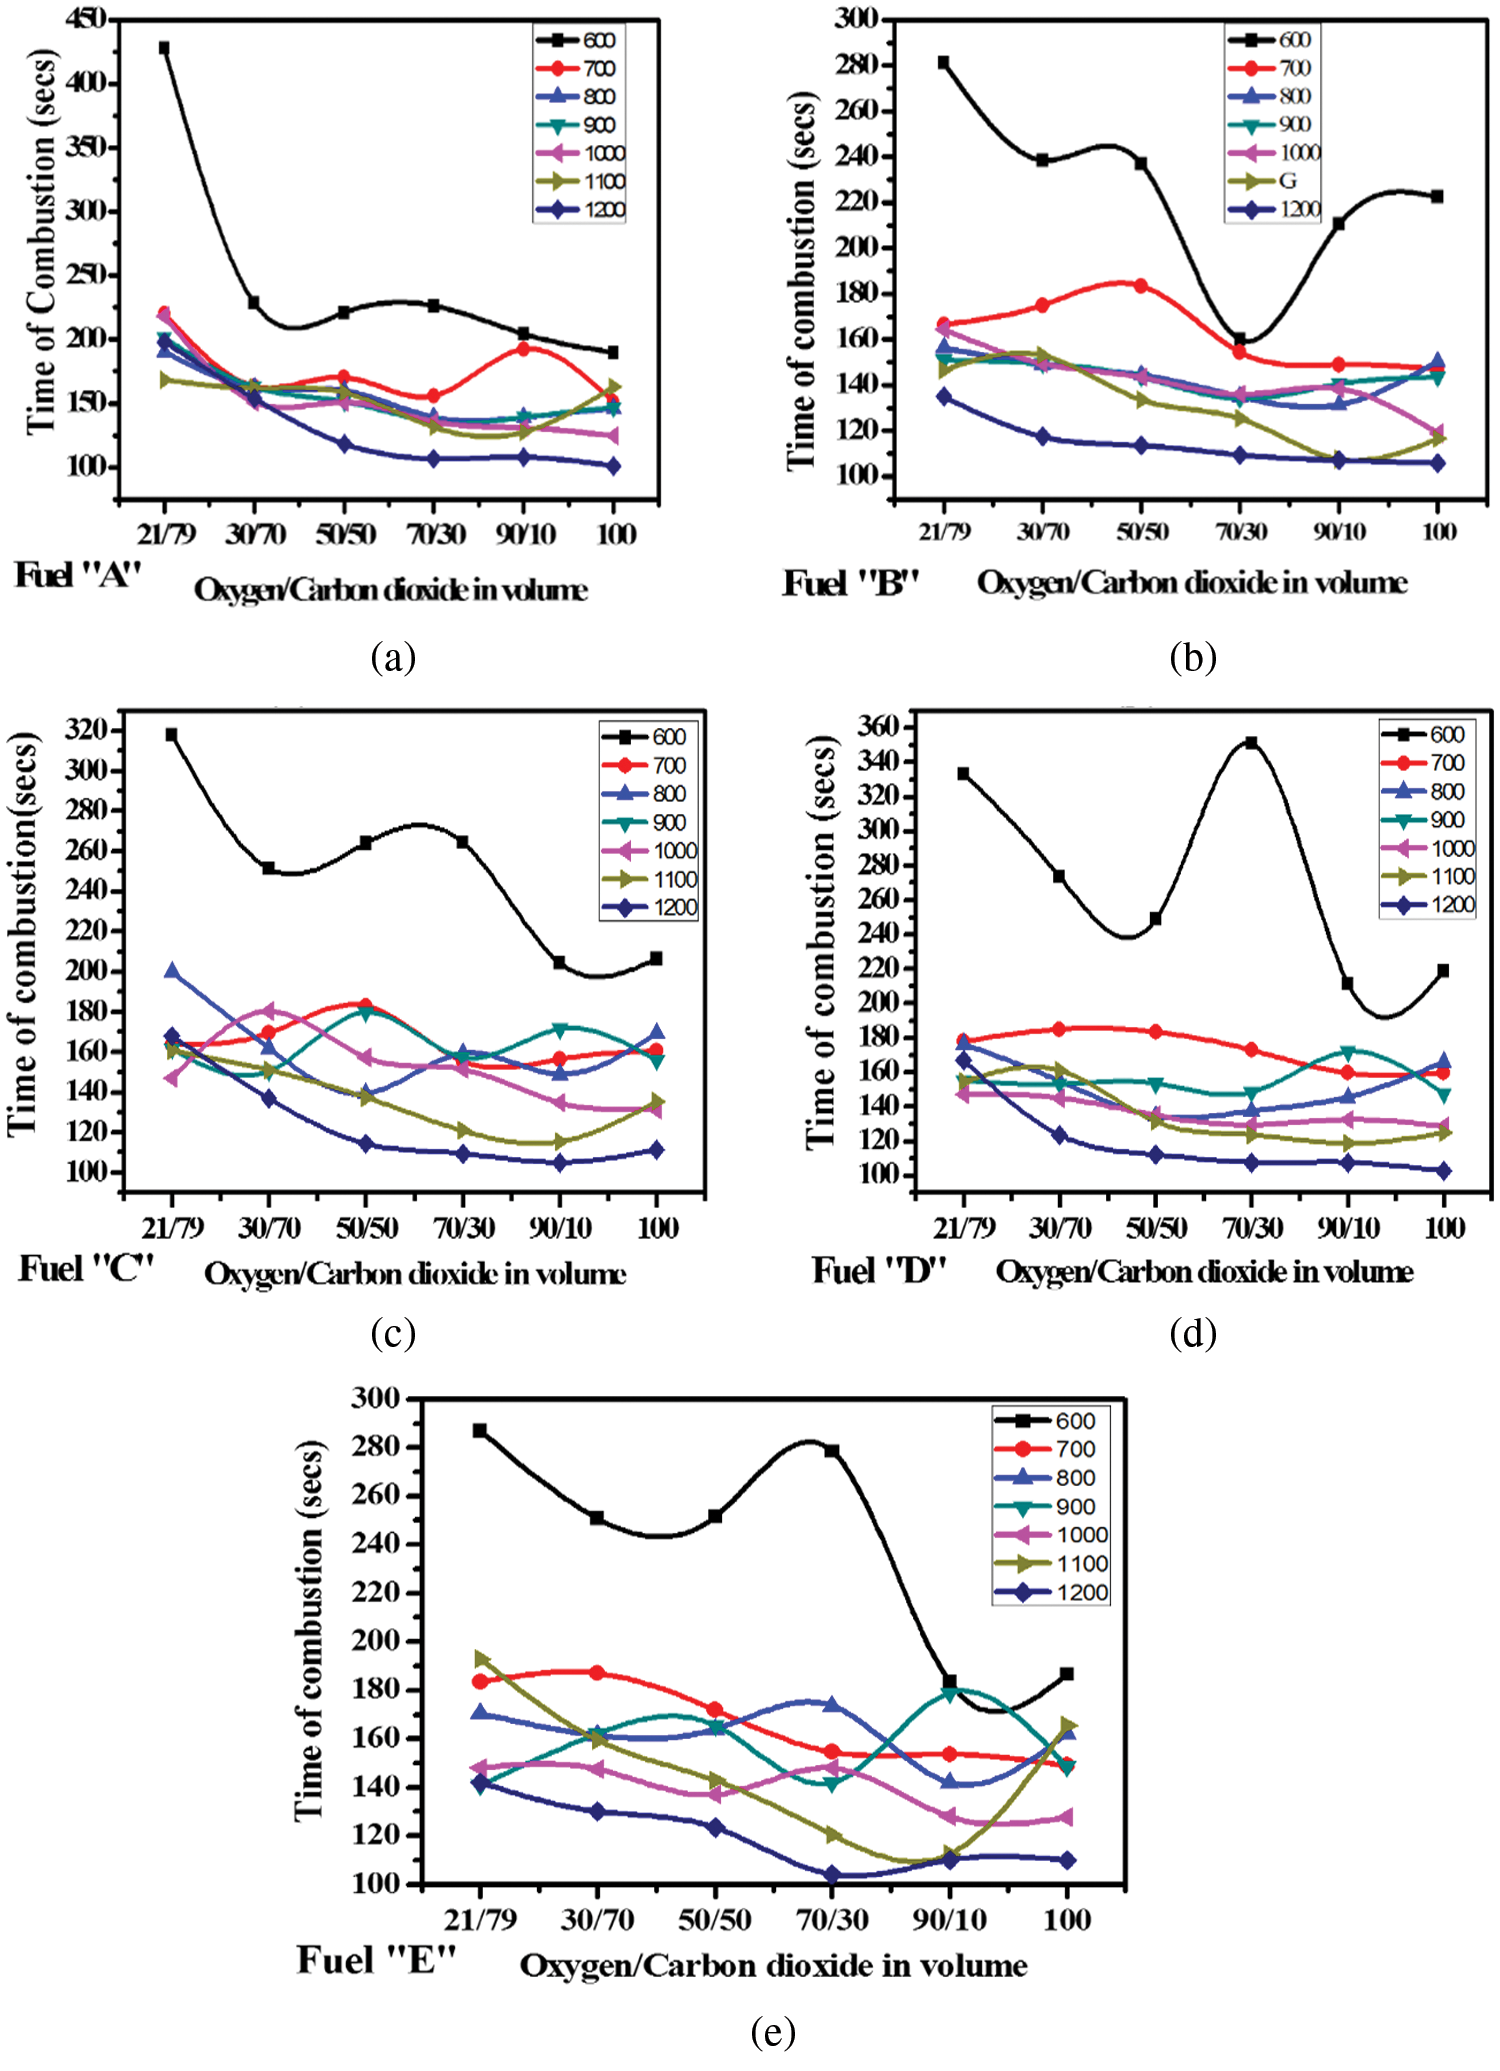
Figure 9: (a)--(e) Profiles of Combustion time for all given fuel types along varying oxidizer ratio under different furnace temperatures
The decrease in time of combustion also decreases as the temperatures spiral upwards indicating a definite limit at a specific point. Studies have shown that oxygen concentration has a significant effect on coal particle combustion with experimental findings demonstrating that the peak temperature and the burnout temperature are both decreased with increased oxygen concentration, the same holds in biomass as observed in Figs. 9a–9e.
In this paper, combustion was conducted in a fixed bed reactor. The experiments were conducted at seven different temperatures (600°C–1200°C) and six different oxygen concentrations. Five biomass types were studied: A-cornstalk, B-wood, C-wheat straw, D-Rice husk, E-Peanut shell each powdered to a size of approximately 75 microns. The main conclusions are:
PM emitted during char combustion is consistently higher than that emitted during the de-volatilization (Figs. 3A & 3B to 8A & 8B). Given that the temperatures investigated are efficient for combustion of biomass, the emissions of PM are largely associated with the volatilization and melting of the elements of the fuels considered.
Considering all de-volatilization observations, increase in temperature leads to linear decrease in PM emission between atmospheres of 21%O2 to 50%O2 (Figs. 3A–5A), thereafter, between 70%O2 to 100%O2 increase in temperature leads to increase in PM (Figs. 6A–8A) with few instances of inconsistency.
There average PM formation from all the five considered biomass is relatively comparable however, with differing atmospheres and temperatures, the fibrous and low-density biomass forms more emissions of PM. The mean PM emitted was 0.28 ± 0.019 mg/g of cornstalk, 0.30 ± 0.018 mg/g of wood, 0.31 ± 0.018 mg/g of wheat straw, 0.32 ± 0.023 mg/g of rice husk, 0.33 ± 0.023 mg/g of peanut shell.
During char combustion, the study shows that at oxygen levels of 21%, 70%, 90% and 100%, increase in temperature leads to increase PM emission with slight peculiar observations at some temperatures. At 30% and 50% oxygen the observation shows a lateral distribution with no consistent identifiable rise or fall.
The increase in oxygen concentration and temperature increases the rate of combustion hence decreasing the time of combustion.
Funding Statement: Authors are grateful to Quanzhou Tongjiang Scholar Special Fund for financial support through Grant No. (600005-Z17X0234); Quanzhou Science and Technology Bureau for financial support through Grant No. (2018Z010), and Huaqiao University through Grant No. (17BS201); and the Fujian Provincial Department of Science and Technology for financial support through Grant (2018J05121). Authors are also grateful for financial support from the Fujian Provincial Department of Science and Technology through Grant Nos. 2021I0014 and 2018J05121.
Conflicts of Interest: The authors declare no potential conflict of interest with respect to research, authorship and publication of this article.
1. Agency, E. P. (2021). https://www.epa.gov/. [Google Scholar]
2. Xing, Y. F., Xu, Y. H., Shi, M. H., Lian, Y. X. (2016). The impact of PM2.5 on the human respiratory system. Journal of Thoracic Disease, 8(1). DOI 10.3978/j.issn.2072-1439.2016.01.19. [Google Scholar] [CrossRef]
3. Lee, J. E., Lim, H. J., Kim, Y. Y. (2021). Publication trends in research on particulate matter and health impact over a 10-year period: 2009–2018. Environment and Health Toxicology, 36(1), 1–13. DOI 10.5620/eaht.2021005. [Google Scholar] [CrossRef]
4. Tai, A. P. K., Mickley, L. J., Jacob, D. G. (2010). Correlations between fine particulate matter (PM2.5) and meteorological variables in the United States: Implications for the sensitivity of PM2.5 to climate change. Atmospheric Environment, 44(32), 3976–3984. DOI 10.1016/j.atmosenv.2010.06.060. [Google Scholar] [CrossRef]
5. Heald, C. L., Henze, D. K., Horowitz, L. W., Feddema, J., Lamarque, J. F. et al. (2008). Predicted change in global secondary organic aerosol concentrations in response to future climate, emissions, and land use change. Journal of Geophysical Research: Atmospheres, 113, 1–16. DOI 10.1029/2007JD009092. [Google Scholar] [CrossRef]
6. Pye, H. O. T., Wu, S., Liao, H., Mickley, L. J., Jacob, D. J. et al. (2009). Effect of changes in climate and emissions on future sulfate nitrate ammonium aerosol levels in the United States. Journal of Geophysical Research: Atmospheres, 114, 1–18. DOI 10.1029/2008JD010701. [Google Scholar] [CrossRef]
7. Herich, H., Hueglin, C., Buchmann, B. (2011). A 2.5 year's source apportionment study of black carbon from wood burning and fossil fuel combustion at urban and rural sites in Switzerland. Atmospheric Measurement Techniques, 4(7), 1409–1420. DOI 10.5194/amt-4-1409-2011. [Google Scholar] [CrossRef]
8. Gilardoni, S., Vignati, E., Cavalla, F., Putaud, J. P., Larsen, B. R. et al. (2011). Better constraints on sources of carbonaceous aerosols using a combined 14C–macro tracer analysis in a european rural background site. Atmospheric Chemistry and Physics, 11, 1–16. DOI 10.5194/acp-11-5685-2011. [Google Scholar] [CrossRef]
9. Al-Abbas, A. H., Naser, J. (2013). Oxy–fuel combustion in the lab–scale and large–scale fuel–fired furnaces for thermal power generations. In: Thermal power plants-Advanced application, pp. 51–84. InTech. DOI 10.5772/55152. [Google Scholar] [CrossRef]
10. Bølling, A. K., Pagels, J., Yttri, K. E., Barregard, L., Sallsten, G. et al. (2009). Health effects of residential wood smoke particles: The importance of combustion conditions and physicochemical particle properties. Particle and Fibre Toxicology, 29, 1–20. DOI 10.1186/1743-8977-6-29. [Google Scholar] [CrossRef]
11. Dellinger, B., Pryor, W. A., Cueto, B., Squadrito, G. L., Deutsch, W. A. (2000). The role of combustion-generated radicals in the toxicity of PM2.5. Proceedings of the Combustion Institute, 28(2), 2675–2681. DOI 10.1016/S0082-0784(00)80687-6. [Google Scholar] [CrossRef]
12. Leskinen, J., Uski, O., Tissari, J., Torvela, T., Lamberg, H. et al. (2014). Fine particle emissions in three different combustion conditions of a wood chip-fired appliance–Particulate physico-chemical properties and induced cell death. Atmospheric Environment, 86, 129–139. DOI 10.1016/j.atmosenv.2013.12.012. [Google Scholar] [CrossRef]
13. Zhang, L., Yoshihiko, N. (2006). Emission of suspended PM10 from laboratory-scale coal combustion and its correlation with coal mineral properties. Fuel, 85(2), 19203. https://doi.org/10.1016/j.fuel.2005.03.034. [Google Scholar]
14. Li, X., Duan, L., Wang, S., Guo, X., Yi, H. et al. (2007). Emission characteristics of particulate matter from rural household biofuel combustion in China. Energy Fuels, 21(2), 845–851. DOI 10.1021/ef060150g. [Google Scholar] [CrossRef]
15. Tissari, T., Lyyränen, J., Hytönen, K., Sippula, O., Tapper, U. et al. (2008). Fine particle and gaseous emissions from normal and smouldering wood combustion in a conventional masonry heater. Atmospheric Environment, 42(34), 7862–7873. DOI 10.1016/j.atmosenv.2008.07.019. [Google Scholar] [CrossRef]
16. Fix, G., Seames, W., Mann, M. D., Benson, S. A., Miller, D. (2013). The effect of combustion temperature on coal ash fine-fragmentation mode formation mechanisms. Fuel, 113, 140–147. DOI 10.1016/j.fuel.2013.05.096. [Google Scholar] [CrossRef]
17. Zhang, L., Yoshihiko, N., Yamashita, T. (2006). Formation of submicron particulate matter (PMI) during coal combustion and influence of reaction temperature. Fuel, 85, 1446–1457. DOI 10.1016/j.fuel.2006.01.009. [Google Scholar] [CrossRef]
18. Zhuo, J. K., Yao, Q., Song, Q. (2009). The progressive formation of submicron particulate matter in a quasi one-dimensional pulverized coal combustor. Proceedings of the Combustion Institute, 32(2), 2059–2066. DOI 10.1016/j.proci.2008.06.108. [Google Scholar] [CrossRef]
19. Zhan, Z., Fry, A., Zhang, Y., Wendt, J. O. L. (2014). Ash aerosol formation from oxy-coal combustion and its relation to ash deposit chemistry. Proceedings of the Combustion Institute, 35(2), 2373–2380. DOI 10.1016/j.proci.2014.07.001. [Google Scholar] [CrossRef]
20. Li, G., Dong, M., Li, S., Yao, Q., Guo, C. Y. (2013). Comparison of particulate formation and ash deposition under oxy-fuel and conventional pulverized coal combustions. Fuel, 106, 544–551. DOI 10.1016/j.fuel.2012.10.035. [Google Scholar] [CrossRef]
21. Chow, J. C., Watson, J. G. (2002). Review of PM2.5 and PM10 apportionment for fossil fuel combustion and other sources by the chemical mass balance receptor model. Energy Fuels, 16(2), 222–260. DOI 10.1021/ef0101715. [Google Scholar] [CrossRef]
22. Ninomiya, Y., Zhang, L., Sato, A., Dong, Z. (2004). Influence of coal particle size on particulate matter emission and its chemical species produced during coal combustion. Fuel Processing Technology, 85(8–10), 1065–1088. DOI 10.1016/j.fuproc.2003.10.012. [Google Scholar] [CrossRef]
23. Hartikainen, A., Yli-Pirilä, P., Tiitta, P., Leskinen, A., Kortelainen, M. et al. (2018). Volatile organic compounds from logwood combustion: Emissions and transformation under dark and photochemical aging conditions in a smog chamber. Environmental Science and Technology, 52, 4979–4988. DOI 10.1021/acs.est.7b06269. [Google Scholar] [CrossRef]
24. Valantinavicius, M., Vonžodas, T. (2012). Proximate and elemental analysis of solid biofuel and influence to combustion process. International Conference of Young Scientists on Energy and Natural Sciences Issues, Kaunas, Lithuania. [Google Scholar]
25. Ross, A. B., Jones, J. M., Chaiklangmuang, S., Pourkashanian, M., Williams, A. et al. (2002). Measurement and prediction of the emission of pollutants from the combustion of coal and biomass in a fixed bed furnace. Fuel, 81(5), 571–582. [Google Scholar]
 | This work is licensed under a Creative Commons Attribution 4.0 International License, which permits unrestricted use, distribution, and reproduction in any medium, provided the original work is properly cited. |