| Energy Engineering |
DOI: 10.32604/ee.2022.019584
ARTICLE
Sustainability Intelligent Evaluation of Regional Microgrid Interconnection System Based on Combination Entropy Weight Rank Order-TOPSIS and NILA-KELM
1Long Yuan (Beijing) Wind Power Engineering & Consulting Co., Ltd., Beijing, 100034, China
2School of Art, Hebei GEO University, Shijiazhuang, 050031, China
3Strategy and Management Base of Mineral Resources in Hebei Province, Hebei GEO University, Shijiazhuang, 050031, China
4School of Urban Geology and Engineering, Hebei GEO University, Shijiazhuang, 050031, China
5School of Management, Hebei GEO University, Shijiazhuang, 050031, China
*Corresponding Author: Yingying Fan. Email: yingyingfan@hgu.edu.cn
Received: 30 September 2021; Accepted: 27 December 2021
Abstract: Sustainability evaluation of regional microgrid interconnection system is conducive to a profound and comprehensive understanding of the impact of interconnection system projects. In order to realize the comprehensive and scientific intelligent evaluation of the system, this paper proposes an evaluation model based on combination entropy weight rank order-technique for order preference by similarity to an ideal solution (TOPSIS) and Niche Immune Lion Algorithm-Extreme Learning Machine with Kernel (NILA-KELM). Firstly, the sustainability evaluation indicator system of the regional microgrid interconnection system is constructed from four aspects of economic, environmental, social, and technical characteristics, and the evaluation indicators are explained. Then, the classical evaluation model based on TOPSIS is constructed, and the entropy weight method and rank order method (RO) are coupled to obtain the indicator weight. The niche immune algorithm is used to improve the lion algorithm, and the improved lion algorithm is used to optimize the parameters of KELM, and the intelligent evaluation model based on NILA-KELM is obtained to realize fast real-time calculation. Finally, the scientificity and accuracy of the model proposed in this paper are verified. The model proposed in this paper has the lowest RMSE, MAE and RE values, indicating that its intelligent evaluation results are the most accurate. This study is conducive to the horizontal comparison of the overall performance of regional microgrid interconnection system projects, helps investors to choose the most promising project scheme, and helps the government to find feasible project.
Keywords: Regional microgrid interconnection system; intelligent evaluation of sustainability; combination entropy weight rank order; TOPSIS; NILA; KELM
Different from the traditional centralized power supply mode, the microgrid power supply mode is more flexible, and its unique duality of electricity and power supply can play a very important role in the power system [1]. When the distribution density of microgrid in a certain area is high, the interconnection between microgrids forms a regional microgrid interconnection system. As one of the effective means to realize smart grid, regional åmicrogrid interconnection system has a positive role in cost-saving, environmental protection, social development and technological innovation [2]. With the increasing attention to sustainable development, more and more energy companies have begun to shift from the simple pursuit of economic growth in the past to the coordinated development of economy, environment, society, and technology [3]. Therefore, the sustainability evaluation of regional microgrid interconnection system is conducive to a profound and comprehensive understanding of the impact of various aspects of the interconnection system project. However, due to the particularity of its own structure, the regional microgrid interconnection system presents different characteristics from the traditional independent microgrid [4]. Therefore, how to evaluate the sustainability of regional microgrid interconnection system in all aspects to select the most investment potential of regional microgrid interconnection system project is also a focus of future research.
The definition of sustainability can be understood from four relevant dimensions: economy, environmental protection, technology, and society [5]. The concept has received increasing attention in the development of renewable energy projects [6]. However, compared with the independent microgrid structure, the regional microgrid interconnection system structure is more complex, and its characteristics are also different from those of a single microgrid [7]. At present, the research on the sustainability evaluation of regional microgrid interconnection systems is still quite limited, and most literature studies only focus on part of the sustainability benefits. Aghdam et al. [8] proposed a stochastic energy management method for a multi-microgrid system considering all net-work constraints, which was used to evaluate the influence of active power loss on each individual in energy management. The results show that incorporating active power loss into the objective function of energy management is helpful to reduce active power loss [8]. Zhang et al. [9] studied the online dynamic security assessment of the future distribution system under the framework of a multi-microgrid system. A new interface control strategy for ideal load sharing of the multi-microgrid systems is proposed, and the effectiveness of this strategy is verified by taking a multi-microgrid system as an example [9]. Wang et al. [10] proposed a series of new indicators and multistep performance evaluation methods to evaluate the performance of the multi-microgrid system from a quantitative perspective. The indicator system includes power generation permeability indicator, reliability indicator, and economic indicator. The practice has proved that the indicator system and multistep performance evaluation method are effective [10]. Most of the existing research literature focuses on measuring the reliability and economy of the independent microgrid system. In terms of reliability, some scholars have studied the reliability of microgrids from the aspects of equivalent power/load reliability indicator, off-grid operation reliability indicator, and microgrid benefit indicator [11]. In terms of economy, some literature studied the economy of microgrid systems from the aspects of overall operation benefit of microgrids, comprehensive evaluation indicator of social economy, and life cycle cost [12].
As a necessary link in the development and construction of regional microgrid interconnection system projects, sustainability evaluation is an important part of the whole project life cycle management process. Due to the development of regional microgrid interconnection systems in China is not yet mature, the research on the sustainability evaluation of regional microgrid interconnection systems is very limited. The performance of regional microgrid interconnection systems in environmental, social, economic, and technological aspects has become the core concern of local governments and potential investors [13]. Therefore, the establishment of an effective sustainability evaluation model for regional microgrid interconnection systems can help investors to choose the most promising project scheme and help the government to find practical project performance improvement measures to attract more social investment by obtaining the various aspects of the sustainability benefits of different regional microgrid interconnection systems projects to achieve horizontal comparison of overall project performance.
The construction of the evaluation model has an important influence on the accuracy of evaluation. Ideal point order preference by similarity to ideal solution (TOPSIS) is a multi-objective decision-making method, which has been widely used in different areas of comprehensive evaluation research [14]. The research results show that this method can obtain a more reasonable and effective evaluation result that is suitable for practice. This method calculates the distance between the evaluation object and the positive ideal solution and the negative ideal solution for the multi-objective decision-making problem and sorts them accordingly [15]. The TOPSIS method can reflect the differences among various schemes. Compared with other methods, this method is more intuitive, and its evaluation results will not be affected by the number of indicators. The TOPSIS method can input all the evaluation indicator data into the evaluation calculation model to maximize the role of indicator data, which can fully reflect the impact of each evaluation indicator data on the evaluation results. Therefore, its evaluation performance is better than other methods, and it can output evaluation results closer to the real state of the project [16]. The determination of indicator weight in the TOPSIS model is particularly important and worthy of further discussion. The entropy weight method reflects the amount of information according to the information entropy of the evaluation indicator, so as to determine the weight of each indicator in the evaluation system, but sometimes the random interference of the data itself will lead to the lack of real reliability of the calculated weight [17]. The Rank order (RO) method can rank the normalized mean values of each indicator from large to small, and the weight obtained by rank can objectively reflect the influence degree of evaluation indicator on evaluation objects [18]. In this paper, the entropy weight method and RO are combined, and the combination entropy weight RO method is proposed, and the weight obtained is more realistic.
The extreme learning machine theory was proposed by Huang et al. in 2006, based on which the basic extreme learning machine, online sequential extreme learning machine, extreme learning machine with the kernel (KELM), and other related algorithms have been derived [19]. KELM is a single-layer feedforward neural network algorithm. Compared with the basic extreme learning machine (ELM) algorithm, it has a stronger ability to solve the regression pre-diction problem [20]. Compared with back propagation neural network (BPNN) and support vector machines (SVM), it has a faster calculation speed and greatly improves the generalization ability of the network when obtaining better or similar prediction accuracy [21]. The KELM algorithm has been proved to have excellent prediction performance in many fields [22], but its performance is vulnerable to the influence of penalty coefficient C and kernel parameter σ. For the problem that these two parameters are difficult to select, it is necessary to solve the problem with intelligent algorithms. Compared with other intelligent algorithms [23], the lion algorithm proposed by Rajakumar of B. R. has strong robustness in solving performance and the ability to search for better solutions. It is easy to be implemented in parallel and has fast convergence speed. However, in the process of multiple iterations of the lion swarm algorithm, individuals with large fitness in the population will form “inbreeding”, resulting in premature convergence and reduced diversity [24]. Therefore, this paper decides to use the niche immune algorithm to improve the lion algorithm and apply the improved lion algorithm to optimize the parameters of KELM.
In summary, this paper constructs a regional microgrid interconnection system sustainability intelligent evaluation model based on combination entropy weight rank order-TOPSIS and NILA-KELM. The rest of the paper is arranged as follows. The second part designs the evaluation indicator system of regional microgrid interconnection system sustainability from four aspects of economic, environmental, social, and technical characteristics, and explains the evaluation indicators. The third part constructs the classical evaluation model based on the combination entropy weight rank order method and TOPSIS and constructs the intelligent evaluation model based on NILA optimized KELM. The fourth part selects practical cases to verify the accuracy and effectiveness of the model proposed in this paper. The fifth part summarizes the research results. The fifth part summarizes the research results.
2 Construction of the Evaluation Indicator System
2.1 Principle of Determining Evaluation Indicator
Establishing a scientific and reasonable evaluation indicator system is the premise of regional microgrid interconnection system sustainability evaluation. The established indicator system should include various factors that have a key impact on the sustainability of regional microgrid interconnection system. The evaluation indicator system should be established on the basis of the following selection principles [25]:
1. The comprehensive principle
The establishment of the evaluation indicator system aims to comprehensively measure the performance of various aspects involved in the regional microgrid inter-connection system project, so as to provide reference for potential investors to judge the advantages and disadvantages of the regional microgrid interconnection system project and the local government to formulate relevant policies. The Regional microgrid interconnection system project consists of multiple sub-microgrids, and each sub-microgrid contains a variety of distributed power, energy storage and other facilities. The operation management and related impacts of these system components will affect the benefit performance of regional microgrid interconnection system projects. The evaluation indicator system established in a specific environment should include economic impact, environmental impact and social impact. Therefore, to have a more profound and specific understanding of the research object, a more comprehensive evaluation indicator system should be established.
2. Hierarchical principle
The Hierarchical structure is one of the most widely used structures in both theory and practice among many benefit evaluation structures. Establishing an evaluation indicator system, hierarchical structure can systematically, accurately and comprehensively show the subordinate relationship and correlation between the sub-level evaluation indicator and each level.
3. Scientific principle
The selection of evaluation indicators should be based on the objective laws and related theories, supported by corresponding scientific theories, and studied from the perspectives of practical experience and theoretical knowledge. The selection of evaluation indicators should fully consider the objective environment, to scientifically express the essential characteristics of the research object.
4. Representative principle
The evaluation indicator system consists of a series of sub-level indicators at different levels. Using a large number of indicators to construct the evaluation indicator system may not necessarily improve the accuracy of system evaluation. Therefore, representative indicators closely related to the research object should be selected to describe the characteristics of various aspects, fully reflecting the purpose and significance of the selection of indicators. If excessive evaluation indicators are selected in the research process, it may reduce and weaken the influence of important indicators and reduce the reliability of evaluation results.
5. Independence principle
The evaluation system is a hierarchical expression set of multiple representative single indicators. In the selection of indicators, repeated or highly correlated indicators should be avoided. Each indicator should be independent, and each indicator can express all aspects of the research problem from different perspectives, so as to improve the scientificity and effectiveness of the evaluation results.
2.2 Determination of Evaluation Indicators
This section takes the selection criteria of indicators listed in Section 2.1 as the principle, and fully considers the objective environment of the project and the difficulty of data acquisition and other factors to construct the sustainability evaluation indicator system of regional microgrid interconnection system projects. Project sustainability can be defined from four related aspects: economy, environmental protection, technology and sociality. The constructed sustainability evaluation indicator system contains 15 sub-level evaluation indicators, as shown in Table 1. Cost-type indicators are those where the smaller the value the better the evaluation result. Benefit type indicators are those where the larger the value of the index the better the evaluation result. The specific meaning of the indicators is as follows:

2.3 Explanation of Evaluation Indicators
The economic indicators mainly investigate the economic performance of regional microgrid interconnection system, including four sub-level indicators, namely construction cost, operation and maintenance cost, investment payback period and unit power cost.
1. Investment cost
The investment cost of the project mainly refers to the cost of obtaining land and related equipment in the initial construction process of the regional microgrid interconnection system project. Mainly includes land costs, equipment (such as wind turbines, photovoltaic panels, diesel generators, energy storage systems and related ancillary facilities) acquisition costs and labor costs.
2. Operation and maintenance costs
The operation and maintenance cost mainly refers to the cost needed to maintain the normal operation of the system and ensure the continuous operation of the equipment in the daily management of the regional microgrid interconnection system. Mainly includes the salary of operation management personnel, the cost of parts or spare parts for regular maintenance.
3. Payback period
The payback period of investment refers to the number of years used when the accumulated economic benefits of regional microgrid interconnection system projects are equal to the initial investment costs. Investment payback period is one of the most concerned economic indicators for project investors. By calculating the investment payback period, the time for capital recovery can be clarified, thereby reducing investment risks.
4. The levelized cost of electricity
The normalized electricity cost is an evaluation indicator for the net present value of unit electricity cost in the whole life cycle of the regional microgrid interconnection system project. From the perspective of the project life cycle, this indicator evaluates the economic benefits of regional microgrid interconnection system project, which is one of the important reference indicators in the energy industry.
2.3.2 Environmental Indicators
The development of the regional microgrid interconnection system has a certain degree of complexity in its environmental impact. On the one hand, wind power and photovoltaic power generation in the regional microgrid interconnection system are clean power sources, which are of positive significance to environmental protection; On the other hand, when the system is in the peak load period, the use of diesel generators equipped in the system for energy supply will produce carbon dioxide and polluting gases, adversely affecting the environment.
1. CO2 emission reduction
Carbon dioxide emission reduction refers to the reduction of greenhouse gas emissions by the system through the use of renewable energy power plants in the life cycle of regional microgrid interconnection system, compared with the use of traditional power generation forms of thermal power plants. The reduction of carbon dioxide emissions is of positive significance to alleviate global warming. The reduction of carbon dioxide emissions is of positive significance to alleviate global warming.
2. PM2.5 emission reduction
PM2.5 emission reduction refers to the reduction of particulate matter less than 2.5 mm in diameter in the atmosphere through the use of renewable energy in the regional microgrid interconnection system compared with the use of traditional power generation in thermal power plants. This indicator is one of the key indicators to evaluate the quality of air quality.
3. Pollutant gas emission
The emission of polluting gases is mainly used to evaluate the emission of polluting gases generated by burning fossil fuels such as sulfur dioxide and nitrogen oxides during the life cycle of regional microgrid interconnection system when the load is in the peak period when the diesel generator in the system works. Pollutant gas emissions will have a bad impact on the environment, such as acid rain, which will damage the ecology and seriously affect the sustainability of the system.
4. Space occupancy
Space occupancy refers to the relevant equipment units in the regional microgrid interconnection system, such as wind turbines, photovoltaic panels, diesel generators, energy storage batteries, and the layout of corresponding transmission lines and control equipment will occupy a certain user area, which will have a certain impact on the residents and the surrounding environment and landscape.
The implementation of the regional microgrid interconnection system project can bring about positive social effects, such as increasing residents’ satisfaction, increasing employment opportunities, and reducing poverty rates.
1. Increase resident satisfaction
Residents’ satisfaction is the degree of satisfaction to local residents through the use of regional microgrid interconnection system for energy supply. The improvement of residents’ satisfaction is one of the necessary indicators for system implementation. The level of residents’ satisfaction has a direct impact on their enthusiasm to participate in regional microgrid interconnection system and project implementation.
2. Increase employment opportunities
Increased employment opportunities refer to direct and indirect employment opportunities arising from the implementation and management of regional microgrid interconnection system projects. Direct employment refers to the staff created by the project itself, such as those engaged in manufacturing, installation or operation and maintenance of the system. Indirect employment refers to the increase in job opportunities for relevant personnel who provide investment and knowledge for regional microgrid interconnection systems, such as banks providing funds for project construction and suppliers providing necessary materials.
3. Reduce poverty rate
The construction and implementation of regional microgrid interconnection system can not only create local employment opportunities, but also play a positive role in promoting local economic development. These impacts have a positive impact on poverty reduction, particularly in remote areas. Current society is paying more and more attention to human development. On 03 November 2013, the concept of “targeted poverty alleviation” first proposed poverty reduction as a policy. Therefore, taking poverty reduction as a project evaluation indicator has responded well to the Government's policy call.
As an emerging technology, the construction of a new regional microgrid interconnection system project can actively explore the actual practice of the project, promote the accumulation of experience and theory at the technical level, and provide effective reference for the gradual maturity of relevant technologies, which is conducive to the further development of intelligent power grid layout.
1. Technological innovation
The construction, operation and management technology of regional microgrid interconnection system is not fully mature. The development of new regional microgrid interconnection system will play a positive role in promoting the accumulation of relevant experience and is conducive to the formation of relevant technological innovation.
2. Electricity consumption reliability
The intermittent of renewable energy in regional microgrid interconnection system poses a serious challenge to the reliability of users’ electricity consumption and the frequent access of renewable energy will also threaten the stability of power system. The energy storage system in the regional microgrid interconnection system and the power mutual assistance mechanism in the system can effectively buffer the intermittent characteristics of renewable energy, improve the reliability of power supply, reduce the dependence of regional microgrid interconnection system on large power grid, and effectively improve the safety and stability of power system.
3. Renewable energy utilization ratio
Due to the randomness of renewable energy power output, a single microgrid has certain limitations on the consumption ability of renewable energy. Through the regional microgrid interconnection system, the excess renewable energy power that cannot be consumed in the sublevel microgrid can be traded to the sublevel microgrid with energy shortage in the form of mutual assistance within the system, so as to reduce the operation cost of the supply and demand sides, improve the utilization rate of renewable energy, and reduce the interference on the distribution network side.
4. System expansibility
Regional microgrid interconnection system is a joint optimal dispatching system composed of several separate sub-microgrids. With the continuous development of power system intelligence, there may be new sub-level microgrids merging into the regional microgrid interconnection system in the future, or realizing system-level interconnection between regional microgrid interconnection systems. In addition, in special cases, such as system failures, in order to ensure the stability of the overall operation of the interconnected microgrid system, the system structure needs to have the possibility of flexible integration and removal of the sub-level microgrid.
3 Construction of Evaluation Model
3.2 Weight Calculation Model Based on Combination Entropy Weight Rank Order Method
The specific steps of RO method are as follows [26]:
1. Data normalization processing
There are various types of indicators, including maximal indicators, minimal indicators and interval indicators. Maximal indicators reflect the development trend of evaluation indicators. The larger the indicator, the higher the level of sustainable development; On the contrary, minimal indicators indicate that the larger the indicator, the lower the level of sustainable development. To facilitate the calculation and analysis, the values of each index must be consistent, so as to facilitate the comparison and selection of each scheme, and then get the evaluation results of each scheme. After analyzing the index system constructed in this paper, it is found that all evaluation indexes are maximal indicators.
Since the attribute and quantity level of the original data are quite different, it is necessary to normalize each index. Set the evaluation sample set as
where
2. The average value of each evaluation index sample
3. Calculate the weight of each index
Calculate the information entropy and weight of each indicator separately [27], namely:
where, when
3.2.3 Combined Weight Calculation
Combined weights
After the weight value of the evaluation index is obtained by the combination weight calculation method mentioned above, the sustainability of the regional microgrid interconnection system project can be evaluated and analyzed by the ideal point sorting method. The specific steps are as follows [28]:
1. Weighted processing of evaluation data
According to the original evaluation data, the weighted normalization matrix needed for the operation of the evaluation model can be obtained by the following formula:
where, m refers to the evaluation index level, n refers to the number of evaluation indexes.
2. Obtaining positive ideal solution and negative ideal solution by operation
The positive ideal solution refers to the hypothetical value of the optimal value in the ideal situation, while the negative ideal solution refers to the virtual solution of the worst value. The specific calculation formula is:
In the above formula,
After the above steps, the Euclidean distance can be calculated according to the following formula:
3. Calculating relative approach degree
Relative approach degree is calculated according to the following formula:
In the calculation process discussed above, the distance between each index and positive and negative ideal solutions in the evaluation index system can be calculated, and the corresponding Euclidean distance represents the degree of closeness of the sustainability and ideal level of the regional microgrid interconnection system project. Therefore, the sustainability of regional microgrid interconnection system projects can be described by the operational distance and then sorted by the calculated distance. The smaller the distance is, the closer the sustainability of the regional microgrid interconnection system project is to the ideal degree. At the same time, it indicates that the regional microgrid interconnection system project has better sustainability and the rank ordering will be at the top.
LA is a bionic algorithm based on the social behavior of lions, which was proposed by Rajakumar of B. R. in 2012 [29]. The LA realizes the iteration and generation of the optimal solution through the breeding and evolution of territorial lions or the defense competition of territorial lions against mobile lions. Each lion represents a solution. The solution is continuously optimized through the change of the lion population, and the optimal solution is finally generated. The LA simulates the social behavior of the lion group. The main steps include the generation of the initial population, mating variation, territorial defense, and territorial takeover. The algorithm optimizes the objective function through continuous iteration and search, and finally obtains the optimal solution. The objective function is set as:
1. Generate population
In the initial stage of the algorithm, the lion group is initialized as
2. Mating
In the process of iteration and searching for the optimal solution, mating is a very effective method. It can generate new solutions through existing solutions. Mating operations achieve the purpose of updating the lion group and maintaining the stability of the lion group by crossing, mutation, clustering, killing sick, weak cubs and other steps.
The mating step introduces the crossover method based on double probabilities (crossover with two different probabilities).
By mating, the generated
Mutation operation is to use probability for random mutation to produce pups. After the crossover and mutation were completed, the number of cub species was 8. Clustering uses the K-means method to group the existing 8 solutions into gender groups: male cubs (
Finally, by testing the health status (or target), kill a larger group of thin individuals to ensure the balance of the two groups of cubs, and finally achieve the purpose of renewing the population. And after the population update is completed, the age of the cubs is initialized to 0.
3. Territorial defense
In the breeding process of lion groups, they will be attacked by nomadic lions. At this point, in order to protect the cubs and continue to occupy the territory, the lion will defend the attack of the nomadic lions, as shown in Fig. 1.

Figure 1: Lion defense illustration
In the process of territorial defense, first use the method of generating territorial lions to generate nomadic lions
Let
where,
4. Territorial takeover
In the territorial takeover stage, the best solution between the female lion and the male lion is searched for, replacing the inferior solution, and mating until the termination conditions are reached. The replacement process is as follows:
First follow the following criteria:
Choose the best male lion (
Let
After completing the above steps, return to Step 2 until the termination condition. The best lion in the repeating population of the whole process is selected as the optimal solution.
3.3.2 Niche Immune Lion Algorithm (NILA)
Lion swarm algorithm is a parallel search method that does not depend on specific problems. It has the characteristics of self-adaptability, group search and heuristic random search. However, in the process of multiple iterations, the individuals with large fitness in the population will form ‘inbreeding’, resulting in premature and reduced diversity. To solve this problem, the niche immune algorithm is introduced to limit the excessive replication of similar individuals, so as to ensure the diversity of population. The detailed steps of niche immune algorithm are shown in reference [30]. The following is the improvement process of lion swarm algorithm based on niche immune thought.
1. In the iteration, each certain algebra dl is centered on the position of each lion, and M lion is cloned according to the size of its objective function value. The cloning formula is as follows:
In the formula,
2. After cloning, do single parent mutation for M lion, for the lion with lower objective function value, use monosexual reproduction lion to mutation operation, the mathematical formula is as follows:
In the formula,
3. After cloning and mutating the lion, M mutating lion and this lion are selected, and the lion with high objective function value is selected as the new lion.
3.4 Extreme Learning Machine with Kernel
First, briefly explain the neural network construction mechanism of the basic ELM algorithm, and its neural network function is as follows [31]:
where:
ELM ensures the accuracy of regression prediction by minimizing the output error, as shown below:
where: L is the number of hidden layer neurons;
At the same time, ELM algorithm ensures the generalization ability of neural network by minimizing the output weight β. usually β takes its least square solution; the calculation method is as follows:
In the formula: H is the hidden layer matrix of neural network;
For KELM algorithm, the kernel function is introduced to obtain better regression prediction accuracy. Mercer's condition is used to define the kernel matrix, as follows:
The kernel matrix
The parameter 1/C is added to the main diagonal in the unit diagonal matrix HHT so that the characteristic root is not zero, and then the weight vector β* is obtained. This makes ELM more stable and its generalization is better. At this time, the output weight of the ELM network becomes:
where, I is the diagonal matrix; C is the penalty coefficient, used to weigh the ratio between structural risk and empirical risk. HHT is generated by mapping input samples through a kernel function.
From the above formula, the output of the KELM model is:
In the kernel-based KELM algorithm, the specific form of the feature mapping function h(x) of the hidden layer node is not specifically given, but the value of the output function can be obtained by knowing the specific form of the kernel function. At the same time, because the kernel function directly adopts the form of inner product, there is no need to set the number of hidden layer nodes when solving the output function value, so there is no need to set the initial weight and bias of the hidden layer.
3.5 Evaluation Process Based on Combined Entropy Weight Rank Order-TOPSIS and NILA-KELM
Based on the establishment of the evaluation index system, this section proposes a new hybrid evaluation method based on combined entropy weight rank order-TOPSIS and NILA-KELM, which uses combined entropy weight rank order-TOPSIS to obtain classic evaluation results. Then use the NILA algorithm to optimize KELM, so as to obtain the optimal value of the KELM model parameters, and finally get the evaluation result and analyze the result. The proposed hybrid evaluation framework is shown in Fig. 2.

Figure 2: Evaluation process
The specific steps are as follows:
Step 1: Carry out initial input variable selection and data preprocessing. Based on the established evaluation index system, an initial set of input variables is formed, and the original data of each input factor is quantified and standardized.
Step 2: Classical evaluation calculation. The combined entropy weight rank order is used to obtain the evaluation index weight, and then it is substituted into the TOPSIS evaluation model to obtain the classic evaluation result.
Step 3: Use NILA algorithm optimization to obtain the optimal value of the KELM model parameters. The key parameters of the KELM model will have a significant impact on its final evaluation effect, and it is related to the accuracy of the sustainability evaluation of the regional microgrid interconnection system project. If the stop condition is not reached, the algorithm needs to be rerun to obtain the corresponding optimized solution set.
Step 4: Output intelligent evaluation results and compare and analyze the results. Based on the above-obtained intelligent evaluation model for the sustainability of the regional microgrid interconnection system project, the simulation calculation is carried out, and the obtained intelligent evaluation results are compared with the classical evaluation model calculation results.
4.1 Classical Evaluation Calculation and Analysis
Through field research and data collection, the relevant data of 30 regional microgrid interconnection system projects were collected and sorted out. At the same time, 25 experts were invited to score the indicators based on the interval scores, and then the scores were summarized and averaged.
According to the evaluation index preprocessing method in formula (1), the raw data of sustainability evaluation index of 30 regional microgrid interconnection system projects were standardized. The processing results of some data are shown in Table 2.
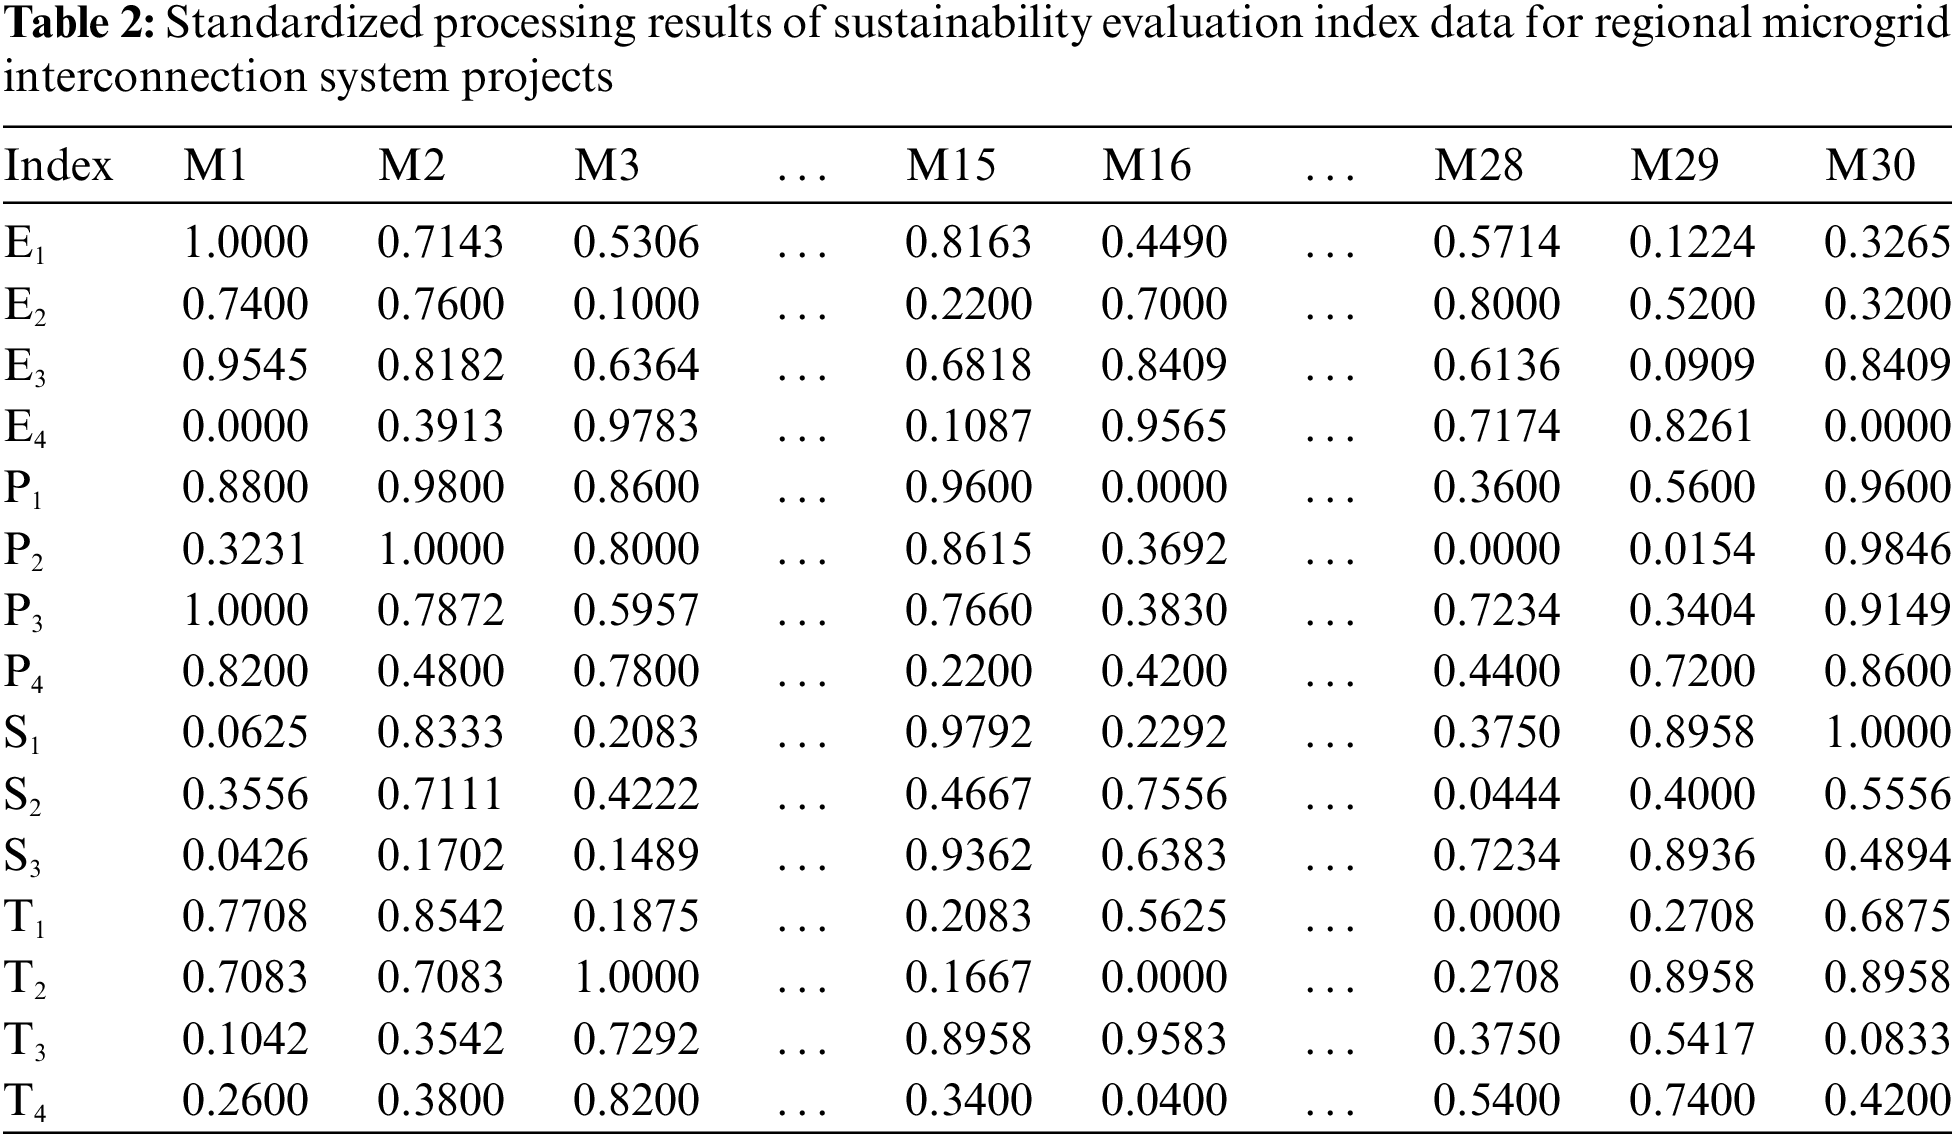
Table 2 Standardized processing results of sustainability evaluation index data for regional microgrid interconnection system projects.
According to the weight determination method described in 3.1, the sustainability evaluation index weights of regional microgrid interconnection system projects can be obtained as shown in Table 3. The weight ratio of each evaluation index is shown in Fig. 3.


Figure 3: Distribution of the weights of sustainability evaluation indicators. (a) RO weight (b) Entropy weight (c) Combination weight
As can be seen from the data in Fig. 3, among all sustainability evaluation indicators, environmental protection indicators CO2 emission reduction and PM2.5 emission reduction account for a larger proportion of weight. The performance of these two indicators has a significant impact on the results of sustainability evaluation. Because in recent years, under the call of relevant government policies, China's economy has gradually changed from the rough development in the past to the green and sustainable de-development mode, so as to achieve a more harmonious coexistence of human and natural environment, and the environmental protection benefit is an important reference standard for measuring the sustainable benefit of projects. At the same time, with the development of the social economy and the continuous improvement of residents’ living standards, people's demands for a better living environment have also made environmental protection an important indicator of social development. In addition, the impact of social indicators in the sustainability evaluation of the project is also worthy of attention, such as employment creation and poverty reduction indicators, which play a key role in the willingness of local residents to accept the implementation of the project.
Then, the initial data are weighted to obtain the weighted normalization matrix, and the calculation results are shown in Table 4.

The positive and negative ideal solutions are calculated as shown in Table 5.

The Euclidean distances from the microgrid interconnection system projects in each region to the positive and negative ideal solutions are calculated as shown in Table 6.

The relative proximity of regional microgrid interconnection system projects can be calculated, and the relative proximity is sorted by size. The greater the relative proximity is, the better the sustainability of regional microgrid interconnection system projects is. Finally, 30 regional microgrid interconnection system project sustainability comprehensive evaluation rank ordering results are shown in Table 7.

From the above, based on the combination entropy weight rank order-TOPSIS method, the sustainability of 30 regional microgrid interconnected system projects is comprehensively evaluated. The sustainability of M9 is the best, and the sustainability of M5 is the worst.
4.2 Intelligent Evaluation Calculation and Analysis
In order to verify the effectiveness and feasibility of NILA-KELM model, it is compared with KELM model, ELM model and BPNN model. BPNN, a concept introduced in 1986 by scientists led by Rumelhart and McClelland, is a multilayer feed-forward neural network trained according to an error back propagation algorithm and is one of the most widely used neural network models. Therefore, this model has been chosen for comparison in this paper. The specific test results are shown in Table 8. Fig. 4 shows the comparison between the test results of different models and the actual values. Fig. 5 is the relative error diagram of each intelligent model.
Relative error (RE) refers to the absolute error caused by the measurement and the ratio of the measured (agreed) true value multiplied by 100% of the resulting value, expressed as a percentage. In general, RE better reflects the degree of confidence in the measurement. Root mean squard error (RMSE) can eliminate the effect of the magnitude and describe the data better compared to mean squard error (MSE). Mean absolute error (MAE) is the average of the absolute values of the deviations of all individual observations from the arithmetic mean. The mean absolute error avoids the problem of errors canceling each other out and thus accurately reflects the magnitude of the actual prediction error. In summary, these three indicators are chosen in this paper.


Figure 4: Test results of different models

Figure 5: The relative error of each smart model
As shown in Table 2, the RMSE value of the NILA-KELM model is 1.22%, which is smaller than the 2.27%, 3.06% and 3.29% of KELM, ELM and BPNN. In addition, the MAE value of the NILA-KELM model is 1.02%, which is also smaller than the 2.01%, 2.73% and 3.09% of KELM, ELM and BPNN. The smaller the two values, the higher the accuracy and stability of the NILA-KELM model for predicting the output value.
It can be seen from Fig. 4 that the gap between the NILA-KELM model and the actual value is far less than that of KELM, ELM and BPNN, and the correlation between the test value curve and the actual value curve is higher, indicating that the sustainability assessment of regional microgrid interconnection system projects is more accurate and closer to reality. The gap between the test value and the actual value of KELM model is slightly smaller than that of ELM model and BPNN model, indicating that the accuracy of KELM model in the project sustainability assessment of regional microgrid interconnection system is slightly higher than that of ELM model and BPNN model. The relative error results shown in Fig. 5 also verify the above conclusions. As shown in Fig. 5, the relative error of NILA-KELM model is closer to the horizontal axis, and the relative error fluctuation is the smallest, indicating that the overall error is less than the other two models. The relative error of KELM model is slightly lower than that of ELM and BPNN models, and the overall fluctuation of the curve is smaller than that of ELM and BPNN models, indicating that the prediction accuracy of KELM model is slightly higher than that of ELM and BPNN models, but the difference is small.
Scientific and reasonable measurement of various benefits of regional microgrid interconnection system in terms of sustainability is conducive to the stable realization of multi-stakeholder mutual benefit and win-win situation, including power system and microgrid. Therefore, this paper designs a set of a sustainability evaluation system for regional microgrid interconnection system, which mainly includes an evaluation index system and a new hybrid intelligent evaluation method. The main research results and conclusions include the following four points:
1. The sustainability evaluation index system of regional microgrid interconnection system is constructed from four aspects of economic, environmental, social and technical characteristics, which solves the problems that the sustainability of regional microgrid interconnection system is mainly reflected in.
2. The weight of evaluation index is obtained based on the combination entropy weight rank order method, and the TOPSIS evaluation model is designed, and the evaluation results are obtained from the perspective of classical evaluation methods.
3. The niche immune algorithm is used to improve the lion algorithm, and a new niche immune lion swarm algorithm is formed. NILA is used to optimize KELM, and an intelligent evaluation model is constructed.
4. The scientificity and accuracy of the evaluation model proposed in this paper are verified by example analysis. The classical evaluation model can obtain accurate reference results, while the modern intelligent evaluation model can achieve the purpose of fast calculation and support for relevant decisions.
In summary, the research results of this paper can provide some reference for local governments and potential investors to make investment decisions in regional microgrid interconnection system projects. However, the paper does not screen the input indicators, which is a shortcoming of the paper and a direction for future research.
Funding Statement: This work is supported by Natural Science Foundation of Hebei Province, China (Project No. G2020403008), Humanities and Social Science Research Project of Hebei Education Department, China (Project No. SD2021044) and the Fundamental Research Funds for the Universities in Hebei Province, China (Project No. QN202210).
Conflicts of Interest: The authors declare that they have no conflicts of interest to report regarding the present study.
1. Qiu, H., Long, H., Gu, W., Pan, G. (2021). Recourse-cost constrained robust optimization for microgrid dispatch with correlated uncertainties. IEEE Transactions on Industrial Electronics, 68(3), 2266–2278. DOI 10.1109/TIE.2020.2970678. [Google Scholar] [CrossRef]
2. Singh, A., Suhag, S. (2020). Frequency regulation in an AC microgrid interconnected with thermal system employing multiverse-optimised fractional order-PID controller. International Journal of Solar Energy, 39(3), 250–262. DOI 10.1080/14786451.2019.1684286. [Google Scholar] [CrossRef]
3. Eba, A., Mnsa, B., Kba, B. (2020). Nuclear energy for sustainable development: SWOT analysis on Ghana's nuclear agenda. Energy Reports, 6, 107–115. DOI 10.1016/j.egyr.2019.11.163. [Google Scholar] [CrossRef]
4. Latif, A., Das, D. C., Barik, A. K., Ranjan, S. (2019). Maiden coordinated load frequency control strategy for ST-AWEC-GEC-BDDG-based independent three-area interconnected microgrid system with the combined effect of diverse energy storage and DC link using BOA-optimised PFOID controller. IET Renewable Power Generation, 13(14), 2634–2646. DOI 10.1049/iet-rpg.2019.0199. [Google Scholar] [CrossRef]
5. Su, F., Liu, H., Zhu, D., Li, L., Wang, T. (2020). Sustainability assessment of the liaohe estuary wetland based on emergy analysis. Ecological Indicators, 119, 106837. DOI 10.1016/j.ecolind.2020.106837. [Google Scholar] [CrossRef]
6. Pontoiyo, F., Sulaiman, M., Novitasari, D., Budiarto, R. (2019). Sustainability potential for renewable energy system in isolated area that supports nantu boliyohuto wildlife reserve. IOP Conference Series Earth and Environmental Science, 520(1). DOI 10.1088/1755-1315/520/1/012026. [Google Scholar] [CrossRef]
7. Bazmohammadi, N., Tahsiri, A., Anvari-Moghaddam, A., Guerrero, J. M. (2019). A hierarchical energy management strategy for interconnected microgrids considering uncertainty. International Journal of Power and Energy Systems, 109, 597–608. DOI 10.1016/j.ijepes.2019.02.033. [Google Scholar] [CrossRef]
8. Aghdam, F. H., Ghaemi, S., Kalantari, N. T. (2018). Evaluation of loss minimization on the energy management of multi-microgrid based smart distribution network in the presence of emission constraints and clean productions. Journal of Cleaner Production, 196, 185–201. DOI 10.1016/j.jclepro.2018.06.023. [Google Scholar] [CrossRef]
9. Zhang, Y., Xie, L. (2015). Online dynamic security assessment of microgrid interconnections in smart distribution systems. IEEE Transactions on Power Systems, 30(6), 1–9. DOI 10.1109/TPWRS.2014.2374876. [Google Scholar] [CrossRef]
10. Wang, S., Zhang, X., Wu, L., Sun, S. (2018). New metrics for assessing the performance of multi-microgrid systems in stand-alone mode. International Journal of Electrical Power & Energy Systems, 98, 382–388. DOI 10.1016/j.ijepes.2017.12.002. [Google Scholar] [CrossRef]
11. Adefarati, T., Bansal, R. C. (2019). Reliability, economic and environmental analysis of a microgrid system in the presence of renewable energy resources. Applied Energy, 236, 1089–1114. DOI 10.1016/j.apenergy.2018.12.050. [Google Scholar] [CrossRef]
12. Barreiro-Gomez, J., Cadena, A. I., Shahidehpour, M., Quijano, N., Motta, M. (2020). Intra-hour microgrid economic dispatch based on model predictive control. IEEE Transactions on Smart Grid, 11(3), 1968–1979. DOI 10.1109/TSG.2019.2945692. [Google Scholar] [CrossRef]
13. Zhao, X. G., Zhang, Z. Q., Xie, Y. M., Meng, J. (2020). Economic-environmental dispatch of microgrid based on improved quantum particle swarm optimization. Energy, 195, 117014.1–117014.15. DOI 10.1016/j.energy.2020.117014. [Google Scholar] [CrossRef]
14. Bahrami, S., Rastegar, M., Dehghanian, P. (2021). An FBWM-TOPSIS approach to identify critical feeders for reliability center+ed maintenance in power distribution systems. IEEE Systems Journal, 15(3), 3893–3901. DOI 10.1109/JSYST.2020.3014649. [Google Scholar] [CrossRef]
15. Balcerzak, A. P. (2020). Quality of institutions in the european union countries. Application of TOPSIS based on entropy measure for objective weighting. Acta Polytechnica Hungarica, 17(1), 101–122. DOI 10.12700/APH.17.1.2020.1.6. [Google Scholar] [CrossRef]
16. Li, Y., Wu, L., Han, Q., Wang, X., Fan, C. (2021). Estimation of remote sensing based ecological index along the grand canal based on PCA-AHP-TOPSIS methodology. Ecological Indicators, 122(2), 107214. DOI 10.1016/j.ecolind.2020.107214. [Google Scholar] [CrossRef]
17. Wang, B., Teng, Y., Wang, H., Zuo, R., Yang, J. (2020). Entropy weight method coupled with an improved drastic model to evaluate the special vulnerability of groundwater in songnen plain, Northeastern China. Hydrology Research, 51(5), 1184–1200. DOI 10.2166/nh.2020.056. [Google Scholar] [CrossRef]
18. Ribeiro, A. M. N. C., Sadok, D. F. H., Brito, M. E. D. C., Cavalcanti, A. D. A., Kelner, J. (2020). Comparative analysis of current transducers for development of smart plug through rank order centroid method. IEEE Latin America Transactions, 18(1), 147–155. DOI 10.1109/TLA.9907. [Google Scholar] [CrossRef]
19. Shamsah, S. M. I., Owolabi, T. O. (2020). Modeling the maximum magnetic entropy change of doped manganite using a grid search-based extreme learning machine and hybrid gravitational search-based support vector regression. Crystals, 10(4), 310. DOI 10.3390/cryst10040310. [Google Scholar] [CrossRef]
20. Chen, S., Gu, C., Lin, C., Wang, Y., Hariri-Ardebili, M. A. (2020). Prediction, monitoring, and interpretation of dam leakage flow via adaptative kernel extreme learning machine. Measurement, 166, 108161. DOI 10.1016/j.measurement.2020.108161. [Google Scholar] [CrossRef]
21. Yang, H., Liu, Y., Xiong, Z., Liang, L. (2019). Rapid determination of holocellulose and lignin in wood by near infrared spectroscopy and kernel extreme learning machine. Analytical Letters, 53(7), 1–15. DOI 10.1080/00032719.2019.1700267. [Google Scholar] [CrossRef]
22. Liang, Y., Niu, D., Hong, W. C. (2019). Short term load forecasting based on feature extraction and improved general regression neural network model. Energy, 166, 653–663. DOI 10.1016/j.energy.2018.10.119. [Google Scholar] [CrossRef]
23. Wang, H., Liang, Y., Ding, W., Niu, D., Li, S. et al. (2020). The improved least square support vector machine based on wolf pack algorithm and data inconsistency rate for cost prediction of substation projects. Mathematical Problems in Engineering, 2020(6), 1–14. DOI 10.1155/2020/6663006. [Google Scholar] [CrossRef]
24. Sb, S., Shenoy, N., Nayak, P. (2019). Lion algorithm-optimized long short-term memory network for groundwater level forecasting in Udupi District. arXiv:1912.05934. India. [Google Scholar]
25. Bernett, A., Kral, K., Dogan, T. (2021). Sustainability evaluation for early design (SEED) framework for energy use, embodied carbon, cost, and daylighting assessment. Journal of Building Performance Simulation, 14(2), 95–115. DOI 10.1080/19401493.2020.1865459. [Google Scholar] [CrossRef]
26. Choi, S. H., Ahn, B. S. (2011). Rank order-based recommendation approach for multiple featured products. Expert Systems with Applications, 38(6), 7081–7087. DOI 10.1016/j.eswa.2010.12.062. [Google Scholar] [CrossRef]
27. Cao, Y., Fan, X., Guo, Y., Li, S., Huang, H. (2020). Multi-objective optimization of injection-molded plastic parts using entropy weight, random forest, and genetic algorithm methods. Journal of Polymer Engineering, 40(4), 360–371. DOI 10.1515/polyeng-2019-0326. [Google Scholar] [CrossRef]
28. Kim, T. H., Kim, B., Han, K. Y. (2019). Application of fuzzy TOPSIS to flood hazard mapping for levee failure. Water, 11(3), 592. DOI 10.3390/w11030592. [Google Scholar] [CrossRef]
29. Roy, K., Mandal, K. K., Mandal, A. C. (2019). Ant-lion optimizer algorithm and recurrent neural network for energy management of micro grid connected system. Energy, 167, 402–416. DOI 10.1016/j.energy.2018.10.153. [Google Scholar] [CrossRef]
30. Ma, H., Zhou, X. (2019). A GPS location data clustering approach based on a niche genetic algorithm and hybrid K-means. Intelligent Data Analysis, 23, 175–198. DOI 10.3233/IDA-192791. [Google Scholar] [CrossRef]
31. Mak, A., Sk, B., Ydz, C., Ta, D., Ms, E. et al. (2021). Prediction of COVID-19-pneumonia based on selected deep features and one class kernel extreme learning machine. Computers & Electrical Engineering, 90(3), 106960. DOI 10.1016/j.compeleceng.2020.106960. [Google Scholar] [CrossRef]
 | This work is licensed under a Creative Commons Attribution 4.0 International License, which permits unrestricted use, distribution, and reproduction in any medium, provided the original work is properly cited. |