| Energy Engineering |
DOI: 10.32604/ee.2022.020430
ARTICLE
A New Approach for Structural Optimization with Application to Wind Turbine Tower
School of Mechanical and Electrical Engineering, Lanzhou University of Technology, Lanzhou, 730050, China
*Corresponding Author: Yuqiao Zheng. Email: zhengyuqiaolut@163.com
Received: 23 November 2021; Accepted: 15 February 2022
Abstract: This work takes the bionic bamboo tower (BBT) of 2 MW wind turbine as the target, and the non-dominated sorting genetic algorithm (NSGA-II) is utilized to optimize its structural parameters. Specifically, the objective functions are deformation and mass. Based on the correlation analysis, the target optimization parameters were determined. Furthermore, the Kriging model of the BBT was established through the Latin Hypercube Sampling Design (LHSD). Finally, the BBT structure is optimized with multiple objectives under the constraints of strength, natural frequency, and size. The comparison shows that the optimized BBT has an advantage in the Design Load Case (DLC). This advantage is reflected in the fact that the overall stability of the BBT has increased by 2.45%, while the displacement of the BBT has decreased by 0.77%. In addition, the mass of the tower is decreased by 1.49%. Correspondingly, the steel consumption of each BBT will be reduced by 2789 Kg. This work provides a scientific basis for the structural design of the tower in service.
Keywords: Wind turbine tower; bionic bamboo tower; correlation analysis; multi-objective optimization
Tower is the principal supporting component of the wind turbine, which structural strength will directly affect the power generation efficiency of the wind turbine. As the tower tends to towering development, and the manufacturing cost of the tower keeps increasing, higher requirements are put forward for the structural design of the tower in service [1,2].
The strength and manufacturing cost of the tower is mainly determined by its structural parameters [3]. Traditionally, in the design of tower structures, designers mainly adopt the test-error correction method. The design results depend on experience, and it is difficult to achieve the desired effect of optimal design [4]. Modern optimization methods are widely used in the structural design of towers [5–7]. Applying the improved gradient method to the optimal design of structural parameters of towers, more reasonable tower masses can be obtained [8,9]. The Taboo search algorithm is used to explore the variation pattern between the structural parameters and the mass of the tower. By optimizing the structural parameters of the tower, manufacturing costs can be reduced [10].
Similarly, combining different optimization algorithms with finite element analysis (FEA) can lead to reasonable optimization solutions [11]. Subsequently, a global optimization method applicable to complex situations is proposed by combining FEM numerical analysis and genetic algorithm while considering parameters such as height and diameter of the tower [12]. FEA can also be performed for towers of different materials and geometries to optimize the design based on a multi-level decision scheme [13]. The support vector machine method combined with FEA is used for the lightweight design of the tower, which effectively improves the economy of the tower [14]. In addition, the bionic design with palm and bamboo as biological prototypes can also effectively improve the performance of the tower [15,16]. However, it should be noted that existing studies have mainly focused on single-objective optimization. The multi-objective optimization of the tower combined with extreme conditions needs to be further explored.
This work presents an effective approach to minimize the mass of the BBT and improve its safety simultaneously. The task obtains a set of reasonable structural parameters through NSGA-II. Correspondingly, it is verified by using the FEA that the optimum proposals are possible and effective. Ultimately, this work achieved the multi-objective optimization of the BBT, which provided a reference for the tower's structural design.
In the previous work, our team proposed the BBT structure [17]. It was applied to the 2 MW tower by mechanical structure bionic method. Further, this work optimizes the structure of the BBT to enhance its performance.
The BBT's main body is composed of 6 sections of the tower tube connected by flanges. Fig. 1 depicts the geometrical structure parameters of the BBT. Its bottom outer diameter is 4200 mm, and bottom inner diameter is 4116 mm, top inner diameter is 2977 mm, and top outer diameter is 3005 mm. It has a hub height of 80000 mm.
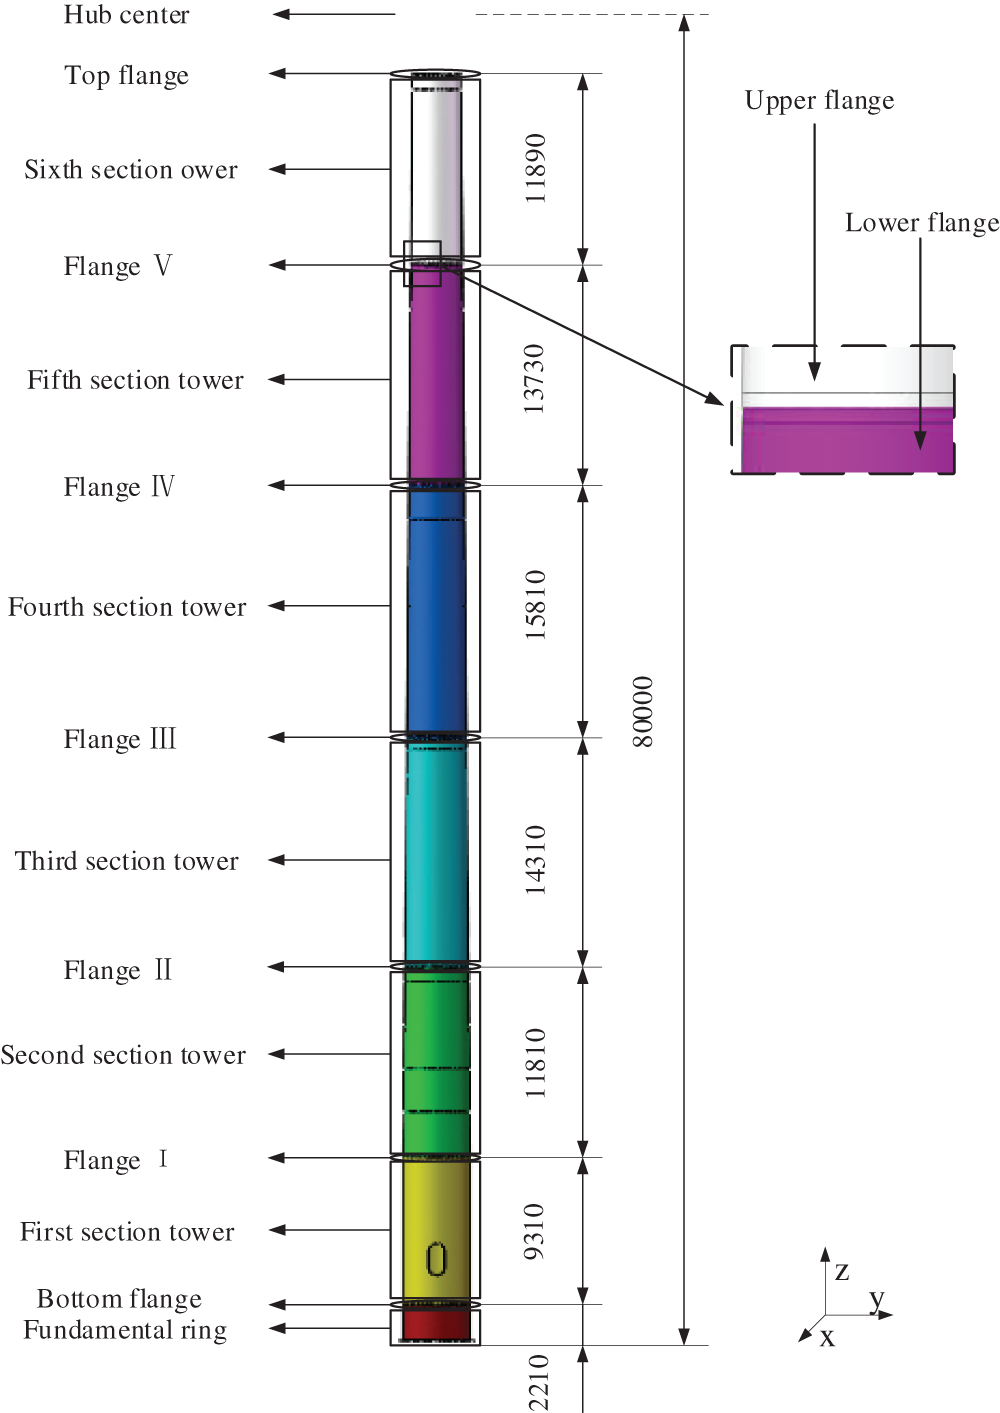
Figure 1: The BBT configuration
It is made from hot-rolled steel which is welded together circumferentially and longitudinally. Flanges connect the beginning and the end of each section. The BBT, in this case, is made of Q345FT, with a modulus of elasticity E = 2.06 × 10¹¹ MPa, a yield strength σ = 345 MPa, and density ρ = 7850 kg/m3.
To investigate the effect of structural parameters on the deflection of BBT, its finite element model was established. Specifically, the mesh size was determined to be 400 mm by mesh convergence verification, and 70041 cells and 142,243 nodes were obtained. Hence, more computing resources are devoted to solving analytical problems. In addition, the Multi-point constraints are used at flange connection surfaces. Finally, a concentrated mass point is adopted instead of the caabin and wind wheel.
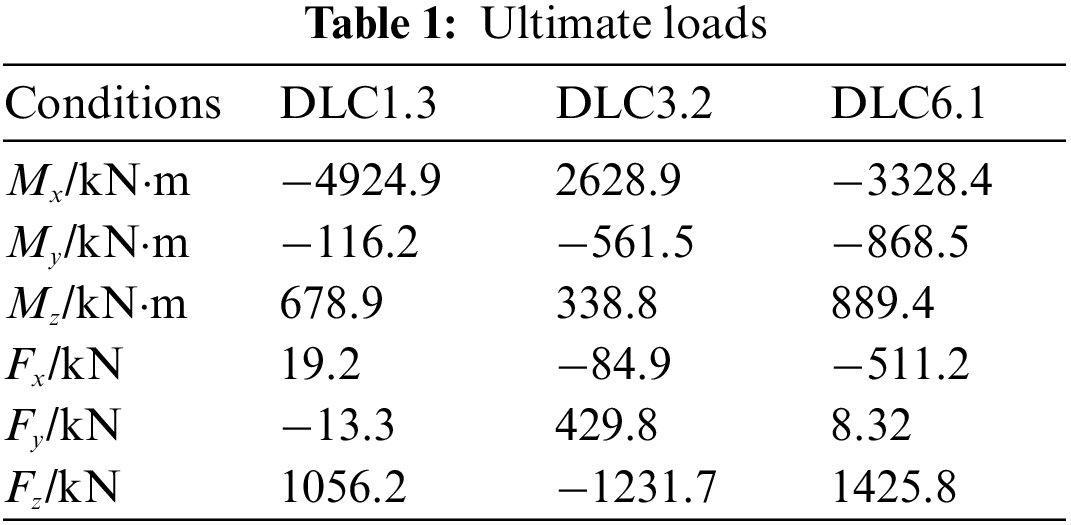
In general, the possibility of structural damage to the tower is higher under extreme operating conditions [14]. According to the environment of the wind farm, it is known that strong winds often occur when the tower works. Therefore, in this work, the static properties of the BBT were investigated for three different extreme conditions (DLC1.3, DLC3.2, DLC6.1) [18]. The loads for these three conditions are obtained from GH-Bladed, which are shown in Table 1.
Obtaining the response of the BBT is a prerequisite for optimal design under the initial structural parameters. Furthermore, the structural parameters directly affect stress, displacement, inherent frequency, and fatigue life. Therefore, the present work applies FEA to investigate the stresses and displacements of the tower in extreme conditions. Ignoring the effects of their frequencies and fatigue.
Specifically, a Q345FT is assigned to the material properties of the BBT structure. The coordinate system of the top of the BBT is established [19]. To avoid an even more refined mesh, the relative mesh of 400 mm is chosen for the upcoming tests. Therefore, more computational resources on solving the analysis. In addition, the total assembly model consists of hexahedral and tetrahedral meshes, and 70317 cells and 144707 nodes are obtained after mesh convergence verification. The bonded is used at the flange connection, and the flange connection surface is in the form of Multi-point constraints (MPC). Finally, the cabin and wind wheel are simplified to centralized mass points coupled to the top of the BBT by the rigid body, and three wind condition download load is adopted to the BBT, as well as taking into account the impact of the overall gravity of the tower. According to the above steps, the stress and displacement are listed in Table 2.
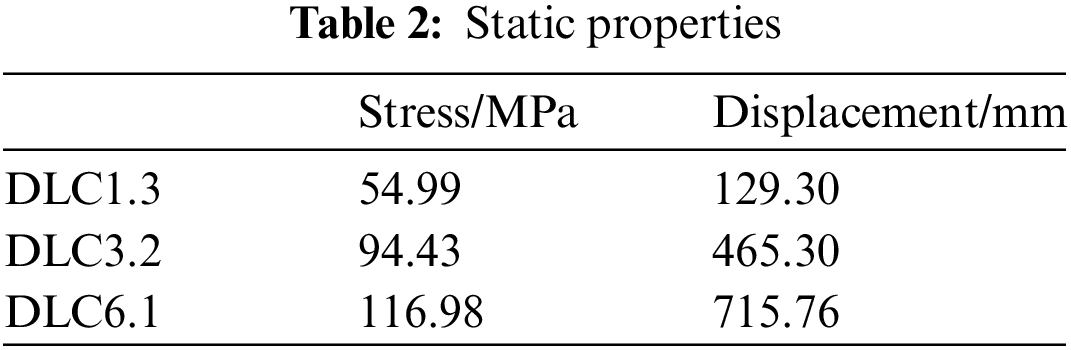
In Table 2, it can be noticed that the static response of the BBT is maximum under the DLC6.1. To achieve a better optimization effect, DLC6.1 is taken as the target condition. According to the material safety factor, the maximum permissible stress of the BBT can be obtained as 313.6 MPa [20]. On the other hand, from Table 2, it can be seen that the BBT still has a large margin in stress response. Consequently, it is not considered as the optimization target. In addition, the displacement reaches 715.76 mm, which may affect the wind turbine's safety, so that it will be taken as the optimization target.
In practical optimization, if all the structural parameters of the BBT are used as design variables, the number of sample points will be enormous. Thus, correlation analysis was used to screen the parameters that retained a significant degree of influence on the mass and displacement. The sample size can be reduced, and the solution accuracy can be improved by eliminating the parameters with less impact.
In the work, the input is the BBT's structural parameter and the output is the response of the stress and mass of the BBT. Specifically, the correlation coefficient is denoted as r.
In Eq. (1),
The structural parameters include the diameter d, thickness t, and height h of each segment. For optimization, the total height of the BBT is mainly determined by the working environment and the installed capacity of the wind turbine, so the value is considered as a constant. Considering that the top of the tower coupled with the cabin and the bottom fits with the fundamental ring. Therefore, the first section's bottom diameter and the sixth section's top diameter are regarded as constants. In addition, the first section is a thin-walled structure with uniform thickness, which means that the bottom diameter is the same as the top diameter, so the top diameter of the first section is set as a constant.
The correlation coefficient reflects the degree of correlation between the parameter and the response. Based on the correlation analysis, 4 parameters were filtered out, the most relevant in each response, and the values were listed in Table 3.
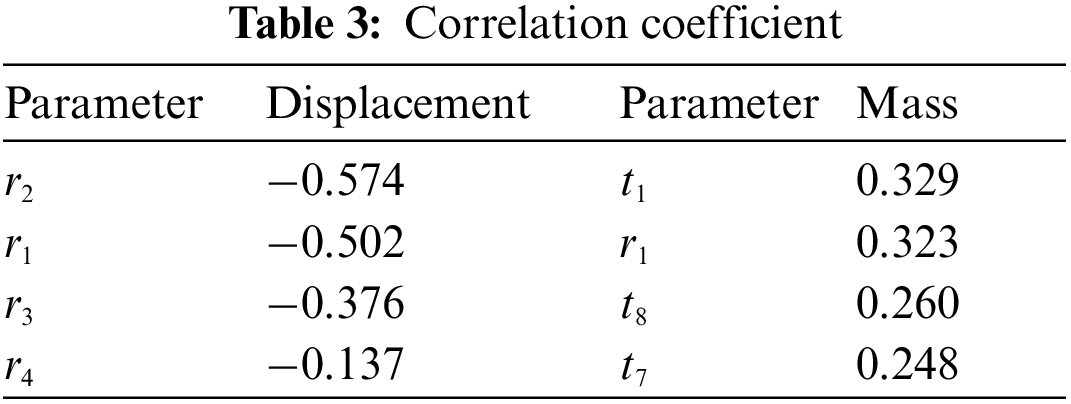
According to Tables 3 and 4 parameters with the most significant absolute values were screened as design variables to reduce the sample point size. Namely, the top diameter of the third section r2, the top diameter of the second section r1, the top diameter of the fourth section r3, and the bottom thickness of the first section t1 were used as the optimized design variables.
5 Multi-Objective Optimization
The optimization variables were determined based on correlation analysis. Furthermore, the Kriging model, LHSD, and NSGA-II were combined to achieve multi-objective optimization of the BBT structure.
Kriging model consists of two parts: regression model and correlation model, which has high fitting accuracy, and its mathematical model is shown in Eq. (2).
In which F(s) is the known regression model, β is the corresponding regression coefficient, and
where R is the correlation coefficient matrix.
Here n is the number of elements of the design variable,
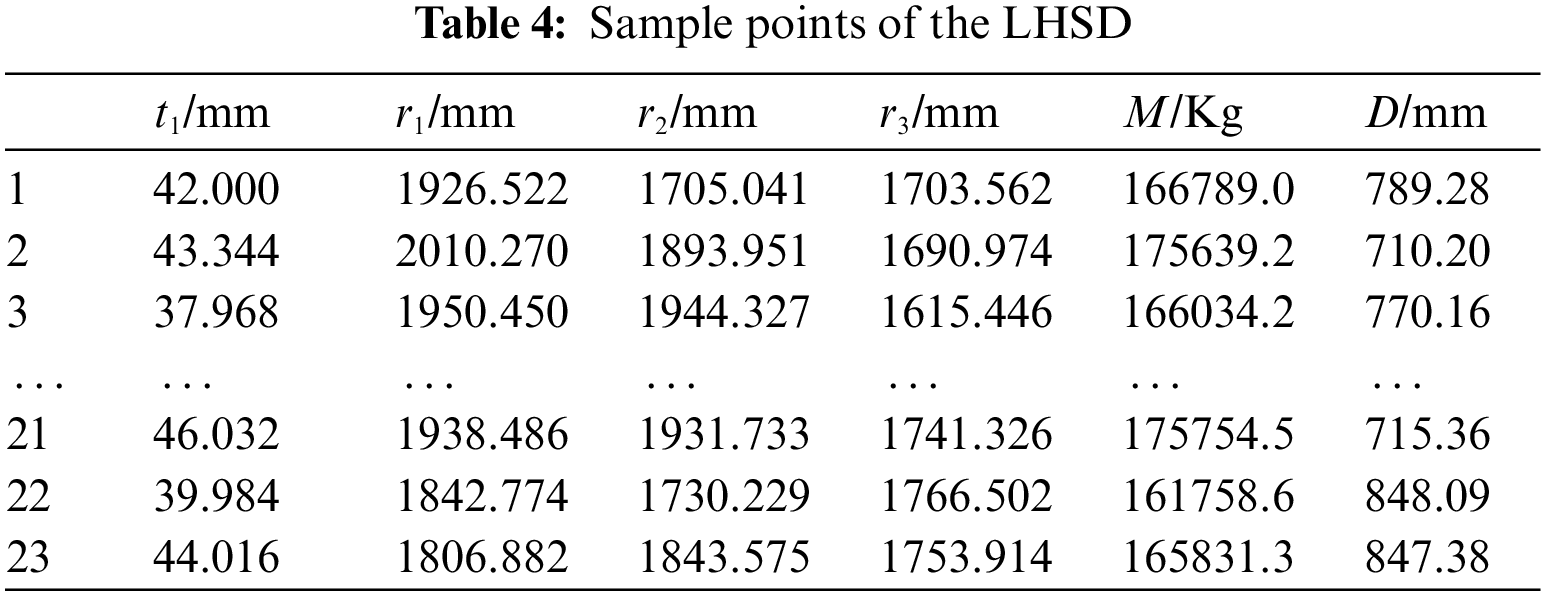
Based on the correlation analysis, t1, r1, r2, and r3 were determined as the optimization variables. The Latin Hypercube Test was conducted with the mass (M) and displacement (D) of the BBT as the target, and 23 sets of samples were generated as shown in Table 4.
The Kriging model is constructed based on Table 4, and its accuracy is evaluated by the complex correlation coefficient R2. To obtain a satisfactory Kriging model, the value of R2 should be close to 1. By solving, the R2 values of mass and displacement were obtained as 0.98 and 0.95, respectively, which are close to 1. This indicates that the accuracy of the model meets the requirements. However, there is a deviation in R2 [21]. To evaluate the model's accuracy more accurately, 12 sample points were randomly selected as verification points by Cross-validation to verify the fitting accuracy of the model, and the results are shown in Figs. 2 and 3.
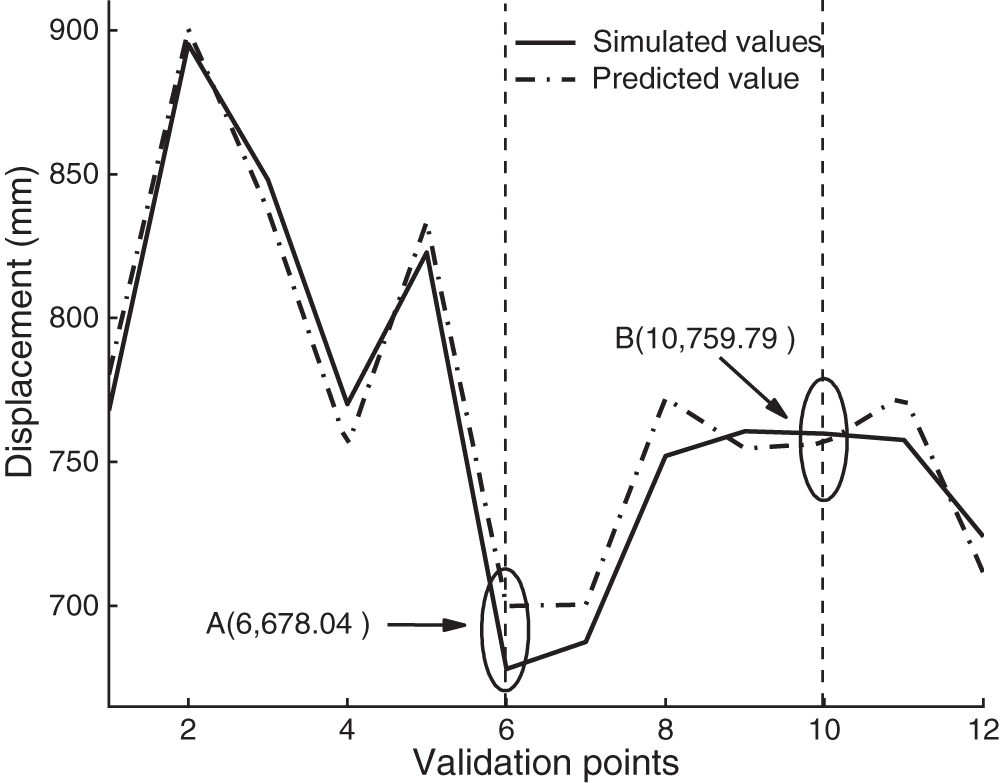
Figure 2: Comparison of predicted and simulated values of displacement
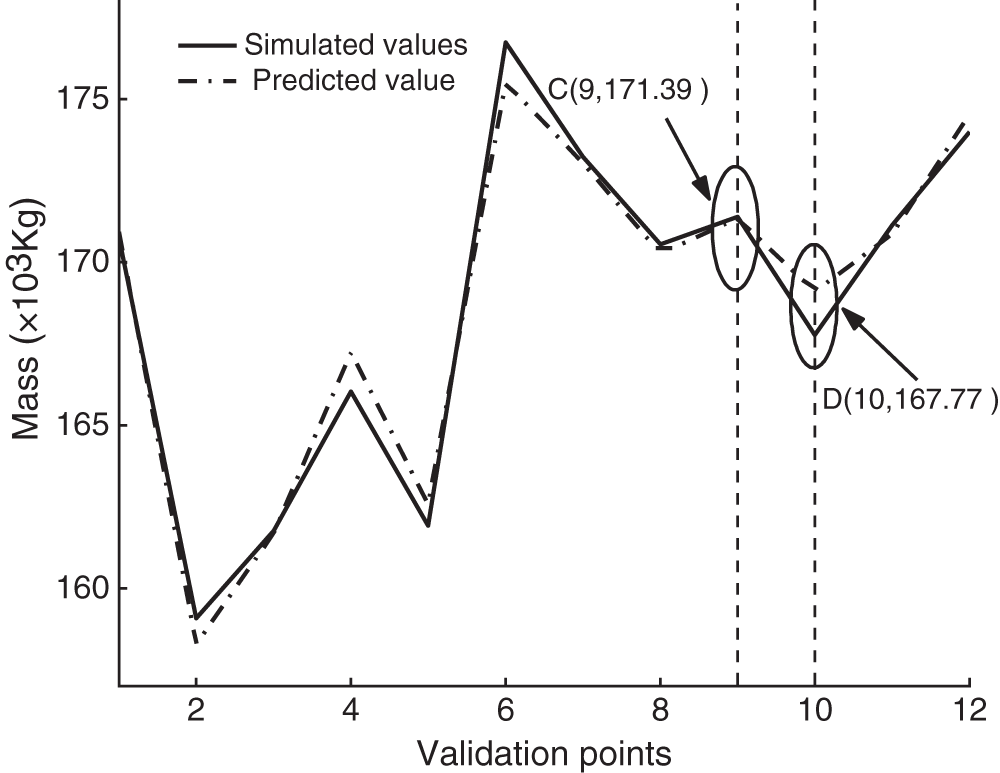
Figure 3: Comparison of predicted and simulated values of mass
It is shown that there is a high similarity between the predicted and the simulated values in the Kriging model (Figs. 2 and 3). For both graphs, A and C are simulated values. At this time, the difference between the simulated values and the predicted value reaches the maximum, which is 3.23% and 0.79%, respectively. Similarly, B and D are simulated values, and the difference between the simulated value and the predicted value is the smallest at 0.46% and 0.02%. Combined with Figs. 2 and 3, it can be illustrated that the accuracy of the Kriging model is credible and can replace the BBT model for structural optimization.
5.2 Mathematical Modeling and Solving
The optimized design variables were determined based on correlation analysis.
The target is to minimize the total mass and displacement of the BBT.
Design constraints include the following 3 aspects:
1)Strength constraint
To ensure the BBT safety, the maximum stress σ max under external loads should be less than the material yield
In Eq. (7), σ is von Mises stress, [σ] is allowable stress. In addition,
2) Frequency constraint
The resonance between the wind rotor and the BBT when 1P (rotor rotation frequency, ω1P) or 3P (blade passing frequency, ω3P) is close to the natural frequency of the BBT, which lead to safety accidents. For this reason, the natural frequency of the BBT is specified to avoid 1P and 3P turbine excitation frequency ranges [22]. In this work, the design speed range of the wind wheel involved is 8.33∼15.95 r/min, so the range of First-order natural frequency f of the BBT can be written as
3) Size constraint
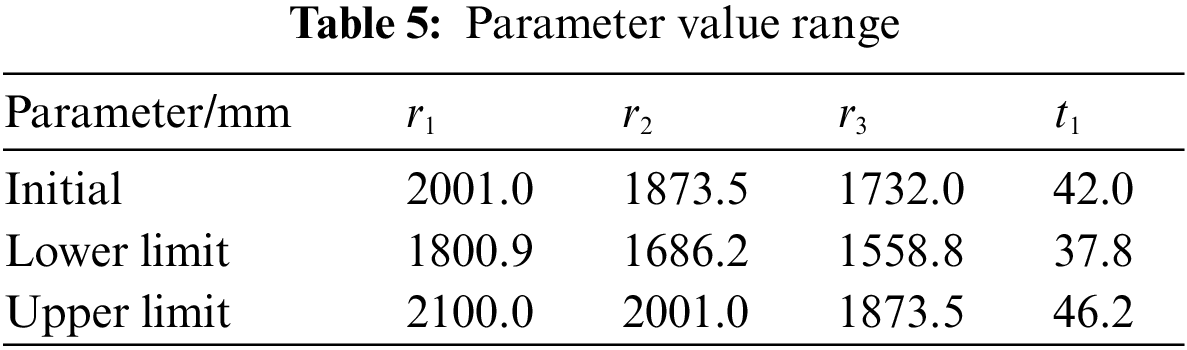
According to the actual working condition requirements, the BBT structure parameters should be taken within a certain range, and its parameter variation range is shown in Table 5.
NSGA-II was used to solve the Kriging model. Specifically, the initial population is 100, the genetic algebra is 600, the crossover probability is 0.9, and the mutation probability is 0.1. Further, the flowchart outlining the procedure for optimization is shown in Fig. 4.
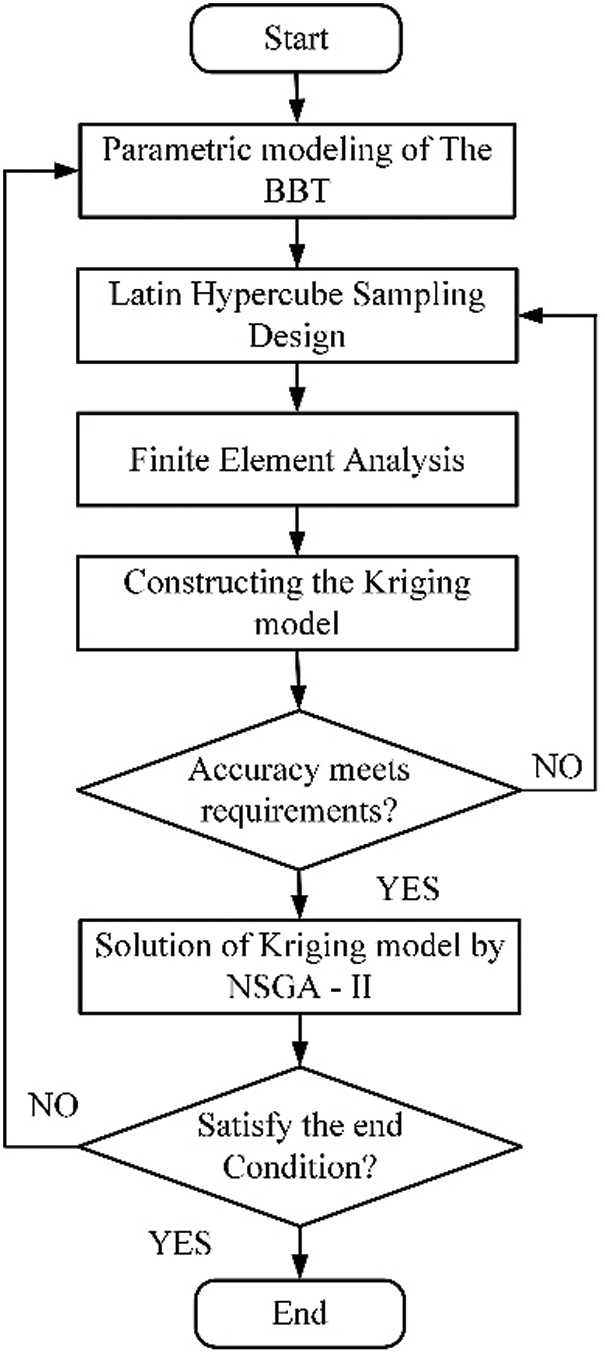
Figure 4: Flowchart outlining the procedure for optimization
After optimization, a reasonable set of structural parameters was obtained and is listed in Table 6.
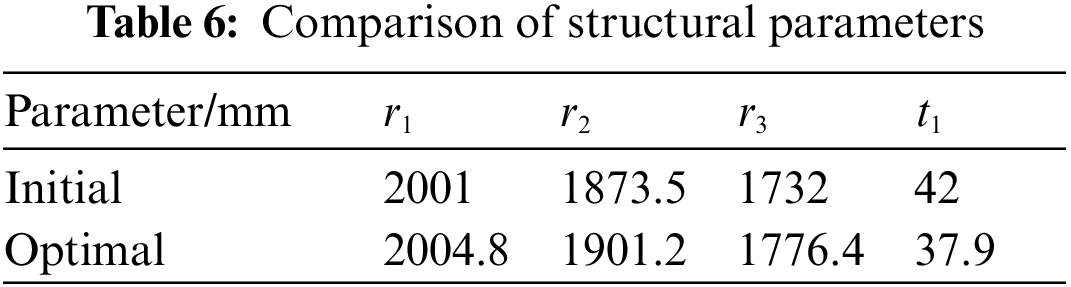
Table 6 illustrates that the diameter r1, r2, and r3 of the BBT after optimization slightly increased compared with the initial value, while the thickness of the first section of the tower t1 decreased. To further explore the influence of the optimized structural parameters on the overall quality and the quality of each section of the BBT. Combined with Table 6 and actual requirements, the optimized model is established, of which the brief mass information for each section is shown in Table 7.
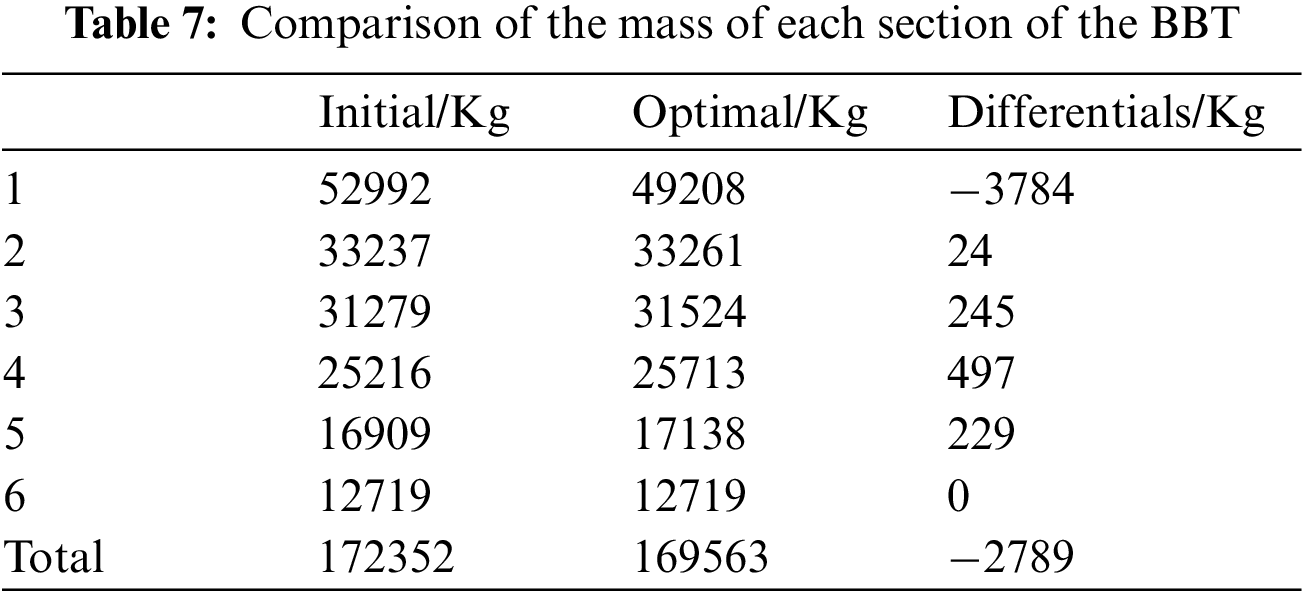
Table 7 clearly shows that the optimized BBT mass was reduced by 1.49% (2789 Kg) compared with the initial total mass, and the reduced mass is concentrated in the first section of the tower. In addition, based on the mass distribution of the sections of the BBT before and after optimization, a scheme can be provided for the actual structural optimization of the tower.
What needs to be pointed out is that static strength refers to the power of the BBT structure to resist deformation and stress response under the external load, and it is the primary factor that reflects the structural performance of the BBT. To identify the advantages of the optimization tower, the FEA was applied to explore the static performance of BBT under DLC6.1 and compare it with the initial static performance, the results of which are shown in Table 8.
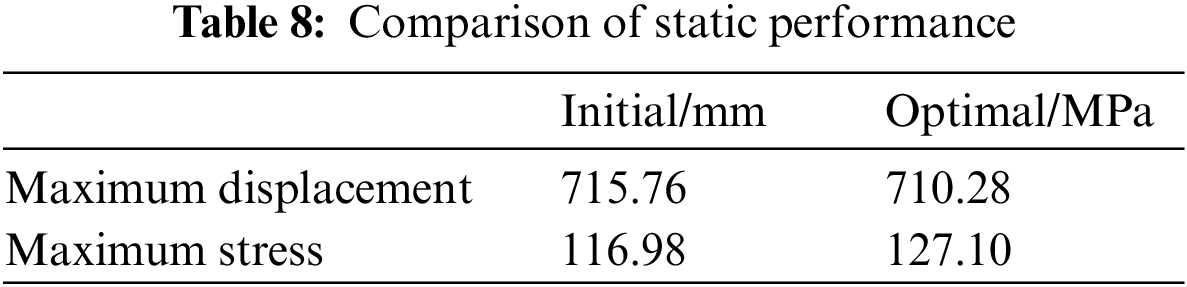
Indeed, the maximum displacement of BBT decreases by 0.77%, and the maximum stress increases by 8.65% after optimization (Table 8). It is illustrated that reducing the displacement is incompatible with reducing stress when the objective is to reduce mass. On the other hand, the stress of the BBT is 127.10 MPa after optimization, and the value is still far from the allowable stress (313.6 MPa) of the material. This indicates that the optimized BBT not only reduces the displacement but also improves the utilization efficiency of materials.
In practice, due to the influence of the tower's initial structural defects (geometric defects and structural defects), the structural instability is usually caused by the failure of the extreme point of the load. For this reason, nonlinear buckling analysis is used to explore the stability of the BBT and consider the structural nonlinearity and the effects of initial imperfections to obtain a realistic buckling load [23].
When the FEA is used for nonlinear buckling analysis, the gravity of the cabin, wind wheel, and tower is not considered, and axial load along the opposite direction of the z-axis is applied on the top of the BBT, and the bottom is fully constrained. First, set the mesh size to 400 mm, the bonded is used at the flange connection, and the flange connection surface is in the form of MPC. Secondly, turn on the large deflection and weak springs in the ANSYS environment to perform static analysis to solve the element stress stiffness matrix of the BBT. Next, add a nonlinear buckling analysis module, and expand the results after the study is completed to obtain the First-order buckling mode and buckling factor of the BBT. Finally, the First-order modes and buckling factors of the two towers are shown in Fig. 5.
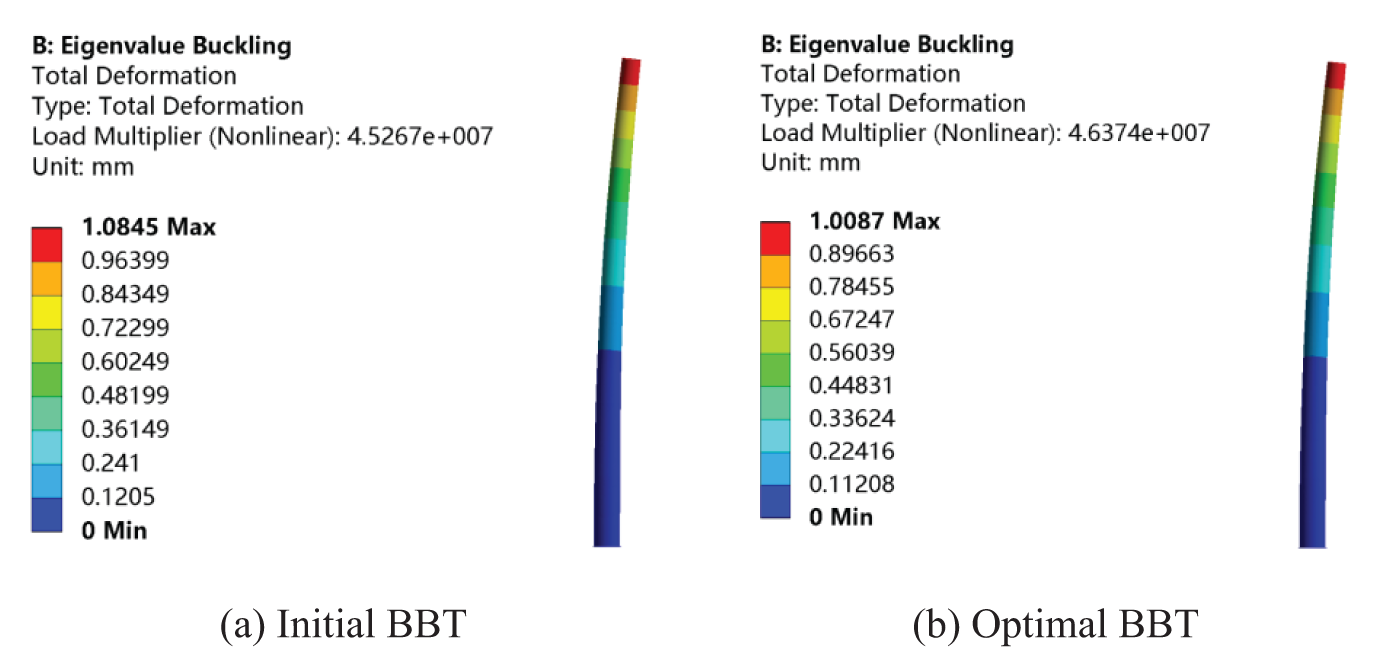
Figure 5: First-order mode and buckling factor
For Fig. 5, the comparison shows that the First-order buckling factor of the optimized BBT increases by 2.45%, indicating that the optimized BBT has an advantage in stability. On the other hand, based on the increased stability, the adaptability of the BBT to the environment has been improved, which means a broader for installation.
The 2 MW wind turbine BBT was taken as a structure optimization case. LHSD explored the influence between design variables and objective functions. Subsequently, a Kriging model of BBT mass and deformation was established as the basis of the multi-objective optimization of the tower. The NSGA-II was employed to find the optimal solution for mass and deformation. Based on the FEA, the static and dynamic performance advantages of the optimized BBT are considered comprehensively, and the following conclusions are drawn:
(1) After optimization, the mass of the BBT decreased by 1.49% compared with the initial, and the corresponding steel consumption was reduced by 2789 Kg. Specifically, the reduced mass is concentrated in the first section of the tower, which provides a reference scheme for the tower's structural design in service.
(2) Under DLC 6.1, the displacement of the optimized BBT decreases by 0.77%. On the other hand, the maximum stress reaches 127.10 MPa, which means that the maximum stress is increased by 8.65%, but there is still a large margin compared to the allowable material stress of 313.6 MPa. This indicates that the optimization of the BBT improves not only the static strength but also the efficiency of the material utilization.
(3) The BBT stability after optimization is improved by 2.45%, which means that compared with the original BBT, the optimized BBT is more adaptable to the environment. Hence, there are more options for the siting range of the wind farm.
Funding Statement: This work was supported by the National Natural Science Foundation of China (No. 51965034).
Conflicts of Interest: The authors declare that they have no conflicts of interest to report regarding the present study.
1. Liu, Z., Wang, J. W., Bai, F. Z., Wen, C. F., Du, Y. C. (2021). Analysis of near-wake deflection characteristics of horizontal axis wind turbine tower under Yaw state. Energy Engineering, 118(6), 1627–1640. DOI 10.32604/EE.2021.016357. [Google Scholar] [CrossRef]
2. Herath, M. T., Lee, A., Prusty, B. G. (2015). Design of shape-adaptive wind turbine blades using differential stiffness bend–Twist coupling. Ocean Engineering, 95(1), 157–165. DOI 10.1016/j.oceaneng.2014.12.010. [Google Scholar] [CrossRef]
3. Cai, X., Gao, Q., Guo, X. W., Li, Y., Zhu, J. et al. (2016). Multi-objective optimization and fuzzy evaluation of horizontal axis wind turbine tower. Acta Energiae Solaris Sinica, 37(11), 2821–2826. DOI 0254-0096(2016)11-2821-06. [Google Scholar]
4. Liu, X. F., Yu, L. P. (2017). Minimum cost design of the concrete wind turbine tower. Acta Energiae Solaris Sinica, 38(3), 691–698. DOI 0254-0096(2017)03-0691-08. [Google Scholar]
5. Zheng, Y. Q., Zhang, L., Pan, Y. X., He, Z. (2020). Multi-objective structural optimization of a wind turbine tower. Journal of Shanghai Jiaotong University (Science), 25(4), 538–544. DOI 10.1007/s12204-020-2190-3. [Google Scholar] [CrossRef]
6. Xu, B., Li, Z. Y., Chen, H. B. (2016). Geometry optimization on prestressed concrete and steel segments of wind turbine towers. Journal of Hunan University (Natural Science), 43(7), 25–31. DOI 10.3969/j.issn.1674-2974.2016.07.004. [Google Scholar] [CrossRef]
7. Chen, J. L., Yang, R. C., Ma, R. L. (2015). Structural design optimization of a composite tower for large wind turbine systems. Journal of Hunan University (Natural Science), 42(5), 29–35. DOI 10.3969/j.issn.1674-2974.2015.05.005. [Google Scholar] [CrossRef]
8. Perelmuter, A., Yurchenko, V. (2013). Parametric optimization of steel shell towers of high-power wind turbines. Procedia Engineering, 57(1), 895–905. DOI 10.1016/j.proeng.2013.04.114. [Google Scholar] [CrossRef]
9. Kamel, A., Dammak, K., Yangui, M., Hami, A. E., Jdidia, M. B. et al. (2021). A reliability optimization of a coupled soil structure interaction applied to an offshore wind turbine. Applied Ocean Research, 113, 1–14. DOI 10.1016/j.apor.2021.102641. [Google Scholar] [CrossRef]
10. Gencturk, B., Attar, A., Tort, C. (2015). Selection of an optimal lattice wind turbine tower for a seismic region based on the cost of energy. KSCE Journal of Civil Engineering, 19(7), 2179–2190. DOI 10.1007/s12205-014-1428-8. [Google Scholar] [CrossRef]
11. Schafhirt, S., Zwick, D., Muskulus, M. (2016). Two-stage local optimization of lattice type support structures for offshore wind turbines. Ocean Engineering, 117(1), 163–173. DOI 10.1016/j.oceaneng.2016.03.035. [Google Scholar] [CrossRef]
12. Bukala, J., Damaziak, K., Karimi, H. R., Malachowski, J., Robbersmyr, K. G. (2019). Evolutionary computing methodology for small wind turbine supporting structures. The International Journal of Advanced Manufacturing Technology, 100(9), 2741–2752. DOI 10.1007/s00170-018-2860-6. [Google Scholar] [CrossRef]
13. Daniel, S., Daniel, M., Felipe, M. P., Kemper, L., John, F. H. (2016). A design framework for optimizing the mechanical performance, cost, and environmental impact of a wind turbine tower. Journal of Solar Energy Engineering, 138(4), 1–9. DOI 10.1115/1.4033500. [Google Scholar] [CrossRef]
14. Dai, J. C., Liu, X., Yang, S. Y., Wen, Z. J., Shen, X. B. (2013). Research on wind turbine tower structure parameter optimization in extreme service environment. China Mechanical Engineering, 24(16), 2150–2156. DOI 10.3969/j.issn.1004-132X.2013.16.005. [Google Scholar] [CrossRef]
15. Liu, W. Y., Zhang, Y., Chen, L. (2011). Dynamic analysis and bionic design of multi-body system of large-scale horizontal-axis wind turbine. Journal of South China University of Technology (Natural Science Edition), 39(4), 44–49. DOI 10.3969/j.issn.1000-565X.2011.04.008. [Google Scholar] [CrossRef]
16. Zhao, R. Z., Wang, Q. W., Liu, H., Dou, P. G. (2016). Structural bionics design and mechanical properties analysis for wind turbine tower. Machinery Design & Manufacture, 5(5), 53–55+60. DOI 10.3969/j.issn.1001-3997.2016.05.014. [Google Scholar] [CrossRef]
17. Zheng, Y. Q., Dong, F. G., Guo, H. Q., Lu, B. X., He, Z. W. (2021). Bionic design of the tower for wind turbine. Proceedings of the Institution of Mechanical Engineers, Part C: Journal of Mechanical Engineering Science, 203(7), 1–9. DOI 10.1177/09544062211004650. [Google Scholar] [CrossRef]
18. Design requirements (2019). Wind energy generation systems. International Electrotechnical Commision, Switzerland. [Google Scholar]
19. Wind Energy Committee (2003). Guideline for certification of wind turbines. Germanischer Lloyd Wind Energie GmbH in Cooperation with the Wind Energy Committee, Germany. [Google Scholar]
20. Zheng, Y. Q., He, Z., Zhang, L., Pan, Y. X. (2020). Optimization of wind turbine tower structure parameters based on uniform design. Acta Energiae Solaris Sinica, 41(4), 221–226. DOI 0254-0096(2020)04-0215-06. [Google Scholar]
21. Zheng, J. Z., Chen, Y. S., Lu, B. B., Yin, H. Q. (2019). A study on safety performance optimization of seat subsystem bases on Kriging model. Automotive Engineering, 41(11), 1301–1307. DOI 10.19562/j.chinasae.Qcgc.2019.011.011. [Google Scholar] [CrossRef]
22. Zheng, Y. Q., Zhang, L., Dong, F. G., Dong, B. (2020). Multi-objective structure optimization of wind turbine tower using nondominated sorting genetic algorithm. Journal of Beijing Institute of Technology, 29(3), 417–424. DOI 10.15918/j.jbit1004-0579.20050. [Google Scholar] [CrossRef]
23. Akrami, V., Erfani, S. (2017). An analytical and numerical study on the buckling of cracked cylindrical shells. Thin-Walled Structures, 119(10), 457–469. DOI 10.1016/j.tws.2017.06.023. [Google Scholar] [CrossRef]
 | This work is licensed under a Creative Commons Attribution 4.0 International License, which permits unrestricted use, distribution, and reproduction in any medium, provided the original work is properly cited. |