| Energy Engineering |
DOI: 10.32604/ee.2022.018208
ARTICLE
Simulating Error-Opening of Pressure Relief Valves of a Station on a Continuous Undulating Oil Pipeline with Large Elevation Difference
1National Pipeline Network Group, Southwest Pipeline Co., Ltd., Chengdu, 610094, China
2National Pipeline Network Group, North Pipeline Company, Langfang, 065000, China
3National Pipeline Network Group, West-to-East Gas Transmission Company, Shanghai, 200000, China
*Corresponding Author: Xiaohua Chen. Email: chenxh04@pipechina.com.cn
Received: 08 July 2021; Accepted: 26 September 2021
Abstract: For oil pipeline in mountain areas, high hydrostatic pressure in the pipeline may cause error-opening of pressure relief valves, and oil is discharged from the pipeline to the pressure relief tanks, bringing spilling-over risk of the pressure relief tanks. Therefore, simulating the error-opening situations of the pressure relief valves and investigating the oil discharge process are necessary for checking the possibility of the spilling-over accident and then proposing measures to improve the pressure relief system. This research focuses on a continuous undulating oil pipeline with large elevation difference and a station along this pipeline, which is named B station in this paper, is studied. By OLGA software, simulation model of the pressure relief system of B station is established, and the accuracy of the model is verified by reconstructing a real accident and making a comparison with the actual accident data. The maximum discharge rate reached 8284 m3/h when the pressure relief valve was opened by mistake in the inlet and outlet of the station. The accumulated filling time of the two pressure relief tanks is 200 s, which is in good agreement with the accident data. On this basis, for error-opening of the pressure relief valves at the inlet and outlet of B station, simulation is performed to investigate variations of the discharge velocity, discharge flow rate, accumulated discharge volume and ventilation volume of the vent valve. The discharge velocity is found to be over the maximum velocity allowed for safety consideration. According to the accumulated discharge volume, it is inferred that spilling over of the pressure relief tanks will be caused once error-opening of the pressure relief valve occurs. Also it is judged that the existing breathing valve can not satisfy the ventilation requirement in case of failure of the pressure relief valves. From these simulation results, it is proposed that increasing the number of vent valves, replacing the manual valves with electrically operated valves, and employing security control interlock protection program are improvement measures to guarantee safe, efficient and reliable operation of the pressure relief system at B station.
Keywords: Continuous undulating oil pipeline; large elevation difference; pressure relief system; error-opening; oil discharge; improvement measure
For an oil pipeline going through complex landform areas with mountains, hills or rivers, there is acute topographic undulation along the way, leading to a large number of pipe sections with large elevation difference and thus high hydrostatic pressure in the pipeline. In case of emergency situations such as pump shutdown and process switch, water hammer may occur, which leads to excessive pressure in the pipeline, and thus possibly causes pipeline failure, property damage and even casualties [1–4]. Therefore, reliable pipeline protection system is necessary to protect the pipeline from the damage of surge pressure. Commonly, damage of the oil pipeline due to excessive pressure can be avoided through ways such as increasing the pipe wall thickness, weakening the surge pressure by decompression wave, and reducing pressure by discharging oil in the pipeline to pressure relief tanks [5–7]. Increasing the pipe wall thickness to protect the pipe against the possible extremely high surge pressure inevitably leads to significant increase of the pipeline construction cost. Thus, in China, usually the latter two methods are combined together in ensuring the safety of the pipeline. Decompression wave is produced by operations such as shutdown of the pumps according to scheduled sequence, and regulating the setting values of valves. While discharging oil in the pipeline to pressure relief tanks is performed by the pressure relief system.
For a given continuous undulating oil pipeline with large elevation difference, the pressure relief system at the stations is consisted of pressure relief valves, discharge pipes, pressure relief tanks, manual valves and field instruments. The performance of a pressure relief valve is related with design parameters, system parameters and operation parameters as well as experience of the decision-makers. By now, there have been extensive researches conducted on pressure relief valves or systems, mostly on the dynamic behavior and performance optimization [8–11]. For example, Dasgupta et al. [8] investigated the dynamics of a direct operated relief valve with directional damping by the Bondgraph simulation technique. The dependence of the dynamic response on various design parameters of the valve was demonstrated. Zhang et al. [9] performed numerical simulation to reveal the influence of factors such as the size of surge relief valve, set-pressure and the opening and closing time periods. And the rules for determining the parameters of surge relief valve were proposed. Ortega et al. [10] established a numerical dynamic model for a spring load pressure relief valve to simulate both transient state and equilibrium state, and the influence of several governing parameters including the set-pressure and spring parameters was analyzed. Song et al. [11] employed CFD software ANSYS to study the flow characteristics and dynamic behavior of a spring-loaded pressure safety valve under different overpressure conditions. Carneiro et al. [12–14] studied the dynamic behavior of a spring-loaded pressure relief valve by both experiment method and numerical simulation using Stoner Pipeline Simulator software. Kim et al. [15] aimed to determine the optimum parameters for appropriate installation and operation of the surge relief valve using the integration of Genetic Algorithm. The performance of surge relief valve was investigated at different valve coefficients, set-pressure, opening and closing time. El-Ghandour et al. [16] optimized the pressure relief valve parameters for water distribution systems, and found that the abnormal pressure surges could be controlled by using the determined optimal parameters.
In the continuous undulating oil pipeline with large elevation difference, pilot-operated pressure relief valves [17] are usually employed, with the opening determined by the pressure in the pipeline recorded through a pressure recording pipe. Blocking of either the filter or the pressure recording pipe happens when sediments in the pipeline enter the pressure relief valve. Thus, error-opening of the pressure relief valves may occur. Besides, for the continuous undulating oil pipeline with large elevation difference, high hydrostatic pressure remains in the pipe even after pump shutdown, resulting in discharge of large amount of oil lasting long time due to error-opening of the valves. In this situation, oil may spill over from the pressure relief tanks due to excessive discharge as well as larger required ventilation volume than the ventilation volume provided by the vent valve. Normal operation is thus threatened and exposed to severe safety risk. Starting from this practical engineering problem, this research is objective to simulate the oil discharge process due to error-opening of the pressure relief valves after shutdown of the pipeline. Considering this, a continuous undulating oil pipeline of large elevation difference that transports light oil is taken for example. A station of the considered pipeline, named B station, is focused on. OLGA software is used to simulate the error-opening condition of the pressure relief valves respectively at the inlet and outlet of B station. OLGA software is a mature commercial software for simulating multiphase flow, widely used in petroleum and engineering fields [5,18–20]. Li et al. [5] used OLGA software to simulate the dynamic behavior of pressure reducing valve. The opening and closing processes of nitrogen-type surge relief valve were simulated, and the effect of surge fluctuations pressure was considered. Vandrangi et al. [18] concentrated on leakage detection for pipeline leakage incidents. Leak detection parameters for pipelines with and without a leak were simulated by OLGA software. Liao et al. [19] used OLGA software to simulate the gas-lift unloading process of a gas-lift well. Seyfaee et al. [20] employed OLGA simulator to simulate the wax deposition process in a crude oil pipeline, aimed to clarify the influence of insulation thickness on wax deposition of this pipeline. By this research, the thickness of insulation polypropylene was determined, which was efficient in minimizing wax deposition as well as ensuring economy. In our research, by using OLGA simulator, the variations of accumulated discharge volume, instantaneous discharge velocity, instantaneous discharge flow rate, ventilation volume of vent valve of B station are investigated, based on which scientific improvement suggestions of the pressure relief system of B station are proposed.
The remaining of this paper is organized as follows. Section 2 is about the model establishment and validation, including the governing equations, the pipeline information, the model establishment and model validation. Section 3 is simulating the error-opening situations of the pressure relief valves respectively at the inlet and outlet of B station, and then based on the simulation results, suggestions to improve the pressure relief system are given. Also, error-opening condition of the pressure relief valves in the improved pressure relief system is simulated to check the feasibility of the improvement suggestions. Finally, the conclusions are given in Section 4.
2 Model Establishment and Validation
Two-fluid model is applied to simulate the multi-phase flow. The governing equations include the mass conservation equation, momentum conservation equation and energy conservation equation. The equations are given as follows.
(1) The mass conservation equation
For the gas phase, we have,
For the liquid phase near the pipe wall which is a liquid film, we have,
For liquid droplets, we have,
In the equations, V is the volume fraction of each phase, %; G is the possible mass source of each phase; ρ is density, kg/m³; ν is the flow velocity of each phase, m/s; A is the cross section area of the flow in the pipe, m2; Ψg is the mass transfer rate between the gas and liquid phases, being positive for the liquid-to-gas process, kg/s; Ψc is the carrying velocity of the droplets, kg/s; Ψd is the falling velocity of liquid droplets, kg/s. Subscripts g, L and D respectively represent the gas phase, liquid film and liquid droplets.
(2) The momentum conservation equation
For the gas phase and liquid droplets, the momentum equation is as follows:
For the liquid film adhere to the pipe wall,
where α is the inclination angle of the pipeline against the vertical direction, °; P is pressure, Pa; νr is the relative velocity, m/s; S is the wetted perimeter of each phase interface, m2; g is the gravitational acceleration velocity, m/s2; Subscripts g, L and i are respectively for the interface of gas phase, liquid phase, and the bulk phase. νa satisfies the following relationships, (a) When the liquid film evaporates, if Ψg > 0, then νa = νL; (b) When the liquid droplets evaporates, if Ψg > 0, then νa = νD; (c) For the process of condensation, if Ψg < 0, then νa = νg. The other parameters are similar with the mass conservation equation.
(3) The energy conservation equation
For the whole system, we have,
where E is the internal energy of the fluid for unit mass, J/kg; h is the elevation, m; HS is the enthalpy of the mass source, J; U is the heat transfer amount of the pipe wall, J; m is the mass of each phase, kg.
As with the boundary conditions, for the upstream, we have given flow rate as the boundary condition, while for the outlet, the pressure is known.
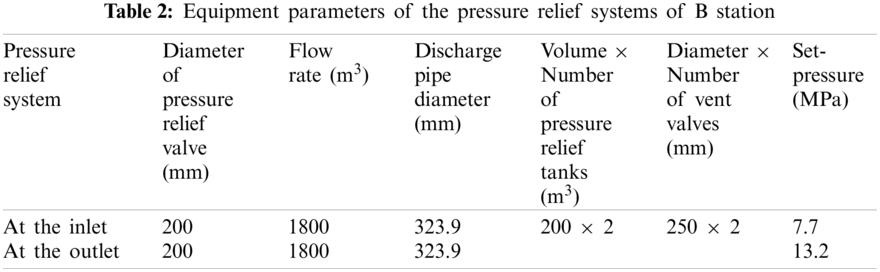
The continuous undulating oil pipeline of large elevation difference applies airtight transportation to transport oil under normal temperature. A, B and C stations are stations along this pipeline, as presented in Fig. 1. The pipe segment between A station and B station is 116 km in length, while the pipe segment between A station and C station is 155 km in length. Both pipe segments are 813 mm in diameter, with the design pressure within 4.9~15.0 MPa and an annual throughput of 1.3 × 10¹⁰ kg, that is 13 million tons. The pipeline transports light oil produced in Saudi, with the property parameters given in Table 1. B station is a boosting pump station, having the inlet pressure and outlet pressure at steady state respectively of 4.4 and 11.8 MPa when the annual throughput is 13 million tons. Both at the inlet and outlet of B station, a pressure relief system is equipped, as Fig. 2 presents. The details of the two pressure relief systems are provided in Table 2.
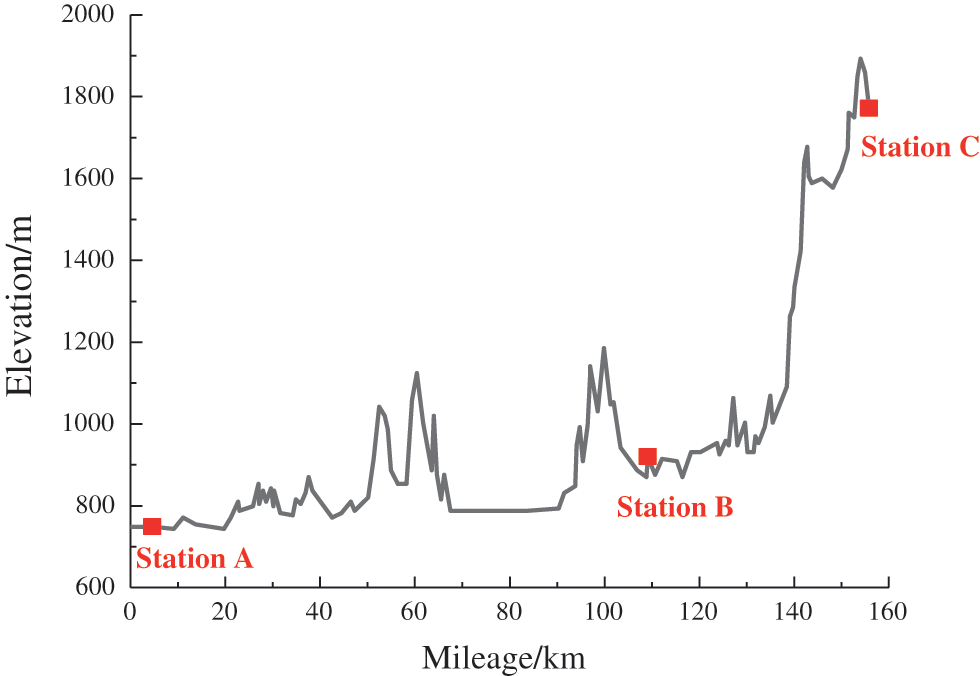
Figure 1: Elevation profile of the pipeline section between A station and C station
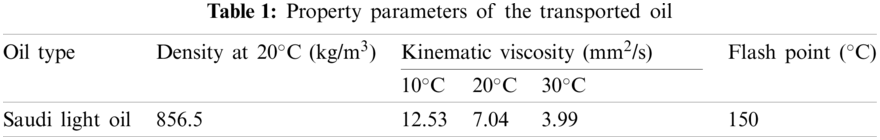
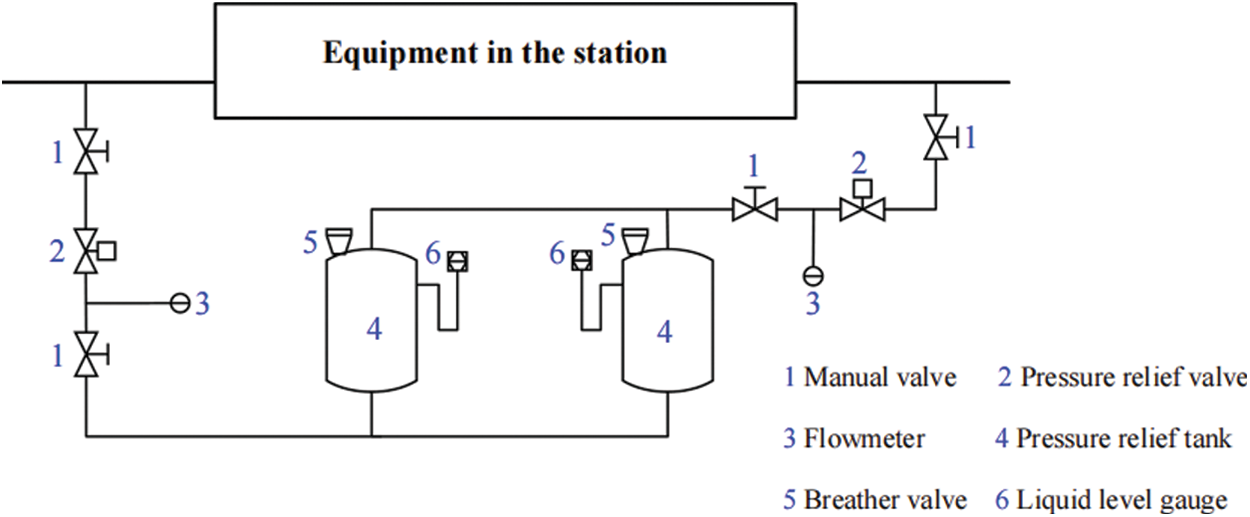
Figure 2: Sketch map of the pressure relief systems of B station
As is depicted by Fig. 2, B station has two pressure relief systems, one connected with the inlet pipe of B station, the other connected with the outlet pipe. For both discharge pipes at the inlet and outlet of B station, three valves are mounted, including two manual valves and a pressure relief valve. The two manual valves are respectively mounted at the front and back of the pressure relief valve, which are used for manually closing the discharge pipes in case of emergency. Behind the pressure relief valves, there are flowmeters, which can send out alarm signals when the discharge pipes open for discharging oil. The two pressure relief systems share two pressure relief tanks connected in parallel, which are dome roof tanks both of 200 m3 of atmospheric pressure. During the discharge process, a large amount of oil is discharged to the pressure relief tanks within a short time, and the pressure inside the pressure relief tanks increases sharply due to compressed gas space. To release the pressure inside the tanks during the discharge process, each pressure relief tank is equipped with a breather valve (vent valve).
2.3 Establishment of the Simulation Model
Based on the pressure relief systems of B station, a simulation model is established, which sets A as the starting point, and C as the ending point. As Fig. 3 shows, the model is consisted of the pressure relief systems at the inlet and outlet of B station, a boost pump, safety interlock valves at the inlet and outlet of B station, regulating valves, manual valves and so on. As mentioned above, B station is a boosting pump station, having the inlet pressure and outlet pressure at steady state respectively of 4.4 and 11.8 MPa when the annual throughput is 13 million tons. In the model, the pressure increase by the boost pump is set as 7.4 MPa. The pressure relief valve of the model consists of a pressure transducer and a valve, with the pressure transducer mounted at the inlet and outlet of the station. When the monitored pressure is higher than the set-pressure of the pressure relief valve, the valve is opened to discharge oil. Due to the lack of detailed parameter of the boost pump, the model applies valve shutdown to represent pump shutdown. In OLGA software, there is no pressure relief tank, and a pressure node of 0.101 MPa in the model is used, considering that pressure relief tank is dome roof tank.
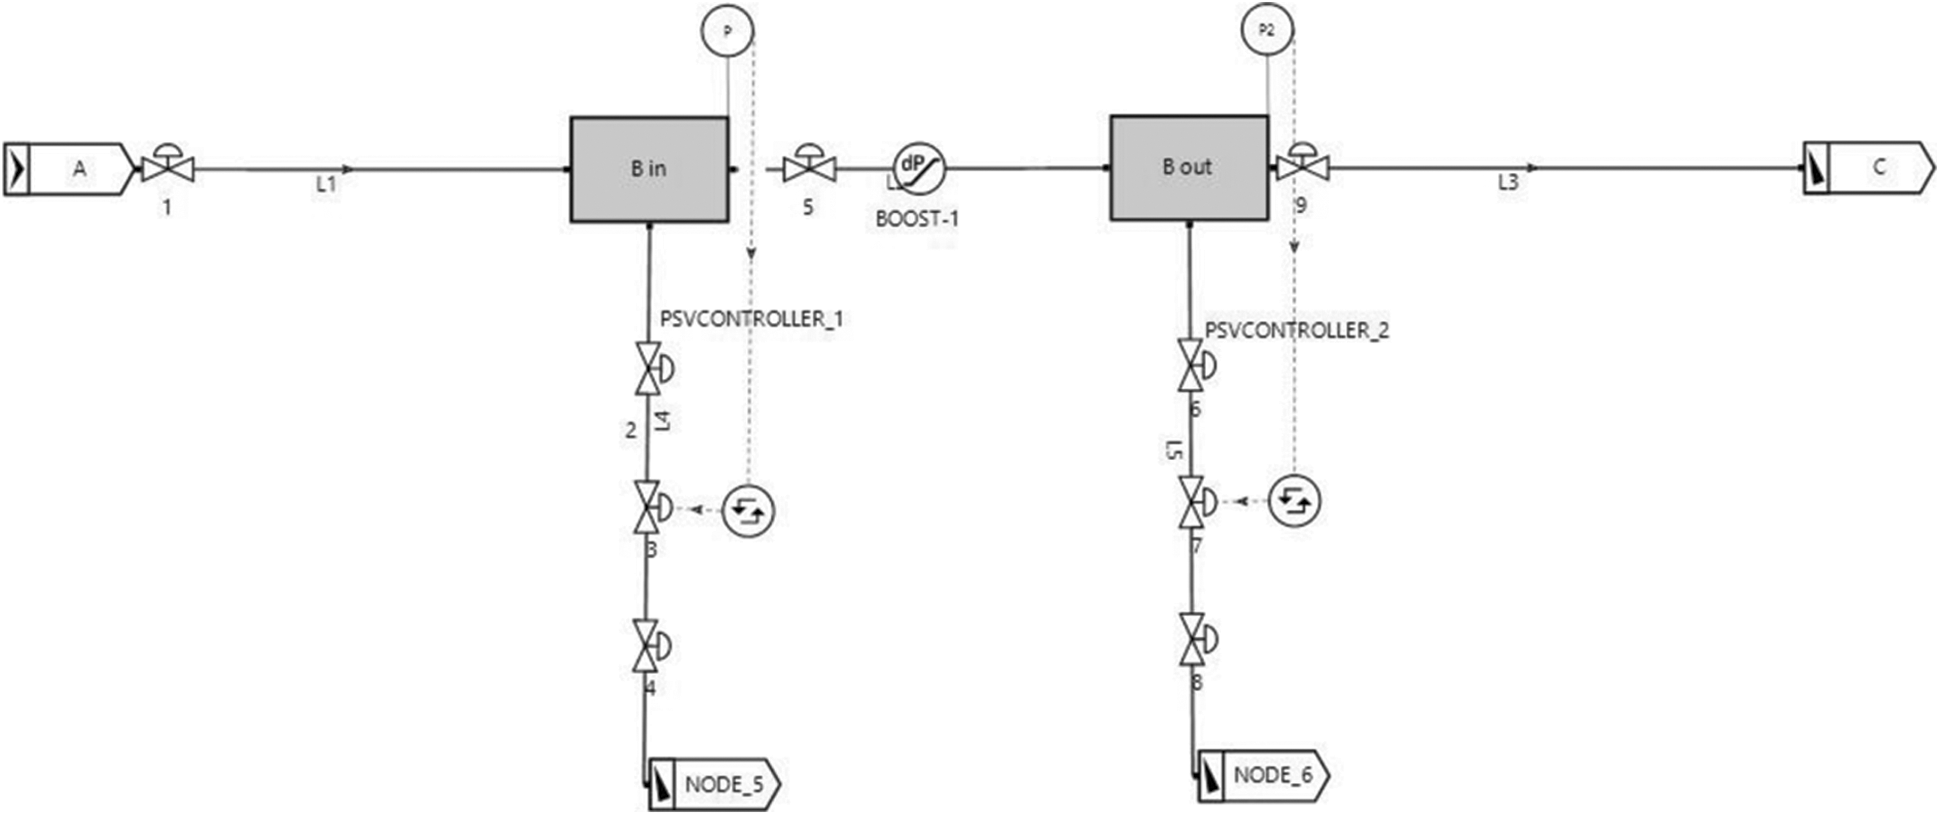
Figure 3: The simulation model
2.4 Validation of the Simulation Model
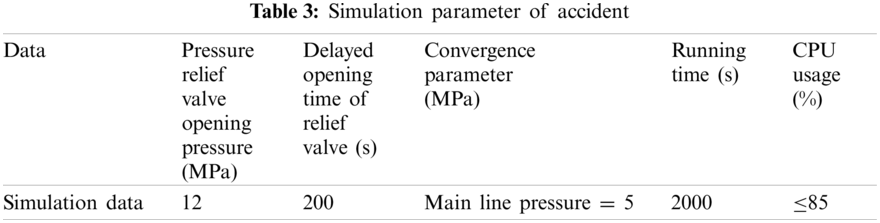
A real over-spilling accident of the pressure relief tanks at B station is used to validate the established model. Before the accident, the inlet pressure of B station was 4.86 MPa and the outlet pressure of B station was 12.8 MPa. The throughput of B station was 1000 m3/h, and both the pressure relief tanks at B station were empty. As the outlet pressure of B station was over 12.4 MPa, i.e., the alarm set-pressure, alarm signals were sent out by the station control of B station, which caused sharp drop of the outlet flow rate. About 3 min after the beginning of the accident, there was water leaked at the manhole and water spilling at the roof of the pressure relief tank. About 4 min after the beginning of the accident, the staff began to close the manual valve at the front of the pressure relief valve on site. 7 min after the beginning of the accident, the manual valves at the front of the pressure relief valves at the inlet and outlet of B station were closed, and the pump of B station was shutdown, with the outlet pressure remaining at 2.66 MPa. As the pressure relief valve was fully open within a short time after the set-pressure was reached, the influence of the opening of the pressure relief valve on the discharge process could be ignored. The simulation data of the accident is provided in Table 3.
The simulation result of this real accident is presented in Fig. 4, including the temporal variations of the discharge pressure, accumulated discharge volume and discharge flow rate of oil. And the comparison of real accident data and simulation data is given in Table 4. It is shown that at the beginning before the accident, there is fluctuation of the outlet pressure of B station (L3), and at 200 s, the discharge flow rate increases within an instant, with the outlet pressure of B station dropping sharply to 4.0 MPa and the maximum discharge flow rate reaching 7930 m3/h. 194 s after opening the pressure relief valve, the accumulated discharge amount reaches 400 m3, meaning that both the pressure relief tanks become full. 5 min (300 s) after the opening of pressure relief valve, the pump of B station is shutdown, and the front valve of the pressure relief valve at the outlet of B station is closed, with the outlet pressure decreased to 2.7 MPa, and the accumulated discharge amount being 653 m3. There is a temperature difference of 0.5°C before and after the oil discharge, which is small enough for us to consider that the temperature is almost unchanged.
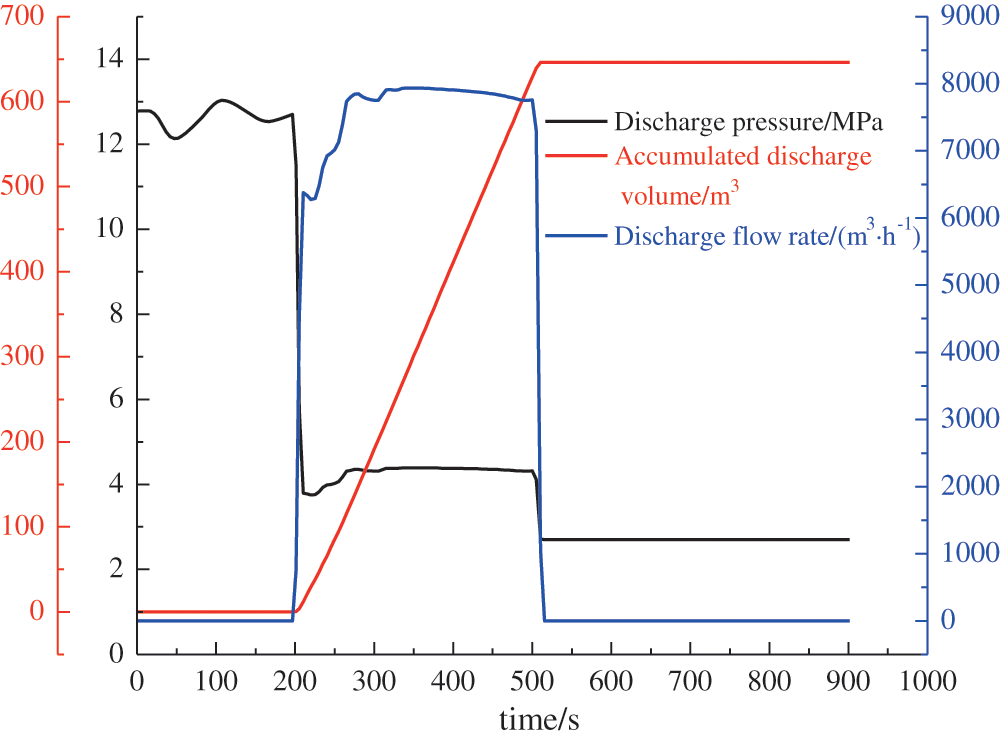
Figure 4: The simulation results of the accident of B station
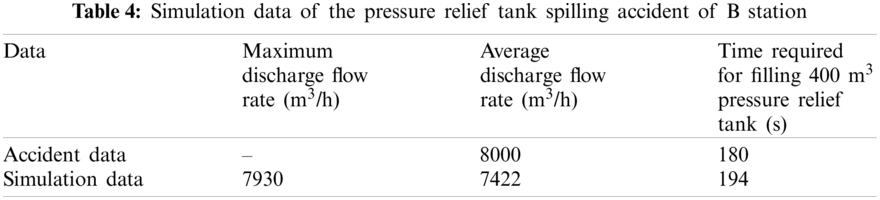
While the real accident data shows that 3 min (180 s) was cost to fulfill the two pressure relief tanks (which have a total volume capacity of 400 m3). According to the simulation data, the time required for filling the 400 m3 pressure relief tanks is 194 s, meaning a 7.78% deviation from the accident data. Then comparing the average discharge volume of the accident data and the simulation data within 180 s indicates a deviation of 7.22%. The simulation accuracy is considered to be acceptable for engineering analysis of field accidents.
The medium pressure acting on the relief valve equals the static pressure of the medium caused by elevation plus the dynamic pressure of the medium in the pipeline. Therefore, under the same conditions, the higher the elevation, the greater the pressure is imposed on the relief valve, and the smaller is the flow rate in the main pipe.
3 Simulating Error-Opening of the Pressure Relief Valves and Giving Improvement Suggestions
During normal operation of the pipeline, if pressure relief valve error-opens and fails to be closed, an alarm signal is sent out. Then the station staff can report the situation and apply the permission for manually closing the manual valve in front of the pressure relief valve. Also the pressure relief tank is equipped with a liquid level indicator of Safety Integrity Level 2 certification, and when the liquid level in the pressure relief tank reaches the alarm set-level, the advance shutdown control program of the whole pipeline is triggered against water hammer.
However, error-opening of the pressure relief valves may occur after the pump of B station is shutdown, then the discharge pipe can only be closed through the manual valve in front of the pressure relief valve. If there is a delay in manually closing the manual valve, spilling over of the pressure relief tanks happens. To avoid the above illustrated spilling over accident of the pressure relief tank, simulating and analyzing the error-opening situations of the inlet and outlet pressure relief valves after the pump of B station is shutdown is necessary.
3.1 Error-Opening of the Inlet Pressure Relief Valve
At 600 s, error-opening of the inlet pressure relief valve occurs, and the simulation results are shown in Table 5 and Fig. 5. As is seen, once error-opening of the inlet pressure relief valve happens (at 600 s), the inlet pressure drops sharply and the discharge flow rate rises to its maximum (5129 m3/h) at an instant. Meanwhile, the accumulated discharge volume increases gradually to constant level of 192 m3, meaning that error-opening of the pressure relief valve the inlet of B station finally causes an accumulated discharge volume of 192 m3. Also, it is noted that the maximum discharge velocity is 20.16 m/s, higher than the safety velocity limit prescribed in Specification for Electrostatic Safety of Liquid Petroleum Products, General Guidelines for the Prevention of Electrostatic Accidents, and Basic Technical Requirements for Safety of Oil Terminals. For light oil, it is better to control the velocity at the inlet of the oil tank below 7 m/s, and the allowed maximum is 10 m/s provided an electrostatic eliminator is installed. Large flow velocity enhances accumulation of static electricity, which produces electrostatic sparks after a certain accumulation and results in combustion and even explosion of the pressure relief tank.
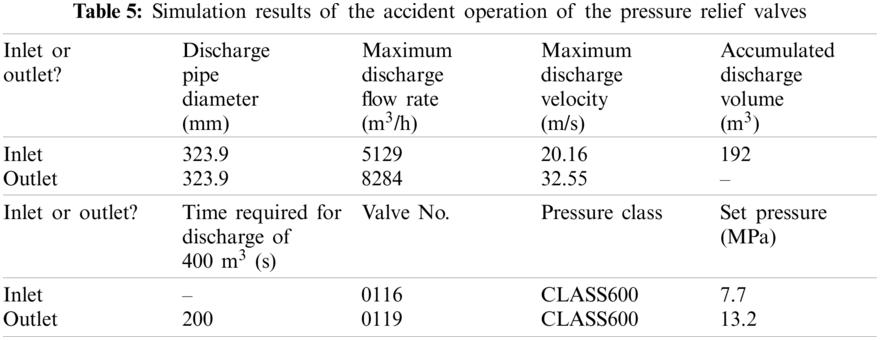
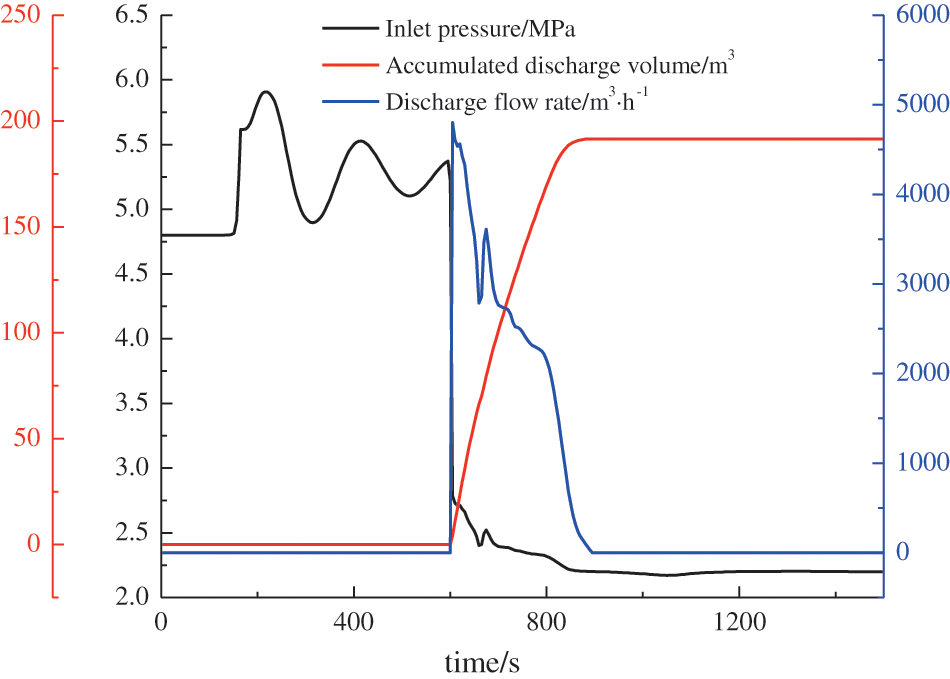
Figure 5: The discharge data due to error-opening of the pressure relief valve at the inlet of B station
3.2 Error-Opening of the Outlet Pressure Relief Valve
For error-opening of the pressure relief valve at the outlet of B station, the simulation results are given in Fig. 6 and Table 4. The maximum discharge flow rate after error opening (also at 600 s) is as large as 8284 m3/h, and the accumulated discharge volume exceeds 400 m3 within 15 min. The discharged oil mainly comes from the backflow of the downstream pipe section due to the large elevation difference between B station and C station. The pipe section at the downstream of B station has an elevation up to 1893 m and the maximum hydrostatic pressure is as large as 15.87 MPa. After pump shutdown at B station, the large downstream hydrostatic pressure motivates the oil to flow towards B station. The maximum discharge velocity is 32.55 m/s, also higher than the safety velocity limit prescribed in Specification for Electrostatic Safety of Liquid Petroleum Products, General Guidelines for the Prevention of Electrostatic Accidents, and Basic Technical Requirements for Safety of Oil Terminals.
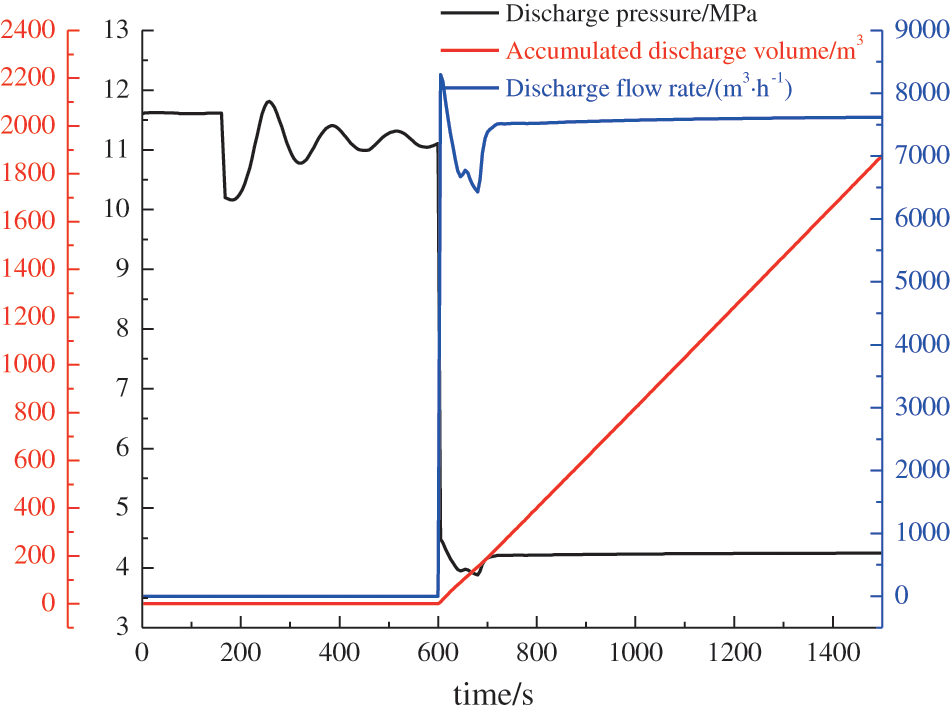
Figure 6: The discharge data due to accident operation of the pressure relief valve at the outlet of B station
3.3 Suggestions to Improve the Pressure Relief System
There was also an accident occurred during a test of putting the pipeline into commission using water. According to the test, totally 5 min (300 s) was cost from the beginning of relieving pressure to manually closing manual valves. In the 5 min, 2 min was spent for applying the permission of operation and receiving the permission. It is inferred that, manually closing manual valves required 3 min. While as with the simulation, 200 s is cost for an accumulated discharge of 400 m3. It is known only 80 s is left for the field staff to close the manual valves, which is not enough according to the test data, and thus spilling over of the pressure relief tank occurs.
In error-opening condition of the inlet and outlet pressure relief valves, the discharge flow rate is up to 8284 m3/h. According to Specification for Breather Valves of Petroleum Tanks, the ventilation volume should be 1.07 times of the maximum liquid inlet volume when the flash point of the liquid is higher than 45°C in entering the tank. Considering the liquid inlet volume of 4142 m3/h for a single tank, the required ventilation volume of the vent valve should be 4431.9 m3/h. The design material of B station shows that the working pressure of the pressure relief tank is 2 kPa in relative pressure, and correspondingly the ventilation volume of the DN 200 breathing valve at the tank roof is 1500 m3/h. The existing breathing valve can not satisfy the ventilation requirement in case of failure of the pressure relief valves, which may cause tank inflation due to loss of pressure balance, and even results in tearing of the tank. To overcome this problem, 3 DN 200 breathing valves should be installed for each pressure relief tank of B station. By totally a ventilation ability of 4500 m3/h flow rate, pressure safety inside the tank could be guaranteed during the discharge process.
Also, during error-opening of the pressure relief valves at both the inlet and outlet of B station, the discharge velocity exceeds the allowed maximum velocity even with the static electricity eliminator. It is suggested to shutdown the discharge pipes to avoid the accumulation of static electricity. Thus, changes to the pressure relief pipes are not required.
The time cost for fulfilling the two pressure relief ranks is as short as 200 s in case of error-opening of the pressure relief valves at B station. If error-opening of the pressure relief valves happens during normal commissioning of the pipeline, 80 s is not enough for the on-site staff to manually close the manual valves before spilling over of the pressure relief tanks. Thus, it is suggested to replace the two manual valves in front and behind the pressure relief valve with electrically operated valves, which take as least as 20 s to be closed.
Based on the above suggestions, the pressure relief systems at the inlet and outlet of B station can be improved. Below, error-opening of the improved pressure relief system at the outlet of B station is simulated. It is assumed that closing the electrically operated valve in front of the pressure relief valve begins 120 s after error-opening of the pressure relief valve, and ends 20 s later. The simulation result is shown in Fig. 7. It is seen that the accumulated discharge volume is 243.5 m3 after the electrically operated valves is closed. Therefore, the spilling over accident of the pressure relief tank can be avoided after error-opening of the pressure relief valve. According to the profile of the accumulated discharge volume, the variation of the discharge flow rate can be analyzed. At 600 s, the discharge flow rate rises to a constant level from 0, which is kept until the electrically operated valves is closed. Besides, the time with accumulation of static electricity can be shortened, reducing the combustion and explosion risks of the pressure relief tanks.
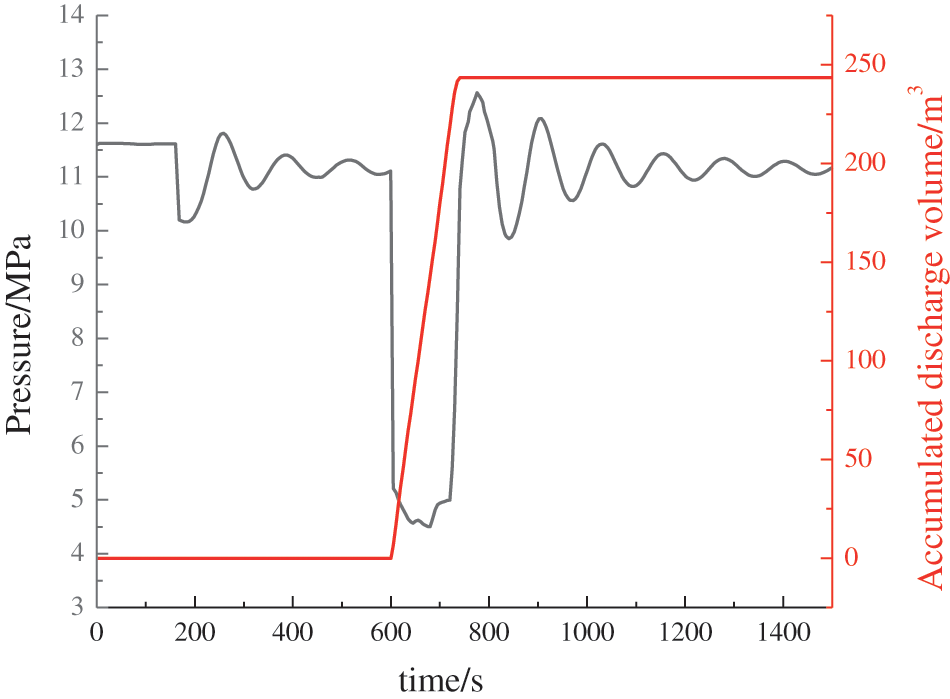
Figure 7: Simulation of the improved pressure relief system
Due to complex elevation variations and high hydrostatic pressure in the continuous undulating pipeline of large elevation differences, there is high pressure remaining in the pipeline after pipeline shutdown. Therefore, error-opening of the pressure relief valves may happen, causing discharge of oil to the pressure relief valves for a long time. And spilling over of the pressure relief tanks may occur. This research simulates the error-opening situations of the pressure relief systems of a station (named Station B) in a continuous undulating pipeline of large elevation difference. OLGA software is used for the simulation. The main conclusions are provided as follows:
(1) Once error-opening of the pressure relief valve occurs, oil is discharged to the pressure relief tanks, with the maximum discharge flow rate respectively being 5129 m3/h and 8284 m3/h for error-opening of the pressure relief valve respectively at the inlet and outlet of B station. The discharge velocity of the oil is over the upper limit of security allowance, which might cause safety accidents due to increasing accumulation of static electricity. To prevent such accidents, the discharge pipe should be closed as early as possible to quit oil discharge.
(2) After error-opening of the pressure relief valves, the ventilation volume required by the pressure relief tank is larger than the provided ventilation ability. To avoid tank inflation or tank tearing, the number of the vent valves should be increased according to the simulation result.
(3) For the discharge pipe, replacing manual valves with electrically operated valves could reduce the time for closing valves in case of accident situations, and cease the static electricity accumulation during the discharge process, therefore reducing risks of tank spilling, combustion and explosion.
(4) The pressure in the pipeline is still at a high level after the pipeline is shut down. When the pressure relief valve is opened by mistake, a large amount of oil is released continuously.
Acknowledgement: The authors would like to extend their sincere gratitude to the editors and reviewers of Energy Engineering.
Funding Statement: The authors received no specific funding for this study.
Conflicts of Interest: The authors declare that they have no conflicts of interest to report regarding the present study.
1. Schmitt, C., Pluvinage, G., Hadj-Taieb, E., Akid, R. (2006). Water pipeline failure due to water hammer effects. Fatigue & Fracture of Engineering Materials & Structure, 29(12), 1075–1082. DOI 10.1111/j.1460-2695.2006.01071.x. [Google Scholar] [CrossRef]
2. Simpson, A. R., Wylie, E. B. (1991). Large water-hammer pressures for column separation in pipelines. Journal of Hydraulic Engineering, 117(10), 1310–1316. DOI 10.1061/(ASCE)0733-9429(1991)117:10(1310). [Google Scholar] [CrossRef]
3. Ghidaoui, M. S., Zhao, M., Mclnnis, D. A., Axworthy, D. H. (2005). A Review of water hammer theory and practice. Applied Mechanics Reviews, 58(1), 49–76. DOI 10.1115/1.1828050. [Google Scholar] [CrossRef]
4. Nambiar, P., Dsouza, B., Dsouza, A., Chaudhari, P., Bandal, S. et al. (2015). Surge analysis in piping systems analysis of valve characteristics. 2015 International Conference on Technologies for Sustainable Development (ICTSD-2015), Mumbai, India. [Google Scholar]
5. Li, S. X., Wang, W. B., Fan, Y. L., Li, Z. (2017). Dynamic simulation of Nitrogen-type surge relief valve based on immersed solid method. Journal of Engineering Thermophysics, 38(2), 253–258. DOI 10.3969/j.issn.1674-8530.2013.04.012. [Google Scholar] [CrossRef]
6. Vijayan, V., Bae, H., Marti, T., Choi, S. (2015). Decompression wave speed and crack velocity measurements during S4 test in water pressurized plastic pipes: Part 1. Experimental methods. Polymer Testing, 53(5), 338–346. DOI 10.1016/j.polymertesting.2015.12.016. [Google Scholar] [CrossRef]
7. Boulos, P. F., Lansey, K. E., Karney, B. W. (2004). Comprehensive water distribution systems analysis handbook for engineers and planners. Pasadena: MWH Soft. [Google Scholar]
8. Dasgupta, K., Karmakar, R. (2002). Modelling and dynamics of single-stage pressure relief valve with directional damping. Simulation Modelling Practice and Theory, 10(1–2), 51–67. DOI 10.1016/S1569-190X(02)00059-X. [Google Scholar] [CrossRef]
9. Zhang, K. Q., Karney, B. W., McPherson, D. L. (2008). Pressure-relief valve selection and transient pressure control. Journal-American Water Works Association, 100(8), 62–69. DOI 10.1002/j.1551-8833.2008.tb09700.x. [Google Scholar] [CrossRef]
10. Ortega, A. J., Azevedo, B. N., Pires, L. F. G., Nieckele, A. O., Azevedo, L. F. A. (2008). A numerical model about the dynamic behavior of a pressure relief valve. Proceedings of ENCIT, 12th Brazilian Congress of Thermal Engineering and Sciences, Belo Horizonte, MG. [Google Scholar]
11. Song, X., Wang, L., Park, Y. (2010). Transient analysis of a spring-loaded pressure safety valve using computational flfluid dynamics (CFD). Journal of Pressure Vessel Technology, 132(5), 054501–054505. DOI 10.1115/1.4001428. [Google Scholar] [CrossRef]
12. Carneiro, L. M., Pires, L. F. G., Cruz, M. D. S., Azevedo, L. F. A. (2012). Dynamic behavior of spring-loaded pressure relief valve: Numerical and experimental analysis. Proceedings of the 2012 9th International Pipeline Conference, pp. 1–9. Calgary, Alberta, Canada. [Google Scholar]
13. Jia, T., Wu, Z., Wang, J., Feng, R., Qin, Y. (2013). Design and performance analysis of digital pressure relief valve of water-based hydraulic. Applied Mechanics and Materials, 387, 369–373. DOI 10.4028/www.scientific.net/AMM.387.369. [Google Scholar] [CrossRef]
14. Wu, D., Li, S., Wu, P. (2015). CFD simulation of flow-pressure characteristics of a pressure control valve for automotive fuel supply system. Energy Conversion and Management, 101(5), 658–665. DOI 10.1016/j.enconman.2015.06.025. [Google Scholar] [CrossRef]
15. Kim, H., Hur, J., Kim, S. (2017). The optimization of design parameters for surge relief valve for pipeline systems. AIP Conference Proceedings, 1836(1), 20034. DOI 10.1063/1.4981974. [Google Scholar] [CrossRef]
16. El-Ghandour, H. A., Elansary, A. S. (2019). Optimal selection of pressure relief valve parameters for surge pressure control in water distribution systems. Urban Water Journal, 16(4), 269–276. DOI 10.1080/1573062X.2019.1669189. [Google Scholar] [CrossRef]
17. Dasgupta, K., Karmakar, R. (2002). Dynamic analysis of pilot operated pressure relief valve. Simulation Modelling Practice and Theory, 10(1–2), 35–49. DOI 10.1016/S1569-190X(02)00061-8. [Google Scholar] [CrossRef]
18. Vandrangi, S. K., Lemma, T. A., Mujtaba, S. M., Srinivas, R. P. (2021). Determination and analysis of leak estimation parameters in two-phase flow pipelines using OLGA multiphase software. Sustainable Computing: Informatics and Systems, 8(1), 148–157. DOI 10.1016/j.suscom.2021.100564. [Google Scholar] [CrossRef]
19. Liao, M. X., Ke, W. Q., Liao, R. Q., Li, J. L., Luo, W. (2015). The research of dynamic simulation of gas-lift well unloading process based on OLGA. Chemical Engineering Transactions, 46(1), 54–63. DOI 10.3303/CET1546160. [Google Scholar] [CrossRef]
20. Seyfaee, A., Lashkarbolooki, M., Esmaeilzadeh, F., Mowla, D. (2012). Investigation of the effect of insulation on wax deposition in an Iranian crude oil pipeline with OLGA simulator. Journal of Dispersion Science and Technology, 33(8), 1218–1224. DOI 10.1080/01932691.2011.605649. [Google Scholar] [CrossRef]
 | This work is licensed under a Creative Commons Attribution 4.0 International License, which permits unrestricted use, distribution, and reproduction in any medium, provided the original work is properly cited. |