| Energy Engineering |
DOI: 10.32604/ee.2022.018448
ARTICLE
Study of Denoising in the Electricity Anti-Stealing Detection Based on VMD-WTD Combination
1Metrology Center of Guangdong Power Grid Corporation, Shenzhen, 518049, China
2School of Automation, Guangdong University of Technology, Guangzhou, 510006, China
3China-EU School of Clean and Renewable Energy, Huazhong University of Science and Technology, Wuhan, 430074, China
*Corresponding Author: Yunfei Cao. Email: 1582467921@foxmail.com
Received: 25 July 2021; Accepted: 17 September 2021
Abstract: In order to solve the failure of electricity anti-stealing detection device triggered by the noise mixed in high-frequency electricity stealing signals, a denoising method based on variational mode decomposition (VMD) and wavelet threshold denoising (WTD) was applied to extract the effective high-frequency electricity stealing signals. First, the signal polluted by noise was pre-decomposed using the VMD algorithm, the instantaneous frequency means of each pre-decomposed components was analyzed, so as to determine the optimal K value. The optimal K value was used to decompose the polluted signal into K intrinsic mode components, and the sensitive mode components were determined through the cross-correlation function. Next, each sensitive mode was reconstructed. Finally, the reconstructed signal denoised using the wavelet threshold to obtain the denoised signal. The simulation analysis and experimental results show that the proposed method is superior to the traditional VMD method, FFT method and EMD method, as it can effectively eliminate the noise and enhance the reliability of high-frequency electricity stealing signal detection.
Keywords: Electricity stealing; electromagnetic interference; variable mode; wavelet threshold; instantaneous frequency mean
The high-frequency electricity anti-stealing technology has been widely applied to the electricity anti-stealing field. Many lawbreakers generate high-frequency electromagnetic interference using equipment and damage the normal operation of electric meters via electromagnetic interference [1]. With the popularization of intelligent electric meters, the precision electronic elements in the meter box are more susceptible to the electromagnetic interference. Because this technology has strong concealment and the interference cannot be blocked by traditional meter boxes, it increases the difficulty of in the electricity anti-stealing work. At present, related departments make efforts to identify the abnormalities in the electricity use through the Machine learning or big data prediction [2–4], personnel are then assigned for the field verification, but this method fails to directly distinguish whether such abnormality is generated by reduction in load of users or electricity stealing behavior. The remote control cannot be prevented by installing camera and IR heat-sensing devices. The high-frequency electricity stealing signal can be attenuated or shielded well by strengthening the shielding and protecting the elements. However, the electricity stealing behavior cannot be tracked once happening. In order to more effectively strike this electricity stealing behavior, detecting the high-frequency electricity stealing interference signal will be of great significance [5,6]. Given this, the method of detecting the electricity stealing signal with electricity anti-stealing devices has been proposed, which can effectively and directly discriminate the electricity stealing behavior and provide a basis for tracing such behavior.
Electricity stealing interference signal is usually concealed in environmental noise, which greatly impacts the detection accuracy. In order to facilitate the electricity anti-stealing device to accurately identify the electricity stealing signal, the acquired signal should be denoised. The commonly used denoising methods include singular value decomposition (SVD) [7–9], wavelet transform (WT) [10,11] algorithm, fast Fourier transform (FFT) [12,13] and empirical mode decomposition (EMD) [14], among which the SVD algorithm is capable of effectively extracting the main components, but it is difficult to determine its effective rank order and dimension of the matrix. The WT algorithm is featured by favorable time-frequency characteristic, de-correlation and multi-resolution analysis, but the noises with approximate frequencies cannot be effectively eliminated, and the denoising effect is affected by the wavelet basis function. The FFT algorithm is simple and convenient, but it is prone to the spectrum leakage problem. Although the EMD method does not need to select the basis function for decomposition, it can be easily stuck in the mode aliasing problem, thus influencing the denoising accuracy. The variational mode decomposition (VMD) [15], which was proposed by Konstantin Dragomiretskiy in 2014, is a complete non-recursive signal processing method which decomposes a signal into a series of mode components. These mode components, which have their respective center frequencies, are effectively separated from each other. In comparison with algorithms like EMD, the VMD is of better robustness and overcomes the mode aliasing problem, and it is suitable for processing the nonlinear and non-stationary signals [16]. The wavelet threshold algorithm separates the noise and signal according to the threshold of wavelet coefficients, which can suppress noise strongly [17].
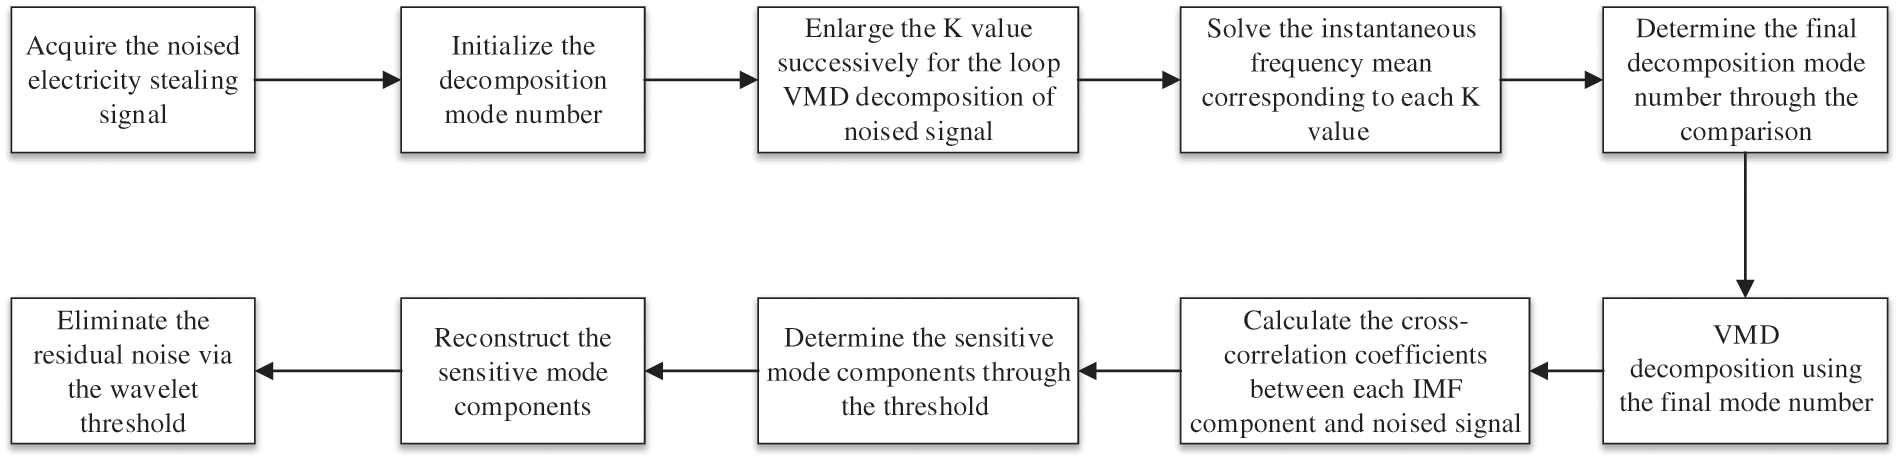
Given that the electricity anti-stealing device fails to effectively operate due to the noise interference, a method of high frequency electricity stealing signal denoising that combines the VMD and wavelet threshold was used to solve the problem in this paper. First, the K value was determined based on the instantaneous frequency mean, followed by the VMD decomposition. Second, the sensitive modes were confirmed through the threshold of cross-correlation coefficient and reconstructed to perform the wavelet threshold denoising, thus solving the problem that the preset mode number (K value) should be accurately determined [18,19]. The simulation and experimental results showed that this method is superior to the traditional VMD method, FFT method and EMD method.
The EMD method obtains multiple fixed mode functions through the recursive loop iterations. Differently, the VMD method decomposes a signal into multiple modes around their respective center frequencies by constructing and solving a constrained variational model, and transforms the mode estimation problem into a variational problem.
2.1.1 Construct a Variational Model
Variational model seeks for K bandwidth-limited modes with center frequencies on the precondition that the original signal is the sum of modes, aiming to reach the sum of the bandwidth of each mode is minimized.
Calculate each intrinsic mode component
Estimate the center frequency of each mode by the mixing index
Calculate the L2 norm for the gradient of demodulated signal, and estimate the bandwidth of mode component.
The constrained variational model obtained through the above steps is as below:
where f is the original input signal;
2.1.2 Solve the Variational Model
The precision and fidelity of mode reconstruction signal can be ensured by introducing Lagrange multiplication operator
The formula (3) is solved based on the alternating direction method of multipliers. The saddle point of the expression is solved by the alternating iteration of
where:
The iteration ends when the formula (7) is satisfied, and K IMF components can be obtained through Fourier transform.
2.2 Principle of Wavelet Threshold
The wavelet threshold method proposed by Donoho is an effective denoising method based on WT, with the main process as follows [20]:
Select the proper number of decomposition layers and wavelet basis function, and perform the wavelet decomposition of noise polluted signal.
Process the decomposed wavelet coefficients by selecting an appropriate threshold function, set the wavelet coefficients of noise to zero through the threshold, and conduct the denoising operation and reserve the characteristic signal.
Process the wavelet coefficients which after threshold processing using the wavelet inverse transform, and obtain the final denoised signal.
The parameter selection is the most important in the wavelet threshold. The wavelet transform and wavelet inverse transform is the transform under the wavelet basis function, and their expressions are respectively as follows:
where a is the expansion and contraction quantity;
When it comes to the hard threshold, the wavelet coefficients smaller than the threshold are set to zero, while that larger than the threshold is reserved, and the expressed is as below:
As for the soft threshold, the wavelet coefficients smaller than the threshold are set to zero, while the difference value between the threshold and the wavelet coefficients larger than the threshold are solved, and the expression is as below:
where
3 VMD-WT Combined Denoising Method
3.1 Selection of K Value Based on Instantaneous Frequency Mean
It is crucial to determine the K value in the VMD decomposition. If the K value is too small, the mode components may be under-decomposed, but if it is too large, the mode components will be over-decomposed, accompanied by the discontinuous instantaneous frequency of IMF, both of which will impact the accurate separation of noise modes. Most of the traditional VMD algorithms determine the K value through the center frequency method [21], which, however, is of great subjectivity and may generate different results specific to different problems. Given this, a selection method of K value based on the instantaneous frequency mean was proposed. First, K = 2 was set to perform the pre-decomposition of noised signal, then the K value was gradually enlarged to acquire different IMF component groups. Next, the Hilbert transform of IMF components in each group was conducted, and the mean value of their instantaneous frequency was solved. In the end, the mean values of instantaneous frequency corresponding to different K values were compared. When an instantaneous frequency mean was obviously reduced, the corresponding K value was a critical value, and K − 1 was chosen as the decomposition number.
The instantaneous frequency mean was calculated by the following steps:
1. Conduct the Hilbert transform of signal
2. Combine
The calculation formula of instantaneous frequency is as below:
The instantaneous frequency mean is calculated through the following formula:
3.2 Determination of Sensitive Modes Based on Cross-Correlation Coefficient
When IMF components are acquired through the decomposition, the signal features can be effectively extracted only by determining and reconstructing the effective sensitive components. In this study, the sensitive components were screened out using the cross-correlation coefficients. To be more specific, the cross-correlation coefficients between each IMF component and noised signal were solved firstly, a threshold was then calculated through the maximum cross-correlation coefficient, and the IMF components greater than this threshold were regarded as the sensitive components. The cross-correlation coefficient and threshold are expressed respectively as follows [19]:
where
According to data collection, high-frequency electricity stealing signal is usually manifested by the high-frequency impulse, so the formula (19) can be used to simulate.
where
The electricity stealing signal is as shown in Fig. 1a.
To simulate the noisy environment, five narrow-band noises and one Gaussian white noise (6 dB) were added into the original signal, where the expression of narrow-band noise is as follows:
where
The noised signal was decomposed via VMD under K value of 2–10. Establish a coordinate axis, the y-axis is the instantaneous frequency mean, and the x-axis is the number of modal sequences, the change curves of instantaneous frequency mean were solved for each IMF component, as shown in Fig. 2. It could be seen that the instantaneous frequency mean was obviously reduced under K = 3, so the optimal decomposition mode number should be taken as 2. The VMD decomposition result of noise polluted signal under K = 2 is as shown in Fig. 3.
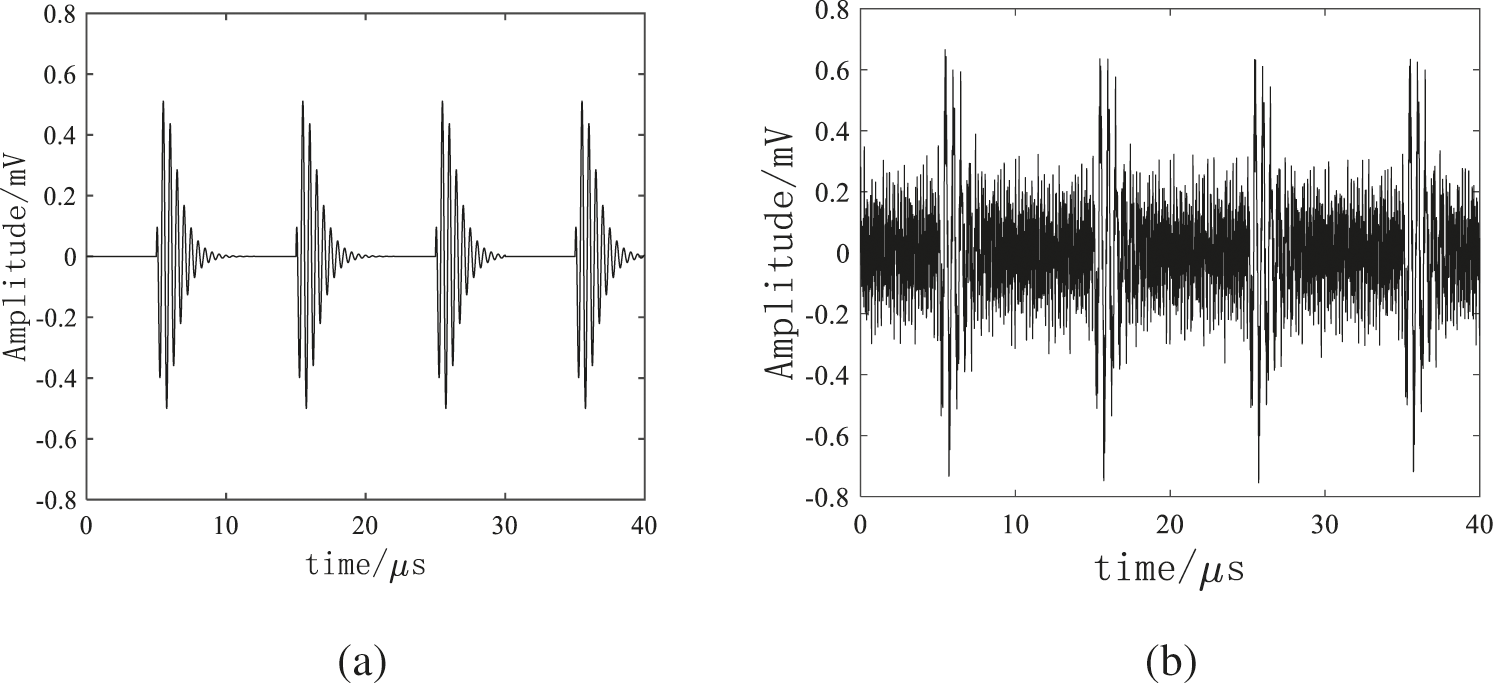
Figure 1: (a) is electricity stealing signal, (b) is noise polluted signal
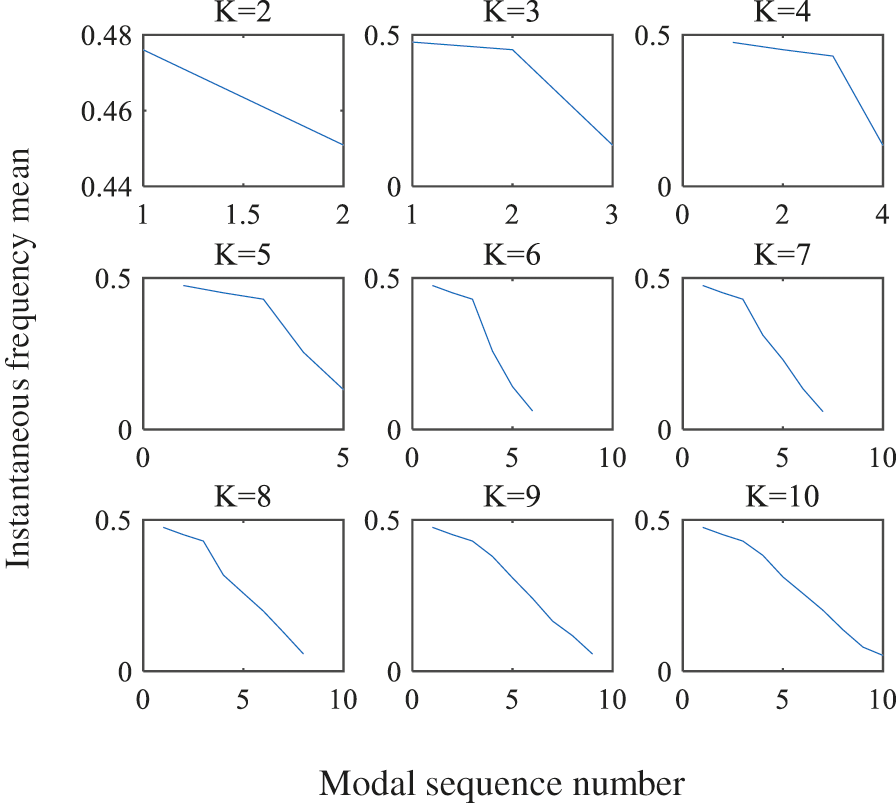
Figure 2: Variation diagram of instantaneous mean frequency
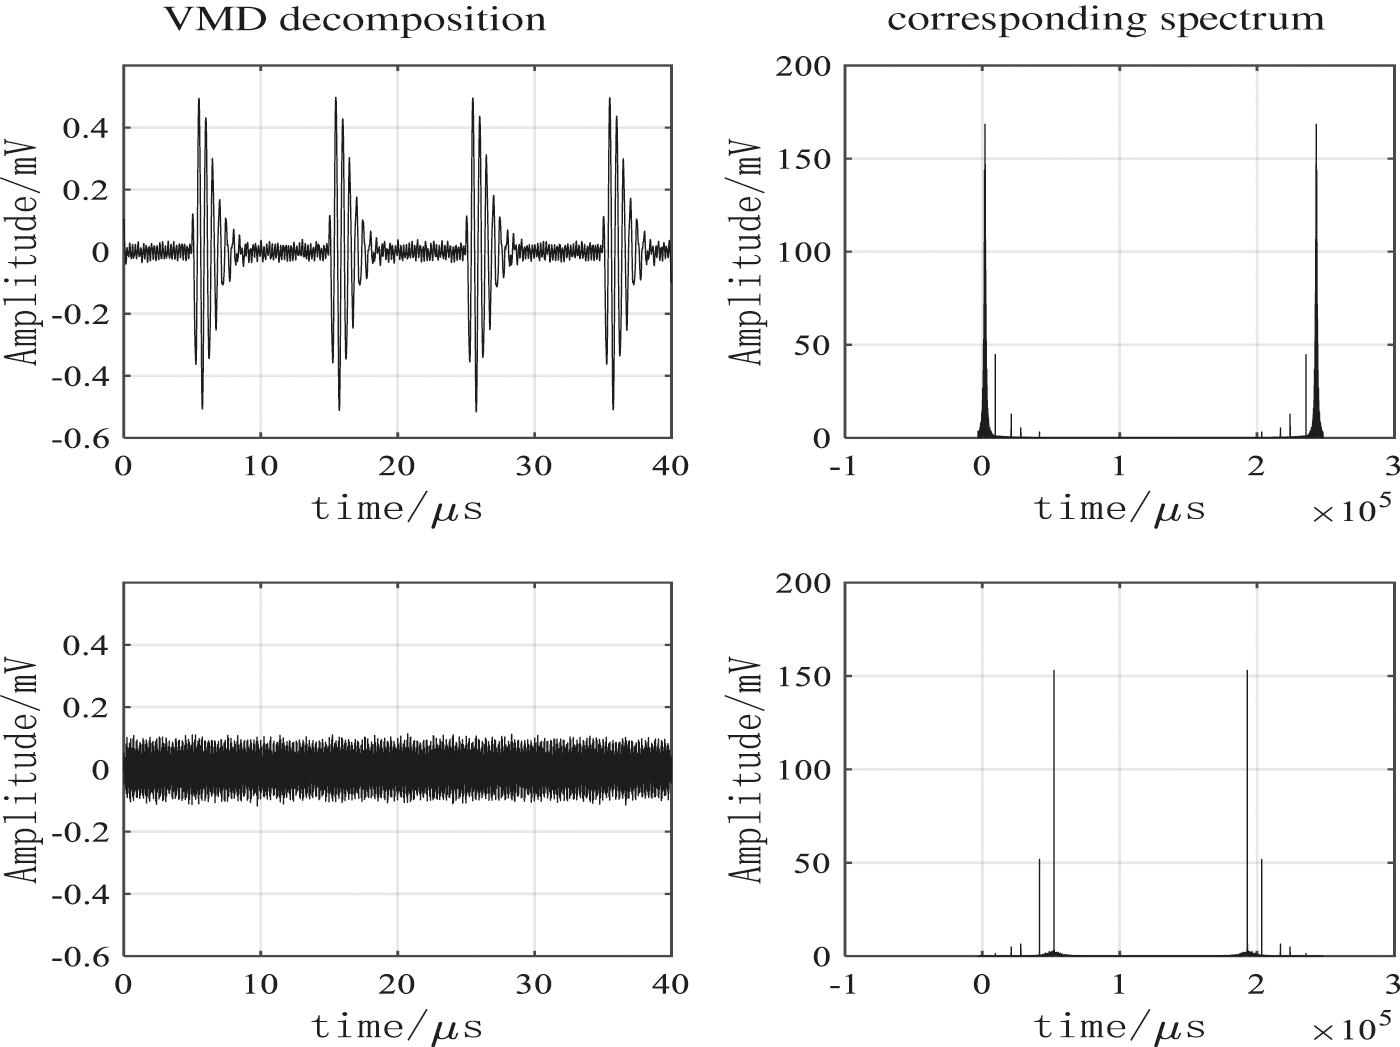
Figure 3: VMD decomposition result and its corresponding spectrum
If the value of K is too large, that is, the time of decomposition is too many, the instantaneous frequency of the modal component will appear very serious jump phenomenon. When K is appropriate, the instantaneous frequency change of the modal component is continuous and slow. Therefore, the instantaneous frequency mean is quantified. When the quotient of the absolute value of the slopes of two adjacent segments is greater than a threshold for the first time, and the instantaneous frequency mean shows a downward trend, the appropriate K can be judged. Because the change of this slope is very obvious, the threshold can be selected according to the actual situation, and the article is set to 2.5. According to the decomposition result, when K = 3, the quotient of the slopes of two adjacent segments is 10.753 > 2.5, so choose K is selected as 2.
According to the formula (18), the threshold could be calculated as 0.1441. Calculated through the formula (17), the cross-correlation coefficient between IMF1 and electricity stealing signal was 0.9810 and that between IMF2 and electricity stealing signal was 0.001, so IMF1 was the sensitive component. The denoising results through the VMD reconstruction were presented in Fig. 4. The wavelet decomposition number was selected as 4, soft threshold function was chosen as the threshold function, the wavelet basis function was ‘db8’, and the denoised signal obtained by the wavelet threshold processing of the reconstructed signal was as shown in Fig. 5, FFT denoising results and EMD denoising results are shown in Figs. 6 and 7.
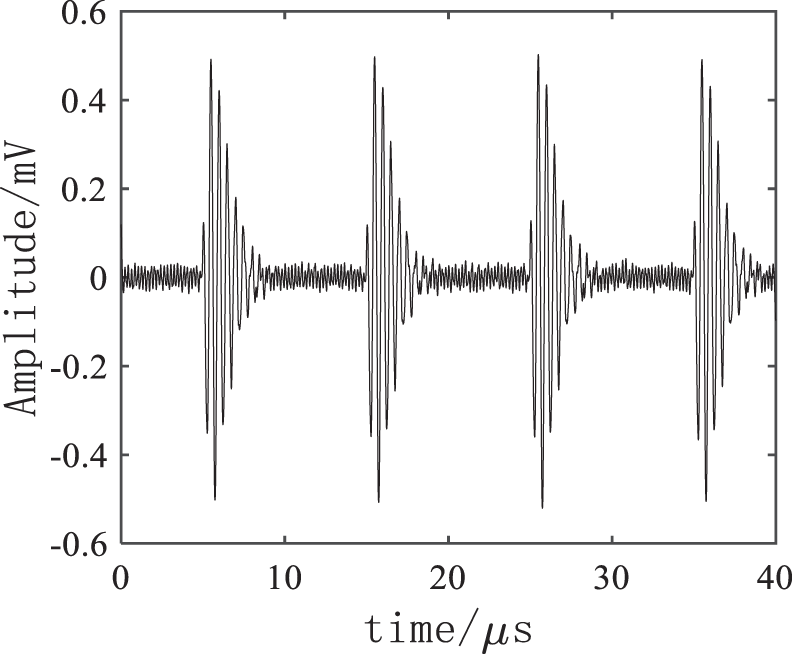
Figure 4: VMD denoising result
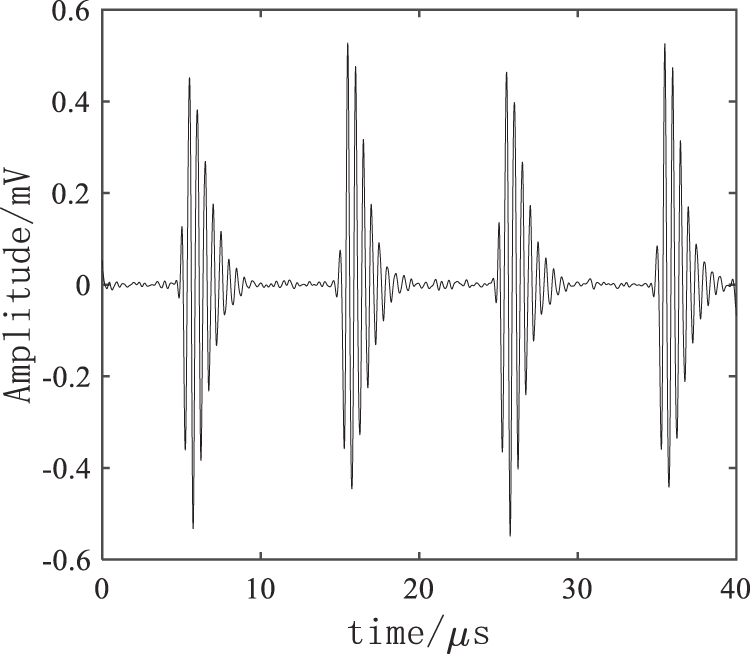
Figure 5: VMD + WTD denoising result
As shown in Figs. 4–7, the four denoising methods could effectively eliminate the noise, and the high-frequency electricity stealing signal was extracted for the discrimination. It could be known through a comparison that FFT method has relatively serious distortion, large noise still remains in the EMD, and the VMD denoising effect was further enhanced after the wavelet threshold was added, the residual noise was eliminated, thus improving the accuracy of electricity anti-stealing device to a greater extent.
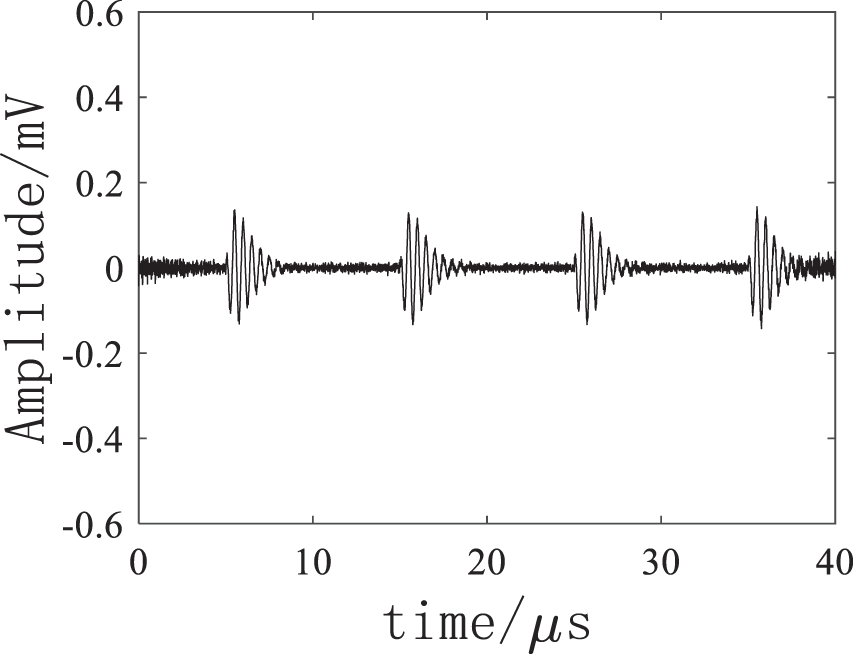
Figure 6: FFT denoising result
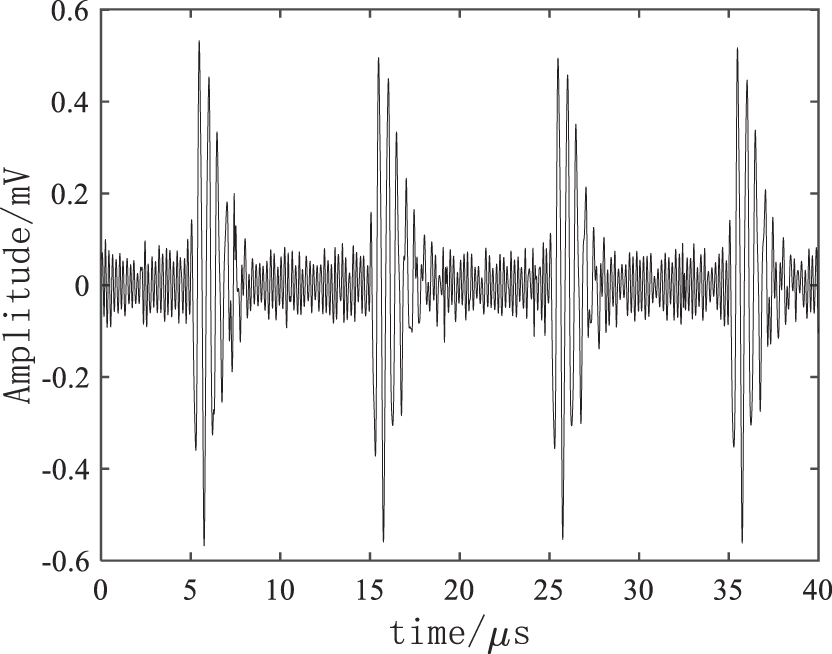
Figure 7: EMD denoising result
Three evaluation indexes—signal to noise ratio (SNR) [22], root-mean-square error (RMSE) [23] and cross-correlation coefficient aforementioned [24]—were introduced to better evaluate the proposed method, which was compared with the traditional VMD method. The results are listed in Table 1.

From the above table, both SNR and cross-correlation coefficient of the proposed method are the highest, with a smallest RMSE, noise suppression effect is better than the other three methods, and the signal characteristics are more complete.
In order to verify the effectiveness and applicability of the proposed electricity anti-stealing denoising method in reality, an electricity anti-stealing device detection system (Fig. 8) was established in the laboratory using electromagnet and electromagnetic transducer. First, electric signals with different frequencies were emitted by the control signal regulator, driving the electromagnet to generate a high-frequency electricity stealing electromagnetic field, and then a moderate noise was added to simulate the realistic electricity stealing environment. Second, the electromagnetic signal was transformed into electric signal by the electromagnetic transducer, and the noise-containing electricity stealing signal was acquired by the signal acquisition circuit, as shown in Fig. 9.
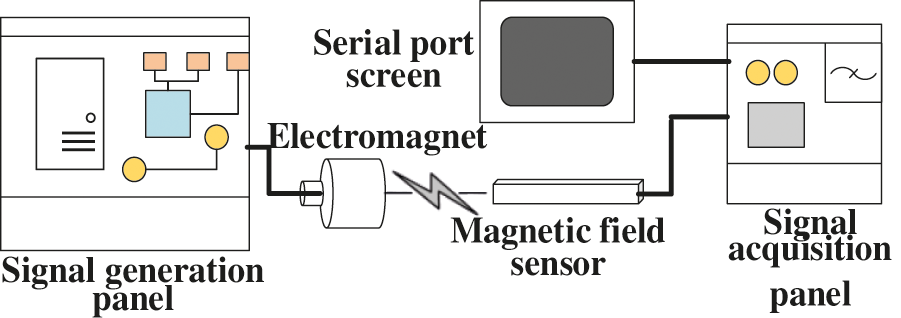
Figure 8: Experimental system
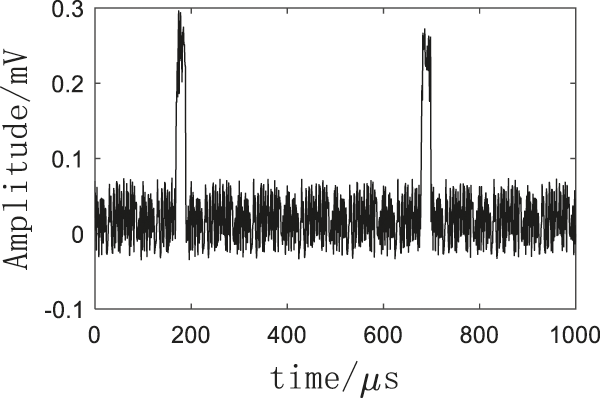
Figure 9: Experimental measurement signal
The noise-containing electricity stealing signal was denoised by the proposed method. First, the signal was decomposed via VMD under different K values (2∼10). From K = 2, 9 groups of VMD decomposition modes could be acquired with the increase in the K value, and the instantaneous frequency mean of each mode in the VMD decomposition mode group corresponding to each K value was solved, as shown in Fig. 10. It could be observed that the instantaneous frequency mean was obviously reduced under K = 3, at the same time, when K = 3, the absolute value of the quotient of the slopes of two adjacent segments is 6.677 > 2.5, so K = 2 should be selected as the decomposition mode number.
The VMD decomposition was performed under K = 2. The IMF components and their corresponding frequency spectra are as shown in Fig. 11. The cross-correlation coefficients of the two IMF components with the electricity stealing signal were 0.9095 and 0.0053, respectively, the threshold of cross-correlation coefficient was 0.1492, so IMF1 was the sensitive component as the VMD denoising result. The wavelet threshold processing of this component was implemented under the wavelet decomposition number of 6, the threshold function was soft threshold function, and the wavelet basis function was ‘db8’. The traditional VMD denoising results were shown in Fig. 12, the VMD + WTD denoising results were as shown in Fig. 13, FFT denoising results and EMD denoising results were shown in Figs. 14 and 15.
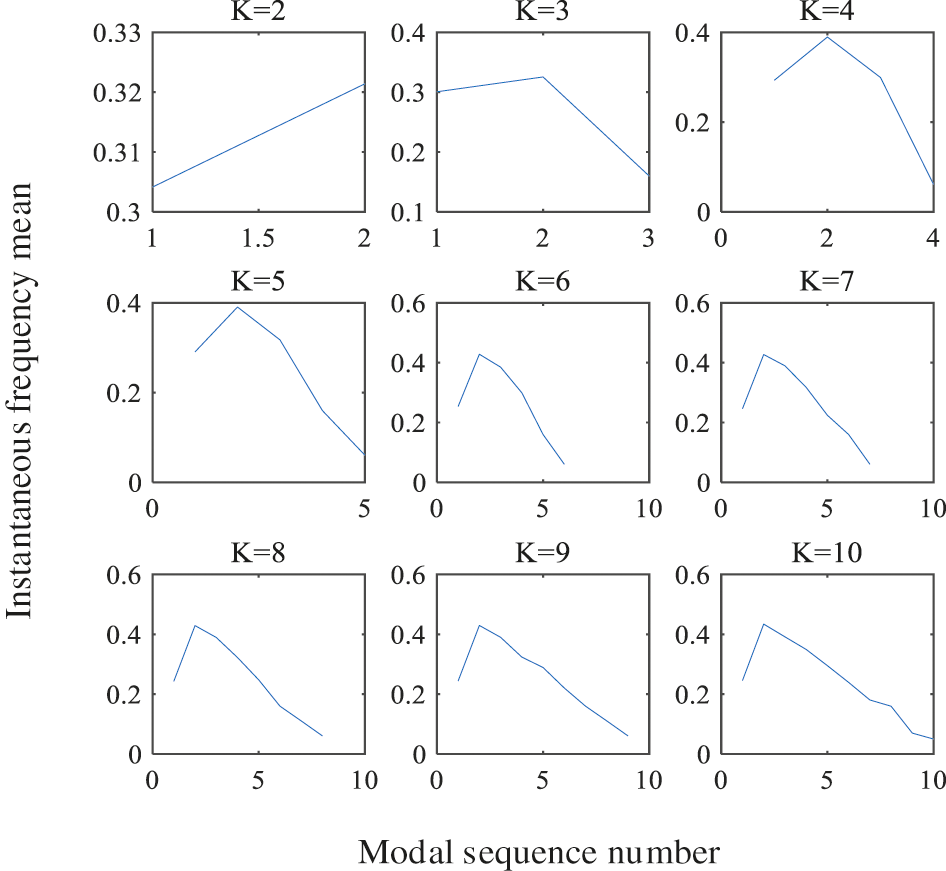
Figure 10: Variation diagram of experimental instantaneous mean frequency
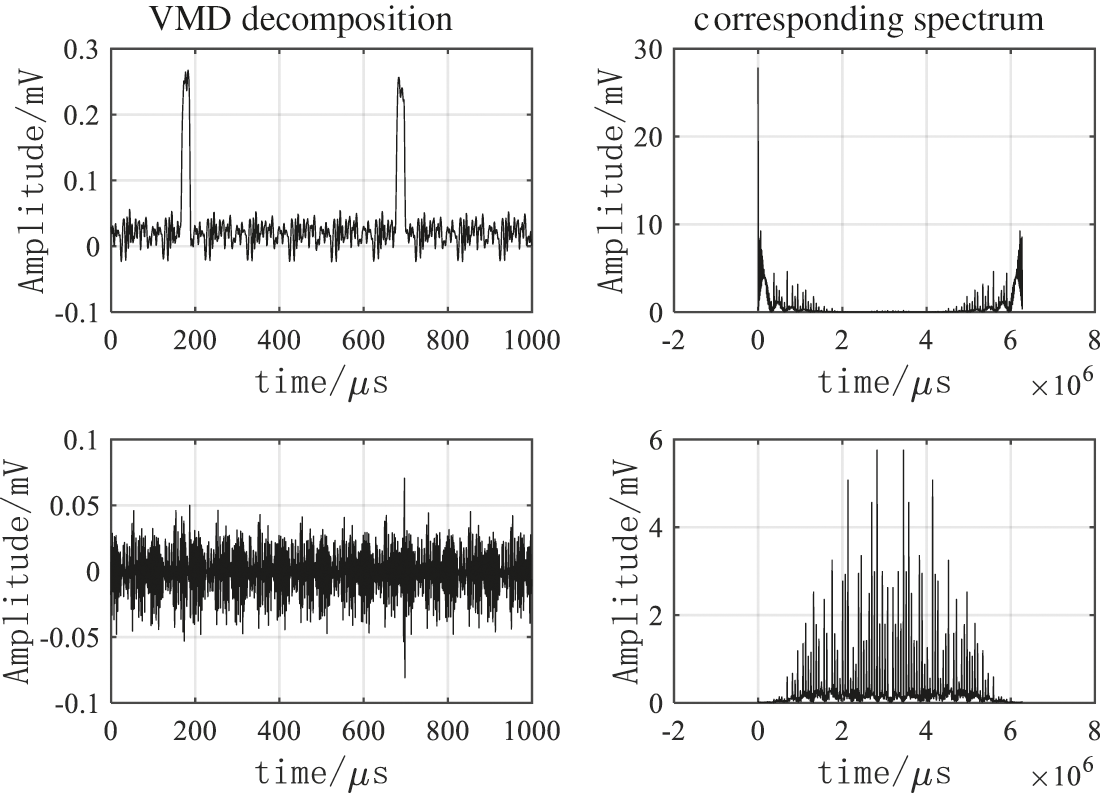
Figure 11: VMD decomposition result and its corresponding spectrum
As shown in Figs. 12–15, the denoising effect of is better than other three methods. It could eliminate the residual burrs, make the waveform smoother and no distortion, so that the electricity anti-stealing device would not be stuck in malfunction, effectively eliminate the noise while reserving relatively complete electricity stealing signals, and improve the accuracy of the electricity anti-stealing device in identifying the electricity stealing signal to a greater extent.
As shown in Table 2, the FFT threshold method and the EMD method have good SNR, but the RMSE is large, the cross-correlation coefficient is not high, and the waveform is distorted, the two methods effect is not good. Compared with the other three methods, the method in this paper has a higher SNR, a smaller RMSE, and the cross-correlation coefficient closer to 1. On the whole, the method in this paper has better noise suppression effect and better performance.
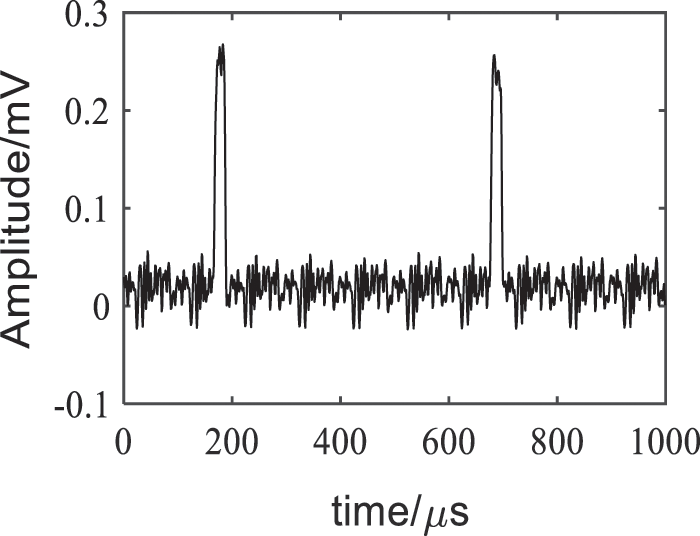
Figure 12: VMD denoising results
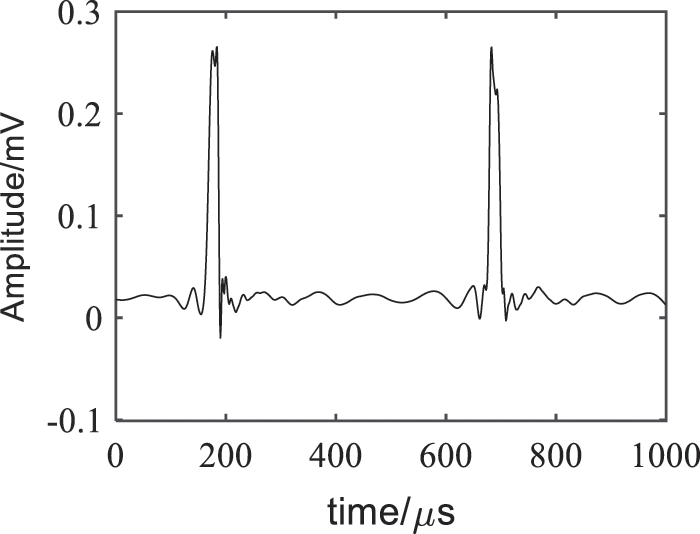
Figure 13: VMD + WTD denoising results
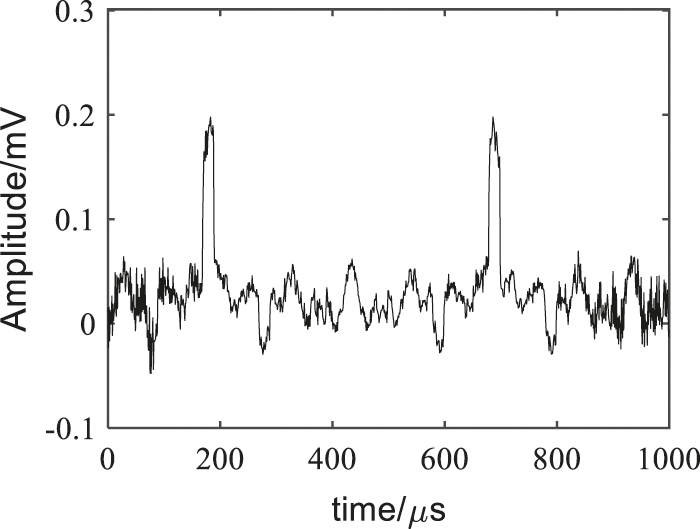
Figure 14: FFT denoising results
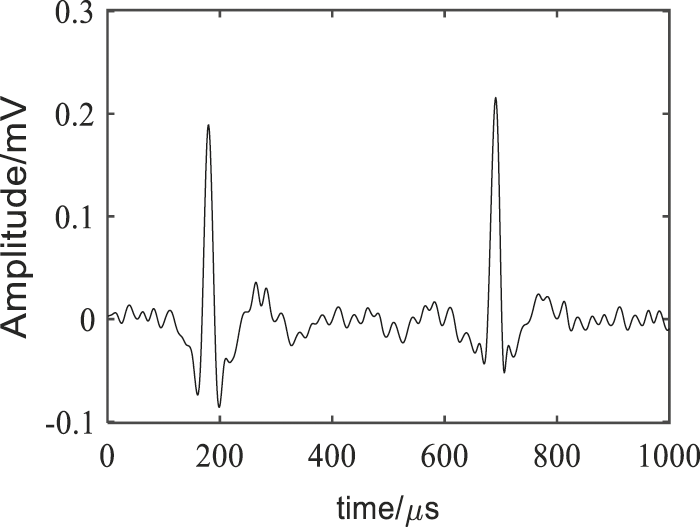
Figure 15: EMD denoising results

In this study, an electricity stealing signal denoising method that integrated the VMD with the wavelet threshold was applied to the anti-stealing device eliminate narrow-band periodic noise and white noise. The instantaneous frequency mean method, which does not need to solve the difference value between adjacent center frequencies, reduces the calculation error compared with the center frequency method. Moreover, it can realize the adaptive determination of K value. The VMD method is utilized to perform the adaptive filtering of white noise and separate the narrow-band periodic noise. The wavelet threshold method is combined to eliminate the residual noise, thus inhibiting the noise. Both simulation and experimental results show that compared with the traditional VMD method, FFT method and EMD method, the proposed method has higher SNR and correlation coefficient, smaller RMSE and well reserved features of electricity stealing signal. Furthermore, this method is able to effectively eliminate the noise in the electricity anti-stealing detection, extract the effective information in the electricity stealing signal, so as to improve the detection reliability.
Funding Statement: This research is funded by project supported by China Southern Power Grid Corporation, Grant No. GDKJXM20185800 and the National Natural Science Foundation of China, Grant No. 62073084.
Conflicts of Interest: The authors declare that they have no conflicts of interest to report regarding the present study.
1. Liu, J., Wang, Z., Xu, Q., Cai, Q., Huang, Q. (2015). Simulation analysis of electromagnetic interference on smart meters. Electrical Measurement & Instrumentation, 52(6), 16–22. [Google Scholar]
2. Lin, R., Yang, F., Gao, M., Wu, B., Zhao, Y. (2019). ADU-MTS: An abnormal user detection approach based on power load multi-step clustering with multiple time scales. Energies, 12, 3144. DOI 10.3390/en12163144. [Google Scholar] [CrossRef]
3. Liu, H., Li, Z., Li, Y. (2020). Noise reduction power stealing detection model based on self-balanced data set. Energies, 13, 1763. DOI 10.3390/en13071763. [Google Scholar] [CrossRef]
4. Zheng, Z., Yang, Y., Niu, X. (2018). Wide and deep convolutional neural networks for electricity-theft detection to secure smart grids. IEEE Transactions on Industrial Informatics, 14, 1707–1715. DOI 10.1109/TII.2017.2785963. [Google Scholar] [CrossRef]
5. Fu, J., Jie, Z., Sun, Z., Li, X., Chen, H. (2015). Detection system of magnetic field and electromagnetic interference for stealing and its detection device. Electrical Measurement & Instrumentation, 52(S1), 181–184. [Google Scholar]
6. Zhang, Z., Dai, Y., Li, C., Wang, P., Du, Y. (2016). Research on the influence of high voltage shock interference on smart meter. Electrical Measurement & Instrumentation, 53(13), 70–74. [Google Scholar]
7. Zhou, K., Li, M., Li, Y., Xie, M., Huang, Y. (2019). An improved denoising method for partial discharge signals contaminated by white noise based on adaptive short-time singular value decomposition. Energies, 12, 3465. DOI 10.3390/en12183465. [Google Scholar] [CrossRef]
8. Govindarajan, S., Subbaiah, J., Cavallini, A., Krithivasan, K., Jayakumar, J. (2019). Development of hankel-SVD hybrid technique for multiple noise removal from PD signature. IET Science, Measurement & Technology, 13(8), 1075–1084. DOI 10.1049/iet-smt.2018.5679. [Google Scholar] [CrossRef]
9. Rao, X., Zhou, K., Wang, X., Li, M., Huang, Y. et al. (2021). Suppression of narrow-band noise of partial discharge based on improved SVD algorithm. High Voltage Engineering, 47(2), 705–713. DOI 10.13336/j.10036520.hve.2-0200430008. [Google Scholar] [CrossRef]
10. Ling, Z., Wang, P., Wan, Y., Wang, Y., Cheng, F. et al. (2016). A combined wavelet transform algorithm used for de-noising magnetotellurics data in the strong human noise. Chinese Journal of Geophysics, 59(9), 3436–3447. [Google Scholar]
11. Liu, S., Zhang, L., Zhang, L. (2010). The study of electromagnetic interference measurement. Journal of Electronics & Information Technology, 32(5), 1229–1233. [Google Scholar]
12. Luo, X., Niu, H., Hu, R., Liu, F., Wu, J. (2013). A modified method of suppressing narrow-band interference using fast fourier transform power spectrum. Proceedings of the CSEE, 33(12), 167–175–200. DOI 10.13334/j.0258-8013.pcsee.2013.12.022. [Google Scholar] [CrossRef]
13. Fan, G., Liu, S., Liu, W., Wang, L. (2017). Suppression of the periodic narrow-band noise in discharge signal by FFT spectrum minimum entropy deconvolution filtering. High Voltage Engineering, 43(4), 1378–1385. DOI 10.13336/j.1003-6520.hve.20170328039. [Google Scholar] [CrossRef]
14. Huang, N. E., Shen, Z., Long, S. R., Wu, M. C., Shih, H. H. et al. (1998). The empirical mode decomposition and the hilbert spectrum for nonlinear and non-stationary time series analysis. Proceedings of the Royal Society A, 454(1971), 903–995. DOI 10.1098/rspa.1998.0193. [Google Scholar] [CrossRef]
15. Dragomiretskiy, K., Zosso, D. (2004). Variational mode decomposition. IEEE Transactions on Signal Processing Letters, 11(2), 112–114. DOI 10.1109/TSP.2013.2288675. [Google Scholar] [CrossRef]
16. Wang, Y., Liu, F., Jiang, Z., He, S., Mo, Q. (2017). Complex variational mode decomposition for signal processing applications. Mechanical Systems and Signal Processing, 86, 75–85. DOI 10.1016/j.ymssp.2016.09.032. [Google Scholar] [CrossRef]
17. Wang, H., Shang, C., Gao, R., Li, Z. (2017). An improvement of wavelet shrinkage denoising via wavelet coefficient transformation. Journal of Vibration and Shock, 86, 75–85. DOI 10.13465/j.cnki.jvs.2011.10.015. [Google Scholar] [CrossRef]
18. Zhao, L., Zhu, Y., Gao, Y., Chen, X., Guo, X. (2016). Research on denoising of transformer partial discharge based on variational mode decomposition and wavelet analysis. Electrical Measurement & Instrumentation, 53(11), 13–18. [Google Scholar]
19. Luo, X., Lu, W., You, Y., Hu, X. (2019). A method for ball mill vibration signal random noise suppression based on VMD and SVD. Noise and Vibration Control, 39(6), 169–175+216. [Google Scholar]
20. Wu, G., Wang, C., Bao, J., Chen, Y., Hu, Y. (2014). A wavelet threshold de-noising algorithm based on adaptive threshold function. Journal of Electronics & Information Technology, 36(6), 1340–1347. [Google Scholar]
21. Li, Y., Li, Y., Chen, X., Wei, J. (2018). Feature extraction of ship-radiated noise based on VMD and center frequency. Journal of Vibration and Shock, 37(23), 213–218+285. DOI 10.13465/j.cnki.jvs.2018.23.029. [Google Scholar] [CrossRef]
22. Cui, G., Zhang, C., Yang, L., Wang, J. (2019). An improved wavelet threshold denoising algorithm. Modern Electronic Technology, 42(19), 50–53+58. DOI 10.16652/j.issn.1004-373x.2019.19.012. [Google Scholar] [CrossRef]
23. Xu, L., Zhang, D., Zhou, J., He, Z., Fang, X. et al. (2020). A novel trenchless detection technology based on transient electromagnetic method for power poles. Energy Engineering, 117(1), 19–26. DOI 10.32604/EE.2020.010409. [Google Scholar] [CrossRef]
24. Zhao, C., Yang, Q. (2019). Signal denoising based on EMD and wavelet packet energy method. Journal of Beijing Information Science and Technology University, 34(1), 75–79. DOI 10.16508/j.cnki.11-5866/n.2019.01.014. [Google Scholar] [CrossRef]
 | This work is licensed under a Creative Commons Attribution 4.0 International License, which permits unrestricted use, distribution, and reproduction in any medium, provided the original work is properly cited. |