| Energy Engineering |
DOI: 10.32604/ee.2022.018886
ARTICLE
Influencing Factors of Total Factor Energy Efficiency in Bohai Rim Region Based on DEA-Tobit Model
1School of Economics, Qufu Normal University, Rizhao, 276826, China
2Shandong Water Conservancy Vocational College, Rizhao, 276826, China
3School of Economics and Management, Nanjing University of Aeronautics and Astronautics, Nanjing, 211006, China
4Management College, Ocean University of China, Qingdao, 266100, China
*Corresponding Author: Chuanhui Wang. Email: wangch2015@qfnu.edu.cn
Received: 23 August 2021; Accepted: 21 October 2021
Abstract: Bohai Rim region is an important economic development area and a large carbon emission area in China. It is of great significance to explore the total factor energy efficiency and its influencing factors for the low carbon transformation and high-quality development of the Bohai Rim region. Based on the total factor energy efficiency framework, the DDF-DEA model was used to calculate the total factor energy efficiency, and the internal and external differences of the total factor energy efficiency were further analyzed. The internal and external influencing factors were determined by ML index method and classical endogenous growth theory, and then the Tobit panel model was used to empirically analyze the action mechanism of all influencing factors of total factor energy efficiency in the Bohai Rim region. The results show that the pure technical efficiency, scale efficiency and technological progress among the internal influencing factors contribute to the improvement of energy efficiency in the Bohai Rim region. Industrial structure, industrial internal structure and ownership structure inhibit the improvement of energy efficiency. Energy consumption structure and energy endowment also have a negative impact on energy efficiency. Therefore, measures such as promoting technological progress, adjusting economic structure and optimizing energy structure will effectively improve total factor energy efficiency in the Bohai Rim region.
Keywords: Total factor energy efficiency; influencing factors; Bohai Rim region; DEA-Tobit model; ML index method
Energy has always been the focus of the international community. As for the reasons, on the one hand, it is because of the limitation and scarcity of energy; on the other hand, it is because energy is of great significance to the sustainable development of human society. According to the BP World Energy Outlook 2019, global energy demand is projected to grow by about a third by 2040, assuming that the evolution of government policies, technologies and social preferences remains the same. China’s extensive development mode restricts economic development and increases the pressure on China’s resources and environment. As an important way to effectively reduce energy consumption and greenhouse gas emissions, energy efficiency has been paid more and more attention. Therefore, under the severe ecological environment situation, it is of great significance to study the total factor energy efficiency and influencing factors in the Bohai Rim region, which can improve the high-quality economic development and ecological protection. Meanwhile, the study is of great significance for balancing the relationship between environment, resources and economy.
There is still some debate about the definition of energy efficiency. The current accepted definition is based on “Pareto efficiency”: that is, using as little energy as possible to produce the same number of services or efficient outputs. Single factor of energy efficiency method is one of the measurement methods. It has the advantages of being easy to understand, simple calculation and strong operability. But in reality, no output can be obtained from energy input alone. In order to make up for the shortcoming of single factor energy efficiency. Hu and Wang first proposed the total factor energy efficiency index, taking capital, labor and other important inputs and energy into consideration, and constructed a framework containing multiple inputs [1]. Zhou et al. proposed three DEA models based on linear programming to calculate total factor energy efficiency, which made up for the shortcomings of predecessors who regarded energy as a single input and did not consider the undesired output [2]. The total factor energy efficiency (TFEE) has been widely used because it can get more practical results.
Many scholars have been involved in the study of the influencing factors of energy efficiency. From the national level, Wang and Fan found that technological progress could effectively promote the improvement of China’s total factor energy efficiency by studying the total factor energy efficiency of 28 provinces and cities and the three regions of East, West and Centre [3]. Wang et al. decomposed the total factor productivity of all provinces in China and concluded that the improvement of productivity mainly depended on technological progress [4]. Zhang et al. found that the impacts of industrial structure on energy efficiency were not significant, while the impacts of technological level, energy consumption structure and economic development level on energy efficiency were relatively significant [5]. Ren [6] found that the industrial structure adjustment can increase GTFP, while the energy consumption structure optimization can improve GTFP. Yang et al. [7] studied the influencing factors of total factor energy efficiency in 17 provinces along One Belt and One Road, and found that changes in pure efficiency, scale efficiency, economic structure and other factors would have a positive effect on TFEE. From the perspective of ecological economics, Wang et al. [8] found that the trade between China and BRI participating economies would have an impact on the ecological total factor energy efficiency (ETFE) of China’s logistics industry. Wu et al. [9] explored the relationship between environmental regulation and GTFE in China by using panel data from 30 provinces in China from 2005 to 2016. From the industry perspective, Xiong et al. [10] studied the relationship between industrial structure and China’s industrial energy efficiency with the help of SBM model, and found that industrial structure efficiency was the decisive factor for industrial energy efficiency in various provinces. Zhang et al. [11] studied the energy efficiency of the aviation industry in China and the United States, and concluded that technological progress would promote energy efficiency. Cheng et al. [12] calculated the total energy efficiency (TFEE) of prefecture-level cities in the three northeastern provinces based on the relaxation measurement (SBM) model, and analyzed the difference between the two efficiency. In addition, some scholars also measured the industrial structure by the proportion of the total output value (added value) of the secondary industry in GDP, and explored its effect on the improvement of total factor energy efficiency. Ding et al. [13] believed that the proportion of electricity consumption is included in the energy consumption structure, and improving the use of clean energy will have a positive impact on energy efficiency. In addition, some scholars try to use models to do further research on energy efficiency. Gumerman et al. [14] attempted to develop a realistic energy efficiency supply curve and to improve on the current energy efficiency modeling. Lv et al. [15] used panel data of 30 Provinces in China from 1997 to 2016 to discuss the impact of urbanization on different types of energy efficiency and solve the perplexities of energy efficiency measurement. Zhong et al. [16] estimated the energy economic efficiency of cities in the Yangtze River urban agglomeration by using the data from 2008 to 2017 and using the SLACK model (SBM). Liang et al. [17] used ultra-efficient data envelopment analysis and Tobit model to evaluate energy efficiency and regional differences in 30 Chinese provinces from 2006 to 2018. Liu et al. [18] used the DEA-BCC model to calculate China’s inter-provincial energy efficiency from 2006 to 2016, analyze regional differences, and analyze the influencing factors of energy efficiency by using the panel data model. Zhang et al. [19] proposed a metric method of energy efficiency inequality based on Shephard energy distance function and “double” stochastic element frontier and explored whether different city grouping criteria affect energy efficiency based on 284 cities in China.
Through reading and combing the literature, it is found that the most widely used energy efficiency is total factor energy efficiency. This definition is more in line with the actual situation, and the conclusions obtained are more reliable. In terms of factors affecting energy efficiency, there is still a lack of convincing power in the selection of factors and objectivity. As Wei et al. [20] pointed out, using theories or micro-models to derive influencing factors can avoid the phenomenon of “explaining variables flying in the sky”, and it is also the premise and basis for empirical analysis. Therefore, how to combine theories and models to determine the influencing factors is something that needs to be improved in the future research on energy efficiency. Therefore, this paper attempts to determine the influencing factors from two aspects of theory and model, and divides them into internal and external influencing factors, in order to better study the total factor energy efficiency in the Bohai Rim region under environmental constraints.
Fare et al. [21] first proposed environmental production technology:
2.2 Mathematical Analysis of Environmental Constraints
As a classical endogenous growth model, Romer model divides the whole economy into three parts, namely research and development, intermediate product production and consumer product production. In order to introduce resources and environment into the production function, He et al. [22] improved the model and defined the production function as:
In Eq. (3), Z is the pollution intensity which is used to measure the degree of uncleanness of existing technologies. When
Several hypothesis conditions need to be set before the model analysis: first, it is to satisfy the form of Coggenglass production function; Second, pollution emission quota (Q) is taken as the control variable of environmental constraint. Third, it is assumed that expected output and unexpected output are positively correlated; fourth, it is to divide the capital into purchase capital (assume the share coefficient is
Based on the hypothesis 4, Eq. (4) can be used to reflect the flow of capital [23].
Based on hypothesis 1 and hypothesis 4, the technological increment of enterprise for pollution control in period t is expressed as Eq. (5), and the expected output in period t is expressed as Eq. (6):
Among them,
Based on the hypothesis 3, pollutant discharge (non-expected output) is set as a linear function of expected output, so the actual total non-expected output during period T is that the total emissions minus the governance amount, which is shown in Eq. (7):
Among them,
2.2.3 Model Construction and Analysis
The expected output price of the enterprise is set as
Based on the hypothesis 2, the investment strategy for the enterprise to pursue profit maximization is constructed, as shown in Eq. (9). At the same time, with the help of Lagrangian function, the optimal coefficients under the two simplified models are obtained in Eq. (10):
After removing green technology, pollutant per unit output is fixed as
With the increase of capital input elasticity of energy factors or green technology elasticity, the impact on enterprise output is also greater. This also shows that the stronger the environmental constraint, the more capital investment in pollution control will be, and the corresponding capital investment in energy will be reduced.
2.3 Total Factor Energy Efficiency Measurement
Bohai Rim region includes Beijing, Tianjin, Hebei, Shanxi, Inner Mongolia, Liaoning and Shandong. Based on the per capita GDP level of them, Beijing and Tianjin are divided into economic development core areas. Inner Mongolia, Shandong and Liaoning are divided into economic development potential areas. Hebei and Shanxi are divided into economically underdeveloped areas. Therefore, each region is regarded as a decision-making unit, so as to calculate and compare the differences of total factor energy efficiency between the interior and exterior of the Bohai Rim region.
2.3.1 Determination of Indicators
In terms of the selection of input indicators, this paper continues the practice of most scholars and takes energy indicators, capital stock indicators and labor force indicators as input indicators in the total factor energy efficiency framework. Among them, there are some disputes about whether labor quantity or human capital should be used to measure labor force index. Since the data of per capital education level in China is not available, and human capital will be transformed into material capital in the production process, the quantity of labor force is selected to represent the input of labor force index in this paper. The data is mainly from China Statistical Yearbook and statistical Yearbook of provinces and cities and the Compilation of Statistical Data of 60 Years of New China.
Energy input index: This paper selects the energy consumption of each province as the energy input index, whose unit is ten thousand tons of standard coal.
Capital stock input index: Since the data of capital stock is not directly given in the relevant statistical data, the “perpetual calculation method” was used to calculate the capital stock. The formula is as follows:
where, and respectively represent the capital stock of the region i in year t and t–1,
Labor input indicators: the labor time and labor input can’t directly access to the data quality of the labor force. Therefore, the average number of people employed at the beginning and end of the year in various provinces and cities is used to represent their labor input of the year. Number of employees in that year equals to (Number of employees at the end of the year+ Number of employees at the end of last year).
In terms of the determination of output indicators, this paper, from the perspectives of economy and environment, continues the previous practice and defines the output that conforms to economic development as expected output, while the output that has a negative impact on the environment is defined as unexpected output.
Expected output: Considering that energy input will bring economic growth, the total regional GDP of each province is selected as the expected output. The GDP data from 2000 to 2019 will be converted into the constant price based on the year 2000 according to the current price and the constant price index, which will serve as the final accounting data.
Undesired outputs: By definition, undesired outputs are pollutants produced in the production process that cannot be measured in terms of cost. Because the process of energy use is the most likely to cause air pollution, industrial waste gas emissions are more in line with our research requirements. However, since the statistical yearbook of all provinces and cities after 2011 no longer provides indicators of industrial waste gas emissions, and considering that 90% of SO2 in the air comes from fuel combustion, SO2 emissions are used to refer to industrial waste gas emissions.
2.3.2 Determination of Calculation Method
As for the calculation of total factor energy efficiency, considering that DDF model can be specially used to deal with pollutants and can realize the expansion of expected output while the contraction of unexpected output, this model is selected to calculate total factor energy efficiency in Bohai Rim region. In order to incorporate environmental factors into the constructed total-factor energy efficiency framework, it is necessary to set up an environmental technology set. Assuming that there are k DMUs, with the help of n kinds of input elements
In Eq. (12),
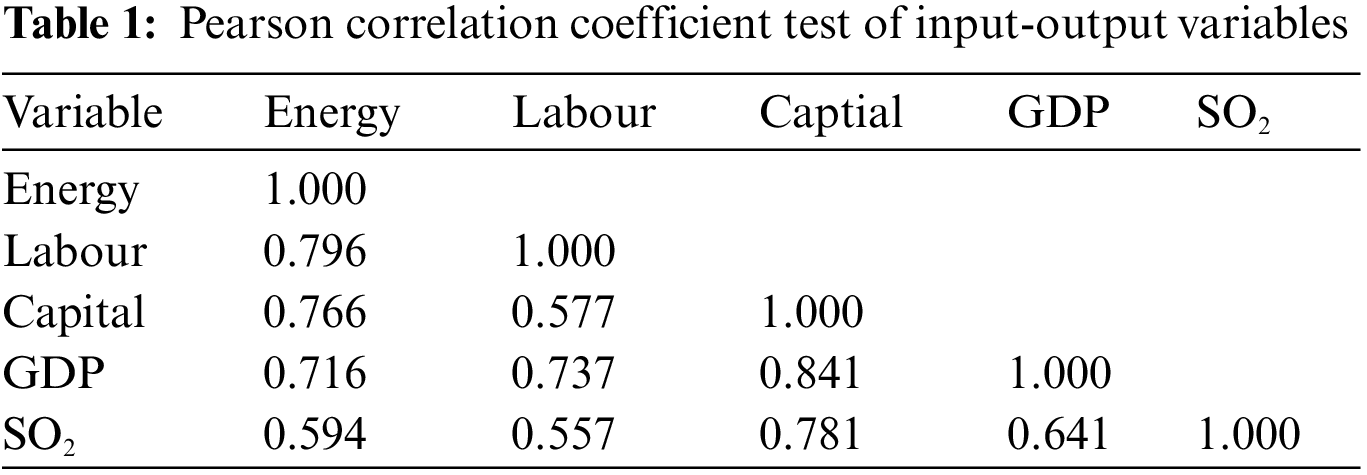
When DEA method is used to measure efficiency, the model constructed should meet the principle of “isotensivity”, that is, when the input of decision-making unit increases, the output should also increase correspondingly. In order to verify whether the input-output variables meet the property of “isomorphism”, Pearson correlation analysis was used to verify the results, as shown in Table 1.
As can be seen from Table 1, significant positive correlation exists between model variables at the significance level of 5%, which meets the isotonic requirement of DEA modeling. There is a significant positive correlation between energy consumption and expected and unexpected output, and the Pearson correlation coefficient corresponding to GDP and SO2 are 0.716 and 0.594, respectively. Therefore, it is reasonable to build a DEA energy efficiency measure model based on the above variables, and it also ensures the reliability and credibility of the research results.
2.3.3 Build Models and Variable Handling
Based on the influencing factors identified above, the Tobit model is constructed to conduct dynamic analysis on the changes of total factor energy efficiency in the Bohai Rim region. The model is constructed as follows:
Among them, i and t correspond to data of different provinces (decision n making units) and different years respectively.
3.1 Calculation of TFEE in Bohai Rim Region under Environmental Constraints
According to the input and output indicators and the above established model, the total factor energy efficiency of the Bohai Rim region is calculated, as shown in Table 2.
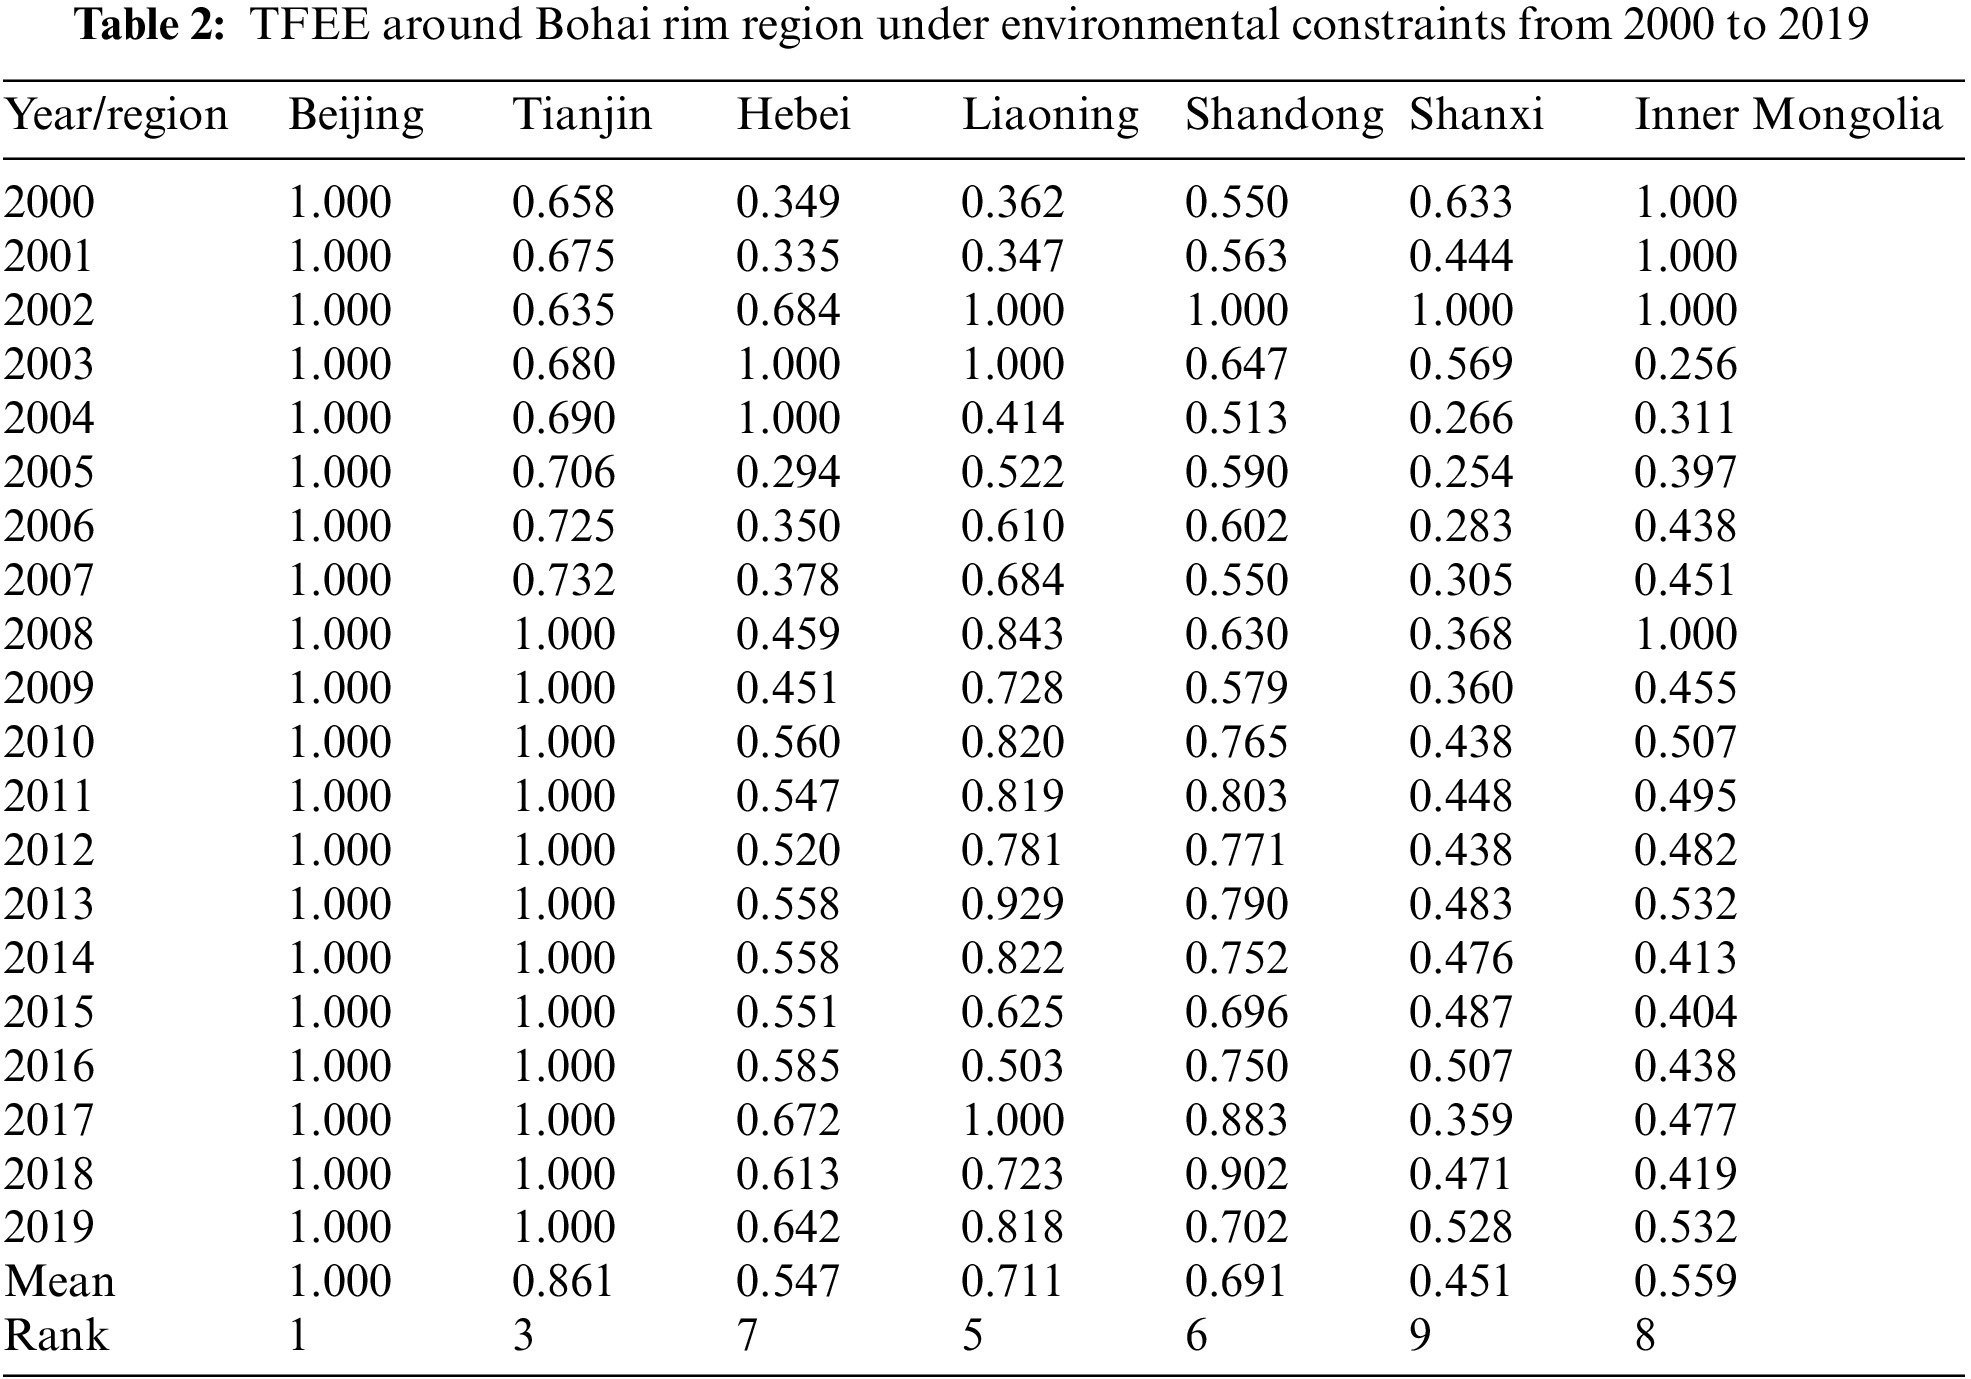
Taking into account environmental factors, the total factor energy efficiency of Guangdong province decreased in 2017 and 2018 compared with previous years, resulting in two provinces in the forefront from three. In terms of distribution, the regions with high energy efficiency include Guangdong Province, Shanghai, Beijing and Tianjin, with an average of 0.8~1, while the energy efficiency of Shanxi Province and Inner Mongolia is far lower than other regions, with an average of only 0.4~0.6. From the change of total factor energy efficiency trends, Tianjin from 2000 to 2019 the total factor of energy efficiency in the trend of increasing year by year, and the change range of Hebei, Liaoning, Shanxi and Inner Mongolia is larger, the highest value of energy efficiency is 1, a minimum of only 0.2~0.3, which was in Shandong Province and Zhejiang Province, the value of energy efficiency, average around small fluctuations.
Analysis the reason why there are differences in energy efficiency of provinces and cities, mainly has the following several aspects: the capital city of Beijing, in China not only has a good geographical advantage, is also China’s political, economic and cultural center, the tertiary industry accounted for the high, manufacturing level is high, the reasonable industrial structure, economic development is not overly dependent on the industrial sector. And there are many high-level and high-level scientific research colleges and institutes, which provide abundant talent supply and technical support for economic development. Therefore, Beijing is the region with the highest total factor energy efficiency in the whole Bohai Rim region. Tianjin is adjacent to Beijing. On the one hand, it has great potential for development, and on the other hand, it is greatly driven by the radiation of Beijing, so its energy efficiency is also at a high level. Shanxi and Inner Mongolia are the provinces with low energy efficiency in Bohai Rim region. As the heavy industry base and coal energy base in China, Shanxi Province has a low economic benefit due to its resource-oriented development mode and coal-oriented economic growth mode. Raw coal accounts for the highest proportion in primary energy consumption, and secondary industry accounts for significantly higher proportion than other industries among the three major industries. Unreasonable energy structure and industrial structure also restrict economic development and energy efficiency improvement. Human resources and technology, which are key to improving energy efficiency, lag far behind other regions. On the one hand, the low energy efficiency of Inner Mongolia is influenced by “one coal dominates” and irrational energy consumption structure; on the other hand, it is also caused by extensive economic development mode.
As can be seen from Fig. 1, the total factor energy efficiency of the core area, potential area and lag area presents a certain stratification trend. In most years, the energy efficiency of the core area is higher than that of potential area and lag area, but the total factor energy efficiency of potential area is slightly lower than that of lag area before 2010. From the efficiency value of each region, the total factor energy efficiency of the core region considering environmental factors remains between 0.8 and 1. Efficiency values in potential areas vary greatly, with some years lower than 0.7 and some years as high as 0.95. However, the energy efficiency in the lag zone showed a trend of slight fluctuation. Therefore, in order to realize the overall improvement of energy efficiency in the Bohai Rim region in the future, it needs to rely on the pulling effect of potential area and lag area, especially the lag area of economic development, which has the largest space for energy efficiency improvement.
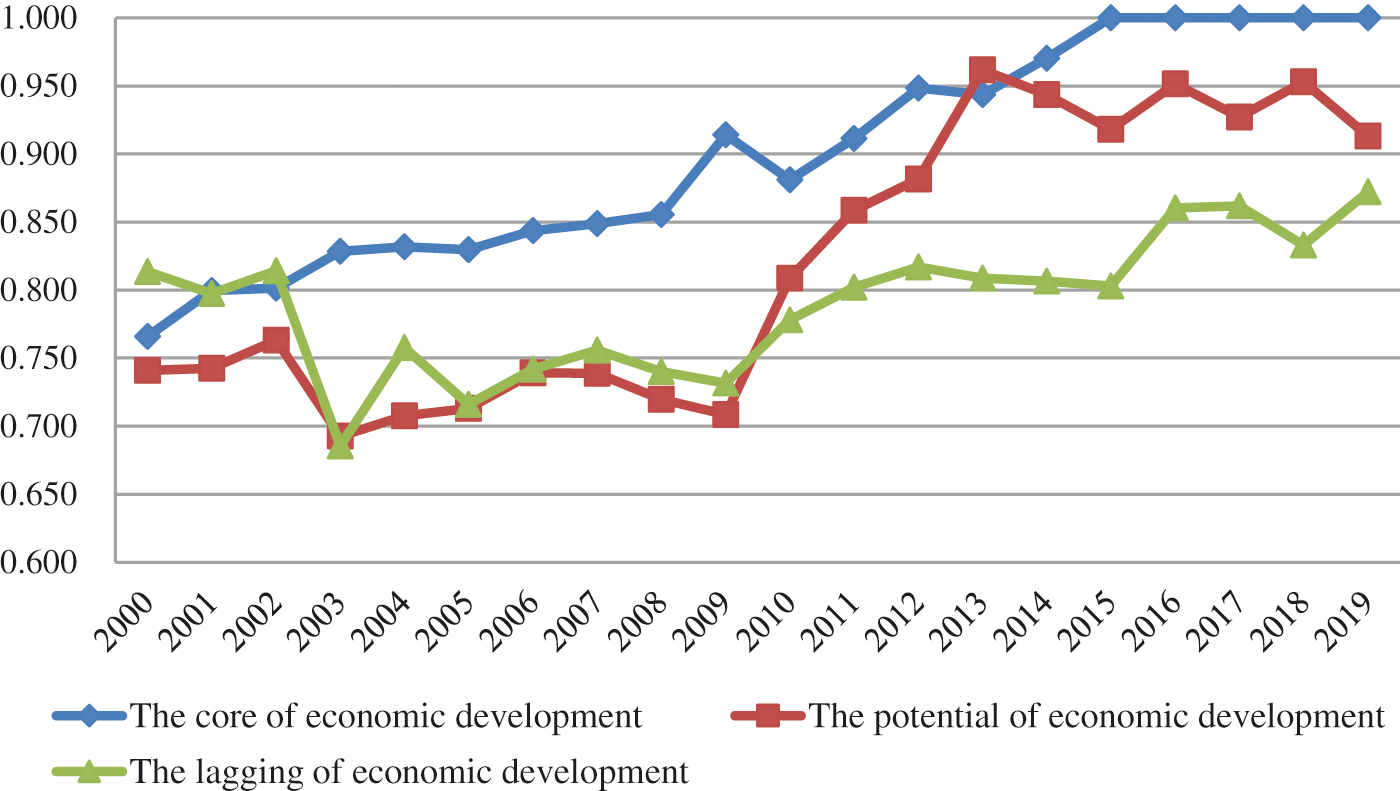
Figure 1: TFEE under environmental constraints in three major economic development zones
3.2 Empirical Analysis of the Influencing Factors of TFEE in Bohai Rim Region
3.2.1 Determination of Internal Influencing Factors
Based on the theoretical analysis of total factor energy efficiency mentioned above, the internal influencing factors of total factor energy efficiency in the Bohai Rim region are obtained in Table 3.
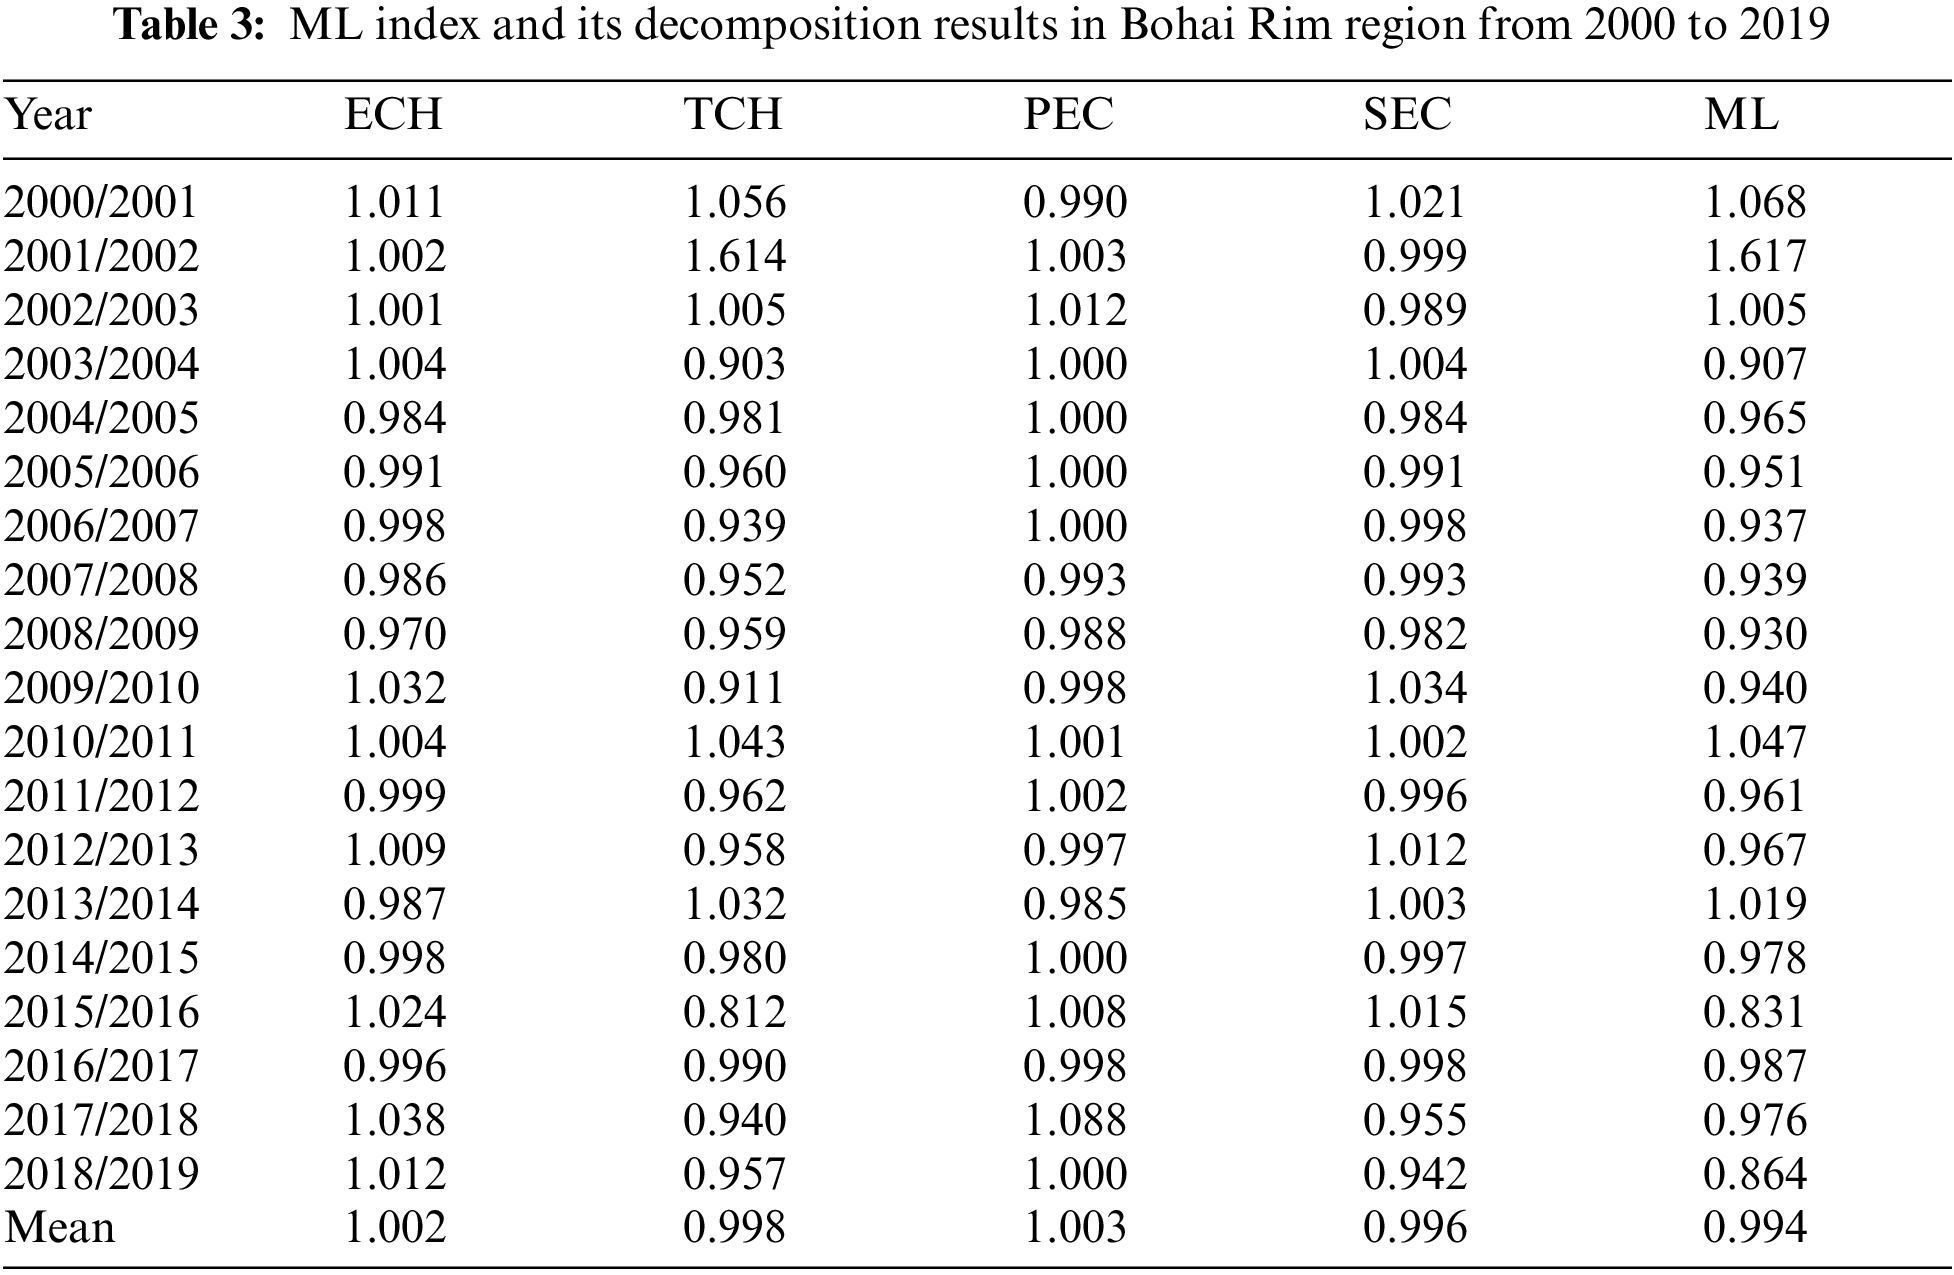
As can be seen from Table 3, the average annual total factor productivity of the Bohai Rim region decreased by 0.6% from 2000 to 2019, in which the technological progress index increased by 0.2% on average, the pure technical efficiency index of the technical efficiency index increased by 0.3%, and the scale efficiency index decreased by 0.4%. Overall, the total factor productivity in the Bohai Rim region improved, but the overall total factor productivity increased slowly due to the decline of productivity in some years, for example, from 2015 to 2016, when productivity decreased by nearly 17%. In addition, technological progress plays an important role in the improvement of productivity, and further improvement of technological efficiency will significantly improve the total factor productivity in the Bohai Rim region.
3.2.2 Determination of External Influencing Factors
If a single variable or multiple variables could be simply introduced in the determination of external influencing factors, some variables may be impacted due to the influence of environmental factors, thus leading to the deviation of the conclusion. The action mechanism diagram of the external influencing factors of total factor energy efficiency in the Bohai Rim region is obtained. In Fig. 2, external influencing factors are mainly divided into two categories, i.e., economic structure and energy structure, among which economic structure includes industrial structure, industrial internal structure and ownership structure. The energy structure mainly refers to the energy consumption structure and energy endowment. The selection of indicators of influencing factors is described.
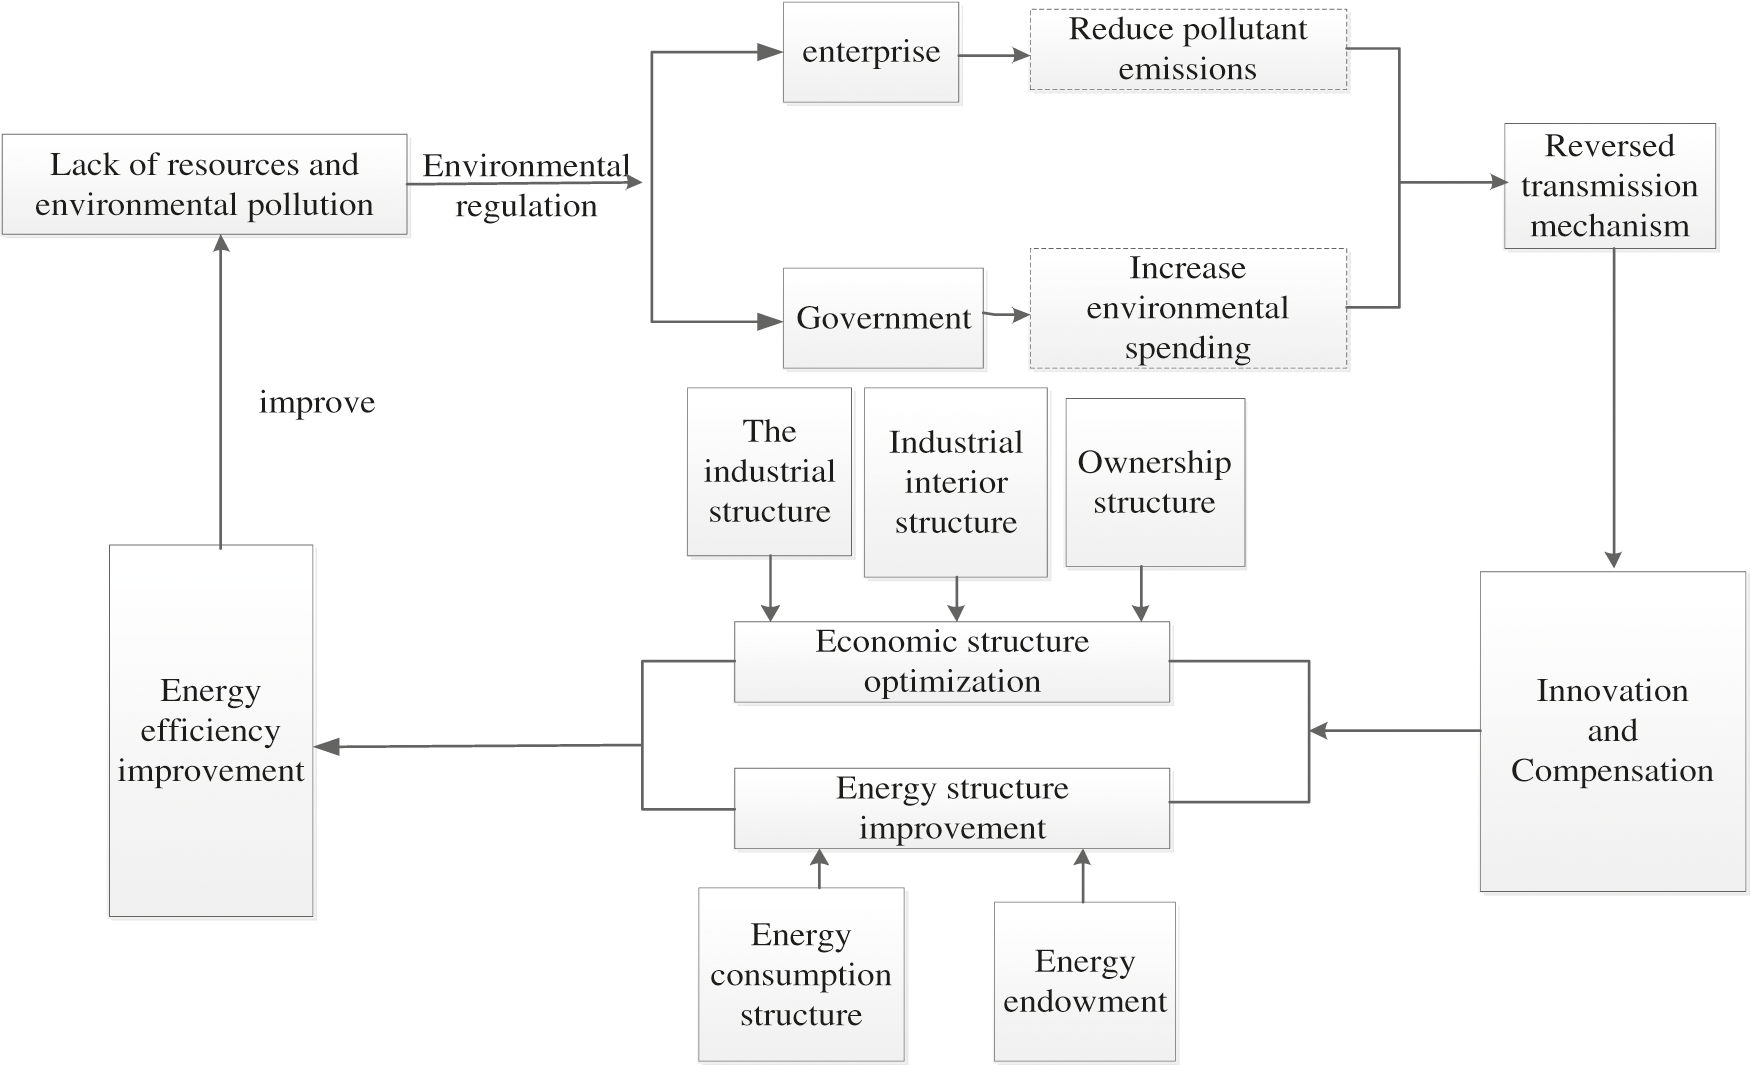
Figure 2: External influence mechanism of TFEE under environmental constraint
3.2.3 Influencing Factors of Total Factor Energy Efficiency
Considering that the total factor energy efficiency values under environmental constraints calculated in this paper range from 0 to 1, it will lead to errors and inconsistencies in the estimated results of ordinary least square method (OLS). Therefore, in order to avoid errors caused by OLS estimation, Tobit model, a limited dependent variable model, is adopted in this paper to carry out regression estimation.
3.3 Regression Analysis of Influence Factors of Energy Efficiency
In order to further verify the reliability of the results, panel unit root test was used to verify the data stationarity. Since there are many methods of stability verification, this paper uses Chen Qiang’s method for reference. Since the Bohai Rim region contains five provinces and two cities, and the research period is from 2000 to 2019, the cross-section dimension n = 7 and time dimension T = 20 of the data meets the
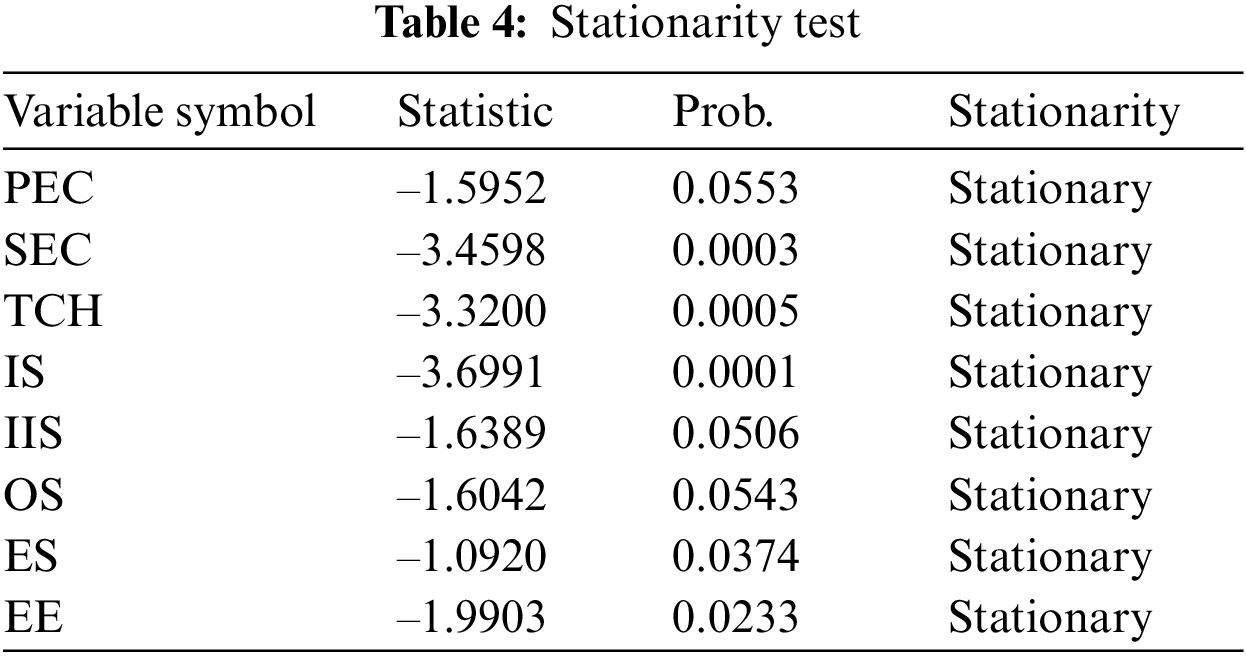
As can be seen from Table 4, all explanatory variables involved in the empirical analysis reject the null hypothesis at the significance level of 10%, that is, they pass the stationarity test.
Considering that panel model was selected in this paper to study the problem, the individual heterogeneity was tested by means of LR test. The test results of LR reject “
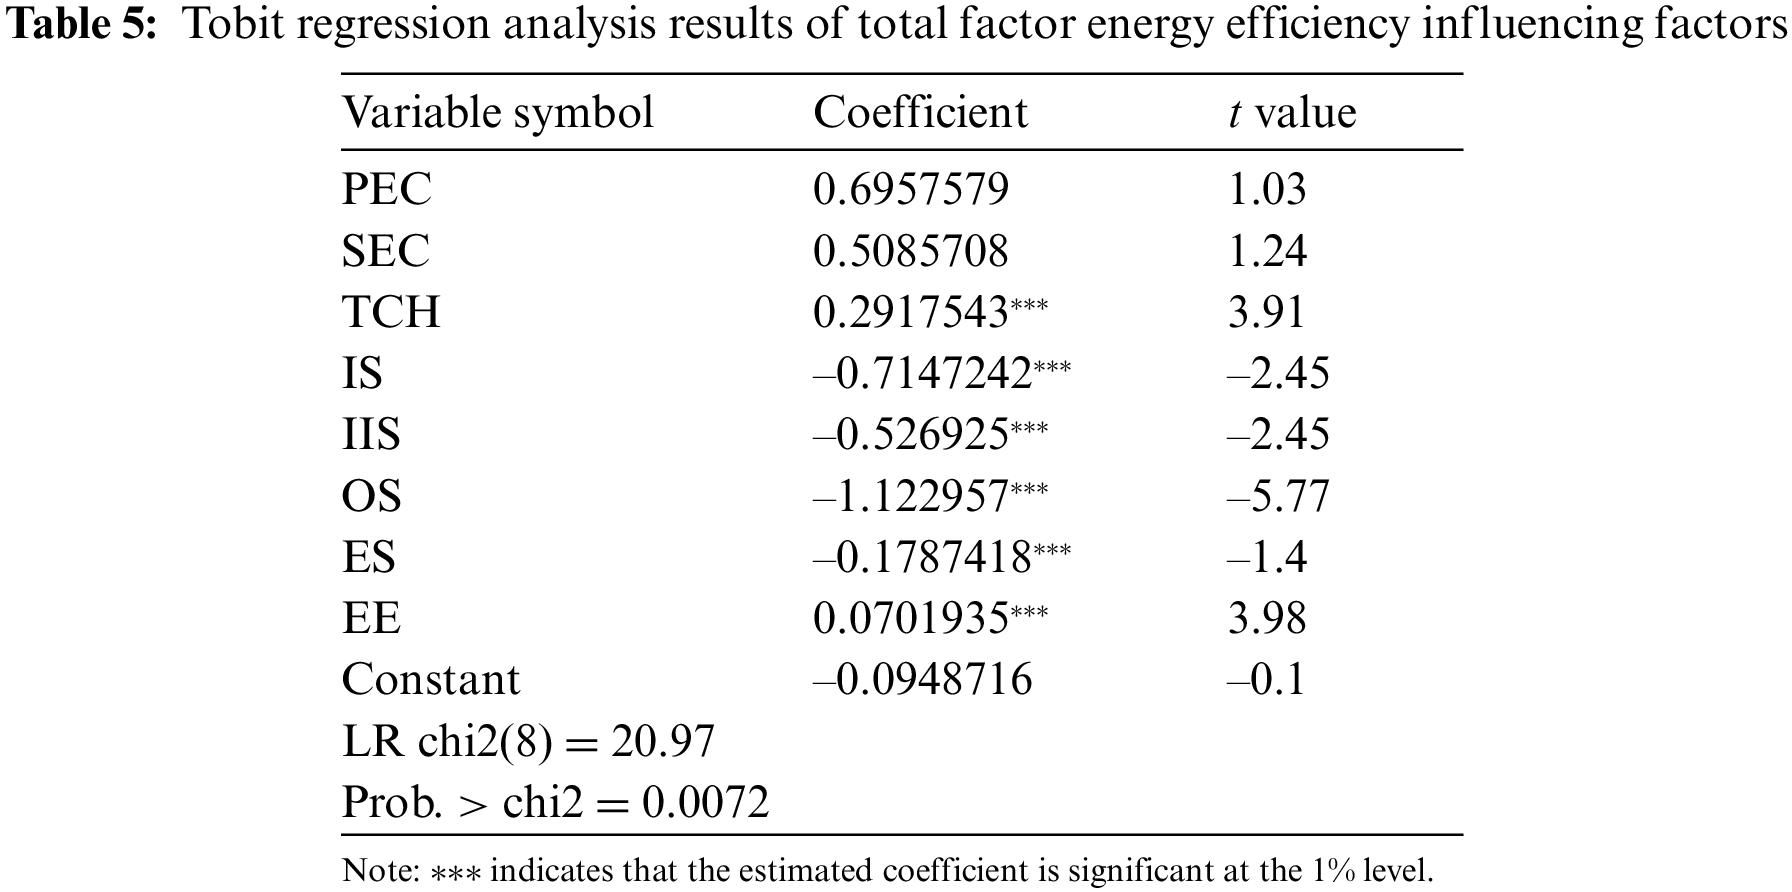
From the perspective of internal factors, pure technical efficiency, scale efficiency and technological progress all contribute to the improvement of total factor energy efficiency, but there is an obvious difference in the degree of effect. Because pure technical efficiency and scale efficiency have little effect on improving, they are not significant in the model. This is consistent with Wang et al. [4] that pure technical efficiency has little effect on the improvement of technical efficiency, and makes it a shackle to the improvement of energy efficiency. On the contrary, technological progress has great significance for the improvement of total factor energy efficiency. When the significance level of 1% passes the test, the total factor energy efficiency will increase by 0.29 percentage points for every 1% increase in technological progress. Due to the “rebound effect”, technological progress reduces energy consumption to a certain extent, but also promotes economic growth and increases energy demand, thus reducing the impact of technological progress on energy efficiency.
The external factors are analyzed from two aspects: economic structure and energy structure.
The industrial structure, industrial internal structure and ownership structure in economic structure all have negative effects on TFP, which is consistent with the researches of most scholars. In addition, it can also be seen that economic development plays a significant role in total factor energy efficiency. As the industrial structure, internal industrial structure, and ownership structure increase by 1%, total factor energy efficiency will drop by 0.71%, 0.52%, and 1.12%. This also shows that there are some problems in the industrial structure of the Bohai Rim region, among which the situation of “high energy consumption, high pollution and high emissions” in the secondary industry is still significant. Heavy industry occupies a high proportion, and the current situation that economic development is too dependent on heavy industry also hinders the improvement of energy efficiency. Since the property right system affects the incentive mechanism to some extent, it is generally believed that state-owned enterprises have problems of poor operating effect and low operating efficiency. Therefore, the improvement of ownership structure will lead to the decline of total factor energy efficiency, which is consistent with the research conclusion of Yuan et al. [26].
It can be seen from the results in Table 5 that the regression coefficient of energy consumption structure is negative, indicating that the higher the proportion of coal consumption in energy consumption, the negative influence will be exerted on the improvement of total factor energy efficiency. This conclusion is also confirmed in the previous paragraph. Provinces with large raw coal consumption, such as Shanxi, Hebei and Inner Mongolia, have low total factor energy efficiency. As for the relationship between energy endowment and total factor energy efficiency, the academic circle roughly has the following two ideas. Considering that the regression coefficient of energy endowment selected in this paper is positive, it means that the structural effect of energy endowment in the Bohai Rim region exceeds the technological effect, which is conducive to industrial agglomeration and thus forms economies of scale. Therefore, the more obvious the energy endowment advantage of the region is, the higher its energy efficiency will be.
3.4 Correlation Model Test of Influencing Factor Analysis
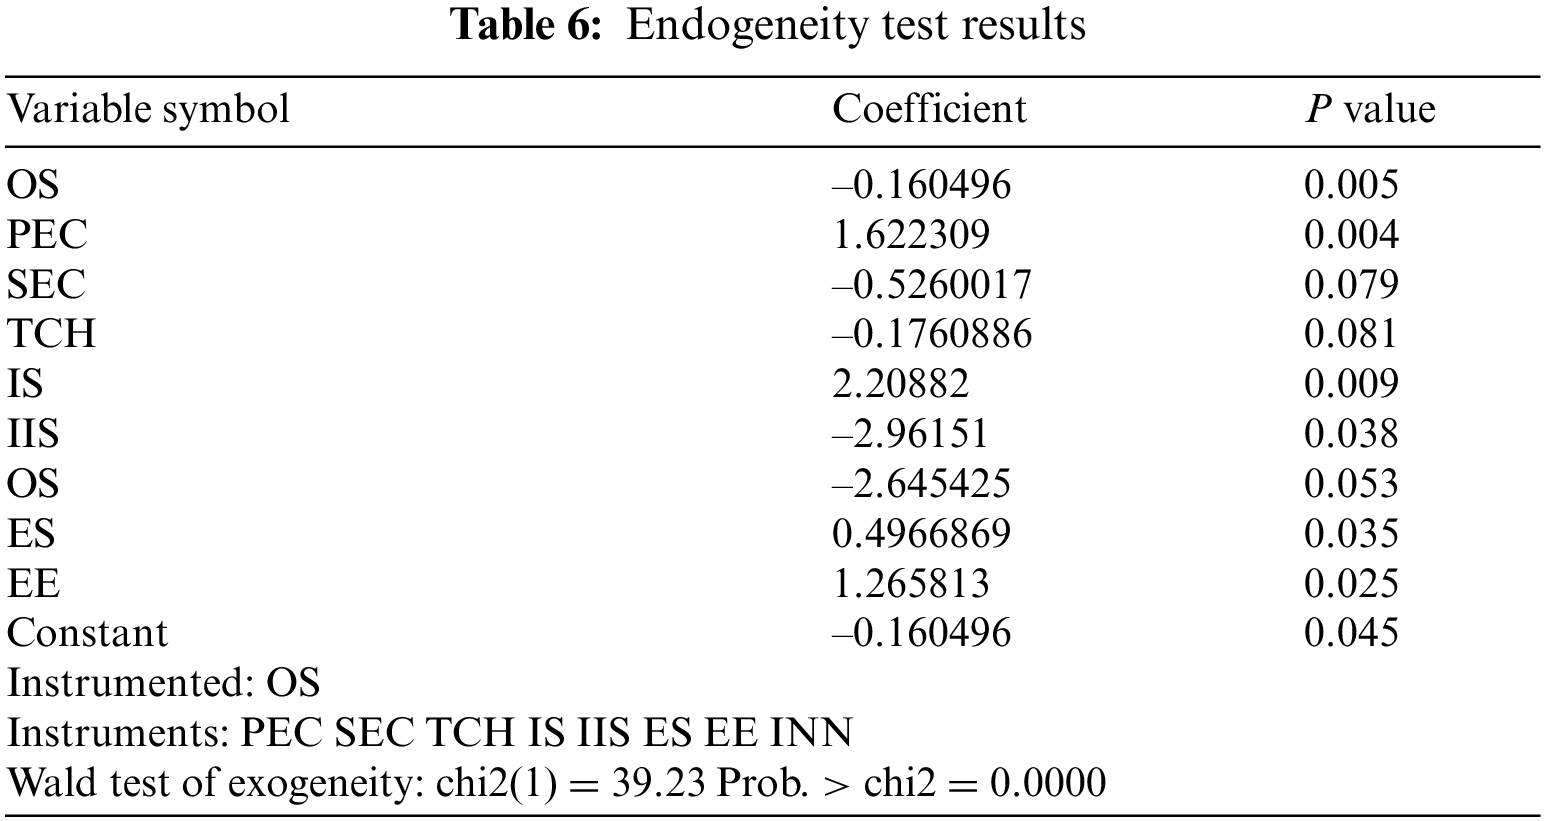
In order to further illustrate the reliability of the empirical results, endogeneity test and robustness test were performed on the above models based on the characteristics of panel data construction model.
Considering the causes of endogeneity, there are mainly the following two reasons: First, the omission of important explanatory variables; Second, there may be bidirectional interaction between explained variables and explanatory variables. Based on this, this paper uses instrumental variables to solve the possible endogeneity problems of the model. The higher the innovation level of state-owned enterprises, the more reasonable the ownership structure, so there is a certain correlation between the two. Meanwhile, the innovation level will also have an impact on the total factor energy efficiency by virtue of the ownership structure. Therefore, the ownership structure is selected as the endogenous explanatory variable, and the innovation index (INN) is taken as an instrumental variable. Tobit two-stage estimation method was used to test, and the results in Table 6 were finally obtained. From the diagnostic results of instrumental variables, it can be seen that the direction of the coefficients of each variable is consistent with the original regression results. At the same time, P value is 0, indicating that there is no over-identification problem of tool variables, that is, the selection of tool variables is effective.
In addition, the robustness of regression results is tested by changing index method.
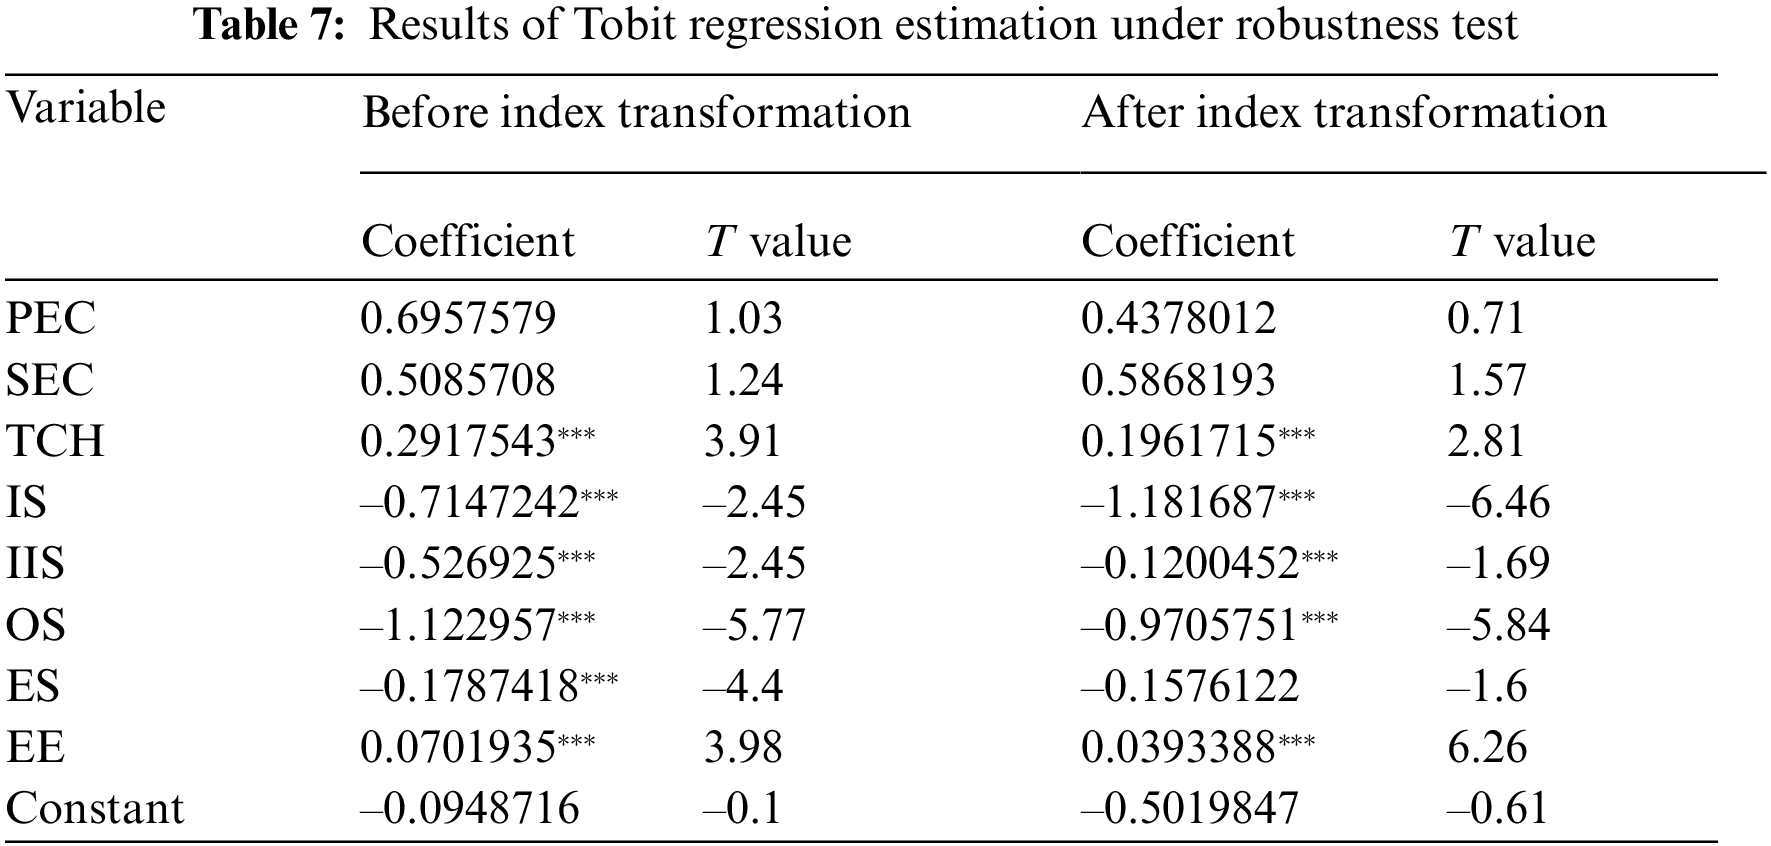
The essence of variable index method is to avoid the randomness of index selection affecting the regression results, so some variable indexes in the model are replaced to test the robustness of the regression results. In terms of the selection of variable indicators, the academic circle has not yet formed a unified standard on the selection of energy endowment indicators, so the indicators are changed. In the choice of energy endowment, in order to reduce the impact of population size while retaining the actual energy production capacity, this paper uses the ratio of per capita energy production in each province to the national per capita energy production as a reasonable substitute index for energy endowment. On the premise of retaining the original variables, the energy endowment after the change index was added into the Tobit model, and the new Tobit regression estimation results were obtained, as shown in Table 7. Before and after the index changes, only the coefficient significance of energy consumption structure changes, while the significance level and direction of other variables remain basically the same, indicating that the robustness test has been passed.
In this paper, Tobit-panel regression model is used to study the mechanism of the influencing factors of energy efficiency, and it is found that the improvement of pure technical efficiency, scale efficiency and technological progress all promote the improvement of total factor energy efficiency, but there is an obvious difference in the degree of effect. Because pure technical efficiency and scale efficiency have little effect on improving, they are not significant in the model. However, technological progress has great significance for the improvement of total factor energy efficiency, which passes the test at the significance level of 1%, and every 1% increase in technological progress will bring 0.29 percentage points of improvement in total factor energy efficiency. In addition, the industrial structure, industrial internal structure and ownership structure in the economic structure play a negative role on the improvement of total factor energy efficiency, and every 1% increase in the industrial structure, industrial internal structure and ownership structure will lead to a decrease of total factor energy efficiency of 0.71%, 0.52% and 1.12%, respectively. The regression coefficient of the energy consumption structure in the energy structure is negative, indicating that the increase in the proportion of coal consumption in the energy consumption will lead to the decline of total factor energy efficiency. Since the structural effect of energy endowment exceeds the technological effect, it is conducive to industrial agglomeration and thus to the formation of economies of scale. Therefore, the more obvious the advantage of energy endowment in a region is, the higher its energy efficiency will be. In other words, energy endowment will have a promoting effect on energy efficiency.
Acknowledgement: This research work is benefited from years of thinking about these issues and the discussion with many colleagues related to economics at that time. I would like to thank the chief editor of this journal and the anonymous reviewers for their helpful comments on future drafts.
Funding Statement: The research is supported by the National Natural Science Foundation of China under Grant 71804089, the Humanities and Social Sciences Youth Foundation of Ministry of Education of China under Grants 18YJCZH034 and 19YJC790128, the Jiangsu Postdoctoral Research Foundation under Grant 2018K195C, the Natural Science Foundation of Shandong Province in China under Grant ZR2020QG054, the Graduate Education Quality Improvement Project of Shandong Province, China under Grants SDYKC19180 and SDYAL19180. The project number of “The quality course in Financial Statistics” is SDYKC19180. The project number of “Financial Literacy Oriented Case Library of Derivative Financial Instruments Teaching” is SDYAL19180.
Conflicts of Interest: The authors declare that they have no conflicts of interest to report regarding the present study.
1. Hu, J. L., Wang, S. C. (2006). Total-factor energy efficiency of regions in China. Energy Policy, 34(17), 3206–3217. DOI 10.1016/j.enpol.2005.06.015. [Google Scholar] [CrossRef]
2. Zhou, P., Ang, B. W. (2008). Linear programming models for measuring economy-wide energy efficiency performance. Energy Policy, 36, 2911–2916. DOI 10.1016/j.enpol.2008.03.041. [Google Scholar] [CrossRef]
3. Wang, W. G., Fan, D. (2012). Analysis of convergence and influencing factors of total factor energy efficiency in China: Based on Malmqulist-Luenberger Index. Resources Science, 34(10), 1816–1824. [Google Scholar]
4. Wang, Q. W., Zhou, D. Q., Shen, X., Zhang, B. (2010). Measurement and analysis of total factor energy efficiency in China. Management Review, 22(3), 37–43. DOI 10.14120/j.cnki.cn11-5057/f.2010.03.002. [Google Scholar] [CrossRef]
5. Zhang, Y., Wang, W., Liang, L. W., Wang, D. P., Cui, X. H. et al. (2020). Spatial-temporal pattern evolution and driving factors of China’s energy efficiency under low-carbon economy. Science of the Total Environment, 739, 140–197. DOI 10.1016/j.scitotenv.2020.140197. [Google Scholar] [CrossRef]
6. Ren, Y. J. (2020). Research on the green total factor productivity and its influencing factors based on system GMM model. Journal of Ambient Intelligence and Humanized Computing, 11, 3497–3508. DOI 10.1007/s12652-019-01472-2. [Google Scholar] [CrossRef]
7. Yang, Z. S., Wei, X. X. (2019). Analysis of the total factor energy efficiency and its influencing factors of the Belt and Road key regions in China. Environmental Science and Pollution Research International, 26(5), 4764– 4776. DOI 10.1007/s11356-018-3961-3. [Google Scholar] [CrossRef]
8. Wang, Y. M., Xin, L. (2020). The impact of China’s trade with economies participating in the Belt and Road Initiative on the ecological total factor energy efficiency of China’s logistics industry. Journal of Cleaner Production, 276, 124196. DOI 10.1016/j.jclepro.2020.124196. [Google Scholar] [CrossRef]
9. Wu, H. T., Hao, Y., Ren, S. Y. (2020). How do environmental regulation and environmental decentralization affect green total factor energy efficiency: Evidence from China. Energy Economics, 91, 104880. DOI 10.1016/j.eneco.2020.104880. [Google Scholar] [CrossRef]
10. Xiong, S., Ma, X., Ji, J. (2020). The impact of industrial structure efficiency on provincial industrial energy efficiency in China. Journal of Cleaner Production, 215, 952–962. DOI 10.1016/j.jclepro.2019.01.095. [Google Scholar] [CrossRef]
11. Zhang, J. F., Fang, H., Wang, H. X., Jia, M. S., Wu, J. J. et al. (2017). Energy efficiency of airlines and its influencing factors: A comparison between China and the United States. Resources Conservation & Recycling, 125, 1–8. DOI 10.1016/j.resconrec.2017.05.007. [Google Scholar] [CrossRef]
12. Cheng, X. G., Li, N., Mu, H. L., Guo, Y. H., Jiang, Y. Q. (2018). Study on total-factor energy efficiency in three provinces of Northeast China based on SBM model. Energy Procedia, 152, 131–136. DOI 10.1016/j.egypro.2018.09.070. [Google Scholar] [CrossRef]
13. Ding, H. Y. (2019). An analysis of China’s industrial total factor energy efficiency and its influencing factors—An empirical study of panel data of 35 industrial industries. Journal of Chongqing University of Technology (Social Sciences), 33(10), 35–45. DOI 10.3969/j.issn.1674--8425(s). 2019.10.006. [Google Scholar] [CrossRef]
14. Gumerman, E., Vegh, T. (2019). Modeling energy efficiency as a supply resource: A bottom-up approach. Energy Efficiency, 12(7), 1737–1749. DOI 10.1007/s12053-018-9740-7. [Google Scholar] [CrossRef]
15. Lv, Y. L., Chen, W., Cheng, J. Q. (2020). Effects of urbanization on energy efficiency in China: New evidence from short run and long run efficiency models. Energy Policy, 147, 111858. DOI 10.1016/j.enpol.2020.111858. [Google Scholar] [CrossRef]
16. Zhong, Z. Q., Peng, B. H., Xu, L., Andrews, A., Elahi, E. (2020). Analysis of regional energy economic efficiency and its influencing factors: A case study of Yangtze river urban agglomeration. Sustainable Energy Technologies and Assessments, 41, 100784. DOI 10.1016/j.seta.2020.100784. [Google Scholar] [CrossRef]
17. Liang, H. J., Liu, J. S., Wang, R., Song, Y. Q., Zhou, Y. Y. (2020). Research on China's regional energy efficiency evaluation and influencing factors based on the DEA-Tobit model. Polish Journal of Environmental Studies, 29, 3691–3701. DOI 10.15244/pjoes/115976. [Google Scholar] [CrossRef]
18. Liu, H. M., Zhang, Z. X., Zhang, T., Wang, L. Y. (2020). Revisiting China's provincial energy efficiency and its influencing factors. Energy, 208, 118361. DOI 10.1016/j.energy.2020.118361. [Google Scholar] [CrossRef]
19. Zhang, N., Zhou, M. L. (2020). The inequality of city-level energy efficiency for China. Journal of Environmental Management, 255, 109843. DOI 10.1016/j.jenvman.2019.109843. [Google Scholar] [CrossRef]
20. Wei, C., Shen, M. H. (2009). Energy efficiency research developments and trends: An overview. Journal of Zhejiang University (Humanities and Social Sciences Edition), 39(3), 55–63. DOI 10.3785/j.issn.1008-942X.2008.10.221. [Google Scholar] [CrossRef]
21. Fare, R., Grosskopf, S. (2004). Modeling undesirable factors in efficiency evaluation: Comment. European Journal of Operational Research, 157(1), 242–245. DOI 10.1016/S0377-2217(03)00191-7. [Google Scholar] [CrossRef]
22. He, J., Hu, J. L., Yuan, Z. H. (2012). Research on the relationship between environmental pollution and economic growth based on endogenous growth model. Journal of Hefei University of Technology (Natural Science Edition), 35(10), 1422–1427. DOI 10.3969/j.issn.1003-5060.2012.10.028. [Google Scholar] [CrossRef]
23. Wu, C. Q., Dong, X. (2015). Research on time and space disparities of total factor energy efficiency in the Yangtze river economic belt under the constrained environment. Resources and Environment in Yangtze Basin, 24(10), 1646–1653. DOI 10.11870/cjlyzyyhj201510005. [Google Scholar] [CrossRef]
24. Zhang, J., Wu, G. Y., Zhang, J. P. (2004). Estimation of China’s inter-provincial physical capital stock: 1952–2000. Economic Research, 10, 35–44. [Google Scholar]
25. Wu, Y. R. (2008). The contribution of productivity to China’s economic growth: A new estimate. Economics, 3, 827–842. DOI 10.13821/j.cnki.ceq.2008.03.004. [Google Scholar] [CrossRef]
26. Yuan, X. L., Zhang, B. S., Yang, W. (2009). Research on China’s total factor energy efficiency based on environmental pollution. China Industrial Economy, 2, 76–86. DOI 10.19581/j.cnki.ciejournal.2009.02.008. [Google Scholar] [CrossRef]
 | This work is licensed under a Creative Commons Attribution 4.0 International License, which permits unrestricted use, distribution, and reproduction in any medium, provided the original work is properly cited. |