| Energy Engineering |
DOI: 10.32604/ee.2022.019497
ARTICLE
A Preliminary Assessment of Load Consumption and Solar Power Potential at Kota Belud, Sabah
1Faculty of Engineering, Universiti Malaysia Sabah, Jalan UMS, Kota Kinabalu, 88400, Malaysia
2Centre of Research in Energy and Advanced Materials, Faculty of Engineering, Universiti Malaysia Sabah, Jalan UMS, Kota Kinabalu, 88400, Malaysia
3Solar Energy Research Institute, Universiti Kebangsaan Malaysia, Bangi, 43600, Malaysia
*Corresponding Author: Wan Khairul Muzammil. Email: khairulm@ums.edu.my
Received: 27 September 2021; Accepted: 12 January 2022
Abstract: This paper presents a detailed preliminary assessment of load consumption and solar power potential at the Eco-Tourism Centre of Liogu Ku Silou-Silou (EPLISSI), Kota Belud, Sabah. This initial investigation assessed the feasibility of an off-grid solar PV system at EPLISSI with a suitable solar panel system for project installation and commissioning purposes. Due to the absence of an electrical grid and power supply, no pre-existing electrical appliances could be found in EPLISSI. Hence, an excel-based software, the ESCoBox, was used to produce the load profiles. The input data for this software came from a list of required electrical appliances (LED lights, fans, and phone chargers) and the historical frequency of visitors to EPLISSI. Meanwhile, to assess the solar power potential at EPLISSI, an online simulator known as Global Solar Atlas version 2.3 or GSA 2.3 was used. As an input for the GSA 2.3, the initial solar panel system capacity was set for 0.5 kWp, and then an increment of 0.1 kWp was entered until specific criteria were met. The selection of the suitable size is made when the system can satisfy the daily total average load demand and a specific load fulfillment demand. As a result, it was found that the site requires a total average demand and a total peak demand of 4.60 and 11.87 kWh/day, respectively. From the GSA 2.3 generated report, an off-grid solar PV system with the capacity of 2.50 kWp solar PV can satisfy the daily total average load demand of this area, where the average PV energy output is within the range of between 7.74–9.80 kWh/day or an average of 8.72 kWh/day. In conclusion, this preliminary assessment indicates that installing an off-grid solar PV system in this area is possible.
Keywords: Solar energy; rural electrification; stand-alone solar PV system; load profile; ESCoBox; Malaysia
Nomenclature
| N | Population |
| E | Typical load |
| p | Probability |
| Xi | Binomial distribution |
| nt | Time intervals |
| D | Aggregate demand |
| Dmax | Maximum demand value |
| Dposs | Possible demand value |
According to International Energy Agency [1], it was reported that the percentage of renewables in the global electricity generation increases as much as 2%, i.e., from 26% in the first quarter of 2019 to 28% in the first quarter of 2020. Solar energy is the main contributor to the increase of renewable share [2]. Compared to other renewable energy sources, solar energy growth in April 2020 was recorded by up to 16%, followed by wind energy by 12%. The report also highlighted that the increase happened after more than 100 gigawatts of solar PV and about 60 gigawatts of wind projects were completed in 2019. This highlights the abundance of renewable energy potential as well as resources globally.
The solar energy industry can be divided into solar thermal and solar photovoltaic (PV) industries. The term ‘photovoltaic’ refers to a semiconductor-based device used to convert solar energy (sunlight) into direct current (DC) electrical energy [3,4]. In contrast, the solar thermal system is used to heat water or air by first capturing solar radiation using vacuum tubes or perforated vertical tubes [5,6]. For the purpose of generating electricity using renewables, solar PV generation systems have become the mainstream option, and their market has vastly expanded in a short period, where according to Parikh [7], 70% of solar PV module manufacturing is accounted for by China.
A solar PV system can be classified into three main types: standalone system, grid-connected system, and hybrid system [8–10]. As its name suggests, the standalone system relies solely on solar power, which can be designed to only consist of PV modules and load, or with the addition of batteries and the necessary components for energy storage [3]. In Malaysia, the standalone solar PV system is mainly installed in remote rural areas [11]. Being surrounded by uneven terrain and dense jungles [12], also due to economic constraints [13], grid-connected and hybrid systems are not feasible in these remote areas.
It is known that the solar PV system can only be installed in areas where there is enough direct supply of solar energy. Malaysia's solar power generation potential is estimated to be four times the world's fossil fuel resource since there is an average of 4 to 8 h of sunshine every day [14,15]. Halabi et al. [12] remarked that the abundance of solar radiation averaging from 4.8 to 6.1 kWh/m2/day indicates a high potential for solar energy throughout this country. Meanwhile, Izadyar et al. [13] also stated a massive potential of solar energy system resources in electricity generation. They concluded that installing a solar energy system is highly feasible in Malaysia. Additionally, the authors highlighted that further development of such a system in remote rural areas would greatly help to increase the country's electrification coverage rate. Moreover, according to the Malaysian Investment Development Authority [16], the solar power market will encounter more substantial growth as this sector is backed by more robust regulatory support and improved financing scheme. Besides, this growth is due to the government's introduction of different incentives, policies, funds, investments, and strategies as emphasised under the 9th and 10th Malaysian Plan. Indirectly, this points Malaysia to an attractive investment destination and indicates a promising future for renewable energy developers in Malaysia.
The World Bank [17] stated that the access to electricity (% by population) in Malaysia reached 100% in 2017. However, the reality is that the current level of electrification in Sabah is still lower than in peninsular Malaysia (where it was estimated that there is almost 100% of electricity coverage), especially in areas without access to modern energy infrastructure. In Sabah, it was reported that 72% of rural Malaysian villages have no access to electricity [18]. Furthermore, Sabah's ongoing issues regarding rural electrification using renewable energy mainly revolves around the lack of exposure towards the benefits of producing their electricity and a low level of knowledge in implementing the technology. Due to the lack of technical know-how and limited exposure to the renewable energy system's societal impact, there are unfavourable responses towards implementing the standalone solar energy system in rural areas. Moreover, the varying amount of solar radiation in rural areas could potentially cause fluctuations in electricity generation, giving rise to the low acceptance rate. Hence, there is a need for a proper study regarding rural energy generation systems, especially in rural areas of Sabah.
As Thien [19] reported, Sabah has one of Malaysia's best renewable energy potentials. Apart from the success story of solar energy generation witnessed in Kudat and now expanding to Kunak, Sabah is the only state with viable geothermal and wind energy generating potential. This indicates an ongoing effort to develop renewable energy infrastructures, especially solar energy generation systems in specific parts of Sabah.
Towards developing sustainable electrical energy infrastructure in the surrounding areas of Kinabalu Park, a project to install a solar PV system was initiated by a team from Universiti Malaysia Sabah (UMS) as part of an initial investigation in rural renewable energy management study. The standalone or off-grid solar PV system is proposed explicitly as a model to expand the rural electrification in Sabah, which includes analysing the potential of such a plan at the surrounding districts of Kota Belud, Kota Marudu and Ranau areas, covering 4,750 square kilometres. Kinabalu Park's surrounding area was first surveyed for its solar radiation potential to kickstart the project. It was found that the region surrounding Kinabalu Park has outstanding potential for the implementation of solar energy projects with a high potential daily yield (approximately 3.816 kWh/kWp). Besides, in a study assessing the solar energy potential in Kota Kinabalu, Sabah, Markos et al. [14] reported that the annual average solar radiation received in Kota Kinabalu was 182 W/m2. Moreover, the estimation of the annual production of electricity is about 29,794 kWh/m2, which is equivalent to 0.014 MW of electricity produced just by using a single solar panel. Their study indirectly has shown that the potential of the solar PV system is high in Sabah.
The Eco-Tourism Centre of Liogu Ku Silou-Silou or EPLISSI located within the Kota Belud district was selected as this project's solar energy system installation site. It is an area that sits near a river, within a valley of a 1.9-acre land. EPLISSI is managed by rural villagers consisting of around 30 to 40 people. The nearest powerline is located half a kilometre away from EPLISSI. However, connecting EPLISSI with the electrical grid would be very expensive due to the surrounding areas’ geographical nature. Therefore, the off-grid solar PV system is proposed to supply electricity for EPLISSI. Besides, as a tourism centre, EPLISSI had to limit their operating hours to daytime due to having no access to electricity supply from the national grid. Therefore, considering the after-development impact on the surrounding residents, electricity coming from the off-grid solar PV system can help boost their economic activities as visitors extend their stay. This would help create a more positive outcome from the renewable energy system and fuel other similar projects to be developed in the surrounding areas of Kinabalu Park.
This preliminary assessment investigates the feasibility of an off-grid solar PV system at EPLISSI and estimates a suitable solar panel system size for the project's installation and commissioning purposes. Hence, load demand data and solar PV output are crucial to obtain the required size of the solar panel system. Due to having no electricity supply, the load demand will be assessed by getting a list of required electrical appliances (as shown in Table 1) and their quantities for future use. Besides, the frequency of visitors is tracked to generate the load profiles through the ESCoBox software. The load profiles generated are then used as a guide for the online PV simulator Global Solar Atlas version 2.3 (GSA 2.3) to estimate the solar PV potential. The method used will be explicated further in Section 2.

As mentioned before, the preliminary assessment is conducted within the Kinabalu Park's area. To the best of the authors’ knowledge, no published papers have evaluated the solar power potential within this region. Therefore, this paper could serve as a reference for those looking to implement a solar energy system in rural areas, specifically in Sabah, using freely available tools. Secondly, the authors in this study proposed to combine the ESCoBox software and GSA 2.3 as part of the preliminary energy assessment. The ESCoBox software was used to provide the load analysis data, whereas the GSA 2.3 provided the solar energy output data. Verification for both tools has been made and is explained more in the next section. Thirdly, the occupancy rate data, OR, was used as part of the calculation in ESCoBox software to get a more realistic outcome of the demand load. The occupancy rate is commonly used in the tourism industry to calculate the percentage of occupied rooms (or lodges) in a property at a given time [20].
In 2019, a preliminary assessment was conducted at EPLISSI to determine the feasibility of integrating a solar PV system in the Kinabalu Park area. The following are the scope and limitations of this preliminary assessment:
i. A Microsoft Excel-based software, ESCoBox, was used to generate load profiles for EPLISSI. Due to the non-existence of an electrical grid, a survey based on a list of required electrical appliances and the frequency of visitors was conducted. The data obtained from this survey was processed and later used as an input for ESCoBox.
ii. For a preliminary energy assessment of a location where the number of population or visitors can influence the energy usage, there should be at least 6–12 months’ worth of data to provide a realistic overview of the energy usage trend in the year. However, due to the limited data availability before August 2019 and the COVID-19 restrictions imposed in February 2020, only three months’ worth of data is available for the authors to conduct the assessment study.
iii. An online PV simulator known as Global Solar Atlas version 2.3 or GSA 2.3 was used to estimate the size of the off-grid solar PV system. The load demand generated from ESCoBox was used as a guide to estimate the system's size. The integration of GSA 2.3 in this preliminary assessment will be helpful to guide further the establishment of the off-grid solar PV system design.
iv. Due to the non-existence of electricity supply from the grid to aid in the residents’ economic activities, an off-grid solar PV system has been chosen.
v. This paper will not present the completed design of the off-grid solar PV system as it will only cover the preliminary assessment phase and not the design phase. However, for further information regarding the tilt and orientation of solar panels implemented on the design of the off-grid solar PV system at EPLISSI, the readers can refer to [21].
To meet the objectives of the preliminary assessment, specific methodologies were applied to ensure that the data acquired were sufficient for the current study, considering the limitations discussed previously. The summary of the preliminary assessment is shown in Fig. 1 below, while all the methods used are explicated in the following subsection.
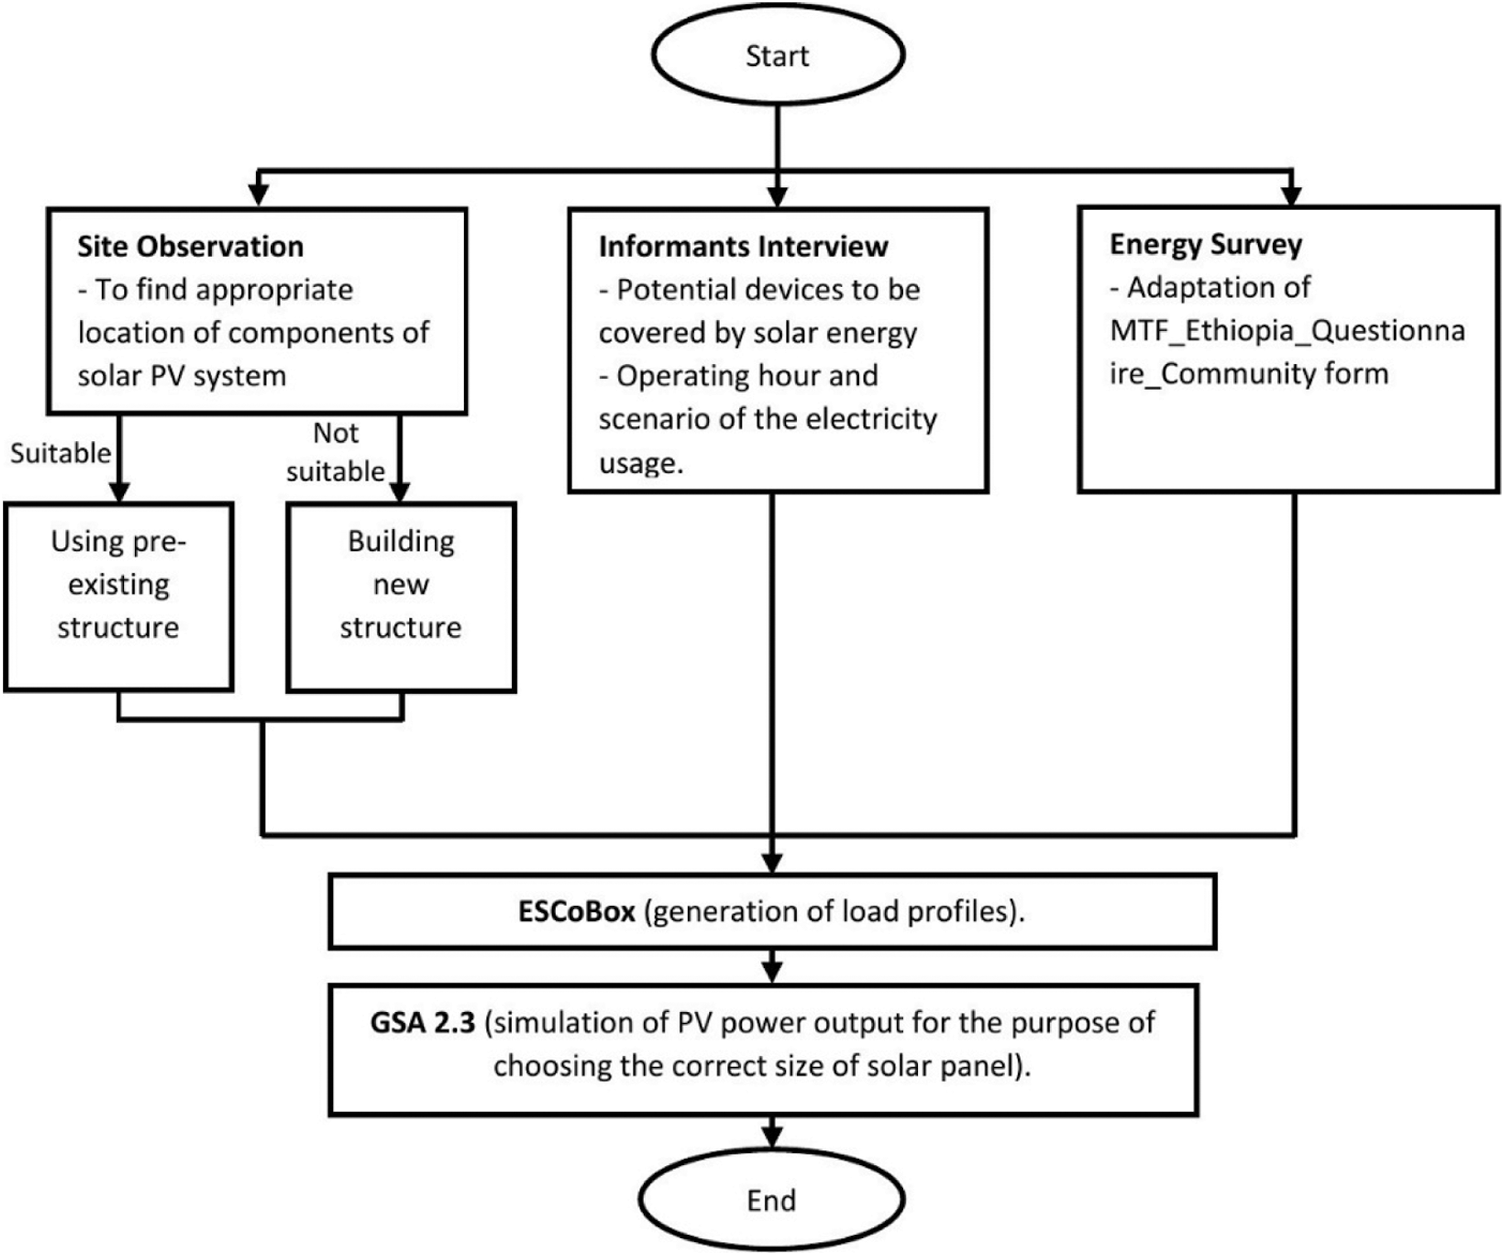
Figure 1: Summary of the preliminary assessment
The installation of the solar PV system mainly depends on several key factors such as location, condition of the roof, and a few others. Hence, the method used to determine whether the solar PV system is feasible or not will be partly through observation. The solar panel should be installed on sturdy and robust support with a suitable height. If no suitable buildings fit for installing the solar PV system exist, a separate structure will be erected.
Informal interview sessions with the manager and staff of EPLISSI were conducted to seek further information about the area (see Fig. 2). Some questions include the most popular activities in this centre, the required devices powered by solar energy, and many more. This information is crucial for developing a design that would meet the centre's requirements and match the current activities carried out on the site.
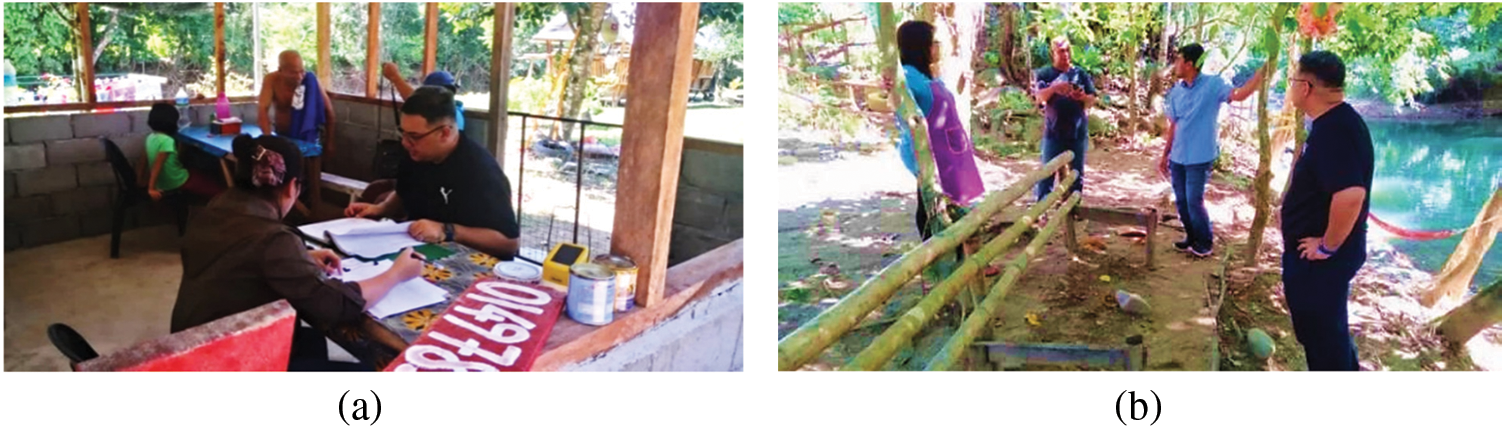
Figure 2: (a) Reviewing the logbooks and (b) Discussion between UMS researchers and EPLISSI's staff
To design a working solar PV system, it is crucial to evaluate and analyse the energy supply and demand within EPLISSI. Besides, information on the historical background of EPLISSI and the condition of surrounding areas (especially during the flood season) will be helpful in planning and preparing the related safety precautions.
Hence, to collect this type of data, a complete energy assessment tool was adopted for this study and used as the energy survey method [22]. Using this tool, the status of energy use in EPLISSI can be understood better. For example, if there is another plan to provide electricity to this place, the solar PV project can be cancelled and moved to another site.
An Excel-based software was used to generate the EPLISSI's load profile (peak and average daily demand profile). The main advantage of this toolset is that it can forecast peak and average electricity demand from a given population of consumers and their appliances. It is envisioned that it will be used in the planning phase to size the system. Subsequently, this software can assist in accepting new consumer connections or appliance types. It is called a decision support tool due to this reason.
A recent study was conducted by Abd Hamid et al. [23] to investigate the potential use of a solar photovoltaic system on the tropical island of Mantanani, Sabah, Malaysia. In their study, the authors have applied Solargis or readdress as Global Solar Atlas (GSA) online PV simulator as part of their methodology. The application of GSA, which employed geostationary satellites and meteorological models, is crucial in their study to acquire solar energy data such as solar irradiation and 2.2 kWp PV system output. However, they have reported minimal electricity supply at the study site. Hence, the total daily load could be extracted directly, unlike in EPLISSI, where generated load profiles are based on the listed electrical appliances, their power wattage, and frequency of visitors.
The load profile is an essential factor to be considered as it will show the daily amount of energy used, thus helping in deciding the design and capacity of the off-grid solar PV system. The ESCoBox software has been validated on a survey conducted by [24], where it was used as the primary tool to predict and plan a load profile. This software simulates the aggregate consumer demand by using a Monte Carlo method from three data elements:
• The population, N of each main type of electricity-consuming appliance expected or in use;
• The typical load, E presented by an example of each type; and
• An assessment for each type of probability, p that it will be in use at a given time of day.
These data can be obtained by surveying the consumers. In this assessment, N of each main type of electrical appliance was proposed by EPLISSI's manager. Whereas for E, the standard wattage rating for different appliances is used. Lastly, the p data were obtained by processing the data extracted from the visitor's log (total number of days visited by guests), as shown in Table 2. The simulation then takes each device in the population. At each time interval, it randomly determines whether it is “on” or “off” with a probability p and power consumed when on E. A binomial distribution of on and off states for each appliance Xi is created over nt trials (time intervals), see Eq. (1):

Then, the time sequence of aggregate demand, D is simply the sum of these distributions over all population, N appliances, see Eq. (2):
The software then calculates the mean and standard deviation of all the D values in the set and finds the maximum Dmax value. It also computes the maximum possible demand, Dposs, if all the appliances are simultaneously used. Further explanation of the assumptions and models used in the ESCoBox software can be read from [24]. Meanwhile, the computed load profile output by ESCoBox here will be further validated in future studies after the off-grid solar PV generation is installed and actual data is obtained.
In EPLISSI, the solar PV system is designed to be used in ten lodges and only one public toilet. The input data for ESCoBox software will be the type of device, its capacity, and quantity, as shown in Table 1 before. Furthermore, as part of the input required for the ESCoBox tool, the load profile is correlated to the visitor's occupancy rate (OR) of the buildings. OR = 0 is deemed to have no load, and OR = 1 is considered a full load. Hence, data of the daily number of lodges rented by the visitors from August to October 2019 are obtained.
Table 2 shows the OR of daily consumed energy for August, September, and October. The probability of occupied lodge by the visitors in the current month is equal to the sum of the probability of the occupied lodge (out of 10 lodges) daily by the visitors. Note that the probability of the occupied lodge in October is the highest due to the high number of rented lodges per day. It was recorded that all the ten lodges were rented on the 5th and 6th of October 2019. Hence, the highest computed OR of daily consumed energy is recorded in October, followed by August and September. The OR data are averaged to produce the monthly mean load profile.
After all the input data were obtained, they were keyed into the ESCoBox software. The load profile for each month (August, September, and October) and the load profile of the monthly average were generated ten times. Average values were used to graph each load profile to ensure the accuracy and repeatability of the data. An example is shown in Fig. 3 below.
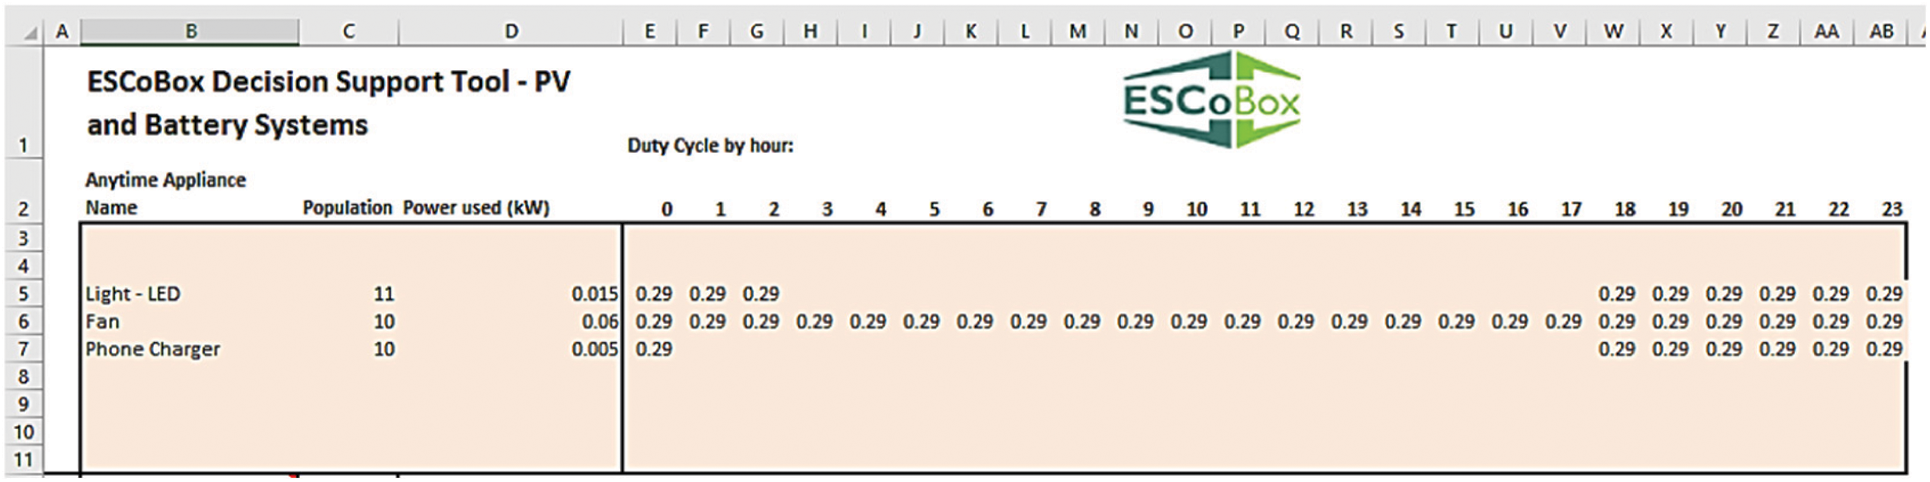
Figure 3: Setting up the load profile requirements for August 2019
It is important to note that the generated load profile only illustrates a pre-installation load profile. Thus, the post-installation load profile might differ, and as mentioned, a validation study will be carried out later. On the other hand, the probability of daily consumed energy is calculated by dividing the total percentage of the overnight rented lodge by the number of days the visitors stayed overnight.
2.5 Global Solar Atlas Version 2.3
GSA 2.3 is an online application produced by Solar Geographic Information System, or simply Solargis, under an agreement with The World Bank and sponsored by the Energy Sector Management Assistance Program (ESMAP). As shown in Fig. 4 below, there are three main calculation models used by GSA 2.3: the solar radiation, air temperature, and PV power simulation models. The data input from geostationary satellites and meteorological models are used to calculate the solar resource parameters. Besides solar radiation, air and PV modules’ temperatures are the critical secondary component data for the solar electricity simulation.
Solar radiation modelling of GSA 2.3 is based on the Solargis model, which utilises the most modern input data from satellite and atmospheric circumstances [25]. In the Solargis model, data gathered from satellites are used to detect cloud properties using advanced algorithms. Hence, this approach is practical to replicate and reproduce actual circumstances. Apart from that, results from operational numerical weather models (NWP) are used for prediction data; in the post-processing stage, operationally computed data from the satellite model is applied to improve the precision of the prediction. Furthermore, the potential electricity production is computed based on several conversion stages in the PV simulation model. Here, the power losses for the solar power calculation are calculated by the GSA 2.3. The inverter efficiency, DC losses (soiling, cables, and mismatch), and AC losses (Transformer and cables) are all considered. For further clarifications, readers may refer to [26]. In a study performed by Ineichen [27], the GHI and DNI data provided by Solargis and another five satellite irradiance models have been compared to a high-quality measurement with about 16 years of continuous measurements in 18 locations. As an outcome, Solargis has been recognised as the most accurate data source with the lowest overall bias, lowest root-mean-square deviation (RMSD), and lowest mean bias deviation. Further details regarding GSA 2.3 can be found from the Global Solar Atlas [28] and Solar Geographical Information System [29] websites.
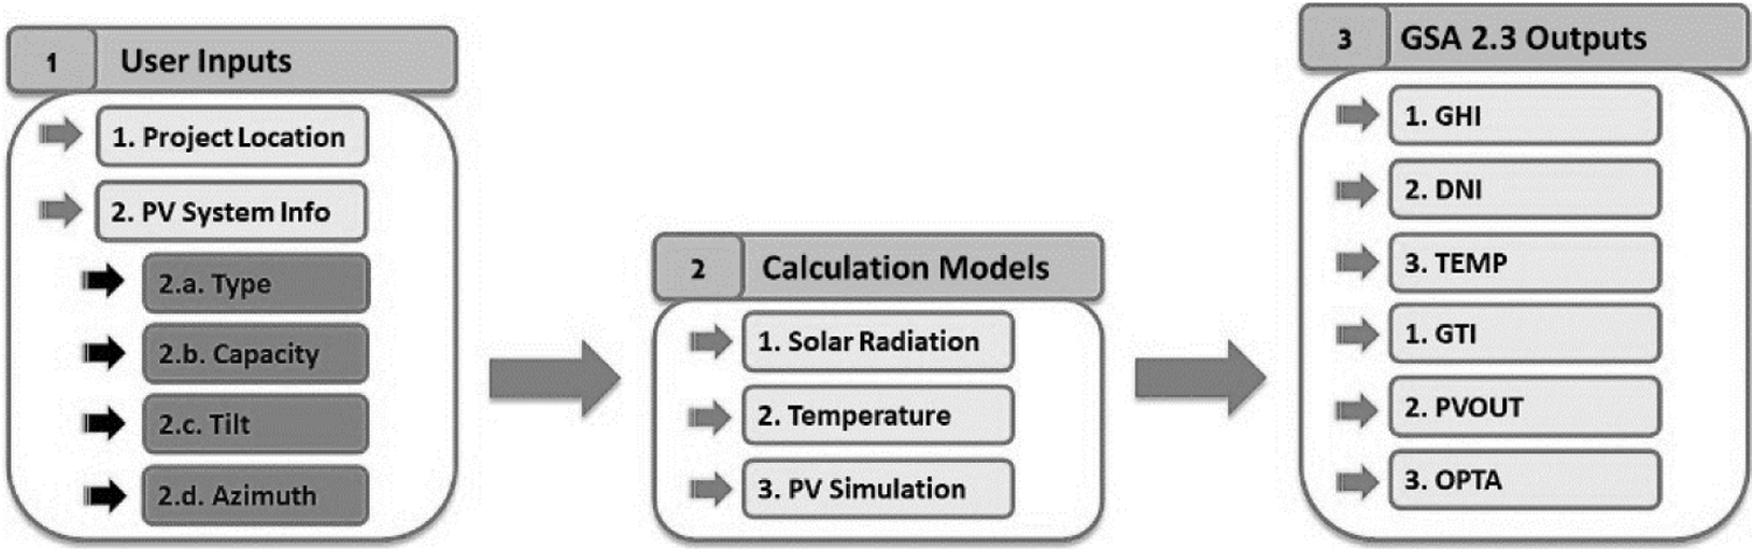
Figure 4: Global Solar Atlas 2.3 calculation models
In this preliminary assessment, GSA 2.3 estimates the size of the off-grid solar PV system design guided by the load demand generated using ESCoBox. As an input for the GSA 2.3, the initial solar panel system capacity was set for 0.5 kWp, and then an increment of 0.1 kWp was entered until specific criteria were met. The selection of the suitable PV capacity is made when the system can satisfy the daily total average load demand and a specific load fulfillment demand.
This section discusses and reports the outcomes of the preliminary assessment of load consumption and solar power potential at EPLISSI for the purpose of implementing an off-grid solar PV system. However, the surrounding area will be first reviewed for its suitability and future installation plan. Moreover, the selection of buildings supplied with solar electricity will also be discussed.
3.1 EPLISSI's Surrounding Area
The surrounding areas of EPLISSI covered by trees would help shelter guests during hot weather. However, the power output performance of the solar panels is profoundly affected by the shading caused by the shadow of the trees. According to [30], the drawbacks of the effect of the shadow on PV panels reduces the PV output and causes a safety hazard. Hence, the shadow effect should be avoided, and the installation site should be located away from trees. The surrounding area of this recreational area is shown in Fig. 5, as follows.
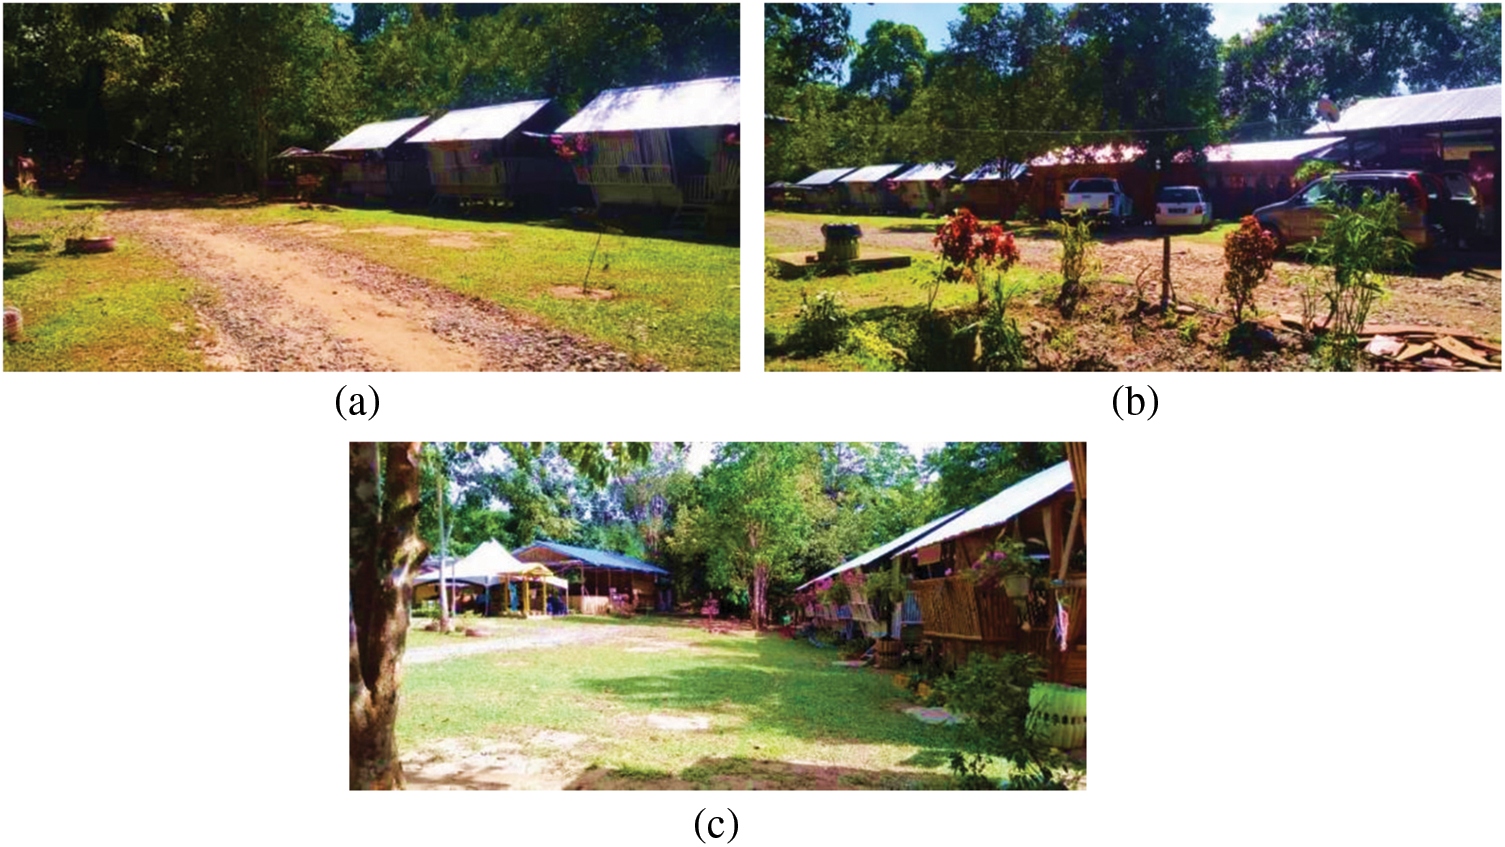
Figure 5: (a) Entrance to the EPLISSI, (b) some of the lodges inside EPLISSI, (c) EPLISSI's surrounding area
There are 17 buildings, including one medium-sized hall, ten lodges, two toilets, one kitchen, two small stores, and one canteen inside the EPLISSI's area. However, there are no suitable buildings available to support the PV panels for many years through observation. Also, upon further consideration, even though some existing buildings possess proper height to avoid the shadow effect on the solar PV panel, they still are not sturdy enough. Hence, a suitable place should be in the medium-sized field area, where a separate structure to support the PV system and the energy storage system must be constructed.
The layout of EPLISSI can be seen in Fig. 6. Upon discussion and agreement with EPLISSI, the red-coloured boxes mark the pre-selected buildings to be supplied with electricity from the off-grid solar PV system as part of the requirement from the owner of the site. This is considered the right decision to attract more guests and extend their stay at night-time. In addition, as there is no electricity source during the assessment, no pre-existing electrical wiring can be found at the site. Furthermore, no water heaters, refrigerators, or other heavy load electronic devices can be found in the canteen and kitchen areas. However, only gas stoves are provided for the visitors.
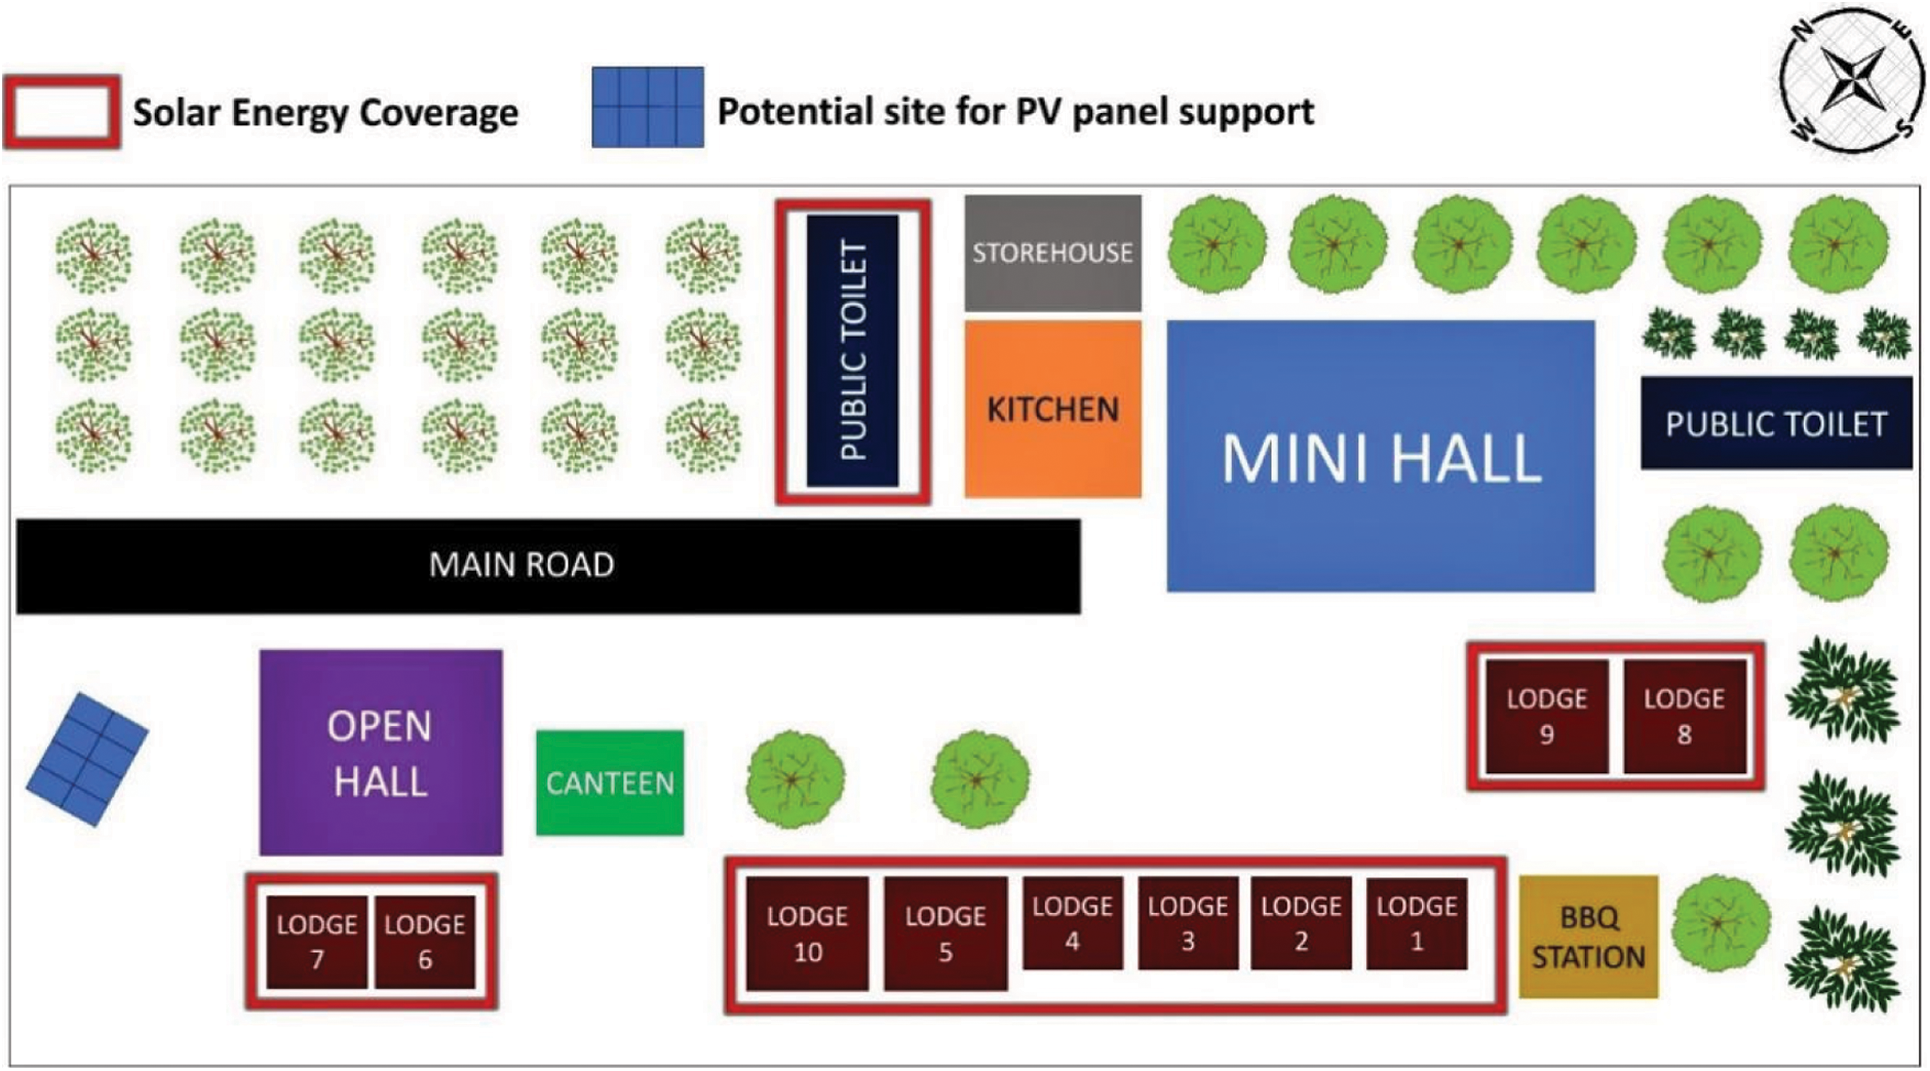
Figure 6: The layout of EPLISSI's surrounding area
3.2 Energy Survey and Assessment of Historical Conditions
The energy survey was one of the methods used to collect more information concerning the energy supply and demand at the solar installation site. The survey was conducted with help from one of EPLISSI's staff. The investigation revealed that EPLISSI is not connected to any form of stable source of electricity. Accordingly, as the geographical terrain of the eco-tourism centre can pose some challenges to laying the electrical cables, it is more cost-efficient and safer for a standalone renewable energy system to provide the electrical energy for EPLISSI.
Moreover, installing a standalone solar energy system has never been considered by EPLISSI due to financial problems and a lack of information or knowledge regarding the technology. Also, the energy source to light up the surrounding area comes from mini solar devices (i.e., solar lanterns and solar street lighting), as shown in Fig. 7. Altogether, seven solar lanterns and one solar lighting device could be found at EPLISSI, and they only work for about six to ten hours on a typical night. However, these lighting sources could only cover a small part of the community centre area and, therefore, are not sufficient to provide total illumination in the area surrounding the lodges.
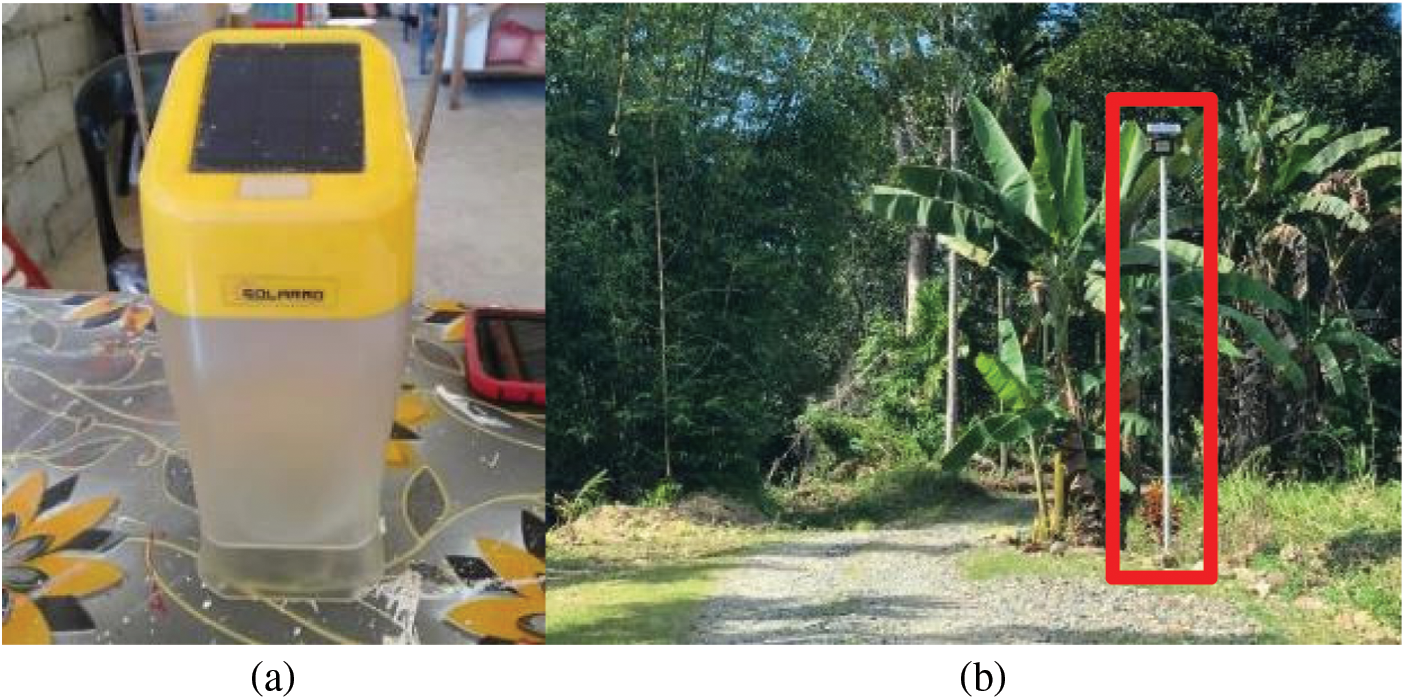
Figure 7: (a) Solar lantern of model SOLARMO SKU: SM-L045B; (b) Solar street lighting/lamp
It should be noted that as EPLISSI has no stable source of electricity, the electrical energy demand in this area is not known. However, based on the required devices shown in Table 1 earlier, the energy demand or the load profile of EPLISSI could be determined and used to assist in the design phase of the solar PV system.
In addition to the energy requirements, it was noted that there were several times of floods that have been recorded in recent years. Therefore, safety precautions such as keeping all the solar components in a higher place will be considered to ensure that the solar PV system is not affected by the flooding.
The load profile based on the average OR of three months’ data is illustrated in Fig. 8. Based on this figure, the trend line for the total average demand appears to be increasing and shows a stable outlook throughout the night until 3 a.m. The pattern assumes that LED lights are turned on during night-time, and the phone chargers are being used. However, the total average demand hovers at around 0.17 kW throughout the day. This is because the guests are assumed to be enjoying the outdoor activities (i.e., swimming, picnicking, barbeque, fish feeding, or snail hunting) during the day.

Figure 8: Three months’ peak and average daily demand profile
Table 3 shows the total daily energy used for the three months’ worth of data (monthly average data). The aggregate peak and average demand were calculated to be 11.874 and 4.6 kWh, respectively. Hence, the solar PV system must be designed so that its installed capacity can at least satisfy the total average demand.

3.4 Global Solar Atlas 2.3 Report on Solar PV Potential
From the observations and based on the GSA 2.3 generated report, an off-grid solar PV system with a capacity of 2.5 kWp can satisfy the average daily load demand at EPLISSI. The global horizontal irradiation data for the current location is approximately 4.633 kWh/m2 per day, which can power all the predetermined buildings in EPLISSI. The summary of the EPLISSI's data is tabulated in Table 4.
Based on Fig. 9, the direct average irradiation at EPLISSI was almost 4 kWh/m2 in March and April. This illustrates high solar energy potential and indicates the possibility of a standalone solar PV system to be developed. The PV output data with an installed capacity of 2.5 kWp shown in Fig. 10 illustrates that meaningful solar energy can be harvested as early as 8 a.m. and ends at 3 p.m., with peak solar output between 10 a.m. to 2 p.m. Therefore, the range of solar hours in the current location is approximately four hours. Moreover, the total PV power output of 3.182 MWh per year, or about 8.72 kWh per day, can be expected to be generated from the system. It is worth mentioning that specific load fulfilment demand can be considered for a renewable energy system in rural areas where budget is part of the decision-making requirement. In this study, the authors opted for at least 70% of the fulfilment of peak load demand. These data imply that the production of solar electrical energy output is reasonably high, considering the occupancy rate of the tourism centre. Therefore, implementing the solar PV system in EPLISSI can be achievable.
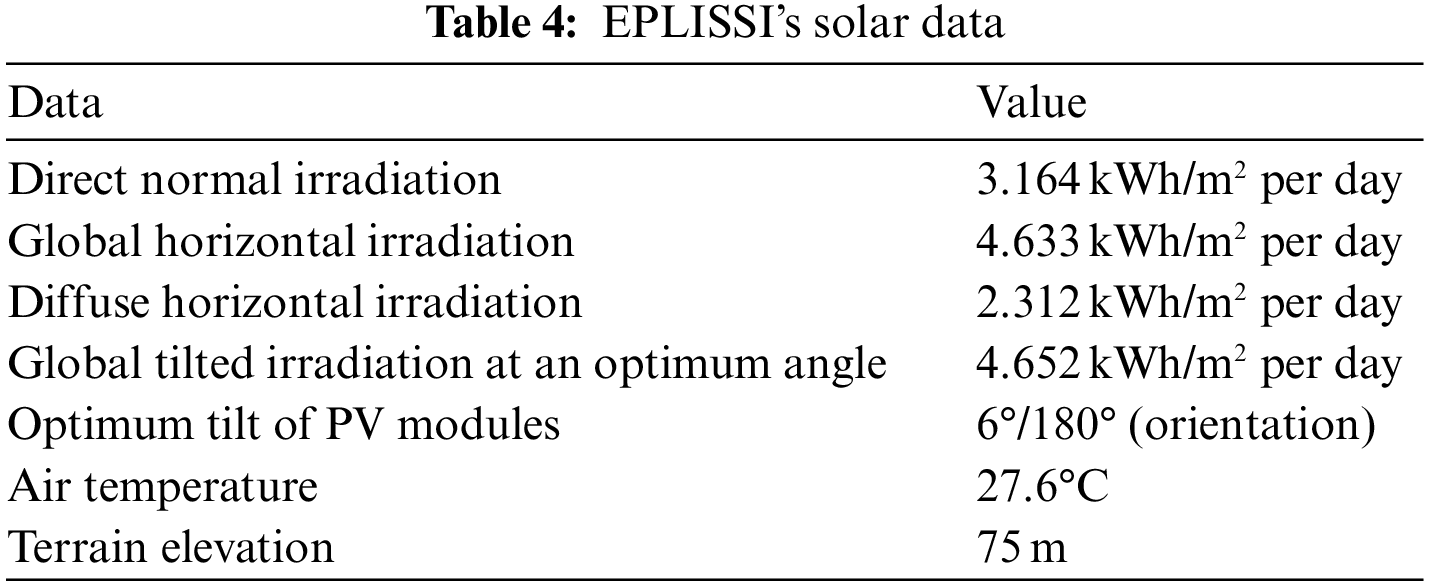
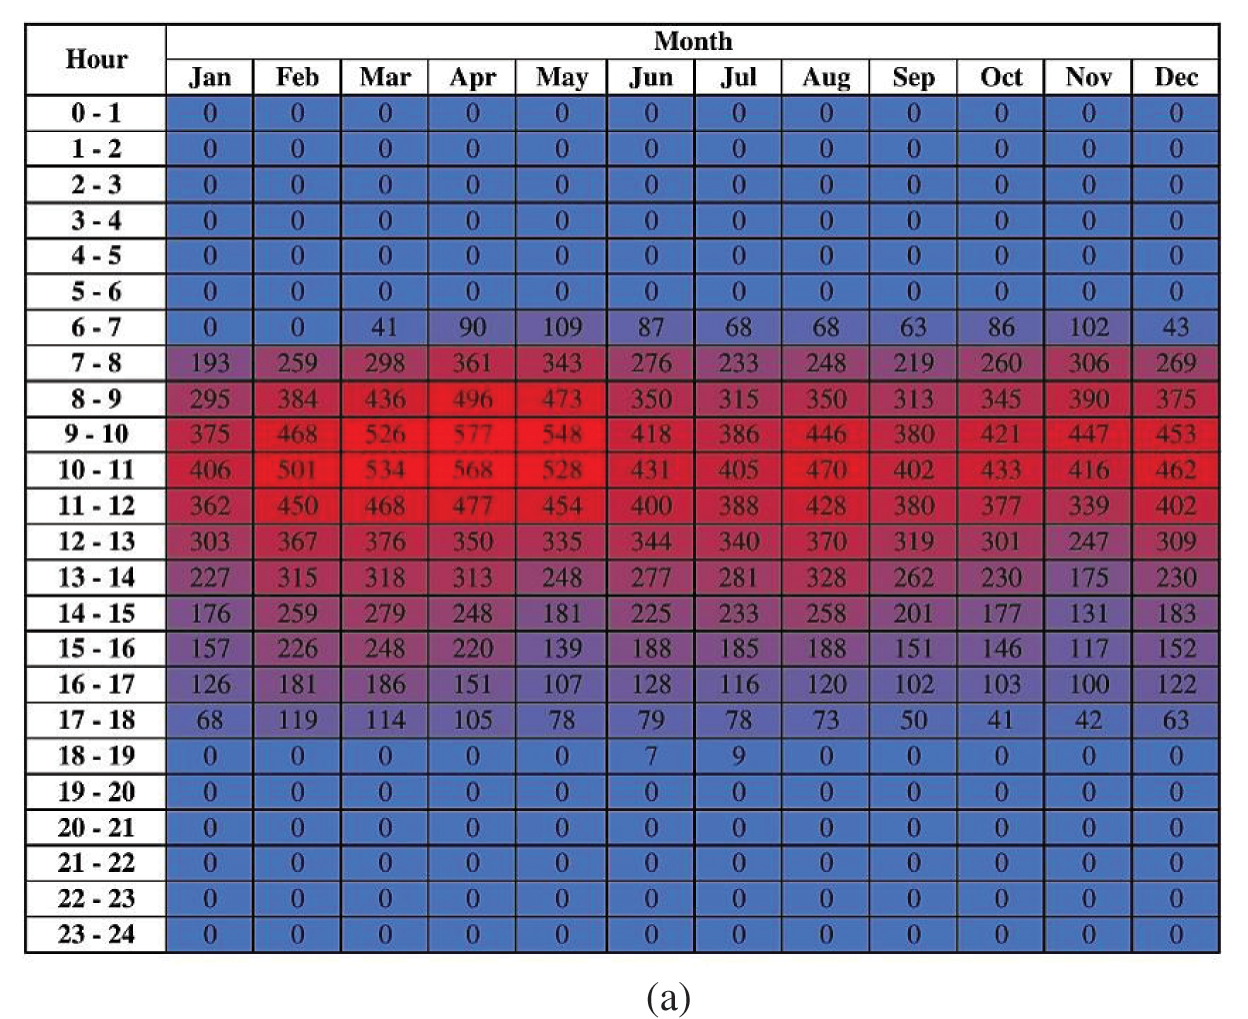
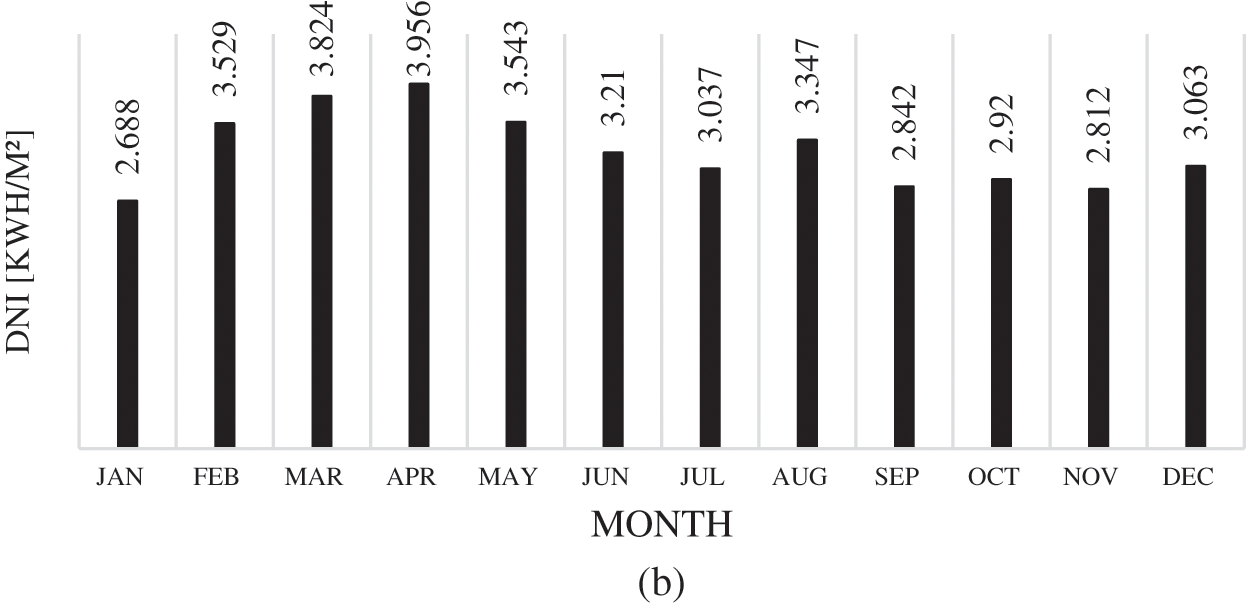
Figure 9: (a) Table of direct normal irradiation, DNI (Wh/m2) average hourly profiles; and (b) Graph of direct normal irradiation, DNI (kWh/m²) average daily profiles
Figure 10: (a) Table of the total photovoltaic power output of hourly profiles (Wh); and (b) Graph of the total photovoltaic power output of daily profiles (kWh)
To conclude, the preliminary study's outcome has confirmed that EPLISSI is currently not connected to any form of a stable source of electricity. The geographical condition surrounding the EPLISSI is located relatively on a flat surface, which is a suitable solar installation site. The energy source to light up the place is from existing mini solar lanterns and a small free-maintenance solar streetlamp during the night-time. Besides, EPLISSI is strategically located where the DNI and DHI of 3.164 and 4.633 kWh/m2 per day, respectively, can be expected from this location. Thus, it can be said that the solar PV system has high potential in terms of electricity generation in EPLISSI. As observed, however, due to the inexistence of sturdy roof support, another ground mounting system of the solar panel needs to be erected separately. The integration of ESCoBox and GSA 2.3 tools provided the required preliminary data for the study. As a result, the GSA 2.3 energy output data based on a 2.5 kWp solar PV system can generate up to 8.72 kWh per day. This system can at least satisfy the ESCoBox's result of daily total average energy demand by EPLISSI of 4.6 kWh/day, hence providing excellent and crucial information before moving to the design phase of the solar PV project.
After the preliminary data are obtained, the next step will be the design phase of the off-grid solar PV system. The future scope of this current study includes providing detailed documentation regarding the design of the off-grid solar PV system. The developed design will be deployed at EPLISSI, and subsequent data such as PV output and load consumption will be recorded. These data will be used to carry out energy analysis. Integration of Homer software in the study will help analyse the PV system further. The main expected outcome from the entire investigation is an optimised energy system suitable for the area in Sabah, or specifically in the surrounding area of Kinabalu Park.
Acknowledgement: The authors would like to thank the Malaysian Ministry of Higher Education (MOHE) for the Fundamental Research Grant Scheme (FRGS/1/2019/TK07/UMS/03/1). Special appreciation is also credited to Universiti Malaysia Sabah for the research grant allocated for the development of this project, SDK0121-2019.
Funding Statement: This work was supported by research grants from the Malaysian Ministry of Higher Education (MOHE), FRGS/1/2019/TK07/UMS/03/1 and Universiti Malaysia Sabah (UMS), SDK0121-2019.
Conflicts of Interest: The authors declare that they have no conflicts of interest to report regarding the present study.
1. International Energy Agency (2020). Global energy review 2020: The impacts of the COVID-19 crisis on global energy demand and carbon dioxide emissions. https://www.iea.org/reports/global-energy-review-2020/renewables. [Google Scholar]
2. Pal, P., Mukherjee, V. (2021). Off-grid solar photovoltaic/hydrogen fuel cell system for renewable energy generation: An investigation based on techno-economic feasibility assessment for the application of end-user load demand in north-east India. Renewable and Sustainable Energy Reviews, 149, 111421. DOI 10.1016/j.rser.2021.111421. [Google Scholar] [CrossRef]
3. Jäger, K. D., Isabella, O., Smets, A. H. M., van Swaaij, R. A. C. M. M., Zeman, M. (2016). Solar energy: Fundamentals, technology and systems. Cambridge: UIT Cambridge. [Google Scholar]
4. Pascasio, J. D. A., Esparcia Jr., E. A., Castro, M. T., Ocon, J. D. (2021). Comparative assessment of solar photovoltaic-wind hybrid energy systems: A case for philippine off-grid islands. Renewable Energy, 179, 1589–1607. DOI 10.1016/j.renene.2021.07.093. [Google Scholar] [CrossRef]
5. Azoumah, Y. K., Tossa, A. K., Dake, R. A. (2020). Towards a labelling for green energy production units: Case study of off-grid solar PV systems. Energy, 208, 118149. DOI 10.1016/j.energy.2020.118149. [Google Scholar] [CrossRef]
6. Jayaraman, K., Paramasivan, L., Kiumarsi, S. (2017). Reasons for low penetration on the purchase of photovoltaic (PV) panel system among Malaysian landed property owners. Renewable and Sustainable Energy Reviews, 80, 562–571. DOI 10.1016/j.rser.2017.05.213. [Google Scholar] [CrossRef]
7. Parikh, A. (2020). Share of solar & wind rose despite depressed global power demand amid pandemic: IEA. https://mercomindia.com/share-of-solar-and-wind-rose/. [Google Scholar]
8. Cho, D., Valenzuela, J. (2020). Optimization of residential off-grid PV-battery systems. Solar Energy, 208, 766–777. DOI 10.1016/j.solener.2020.08.023. [Google Scholar] [CrossRef]
9. Irfan, M., Yadav, S., Shaw, K. (2021). The adoption of solar photovoltaic technology among Indian households: Examining the influence of entrepreneurship. Technological Forecasting and Social Change, 169, 120815. DOI 10.1016/j.techfore.2021.120815. [Google Scholar] [CrossRef]
10. Samsudin, M. S. N., Rahman, M. M., Wahid, M. A. (2016). Power generation sources in Malaysia: Status and prospects for sustainable development. Journal of Advanced Review on Scientific Research, 25(1), 11–28. [Google Scholar]
11. Ahmad, N. A., Byrd, H. (2013). Empowering distributed solar PV energy for Malaysian rural housing: Towards energy security and equitability of rural communities. International Journal of Renewable Energy Development, 2(1), 59–68. DOI 10.14710/ijred.2.1.59-68. [Google Scholar] [CrossRef]
12. Halabi, L. M., Mekhilef, S., Olatomiwa, L., Hazelton, J. (2017). Performance analysis of hybrid PV/diesel/battery system using HOMER: A case study Sabah, Malaysia. Energy Conversion and Management, 144, 322–339. DOI 10.1016/j.enconman.2017.04.070. [Google Scholar] [CrossRef]
13. Izadyar, N., Ong, H. C., Chong, W. T., Mojumder, J. C., Leong, K. Y. (2016). Investigation of potential hybrid renewable energy at various rural areas in Malaysia. Journal of Cleaner Production, 139, 61–73. DOI 10.1016/j.jclepro.2016.07.167. [Google Scholar] [CrossRef]
14. Markos, F. M., Sentian, J. (2016). Potential of solar energy in kota kinabalu, Sabah: An estimate using a photovoltaic system model. Journal of Physics: Conference Series, 710, 012032. DOI 10.1088/1742-6596/710/1/012032. [Google Scholar] [CrossRef]
15. Oh, T. H., Pang, S. Y., Chua, S. C. (2010). Energy policy and alternative energy in Malaysia: Issues and challenges for sustainable growth. Renewable and Sustainable Energy Reviews, 14(4), 1241–1252. DOI 10.1016/j.rser.2017.06.112. [Google Scholar] [CrossRef]
16. Malaysian Investment Development Authority (2021). Solar power market to see stronger growth. https://www.mida.gov.my/mida-news/solar-power-market-to-see-stronger-growth/. [Google Scholar]
17. The World Bank (2019). Access to electricity, rural (% of rural population). https://data.worldbank.org/indicator/EG.ELC.ACCS.RU.ZS. [Google Scholar]
18. Green Empowerment (2021). The road to renewable energy in Sabah, Malaysia. https://greenempowerment.org/the-road-to-renewable-energy-in-sabah-malaysia/. [Google Scholar]
19. Thien, D. (2021). Sabah has best renewable energy potential. http://www.dailyexpress.com.my/news/164955/sabah-has-best-renewable-energy-potential/. [Google Scholar]
20. Chen, M. H. (2010). The economy, tourism growth and corporate performance in the Taiwanese hotel industry. Tourism Management, 31(5), 665–675. DOI 10.1016/j.tourman.2009.07.011. [Google Scholar] [CrossRef]
21. Matius, M. E., Ismail, M. A., Farm, Y. Y., Amaludin, A. E., Radzali, M. A. et al. (2021). On the optimal tilt angle and orientation of an on-site solar photovoltaic energy generation system for Sabah's rural electrification. Sustainability, 13(10), 5730. DOI 10.3390/su13105730. [Google Scholar] [CrossRef]
22. The World Bank (2018). Ethiopia-multi-tier framework (MTF) survey. https://datacatalog.worldbank.org/dataset/ethiopia-multi-tier-framework-mtf-survey-2018. [Google Scholar]
23. Abd Hamid, A. S., Makmud, M. Z. H., Abd Rahman, A. B., Jamain, Z., Ibrahim, A. (2021). Investigation of potential of solar photovoltaic system as an alternative electric supply on the tropical island of mantanani Sabah Malaysia. Sustainability, 13(22), 12432. DOI 10.3390/su132212432. [Google Scholar] [CrossRef]
24. Boait, P., Gammon, R., Advani, V., Wade, N., Greenwood, D. et al. (2017). ESCoBox: A set of tools for mini-grid sustainability in the developing world. Sustainability, 9(5), 738. DOI 10.3390/su9050738. [Google Scholar] [CrossRef]
25. Solargis (2020). Methodology-solar radiation modeling. https://solargis.com/docs/methodology/solar-radiation-modeling. [Google Scholar]
26. Global Solar Atlas (2020). Methodology. https://globalsolaratlas.info/support/methodology. [Google Scholar]
27. Ineichen, P. (2013). Long term satellite hourly, daily and monthly global, beam and diffuse irradiance validation. Interannual Variability Analysis. [Google Scholar]
28. Global Solar Atlas (2020). About global solar atlas. https://globalsolaratlas.info/support/about. [Google Scholar]
29. Solargis (2020). Documentation: Methodology. https://solargis.com/docs/methodology. [Google Scholar]
30. Kazem, H. A., Chaichan, M. T., Alwaeli, A. H., Mani, K. (2017). Effect of shadows on the performance of solar photovoltaic. Mediterranean green buildings & Renewable Energy. Switzerland: Springer International Publishing. [Google Scholar]
 | This work is licensed under a Creative Commons Attribution 4.0 International License, which permits unrestricted use, distribution, and reproduction in any medium, provided the original work is properly cited. |