| Energy Engineering |
DOI: 10.32604/ee.2022.019843
ARTICLE
Study of CO2 Flooding to Improve Development Effect in Conglomerate Reservoirs
1Research Institute of Exploration and Development, Petrochina Xinjiang Oilfield Company, Karamay, 834000, China
2School of Petroleum Engineering, Yangtze University, Wuhan, 430100, China
3Ministry of Education Key Laboratory of Oil & Gas Resources and Exploration Technology, Wuhan, 430100, China
4Xinjiang Oilfield Company of CNPC, Karamay, 834000, China
5Karamay Drilling Company of CNPC West Drilling Corporation, Karamay, 834000, China
*Corresponding Author: Yaguang Qu. Email: qyg52122@126.com
Received: 19 October 2021; Accepted: 27 December 2021
Abstract: For low permeability sandstone reservoirs, CO2 flooding has been proved to be an effective method to enhance oil recovery. Reservoir A is a typical conglomerate reservoir in Xinjiang oilfield. The reservoir has strong water sensitivity, and the injection pressure continues to rise. Furthermore the oil well pressure continues to drop. According to the screening conditions of CO2 flooding, the reservoir A can easily achieve CO2 miscible flooding with moderate temperature. And the reservoir has the advantage of being close to the gas source. Firstly, the relationship curve between CO2 oil displacement efficiency and oil displacement pressure was obtained by changing the oil displacement pressure using the fine-tube experimental model, and the minimum miscible pressure of CO2 oil displacement was determined. The minimum miscible pressure of reservoir A was 24.1 MPa. The change of oil phase state after CO2 injection was further studied by CO2 gas expansion experiment. The results show that the saturation pressure of formation oil increases significantly after CO2 injection, and the more CO2 injection, the higher the saturation pressure of formation oil. When the CO2 content in the injected crude oil is 55.29 mol%, the saturation pressure of the CO2 formation crude oil system reaches 31.60 MPa. Then, in order to better simulate the real reservoir conditions of conglomerate reservoir, the 2D visualization model of the outcrop was processed to analyze the microscopic oil displacement mechanism of CO2. The experimental results show that the remaining oil after water flooding mainly exists in the form of cluster, film, column and blind end, and the remaining oil after gas flooding exists in the form of island, cluster and film, and there is an obvious gravity overlay phenomenon. CO2 flooding after water flooding significantly improved sweep efficiency and enhanced recovery. Finally, through the analysis of CO2 field injection effect in reservoir A, it is shown that CO2 absorption capacity of single well is significantly higher than water absorption capacity. The equilibrium degree of production profile in gas injection stage is better than that in water flooding stage. Injecting carbon dioxide quickly restores formation pressure. The oil recovery effect after gas injection in the trial production stage is obviously improved compared with that in the water flooding stage. The research results of this paper provide a reference for the field application of CO2 flooding enhanced oil recovery technology in Xinjiang conglomerate reservoir.
Keywords: CO2 flooding; physical simulation; miscible pressure; enhanced oil recovery
With the increasingly complex development of new oil fields, new problems in the development of oil fields in Xinjiang are becoming more and more prominent [1]. The growth of new proven reserves continues to be strong [2,3], but mainly low permeability and extra-low permeability reserves. And it is urgent to explore new development methods [3,4]. Low permeability and ultra-low permeability reservoirs account for increasing proportion of thin oil production, and there are some problems such as injection-production contradiction [5,6], low reservoir pressure and poor water drive development effect make it difficult to achieve standard recovery [7]. The developed oilfields in Xinjiang oilfield are generally in the middle and late stage of high water cut, high decline, low oil production rate and low efficiency. So it is necessary to study new development methods including CCUS to further improve oil recovery [8–10].
The development of CO2 oil flooding technology in the United States was relatively early, with basic research carried out in 1950 [11,12], the first patent application for CO2 oil flooding technology in 1952, and the commercialization and promotion of the technology [13,14], which took 30 years. It has gone through four stages: basic research, technology research, industrial testing and commercial promotion, and has formed a series of supporting technologies [15,16]. In the industrial test stage, it has been verified that CO2 mixed-phase flooding can significantly improve the recovery rate [17,18], and has developed dynamic monitoring technology of CO2 oil flooding [19], CO2 oil flooding adjustment technology represented by water-gas alternation and economic evaluation technology of CO2 oil flooding engineering system [20,21]. In the commercial promotion stage, it has developed integrated technology of large PV injection CO2 oil flooding and burial [22,23], chemically assisted mixing reduction and flow control technology [24], output gas recycling technology and gravity stabilization flooding technology and gravity stabilization flooding technology [25].
Since the commercial promotion in the 1980s, with the development and progress of technology, the annual oil production of CO2 flooding has been increasing [26], and the current annual oil production is above 13 million tons [27]; the magnitude of recovery enhancement has also increased greatly compared with 20 years ago, and the average recovery enhancement abroad is 10%–20%, with the highest value reaching 30% [28].
So far, relevant data show that CCUS and its application have been carried out worldwide and achieved remarkable results [29]. CCUS pilot tests or industrial tests have been carried out in Jilin oilfield and Daqing oilfield of CNPC, and certain results have been achieved, but no relevant studies have been carried out for conglomerate reservoirs with strong inhomogeneity, especially for strongly water-sensitive low-permeability conglomerate reservoirs. Therefore, the objectives of this study are to explore cost-effective methods to improve the recovery rate of developed conglomerate reservoirs and to explore ways to effectively utilize the new proven low-permeability reserves. Firstly, the minimum miscible pressure of CO2 flooding was determined by using the thin tube experiment model, and then the change of oil phase state after CO2 injection was further studied by CO2 gas expansion experiment. Then, in order to better simulate the real reservoir conditions of conglomerate reservoir, a two-dimensional plane visualization model is used to analyze the microscopic oil displacement mechanism of CO2. Finally, the development effect of CO2 flooding was evaluated according to the development dynamics of CO2 test injection well group in reservoir A.
2 Selection of CO2 Flooding Test Area for Conglomerate Reservoirs
The selection principle of CO2 flooding test area of conglomerate reservoir in Junggar basin is as follows. (1) The pilot area is representative. (2) The CO2 flooding test area has great potential of remaining oil after water flooding. (3) There should be sufficient CO2 gas source near the CO2 flooding test area. (4) The well condition of injection production well pattern in CO2 flooding test area remains good.
The selected reservoir has obvious characteristics of low permeability, strong water sensitivity, strong velocity sensitivity and strong salt sensitivity. There are prominent contradictions such as continuous rise of injection pressure of water injection wells, serious shortage of water injection, continuous decline of oil well pressure, insufficient liquid supply and so on. In order to improve reservoir recovery, it is urgent to change the oil displacement mode. According to the screening conditions of CO2 miscible flooding, the reservoir has moderate temperature and large oil saturation pressure difference, which is easy to meet the conditions of CO2 miscible flooding. At the same time, the reservoir has the advantage of being close to CO2 gas source. After the successful test, the conditions for popularizing CCUS test project are met. Therefore, it is decided to conduct CCUS pilot test for this reservoir.
2.2 Overview of Reservoir in Test Area
The structural form of the target area is simple, which is a southeast inclined monoclinic layer. The internal faults are not developed, and the dip angle of the stratum is only 2°–5°. The buried depth of the test area is 2530.0∼2677.5 m, the average buried depth is 2617.0 m, the stratum thickness is 147.5∼206.0 m, and the average stratum thickness is 173.7 m, of which the stratum thickness of main layer S7 is 118.2∼129.2 m, and the average stratum thickness is 123.6 m. The target area is fan delta facies, and the provenance direction is NW.
According to the analysis of core data, the reservoir porosity range in the target area is 2.71%∼20.31%, with an average of 10.32%, and the reservoir permeability range is 0.02∼1576.27 mD, with an average of 2.11 mD.
The test area has been put into operation since 1996. From 2011 to 2012, the reverse seven point well pattern was adopted to enter the comprehensive development stage. The injection production well spacing is 200 m. A total of 58 wells were put into operation, including 43 oil wells and 15 water wells. As of January 2019, the current daily water injection is 67.55 m3, and the cumulative water injection is 36.21 × 10⁴ m3. The daily oil production is 12.23 t, and the cumulative oil production is 20.87 × 10⁴ t, cumulative liquid production is 45 × 104 t, the comprehensive water cut of the reservoir is 63.97%, the recovery degree of the reservoir is 10.83%, the monthly injection production ratio of the reservoir is 1.55, the cumulative injection production ratio is 0.59, and the cumulative deficit volume is 24.91 × 10⁴ m3.
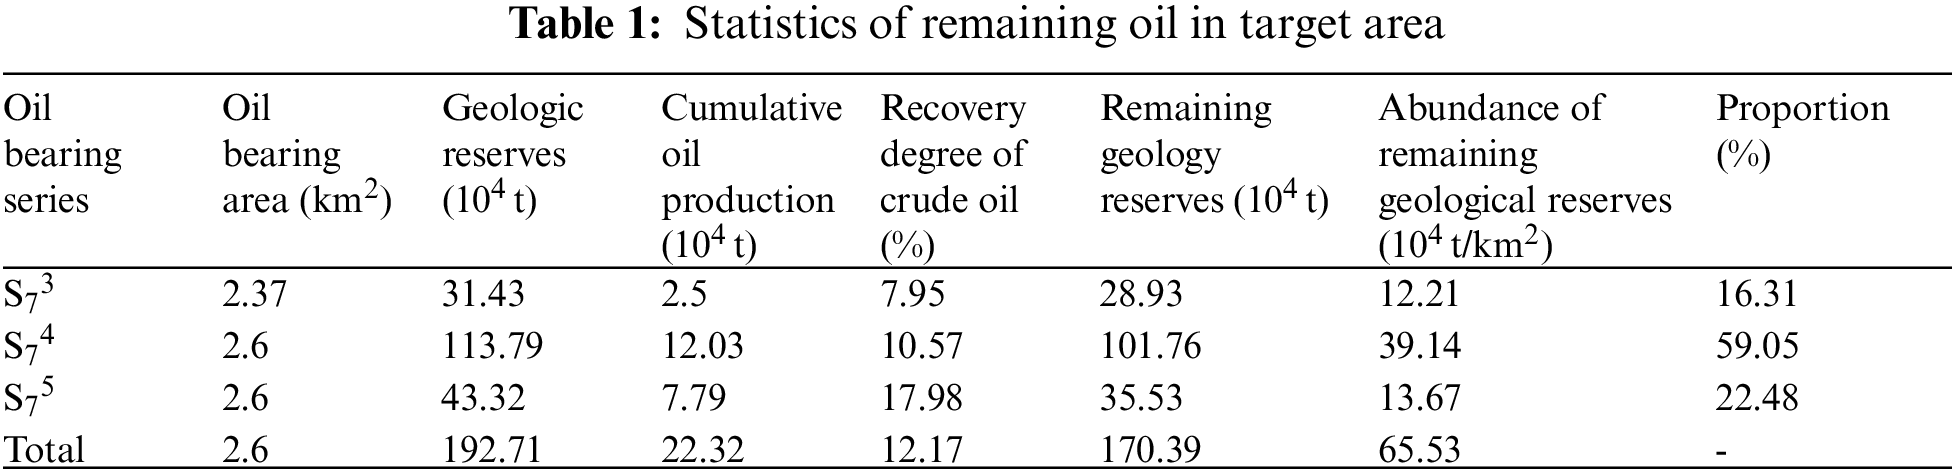
2.3 Residual Oil Potential in the Target Area
Based on the current well network, the water-flooding recovery rate of the test area was calibrated at 13.4% using the decreasing method, the degree of recovery vs. water content method, and the numerical model method. The gas-flooding recovery rate is predicted to be 40% using the numerical model method.
The remaining oil in the test area contains high oil saturation, with an average remaining geological reserve of 3.8 × 10⁴ t in a single well and an average remaining recoverable reserve of 1.22 × 10⁴ t (gas flooding) in a single well, which is greater than the limit cumulative oil production of 1.04 × 10⁴ t and has the potential for gas flooding adjustment. In the plane, the remaining oil is mainly concentrated in the middle of the test area; in the longitudinal direction, it is mainly concentrated in S74 (Table 1).
The numerical simulation results show that the oil saturation of the remaining oil in the test area is high (Fig. 1), and the oil saturation of the remaining oil near most of the wells is greater than 45%, which exceeds the lower reservoir limit for water flooding.
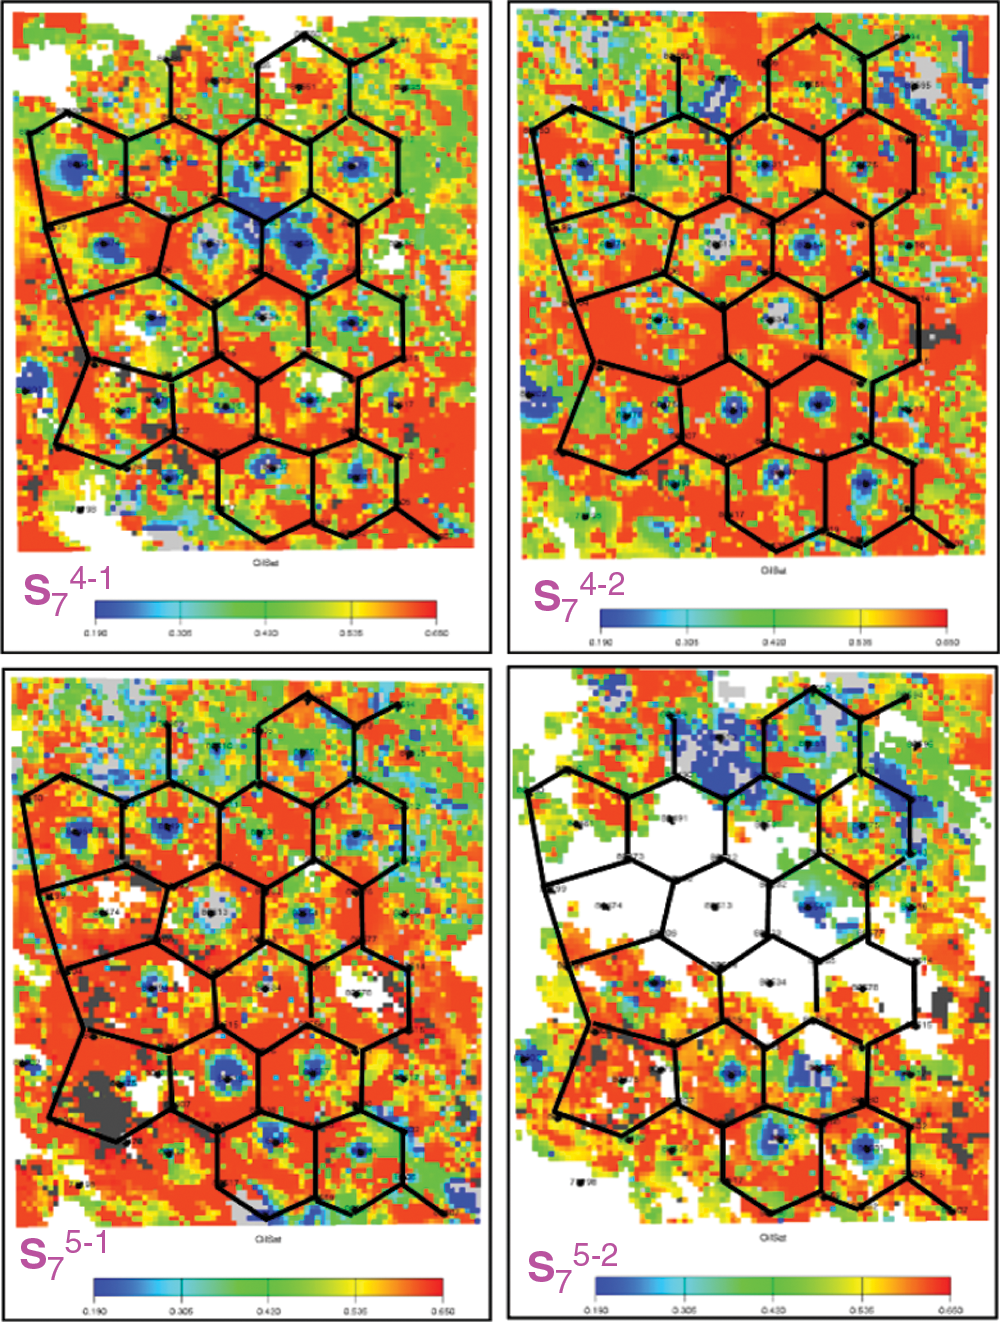
Figure 1: Distribution of remaining oil in each oil-bearing sublayer in the study area
3 Laboratory Experimental Evaluation of CO2 Flooding
3.1 Experiment on Miscibility of CO2 Flooding
3.1.1 Determination Method of Minimum Miscible Pressure
The experiments used the fine tube model to determine the minimum mixing pressure for CO2 flooding by varying the repulsion pressure and obtaining the CO2 flooding efficiency vs. repulsion pressure curve. The fine tube experimental method determines the multiple contact minimum mixing pressure.
3.1.2 Experimental Device and Samples
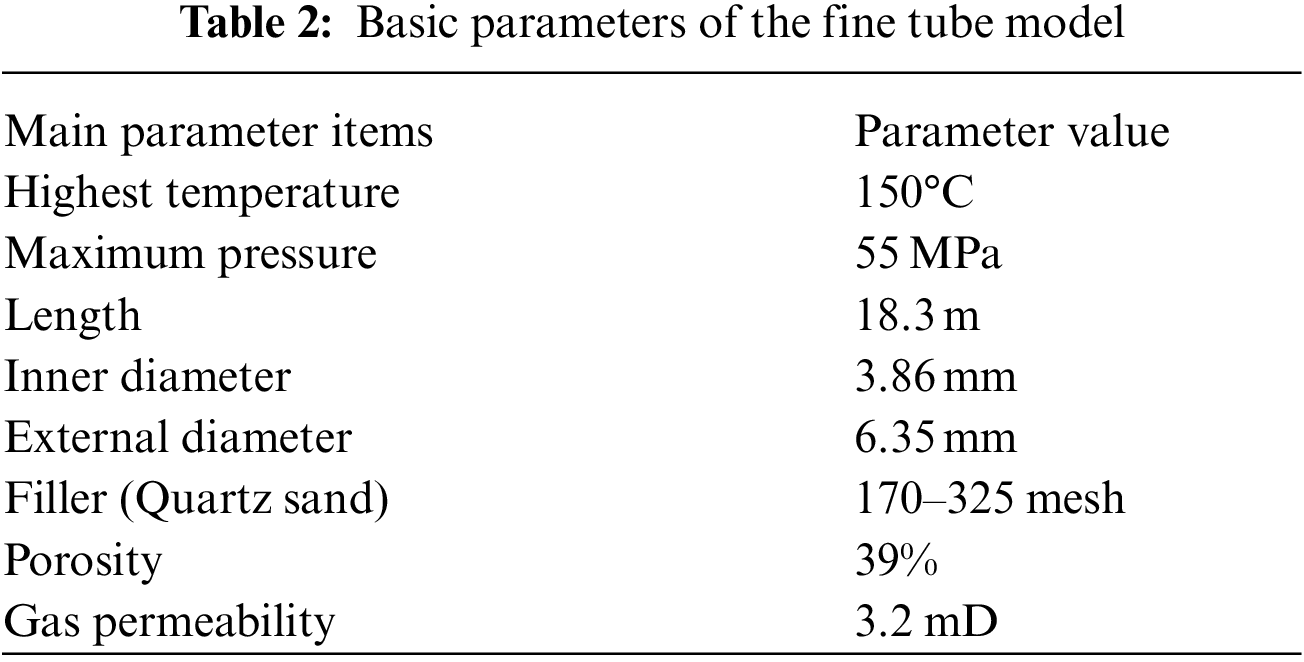
The thin-tube experimental setup used in this study was self-assembled, and the flow chart of the thin-tube experiment is shown in Fig. 2. And the main parameters of the key component of the thin-tube model are shown in Table 2.
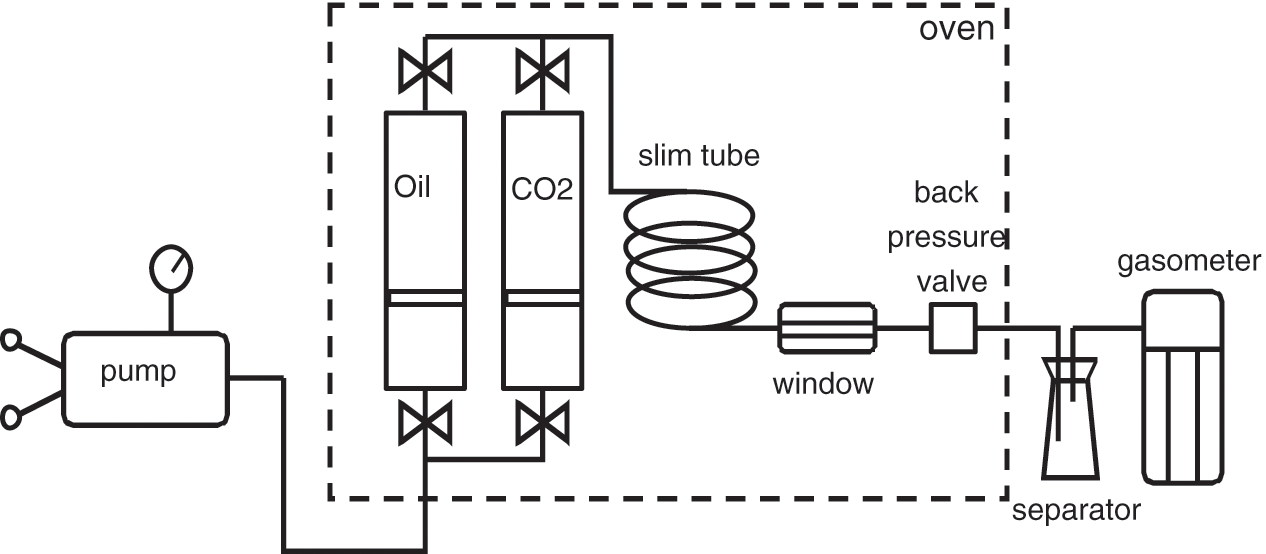
Figure 2: Flow chart of the fine tube experiment
The experimental samples were stratigraphic oil samples from the test area, laboratory compounding of degassed oil samples from the surface wellhead of well 80553 and natural gas. The purity of injected CO2 is 99.95 mol%.
3.1.3 Results of the Fine Tube Experiment
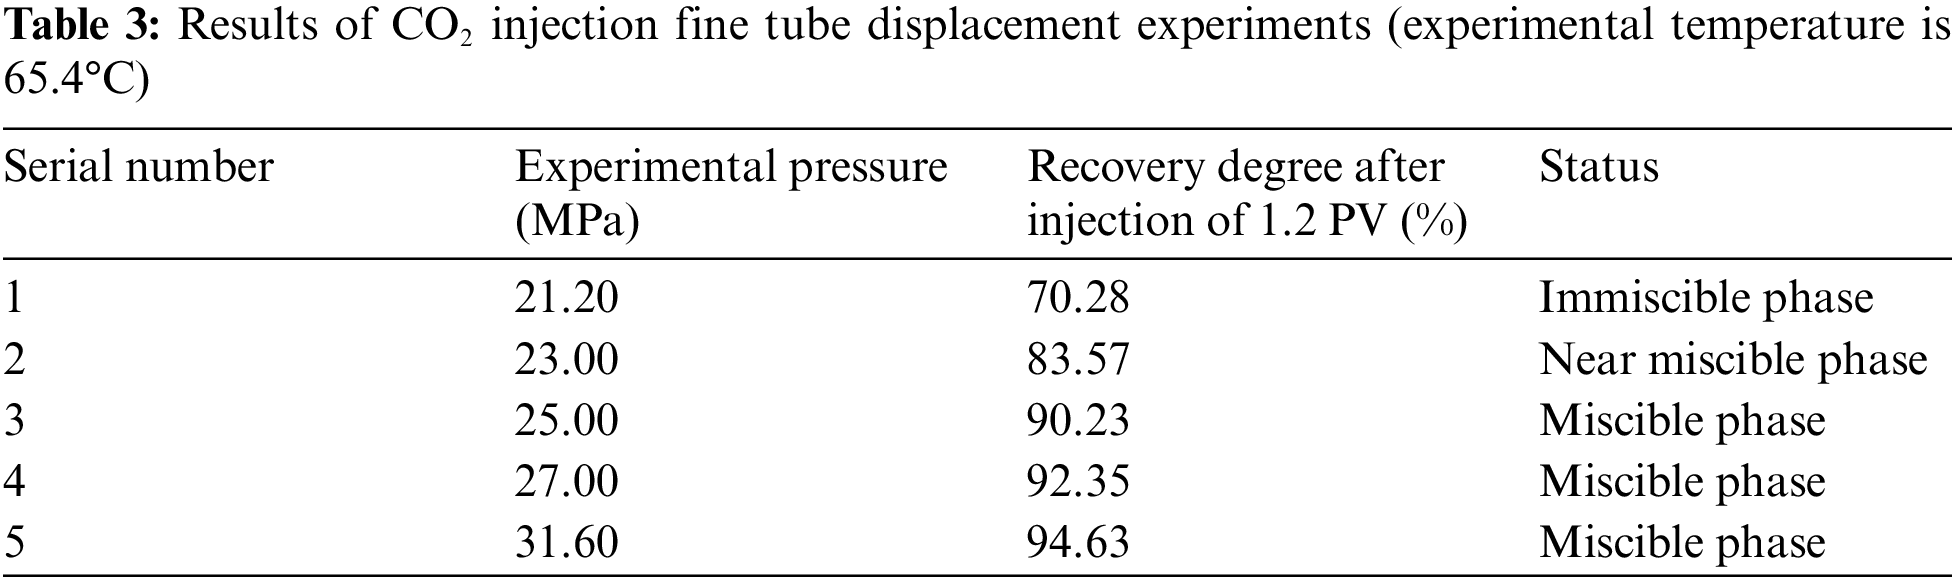
Five CO2 gas flooding thin-tube model displacement experiments were conducted at the formation temperature (65.4°C) in the test area. The displacement pressures of the five experiments were 21.2, 23.0, 25.0, 27.0 and 31.6 MPa, respectively. And the 31.6 MPa is the original formation pressure of the reservoir.
When the volume of CO2 injected into the fine tube is 1.2 PV, the crude oil recovery degree of five thin pipe experiments in the test area is shown in Table 3. The relationship curve between recovery degree and displacement pressure is shown in Fig. 3.
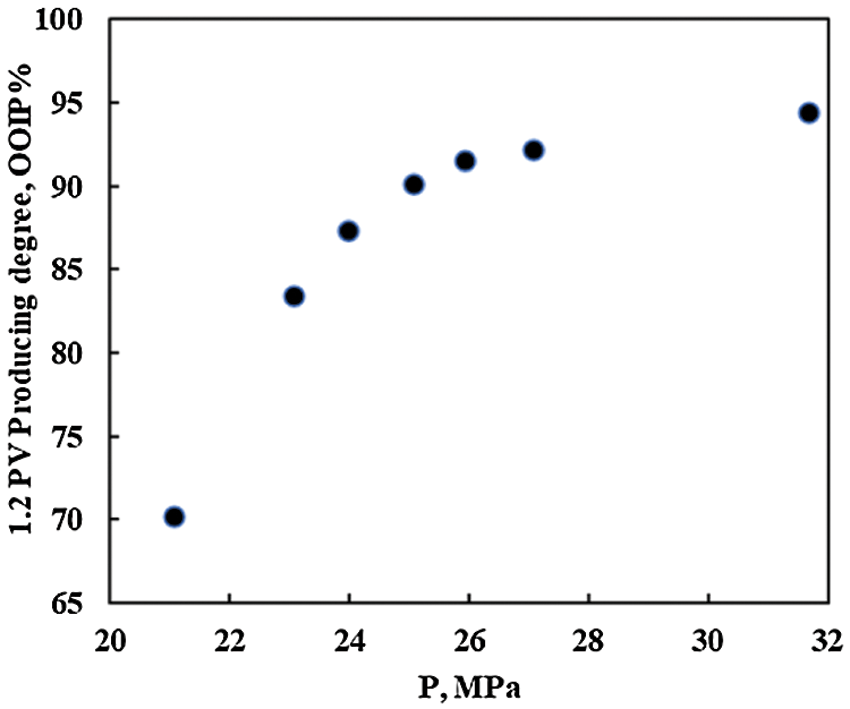
Figure 3: Relationship between the degree of CO2 recovery from the fine tube experiment and the displacement pressure
The pressure corresponding to the intersection of the miscible segment and the miscible segment curve in the figure is 24.1 MPa. The degree of recovery is relatively low when the replacement pressure is less than 24.1 MPa and increases significantly with the increase of the replacement pressure, which is a non-mixed-phase replacement process; the degree of recovery is high (>95%) when the replacement pressure is greater than 24.1 MPa, and there is only a small increase in the degree of recovery when the replacement pressure continues to increase. The flooding mechanism has changed to miscible displacement. Based on the experimental data of fine tube displacement, it can be determined that the minimum miscible pressure for the crude oil to reach the mixed-phase in the reservoir of the test area is 24.1 MPa.
3.2 Formation oil Expansion Experiment with CO2 Injection
The phase change of the crude oil in the formation in the test area after CO2 injection was investigated by CO2 plus gas expansion experiment. The experimental oil samples were laboratory compounded from degassed oil samples from the surface wellhead of well 80553 and natural gas. The purity of the CO2 gas samples was 99.95 mol%. A total of seven gas expansion experiments were conducted at formation temperature.
The experimental results showed that the saturation pressure of the formation crude oil increased significantly after the injection of CO2, and the more CO2 was injected, the higher the saturation pressure was. When the content of injected CO2 in formation crude oil was 55.29 mol%, the saturation pressure of CO2-formation crude oil system reached 31.60 MPa, as is shown in Table 4.
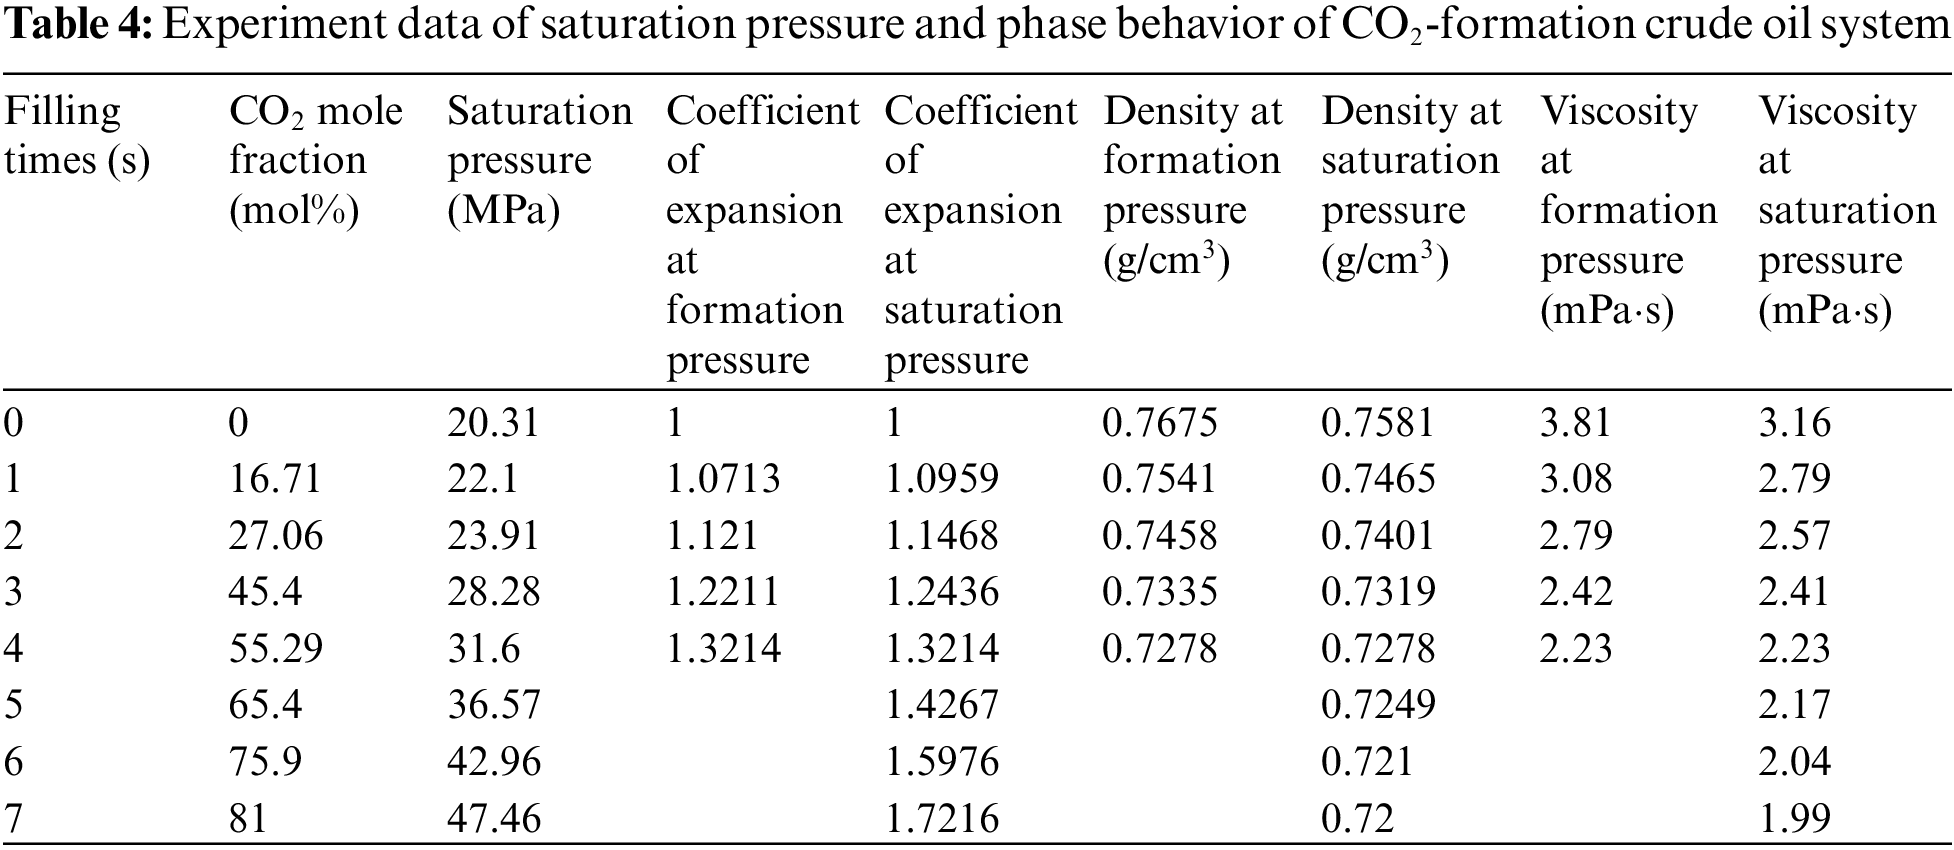
The experimental results show that CO2 has strong ability to expand and dissolve the formation oil in the test area, as well as a good viscosity reduction effect. Increasing the injection pressure, the ability of CO2 to expand the volume of crude oil and reduce the viscosity of crude oil was enhanced, which was beneficial to improve the recovery of crude oil (Figs. 4–7).
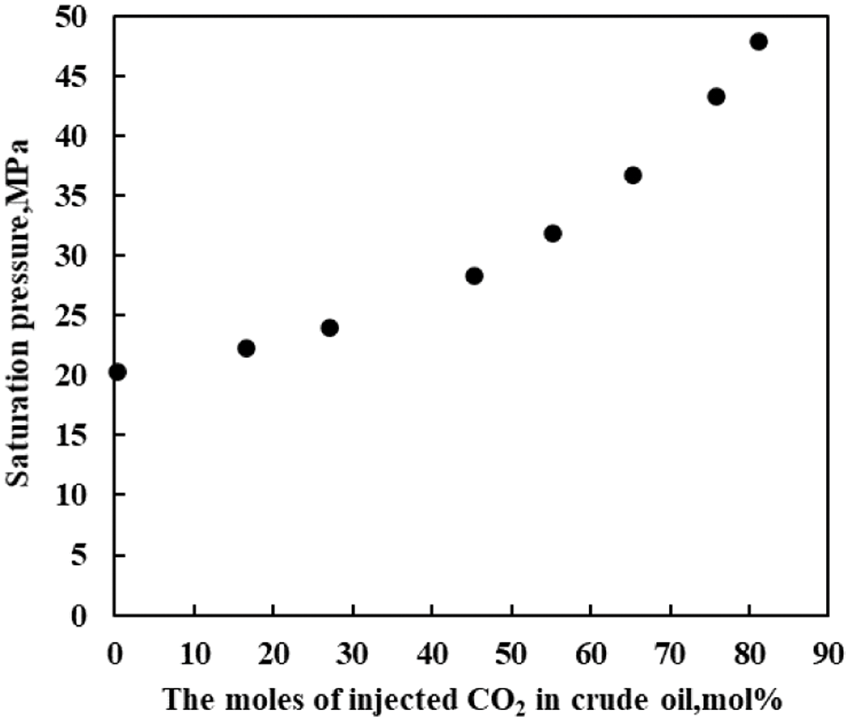
Figure 4: P-X diagram of crude oil from CO2-injected strata
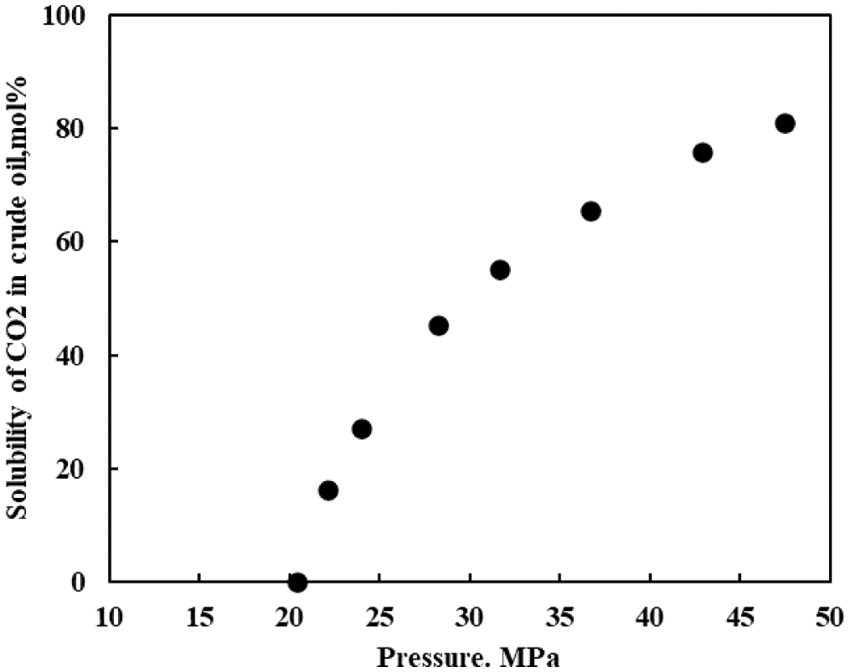
Figure 5: Solubility curve of CO2-formation crude oil
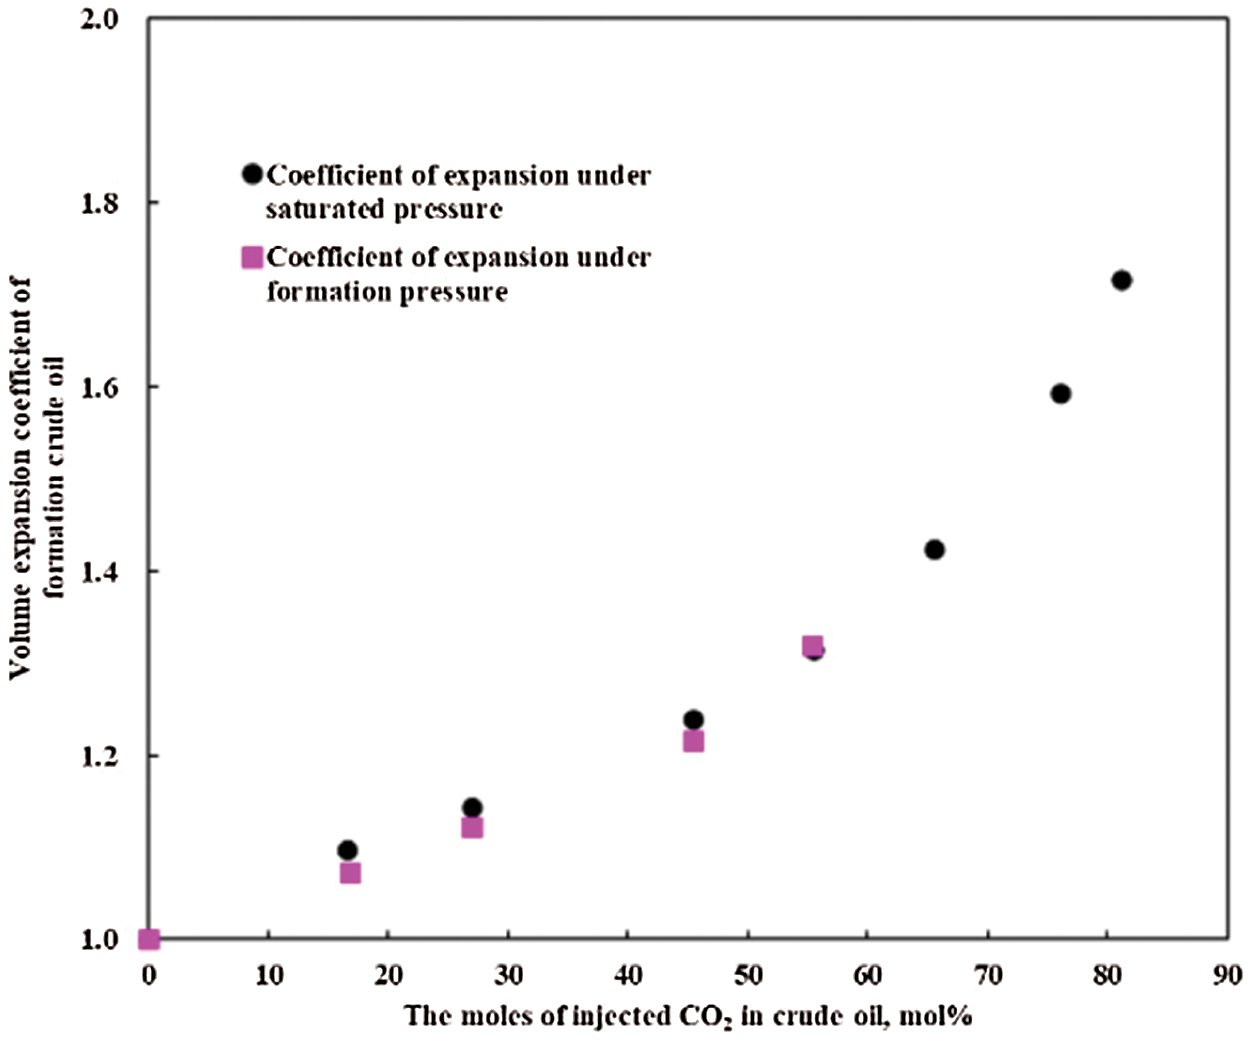
Figure 6: Volume expansion curve of CO2-formation crude oil
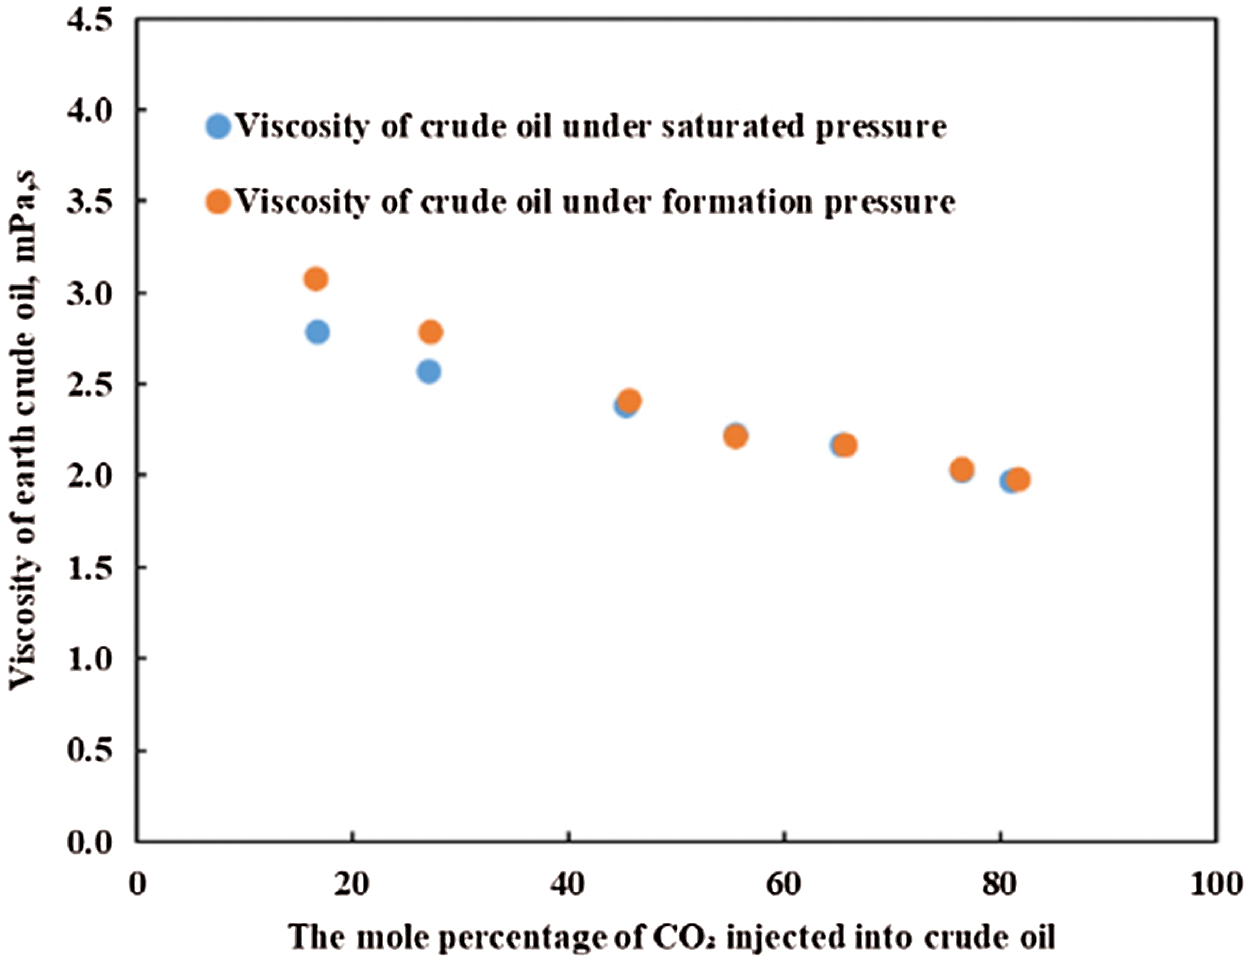
Figure 7: Viscosity curve of CO2-formation crude oil
3.3 Experiment of CO2 Miscible Flooding
We selected natural cores for CO2 oil displacement experiment, set back pressure of 24 MPa and gas injection rate of 0.3 ml/min. The experimental results showed that the water injection during water flooding broke through after about 0.64 PV, and the recovery rate was 43.42% at the breakthrough, and the water content rate increased rapidly after the breakthrough. The water content reached 100% when the water flooding reached 1.0 PV, and the water flooding recovery rate was 51.11%. After the completion of water flooding, it is transferred to gas flooding. When the gas injection is 0.4 PV, the CO2 breakthrough occurs. At this time, the recovery factor is 52.74%. When the gas injection volume reaches 1.5 PV, gas channeling is serious, and the gas oil ratio is 2010. At this time, the recovery rate basically does not change, and the final recovery rate is 70.37%, as shown in Fig. 8.
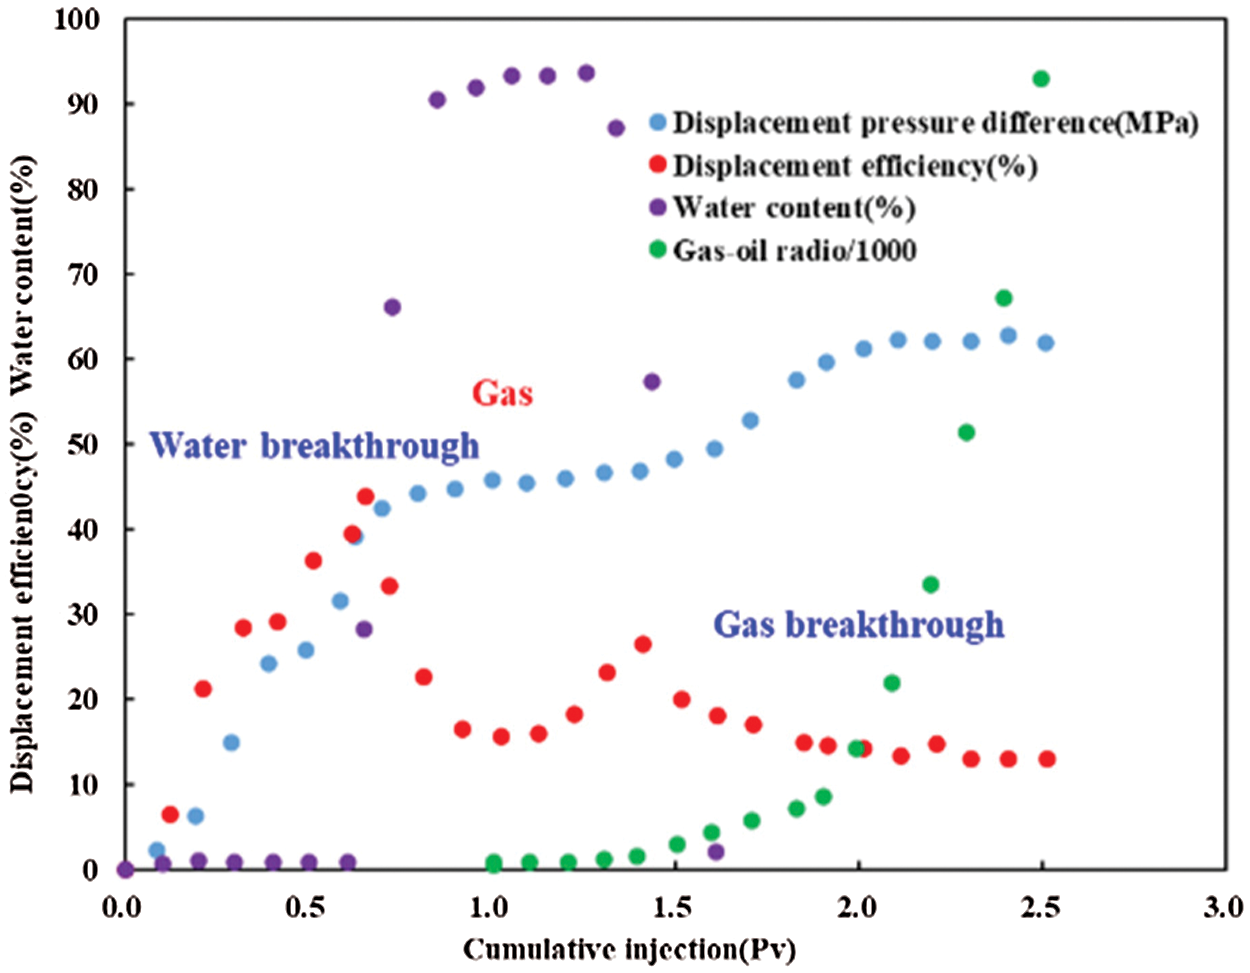
Figure 8: Water and gas flooding dynamic data (The core permeability is 9.23 mD)
In order to better simulate the real reservoir conditions of conglomerate reservoir, the outcrop is drilled from the field for processing, and a two-dimensional plane visual model is made to further analyze the micro oil displacement mechanism of CO2.
After water flooding, the model was subjected to continuous CO2 injection gas flooding experiment. The gas injection rate was 0.3 ml/min, and the experimental temperature was maintained at 67°C. The experimental data of gas flooding were recorded and the experimental process was observed. The results of gas drive experiment show that after CO2 enters the model, it displaces crude oil from three directions, respectively. During the experiment, it can be clearly found that the area used in this area is becoming larger and larger. In the final stage of gas flooding, gas channeling is serious, and there is basically no oil at the outlet. After gas flooding, the oil displacement effect is greatly improved compared with water flooding, the swept area is significantly expanded, and the recovery degree is increased, as shown in Fig. 9.
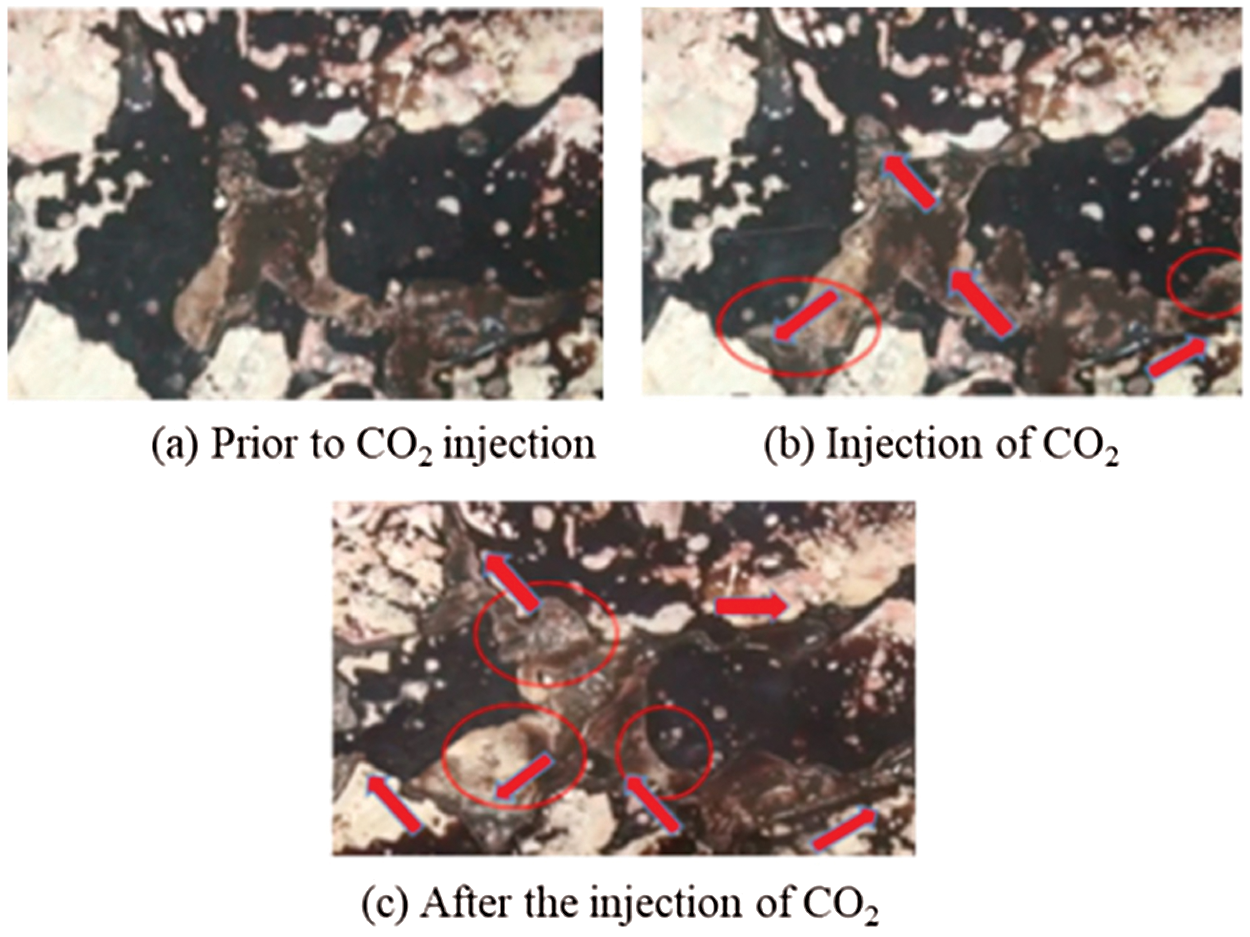
Figure 9: CO2 flooding experiment process
Experimental results show that in the stage of water flooding, most of the oil phase in the large pore is driven away, while there is still a large amount of remaining oil in the small pore. In the late stage of water flooding, there is an obvious channeling channel. After CO2 flooding, it can be found that the remaining oil is significantly reduced, and the area occupied by the remaining oil cluster is much reduced, and the gas channeling is obvious in the late stage of CO2 flooding. The experimental results show that CO2 flooding in conglomerate reservoir has good oil-increasing potential, but gas injection parameters should be optimized to prevent premature gas channeling from affecting its development effect.
4 Effect Analysis of CO2 Injection Test in Well Group
In order to evaluate the reservoir suction capacity and formation pressure recovery level, and provide geological and engineering parameters for the preparation of reservoir development plan, two well groups are selected in the test area for injection test.
4.1 Basic Information on CO2 Injection Test
Through the screening of several indicators such as well condition, cementing quality and water breakthrough effect of oil wells, well 80513 which can inject water normally and well 80534 which cannot inject water are finally selected as CO2 injection test well group. On August 11, 2017, the two well groups started the on-site trial injection of CO2, and the trial injection was completed in mid November, with a cumulative injection of 3789.8 t CO2. At the same time, in order to quickly restore formation pressure and delay gas channeling, the oil well is shut in during test injection.
4.2 Development Performance Analysis of Well Group after CO2 Injection
4.2.1 Substantial Increase in CO2 Absorption Capacity of Single Wells Compared to Water Absorption Capacity
The injection pressure of well 80534 was 23.17 MPa at the late stage of water injection and no water could be injected; when it was changed to CO2 injection, the injection pressure dropped to 19.5 MPa and the daily CO2 injection volume could be maintained at about 30 t.
By comparing the water and gas injection volumes of well 80513 at the same injection pressure, it can be seen that at an injection pressure of 20 MPa, the daily water injection volume is between 12 and 20 t, and the daily CO2 injection volume is between 50 and 60 t. The CO2 injection capacity is about 2.5 to 3.7 times of the water injection capacity. Comparing the effective permeability of the formation before and after 80513 injection, it can be seen that there is a substantial increase in the effective permeability of the formation after CO2 injection, from 1.88 to 6.35 mD.
4.2.2 The Profile Production Degree in Gas Injection Stage is Better Than That in Water Drive Stage
In the early stage of water injection development, the overall mobilization of well 80513 was relatively uniform, and the later suction levels were mainly concentrated in S74-2 and S75-1, which have better physical properties; after the CO2 injection was changed, the initial suction profile continued the characteristics of the water-floodingn stage, with S74-2 and S75-1 mainly suctioned, and later, influenced by the water section plug and gas injection rate, the upper part of the reservoir with poorer physical properties was mainly suctioned.
Well 80492 had uneven profile mobilization at the early stage of water injection development, mainly dominated by S74-1 fluid production. After CO2 injection, the profile mobilization was more uniform than water flooding and the degree of mobilization increased from 76.9% to 100% in the water flooding stage, with a large variation in the later stage due to reservoir inhomogeneity.
4.2.3 Rapid Recovery of Formation Pressure after CO2 Injection
The average formation pressure of production wells before injection test is 17.67 MPa. After 45 days of CO2 injection, the average formation pressure of single well is 25.67 MPa, and the average formation pressure of production wells tested in the first half of 2018 is 23.54 MPa, which is higher than the average formation pressure before trial injection, as shown in Fig. 10. At the same time, from the perspective of wellhead oil pressure, in the 10 oil production wells, the oil pressure rises rapidly in 4 wells, rises slowly in 2 wells, remains stable in 2 wells and fluctuates in 2 wells. Among them, the oil wells in well group 80513 are mainly rising rapidly, while the pressure of oil wells in well group 80534 varies greatly.
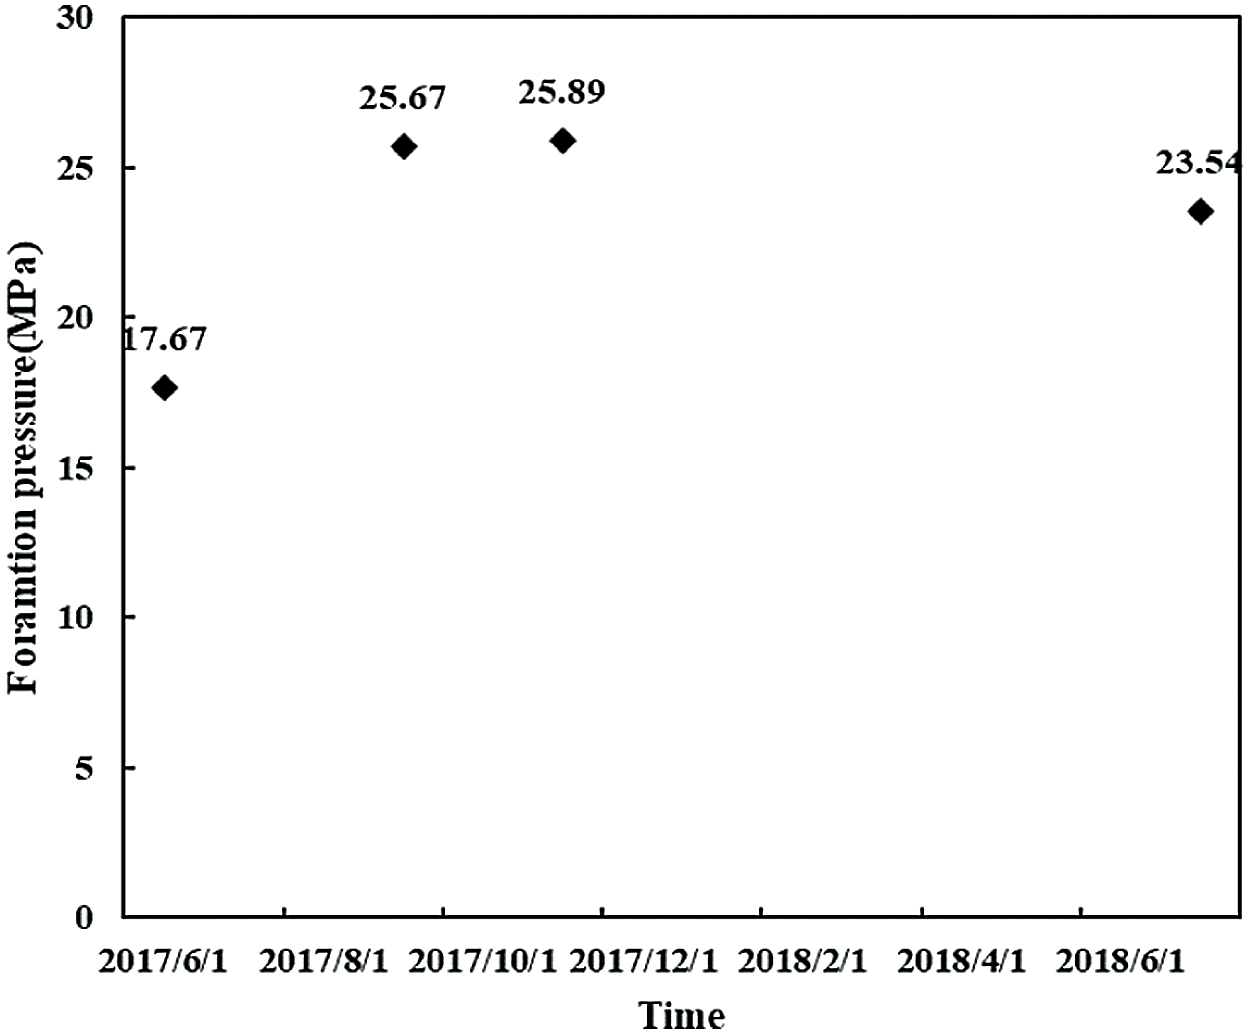
Figure 10: Formation pressure variation curve in well 80492
4.2.4 The Daily oil Production after CO2 Injection is Significantly Higher Than That in Water Flooding Stage
Only 4 of the 10 oil wells in the well group before CO2 test injection adopt the mode of interleaved production. After the test injection, 9 oil wells are opened for production, and 5 wells have good results, with an efficiency of 50%, as shown in Table 5.
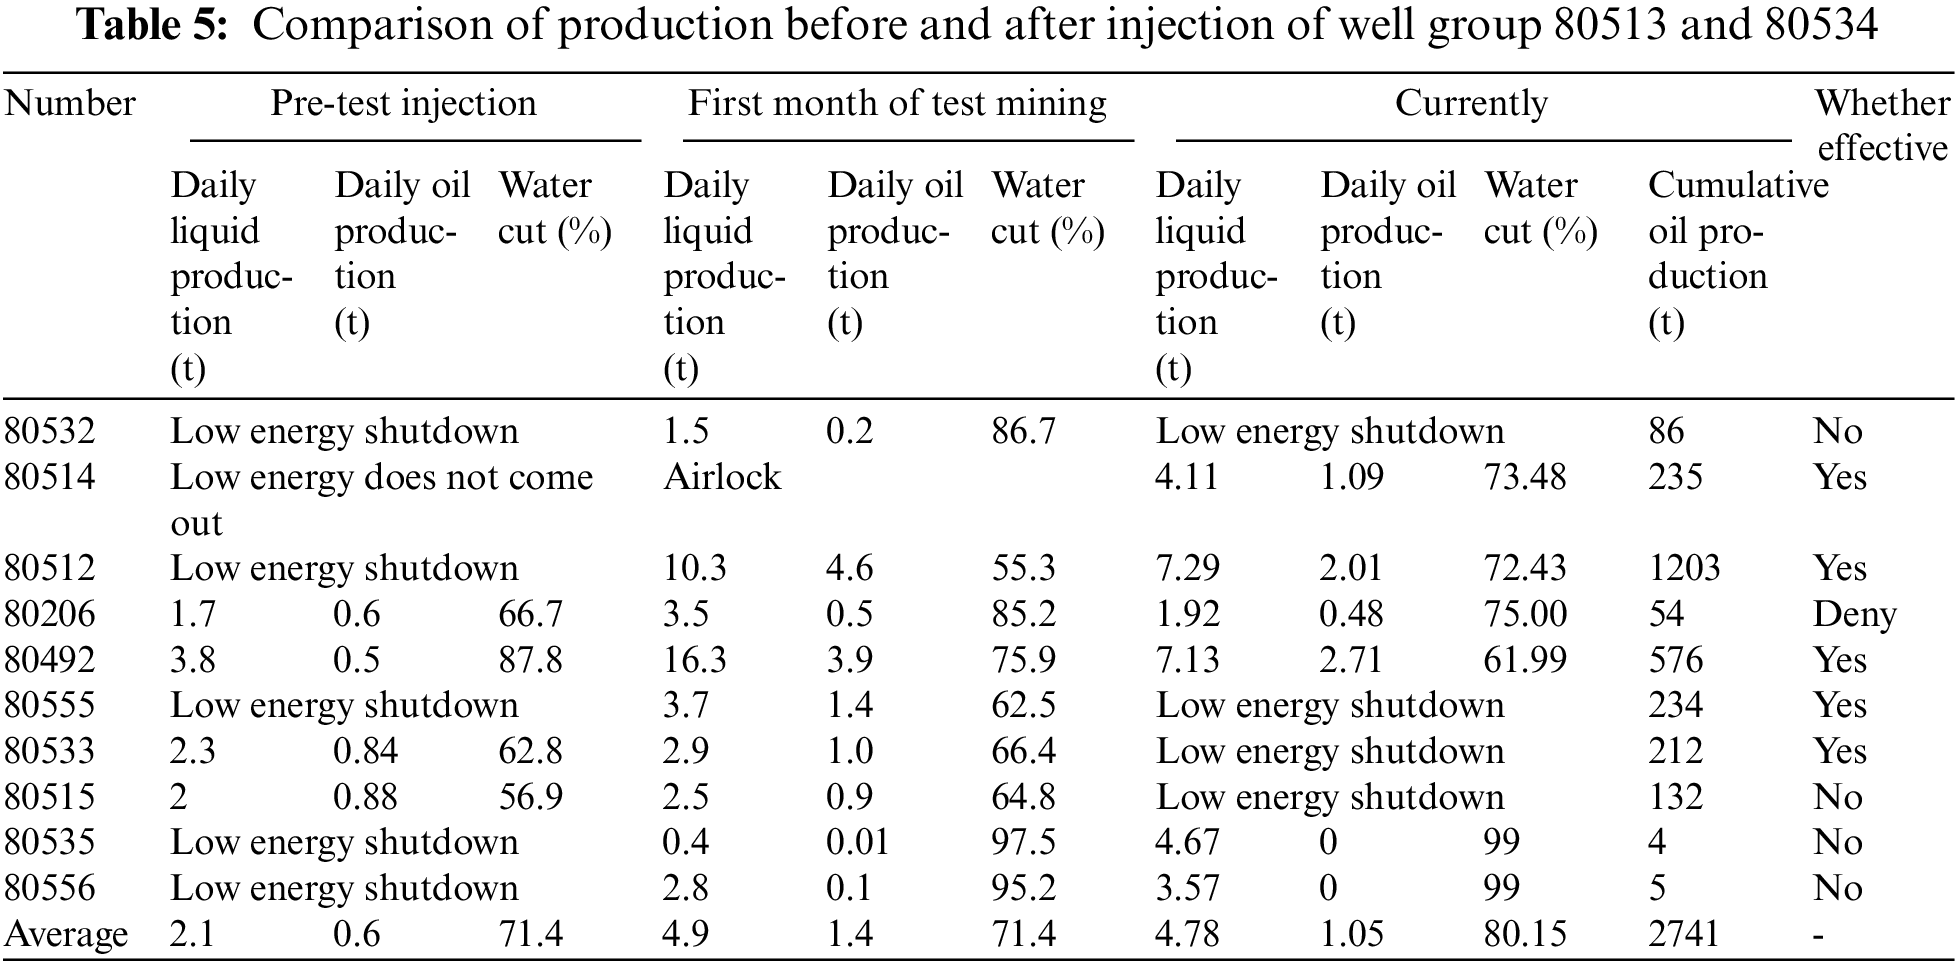
Through the analysis of field injection effect, it can be seen that the factors affecting the development effect of CO2 flooding are complicated, and not all oil Wells can be effective. The effectiveness of oil well is closely related to formation physical properties, inter-well connectivity, water content, etc. It is necessary to carry out a fine anatomy in the next step and optimize gas injection parameters, so as to further improve CO2 flooding development effect of conglomerate reservoir.
(1) Through the evaluation of the production dynamics and remaining oil in the test area, the residual oil saturation is high, indicating that the test area has a large residual oil potential.
(2) The minimum CO2/crude oil miscible pressure was determined to be 24.1 MPa by fine tube experiments.
(3) The experimental results of CO2 aerated expansion showed that the saturation pressure of formation crude oil increased significantly after the injection of CO2, and the more CO2 was injected, the higher the saturation pressure was. When the content of injected CO2 in formation crude oil was 55.29 mol%, the saturation pressure of CO2-formation crude oil system reached 31.60 MPa.
(4) Two-dimensional planar visualization model experiments show that the remaining oil after water flooding mainly exists in the form of clusters, membranes, columns and blind ends, and some remaining oil after gas flooding still exists in the form of islands, clusters and membranes and there is obvious gravity overtopping phenomenon. By carrying out CO2 flooding on the basis of water flooding, the wave efficiency is significantly improved. The analysis of the field trial injection effect shows that: the single well CO2 absorption capacity is significantly increased compared with the water absorption capacity; the profile activation degree in the gas injection stage is better than that in the water flooding stage; the CO2 injection restores the formation pressure quickly; the oil production after gas injection in the trial recovery effect is significantly increased compared with that in the water flooding stage.
Funding Statement: The authors received no specific funding for this study.
Conflicts of Interest: The authors declare that they have no conflicts of interest to report regarding the present study.
1. Wu, M., Cao, J., Wang, X. L., Tang, Y., Wang, B. et al. (2014). Hydrocarbon generation potential of triassic mudstones in the Junggar Basin, Northwest China. AAPG Bulletin, 98(9), 1885–1906. DOI 10.1306/03111413022. [Google Scholar] [CrossRef]
2. Chen, Z. H., Cao, Y. C., Wang, X. L., Qiu, L. W., Tang, Y. (2016). Oil origin and accumulation in the Paleozoic Chepaizi-Xinguang field, Junggar Basin, China. Journal of Asian Earth Science, 115, 1–15. DOI 10.1016/j.jseaes.2015.09.019. [Google Scholar] [CrossRef]
3. Du, J. H., Zhi, D. M., Li, J. Z., Yang, D. S., Tang, Y. (2019). Major breakthrough of Well Gaotan 1 and exploration prospects of lower assemblage in southern margin of Junggar Basin, NW China. Petroleum Exploration and Development, 46(2), 216–227. DOI 10.1016/S1876-3804(19)60003-0. [Google Scholar] [CrossRef]
4. Lu, X., Shi, J. A., Zhang, S., Zou, N., Zhang, S. (2015). The origin and formation model of permian dolostones on the northwestern margin of Junggar Basin, China. Journal of Asian Earth Science, 105, 456–467. DOI 10.1016/j.jseaes.2015.02.024. [Google Scholar] [CrossRef]
5. Nobakht, M., Moghadarn, S., Go, Y. (2007). Effects of viscous and capillary forces on CO2 enhanced oil recovery under reservoir conditions. Energy and Fuels, 21(6), 3469–3476. DOI 10.1021/ef700388a. [Google Scholar] [CrossRef]
6. Zhao, F., Wang, P., Huang, S., Hao, H., Lu, G. (2020). Performance and applicable limits of multi-stage gas channeling control system for CO2 flooding in ultra-low permeability reservoirs. Journal of Petroleum Science and Engineering, 192, 107336. DOI 10.1016/j.petrol.2020.107336. [Google Scholar] [CrossRef]
7. Gong, Y., Gu, Y. (2015). Miscible CO2 simultaneous water-and-gas (CO2-SWAG) injection in the bakken formation. Energy and Fuels, 29(9), 5655–5665. DOI 10.1021/acs.energyfuels.5b01182. [Google Scholar] [CrossRef]
8. Ding, M., Yuan, F., Wang, Y., Xia, X., Chen, W. et al. (2017). Oil recovery from a CO2 injection in heterogeneous reservoirs: The influence of permeability heterogeneity, CO2-oil miscibility and injection pattern. Journal of Natural Gas Science and Engineering, 44, 140–149. DOI 10.1016/j.jngse.2017.04.015. [Google Scholar] [CrossRef]
9. Li, Z. F., Su, Y. L., Li, L., Hao, Y. M., Wang, W. D. et al. (2022). Evaluation of CO2 storage of water alternating gas flooding using experimental and numerical simulation methods. Fuel, 311, 12248. DOI 10.1016/j.fuel.2021.122489. [Google Scholar] [CrossRef]
10. Stalkup, F. I. (1978). Carbon dioxide miscible flooding: Past, present, and outlook for future. Journal of Petroleum Technology, 30(8), 1102–1112. DOI 10.2118/7042-PA. [Google Scholar] [CrossRef]
11. Monger, T., Coma, J. (1988). A laboratory and field evaluation of the CO2 huff and puff process for light-oil recovery. SPE Reservoir Engineering, 3(4), 1168–1176. DOI 10.2118/15501-PA. [Google Scholar] [CrossRef]
12. Bou-Mikael, S., Palmer, F. S. (1989). Field-derived comparison of tertiary recovery mechanisms for miscible CO2 flooding of water drive and pressure-depleted reservoir in South Louisiana. SPE Annual Technical Conference and Exhibition, San Antonio, TX, USA. [Google Scholar]
13. Darvish, G. R., Lindeberg, E. G. B., Holt, T., Kleppe, J., Utne, S. A. (2006). Reservoir conditions laboratory experiments of CO2 injection into fractured cores. SPE Europec/EAGE Annual Conference and Exhibition, Vienna, Austria. [Google Scholar]
14. Yang, D. Y., Gu, Y. A. (2005). Interfacial interactions between crude oil and CO2 under reservoir conditions. Petroleum Science and Technology, 23(9–10), 1099–1112. DOI 10.1081/LFT-200035536. [Google Scholar] [CrossRef]
15. Cinar, Y., Riaz, A., Tchelepi, H. (2009). Experimental study of CO2 injection into saline formations. SPE Annual Technical Conference and Exhibition, Anaheim, California, USA. [Google Scholar]
16. Khather, M., Saeedi, A., Myers, M. B., Verrall, M. (2019). An experimental study for carbonate reservoirs on the impact of CO2-EOR on petrophysics and oil recovery. Fuel, 235, 1019–1038. DOI 10.1016/j.fuel.2018.08.094. [Google Scholar] [CrossRef]
17. Jafari Behbahani, T., Ghotbi, C., Taghikhani, V., Shahrabadi, A. (2012). Investigation on asphaltene deposition mechanisms during CO2 flooding processes in porous media: A novel experimental study and a modified model based on multilayer theory for asphaltene adsorption. Energy Fuel, 26(8), 5080–5091. DOI 10.1021/ef300647f. [Google Scholar] [CrossRef]
18. Kurtoglu, B., Sorensen, J. A., Braunberge, J., Smith, S., Kazemi, H. (2013). Geologic characterization of a bakken reservoir for potential CO2 EOR. Unconventional Resources Technology Conference, Denver, Colorado, USA. [Google Scholar]
19. Al-Mutairi, S., Abu-Khamsin, S., Okasha, T., Aramco, S., Hossain, M. (2014). An experimental investigation of wettability alteration during CO2 immiscible flooding. Journal of Petroleum Science and Engineering, 120, 73–77. DOI 10.1016/j.petrol.2014.05.008. [Google Scholar] [CrossRef]
20. Bikkina, P., Wan, J., Kim, Y., Kneafsey, T., Tokunaga, T. (2016). Influence of wettability and permeability heterogeneity on miscible CO2 flooding efficiency. Fuel, 166, 219–226. DOI 10.1016/j.fuel.2015.10.090. [Google Scholar] [CrossRef]
21. Park, H., Jiang, L., Kiyama, T., Zhang, Y., Ueda, R. et al. (2017). Influence of sedimentation heterogeneity on CO2 flooding. Energy Procedia, 114, 2933–2941. DOI 10.1016/j.egypro.2017.03.1422. [Google Scholar] [CrossRef]
22. Sharbatian, A., Abedini, A., Qi, Z., Sinton, D. (2018). Full characterization of CO2-oil properties on-chip: Solubility, diffusivity, extraction pressure, miscibility, and contact angle. Analytical Chemistry, 90(4), 2461–2467. DOI 10.1021/acs.analchem.7b05358. [Google Scholar] [CrossRef]
23. Han, L. Y., Gu, Y. A. (2014). Optimization of miscible CO2 water-alternating-gas injection in the bakken formation. Energy and Fuels, 28(11), 6811–6819. DOI 10.1021/ef501547x. [Google Scholar] [CrossRef]
24. Wang, S., Kadhum, M. J., Chen, C., Shiau, B., Harwell, J. H. (2017). Development of in-situ CO2 generation formulations for enhanced oil recovery. Energy and Fuels, 31(12), 13475–13486. DOI 10.1021/acs.energyfuels.7b02810. [Google Scholar] [CrossRef]
25. Wu, F., Shen, Q., Li, C., Sha, O. (2016). Methods of lowering the minimum miscible pressure of CO2 flooding. Chemical World, 7, 451–456. DOI 10.19500/j.cnki.0367-6358.2016.07.013. [Google Scholar] [CrossRef]
26. Abba, M. K., Al-Otaibi, A., Abbas, A. J., Nasr, G. G., Burby, M. (2019). Influence of permeability and injection orientation variations on dispersion coefficient during enhanced gas recovery by CO2 injection. Energies, 12, 23–28. DOI 10.3390/en12122328. [Google Scholar] [CrossRef]
27. Farazaneh, S., Sohrabi, M. (2015). Experimental investigation of CO2-foam stability improvement by alkaline in the presence of crude oil. Chemical Engineering Research and Design, 94, 375–389. DOI 10.1016/j.cherd.2014.08.011. [Google Scholar] [CrossRef]
28. Xua, X., Saeedia, A., Liub, K. (2016). An experimental study of combined foam/surfactant polymer (SP) flooding for carbone dioxide-enhanced oil recovery (CO2-EOR). Journal of Petroleum Science and Engineering, 149, 603–611. DOI 10.1016/j.petrol.2016.11.022. [Google Scholar] [CrossRef]
29. Huang, F., Huang, H., Wang, T., Ren, J., Zhang, L. et al. (2016). Assessment of miscibility effect for CO2 flooding EOR in a low permeability reservoir. Journal of Petroleum Science and Engineering, 145, 328–335. DOI 10.1016/j.petrol.2016.05.040. [Google Scholar] [CrossRef]
 | This work is licensed under a Creative Commons Attribution 4.0 International License, which permits unrestricted use, distribution, and reproduction in any medium, provided the original work is properly cited. |