| Energy Engineering |
DOI: 10.32604/ee.2022.021142
ARTICLE
Investigating the Effects of the Driving Cycle and Penetration of Electric Vehicles on Technical and Environmental Characteristics of the Hybrid Energy System Considering Uncertainties
1Yangzhou Polytechnic College, Yangzhou, China
2Department of Electrical Engineering Faculty, Shahid Beheshti University, Tehran, Iran
*Corresponding Authors: Jiusong Chen. Email: dn_cjs@163.com; Mojtaba Ghadamyari. Email: ghadamyari.moj@gmail.com
Received: 29 December 2021; Accepted: 19 March 2022
Abstract: Electric vehicles (EVs) have received special consideration from modern society over the past several years. Although EVs are a fine example of environmentally friendly technology and have many advantages, they relatively increase the electricity demand upon a power grid as well. Therefore, their negative impact on busvoltage and line losses should be analyzed. In this study, the effect of EV loads and their penetration on bus voltage and line losses of an IEEE-33 bussystem has been examined via two scenarios. It is important to mention that the effect of EVs on the rate of air pollution, produced by fossil fuel electricity generators, has been investigated throughout the study. Also, the key role of demand response programs in the reduction of EVs’ negative effects on the grid has also been discussed in the last scenario. Generally, the simulation of this paper provides a novel and wider perspective on EVs and their effect on grids and environmental pollution.
Keywords: Electric vehicle; buses’ voltage; line losses; environmental pollution; renewable resources; demand response
Nomenclature
| The voltage of bus | |
| The modified coefficient | |
| Self-admittance | |
| The current between bus i and | |
| Admittance between bus i and | |
| Line current | |
| Active power of bus | |
| Power losses of line | |
| Reactive power of bus |
The continual development of technology and power grid innovations provides a great opportunity for benefit from electric transportation. EVs have a major role in such systems [1–3]. Although EV have received significant consideration going back a bit more than a decade to this point, fossil fuel-based vehicles are still the majority of vehicles owned and operated today. But this matter will alter over the next decades of course. Therefore, the pros and cons of EVs should be considered in contemporary research [4–6].
According to the above-mentioned claim, EVs as a novel concept in the world has both advantages and disadvantages. Moving toward a near-zero-emission energy policy reinforces the tendency to use EVs as a green technology [7]. EVs are completely eco-friendly vehicles without any emissions and air pollution, and play a major role in the plans of many governments’ reduction of CO2 emissions [7–9]. On the other hand, gasoline-based cars and vehicles have green issues such as the greenhouse effect and global warming. Furthermore, EVs provide more convenience for charging, and there is no need for a fuel station; EVs can be charged through a common household socket easily [10]. EVs are safer than traditional cars because fuel-powered cars keep a considerable amount of combustible substance in the fuel tank at all times [11]. As another advantage, in most countries, local authorities obtain tax cuts and economic incentivews for buying electric vehicles, hence, these considerations make EVs much more affordable and cost-effective in many intances as well.
The green tax, developed countries’ policies, like the USA and Norway, and the importance of using EVs have been comprehensively discussed in [12–14]. Moreover, EVs reduce noise pollution due to their smooth and silent electric motors. On the other hand, EVs suffer from some drawbacks like anything else in the world. For instance, EVs need a long charging time but fuel-powered vehicles charging must take only a couple of minutes. Also, electric cars cause an increase in electricity demands and this issue should be considered for modern power grids [15–17]. A number of EVs’ pros and cons are presented at the end of this section by Fig. 1. Recent advances in EVs such as flexibility in charging/discharging time and vehicle-to-grid technology provide a golden opportunity to offset some disadvantages of EVs. According to [18], 59% and 16% of EV loads can be delayed for more than 8 and 24 h, respectively.
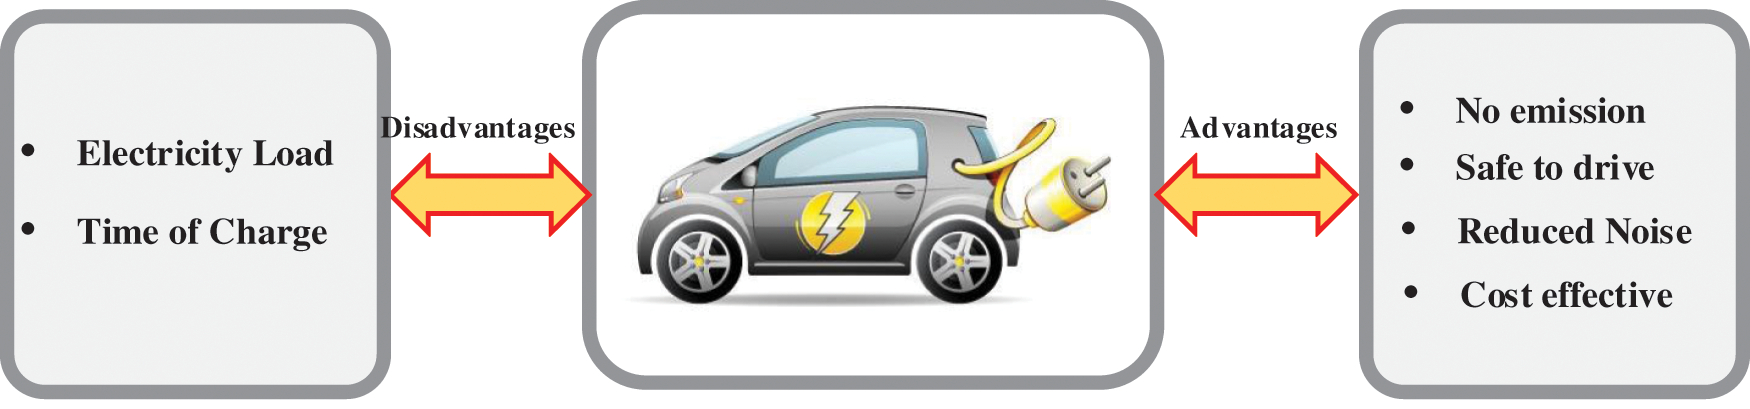
Figure 1: Some pros and cons of electric vehicles
There are a lot of works related to considering EVs and their impact on power grids. Dharmakeerthi et al. [19] have defined several problems of power grids caused by EVs and has evaluated the influence of EVs on the voltage stability of power grids under various scenarios. Subsequently, the study found that EVs may considerably reduce the stability of power grids. Zhang et al. [20] have investigated the large-scale use of EVs, and their charging load impact on the power system, and explained that this phenomenon causes continuing problems for future grids, and so should always be considered in research moving forward. The aforementioned paper has analyzed the stability of power grids by calculating the voltage stability boundary. As a result, Zhang et al. [20] have claimed that voltage instability may cause a voltage collapse in a power system, suggests that it would likely be a catastrophe.
The authors in [21] have proposed an analysis concerning EV charging loads on load demands and the stability of power grids. Also, they considered fast-charging stations in an IEEE 33 bus test system and evaluated the effect of fast charging behavior in such systems. As another sample, the effect of electric vehicle charging systems has been examined on modern low voltage distribution networks by [22]. This paper has evaluated the power factor and harmonic distortions of EV charging stations as the main aim of the research. Lyu et al. [23] have considered the mobility and number of EVs on the load margin calculation in a critical situation. Consequently, the results have been obtained through various test cases simulation. Authors in [24] evaluated the effect of EVs and controllable loads on the energy and voltage control of power systems through both regular and fast charging scenarios. Then a swarm algorithm has been employed to optimize the system operation, and the efficiency of their proposed methods has been examined on the 69-bus and 129-bus IEEE test systems, respectively.
In this research, the effect of the EV load and the various percentages of EV penetration on buses voltage and line losses of an IEEE 33 bus system has been evaluated. Furthermore, the interaction between renewable-based supply and EV’s load for declining air pollution generated by fossil fuel generation has been discussed. This feature indicates that EVs are a completely low-emission way if renewable resources are considered for their changing power, and also that we are supposed to determine the best location for erecting EV charging stations because this matter could decrease the line losses and subsequently the air pollution. As another noteworthy aspect of this research indicates, the positive effect(s) of demand response scheduling has been defined as an appropriate way to tackle the EV loads problem.
In the rest of the paper, the second section includes methodology and equations. The simulation and results have been comprehensively discussed through various scenarios in the third section. This section provides detailed comparisons to explain different situations in more detail. The last section has concluded the all section and outputs of this research.
In this research, the proposed method is applied to a 33-bus distribution grid [25]. This network is an IEEE 33-bus radial distribution network; its single-line schematic is shown in Fig. 2. Moreover, the network’s data such as the active and reactive load of the buses and branches impedance is given from [25].
In the above-mentioned IEEE 33 bus grid, the type of all the buses is PQ excluding the first bus which is a slack bus. Furthermore, all the buses were changed to the per-unit system according to the first bus.
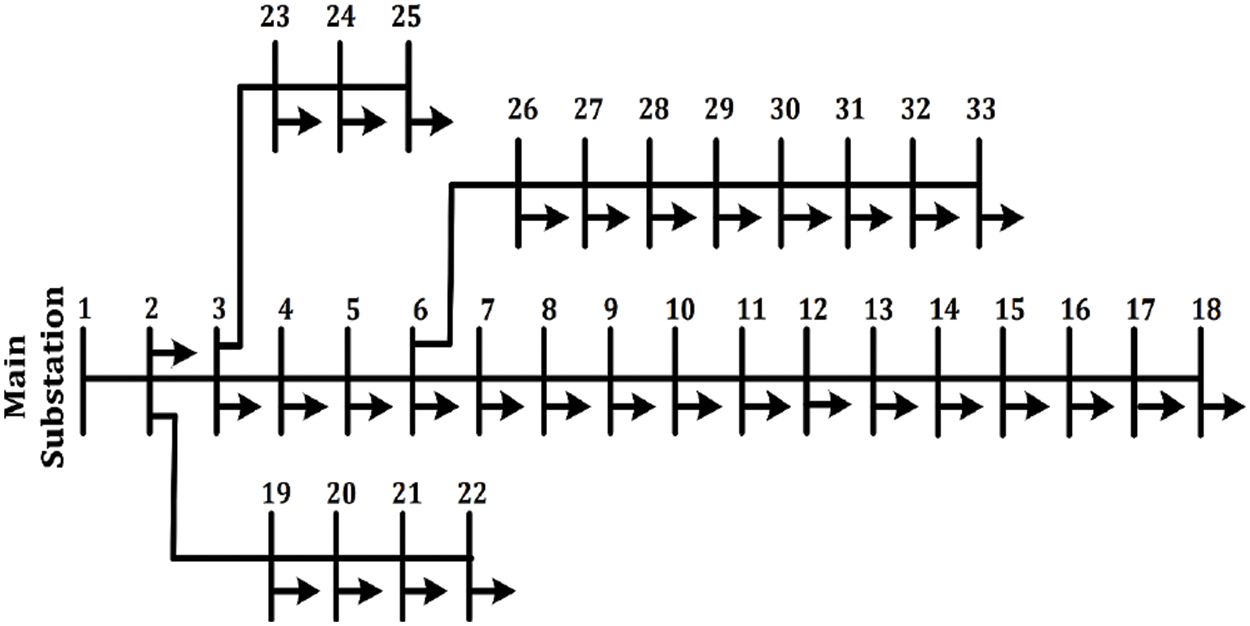
Figure 2: Schematic of the IEEE 33 bus grid
Because of their nonlinearity, the load flow equation solving needs iterative numerical methods. One of the high usage solving methods is the Modified Gauss-Seidel method [26] which uses the following equation to calculate the bus voltage in each iteration.
In the first step, the initial guess is chosen and the voltage in each iteration is calculated with the above formula until the voltage value converges to the desired value. Convergence here means the difference between consecutive voltage values should be lower than a small value. The active and reactive power is calculated by Eqs. (2) and (3) in each iteration:
The initial guess is usually chosen
Fig. 3 is presented to clarify the load flow algorithm.
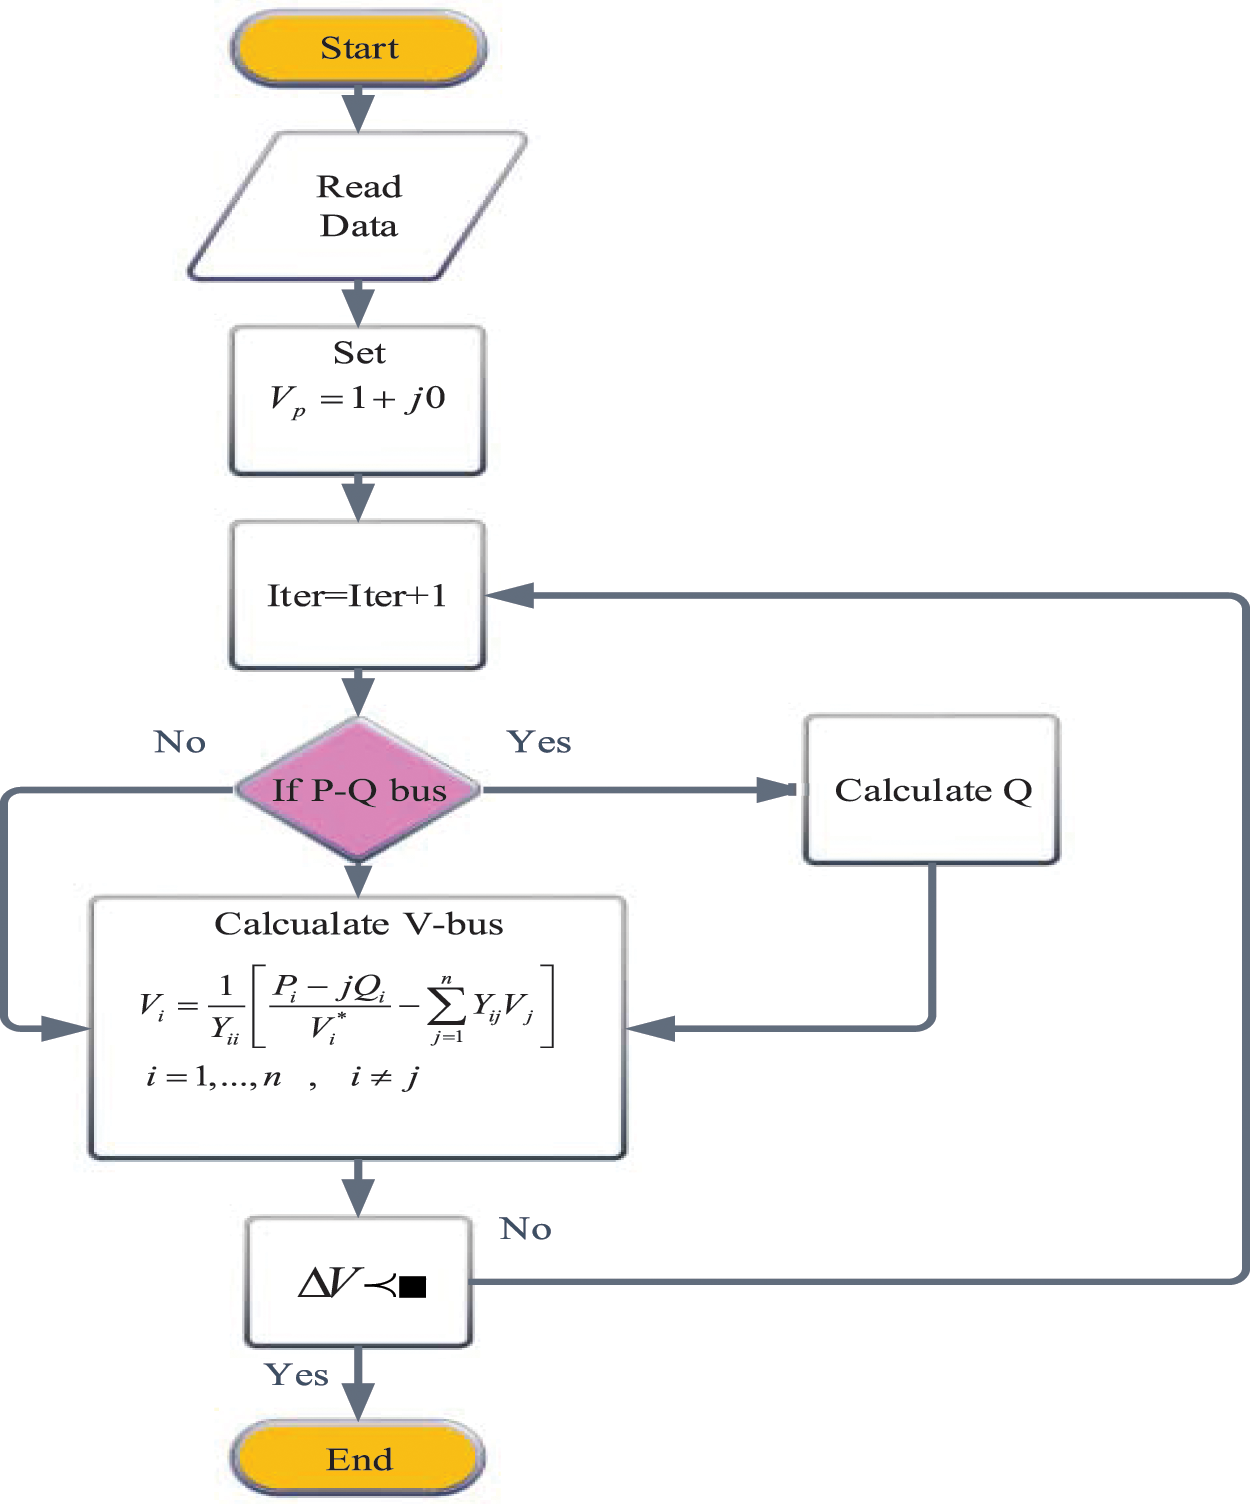
Figure 3: Flowchart of the proposed load flow
After iterative calculation of bus voltage, the calculation of lines loss is the next step. Current
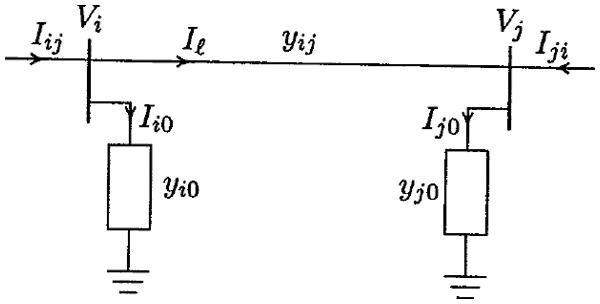
Figure 4: Outline of line current
Current in the reverse direction is also calculated likewise:
Complex power between two buses is obtained according to the below equations:
Consequently, power loss in the line is calculated as below:
In this section, simulation and corresponding results are presented. A network, which has a generator and 33 buses, is considered according to [1]. Fig. 2 shows this network.
This network is known as a fundamental example for this research and per unit bus voltage is presented in Fig. 5 according to previous section definitions and formulas with generator bus voltage as the base of the per-unit system.
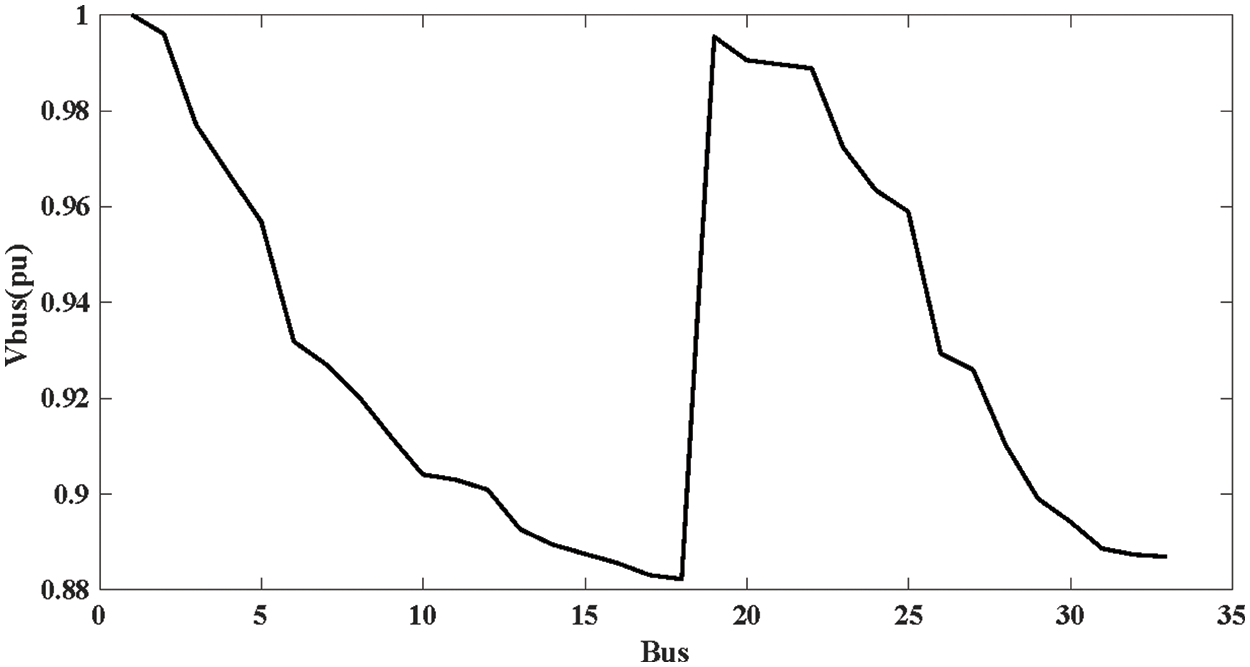
Figure 5: The voltage of all buses (basic situation)
According to expectation, the 18th bus has a minimum voltage value because of lines power losses. Fig. 6 indicates a detailed analysis of active and reactive power losses. It is important to mention that the length of the line has a great effect on the line losses.
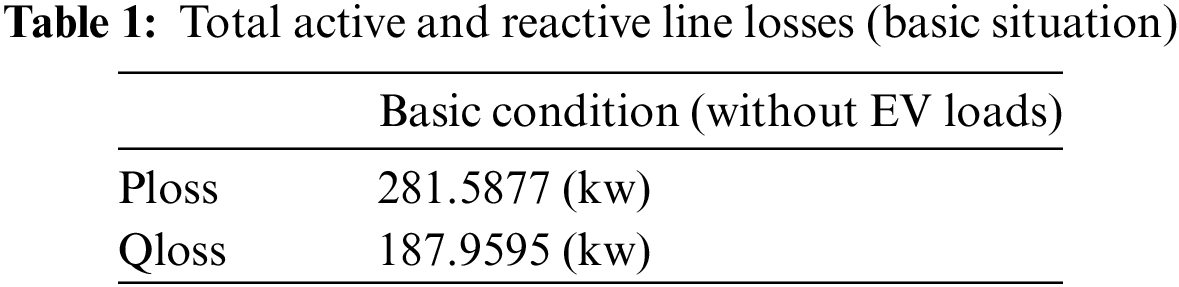
The total line losses remains an important factor that should be analyzed in such research. Therefore, the total line losses are presented in Table 1. These values will compare and discuss in the following scenarios.
The simulation part of this research has been introduced through three various scenarios. The first scenario evaluates the impact of EVs on the grid. The number of EV loads and their effect on the grid have been discussed in the second scenario. Finally, the importance of a well-organized plan for dealing with EV load has been indicated by the third scenario.
• Senario1-The effect of EV loads on line losses and air pollution
• Senario2-Considering different percentages for EV penetration
• Senario3-Effect of energy management on grids factors
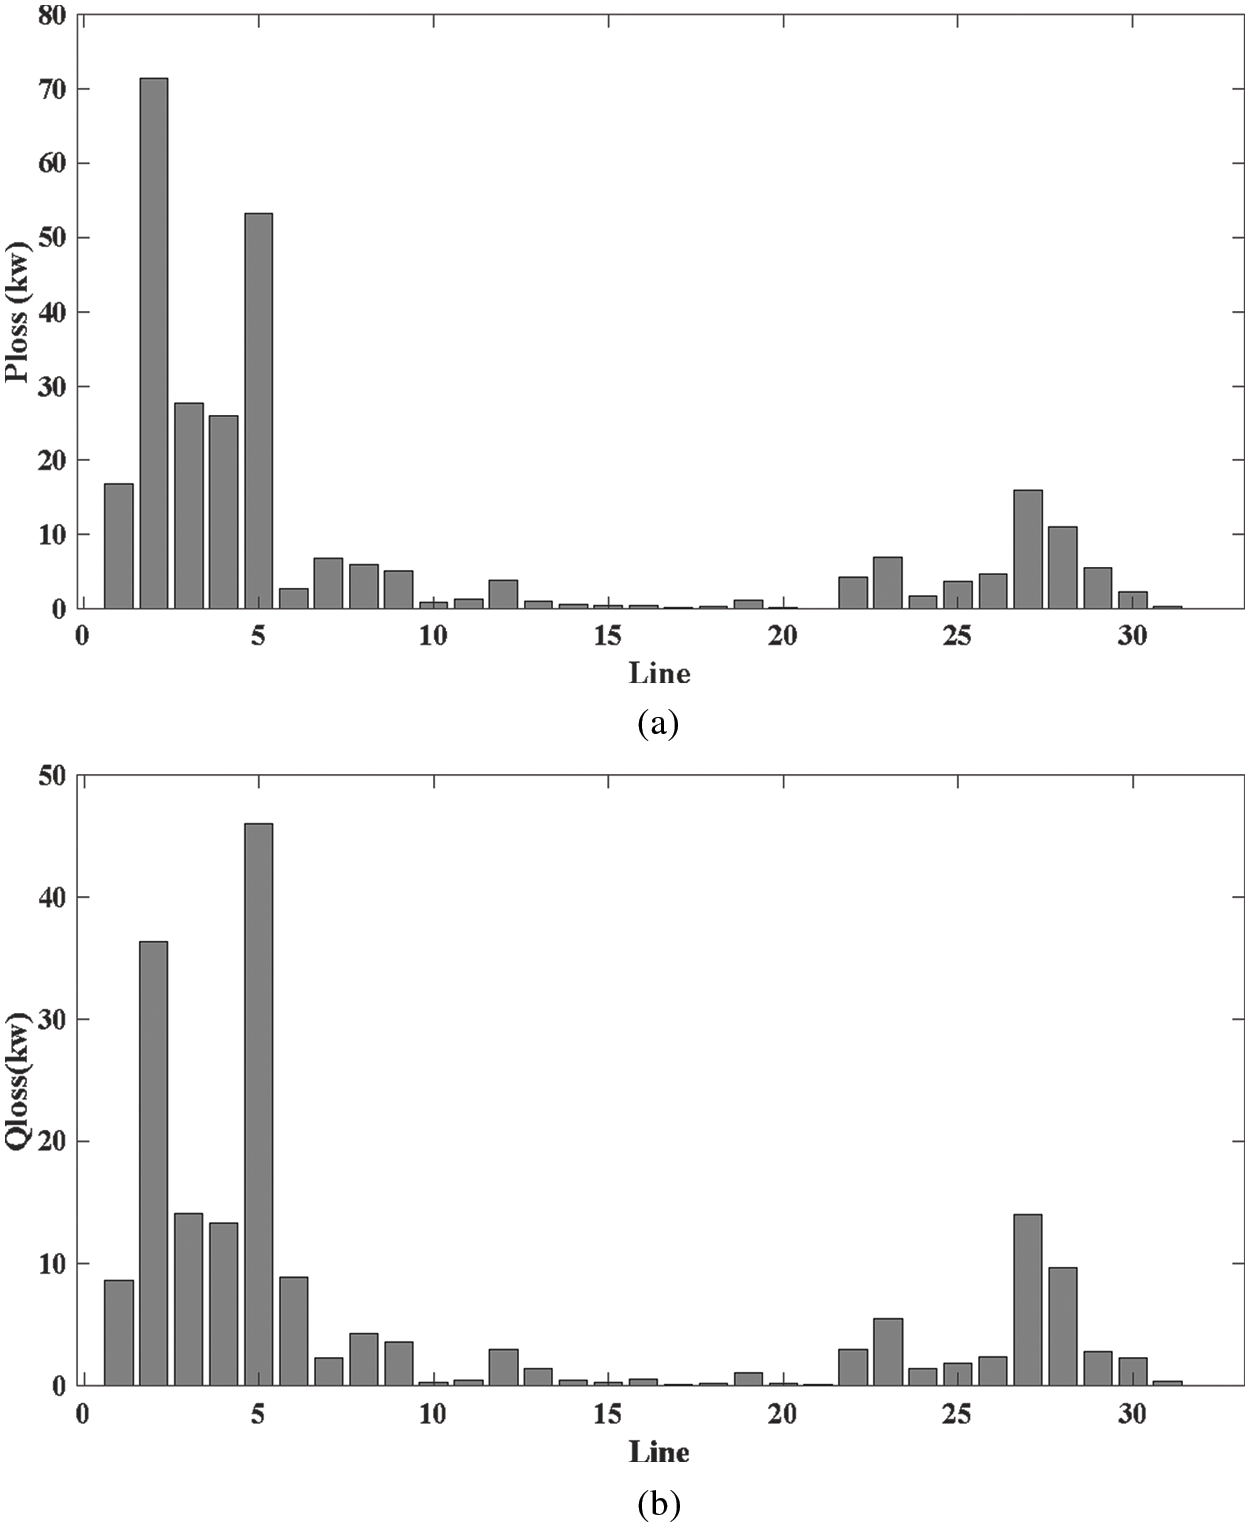
Figure 6: (a): Active line losses (basic situation) (b): Reactive line losses (basic situation)
The effect of EV loads on power losses has been considered through three cases in which EV loads with the same penetration have existed in different buses:
A) EV with 50 percent penetration rate at bus 10.
B) EV with 50 percent penetration rate at bus 18.
C) EV with 50 percent penetration rate at bus 25.
The effective total EV’s consuming power is considered 50 kW in this research. In other words, A station with a single 50 KW fast charger has been introduced for EV loads. The proposed model of EV load has been given from [19], in which the EV model presented for different resistance values. The mentioned EV fast charger includes an ac–dc converter at the front end and a dc-dc converter at the battery end.
A) EV with 50 percent penetration rate at bus 10:
After considering EV loads for the 10th bus, the voltage of buses and power losses have been depicted in Figs. 7 and 8, respectively. As expected, the increase in the load demand has caused more buses voltage drops and also power losses have been increased.
Lines total power loss is another important comparison criterion and illustrates a negative effect of extra loads on the line parameters. The below Table 2 shows both line losses, which each increase in this case.
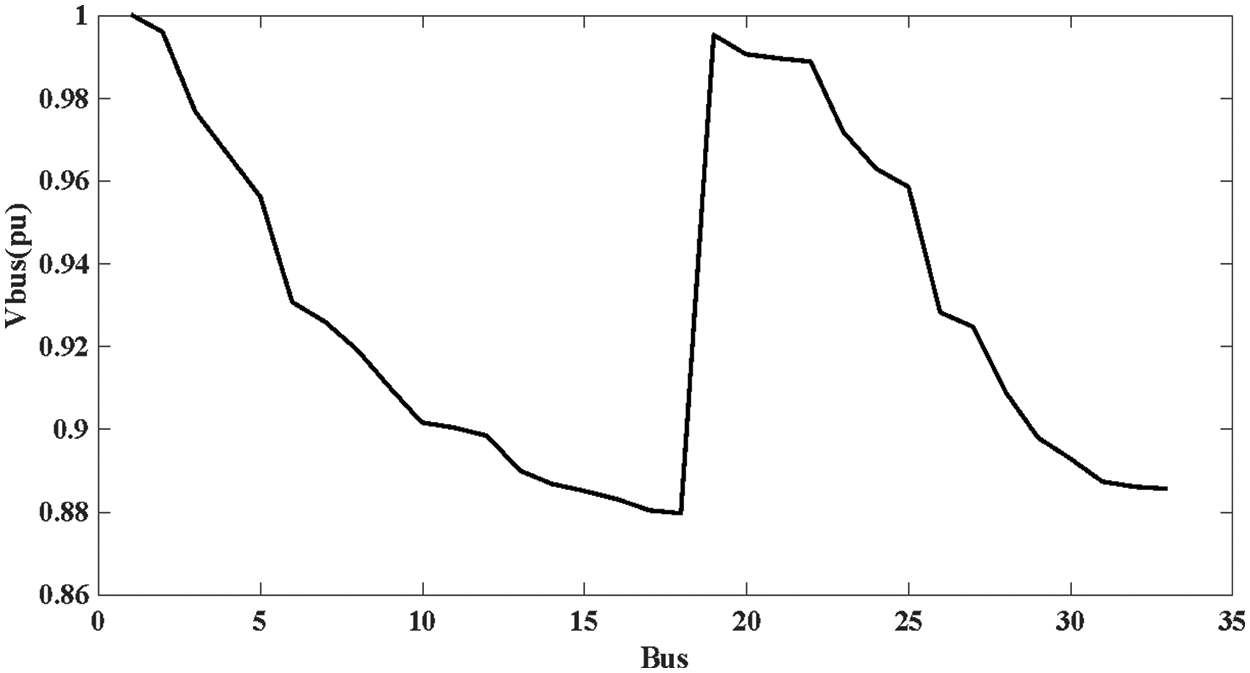
Figure 7: The voltage of all buses (EV in the 10th bus)
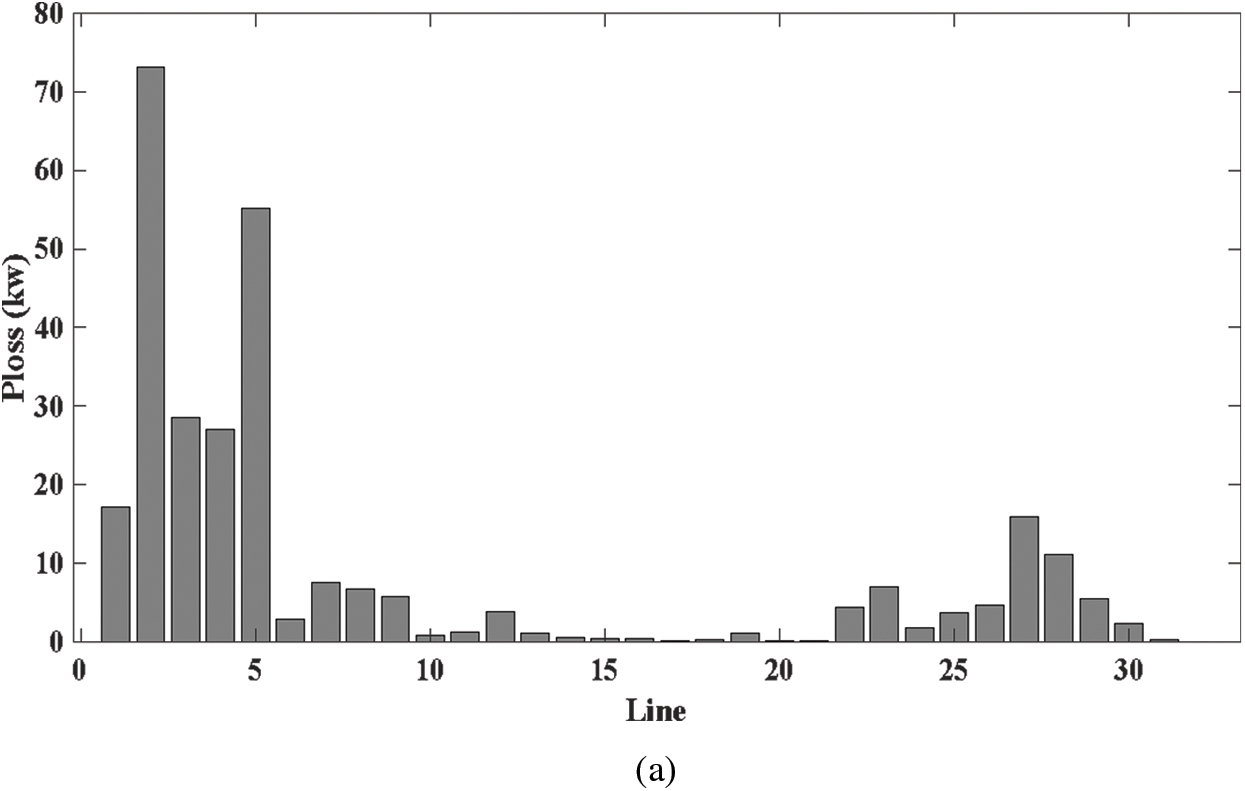
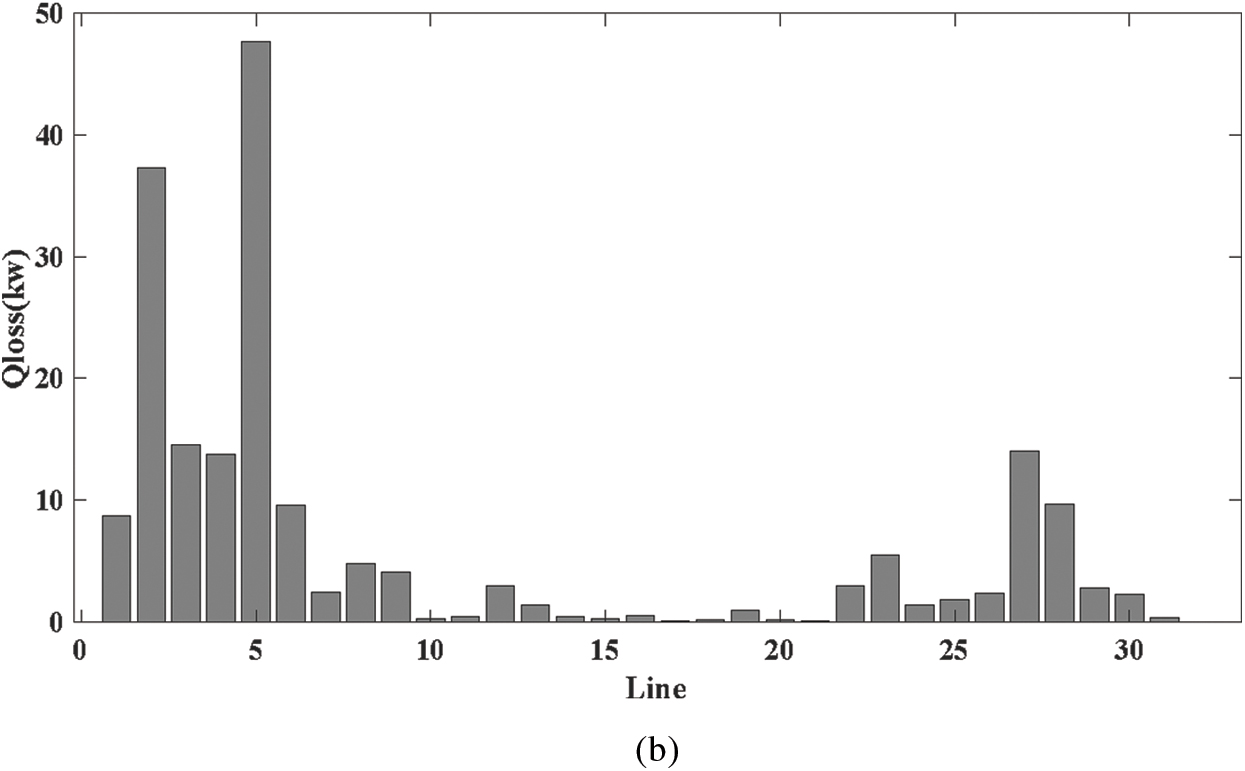
Figure 8: (a): Active line losses (EV in the 10th bus) (b): Reactive line losses (EV in the 10th bus)

B) EV with 50 percent penetration rate at bus 18:
It is obvious that further distance between the generator and the load leads to more line power loss and lower bus voltage. Therefore, the network of this case has lower buses voltage and more line power loss than the previous case. According to Fig. 2, the farthest distance of buses from bus 1 in the network is bus 18; consequently, delivering one unit of power in bus 18 causes the most line power loss. Therefore, this subsection presents that the locations of EV charging stations is an important factor, and should be considered in the power grids studies. The voltage of buses and power losses of this case are shown in Figs. 9 and 10, respectively.
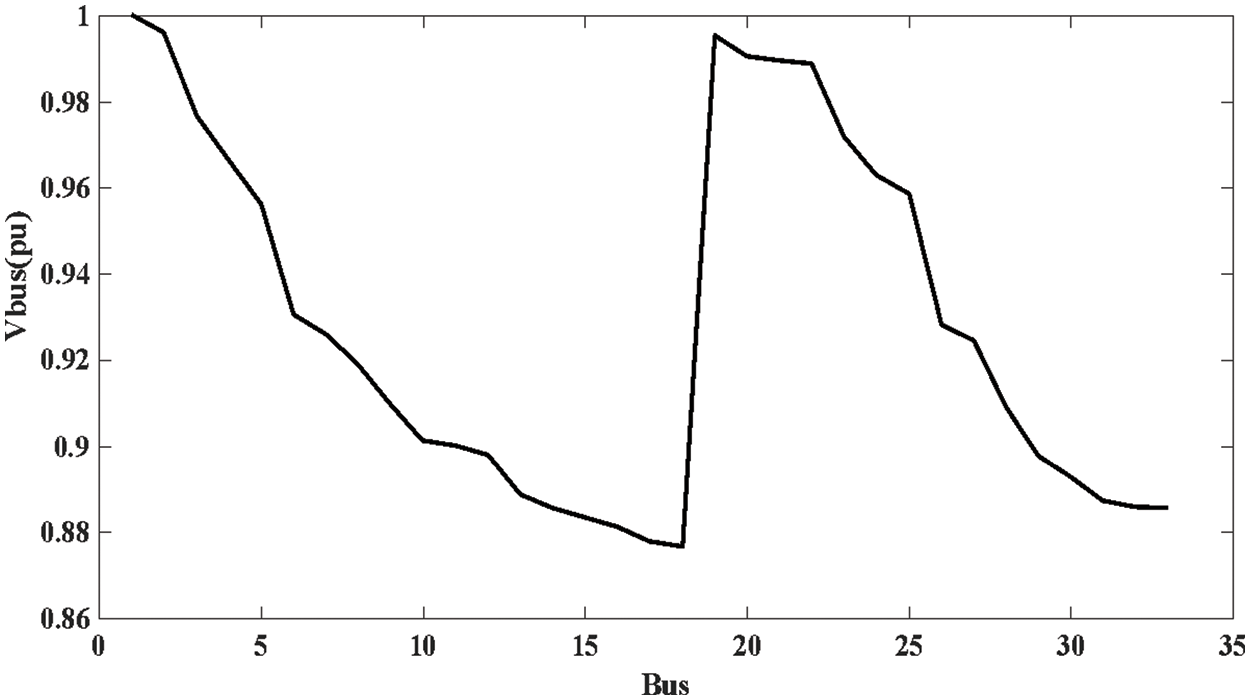
Figure 9: The voltage of all buses (EV in the 18th bus)
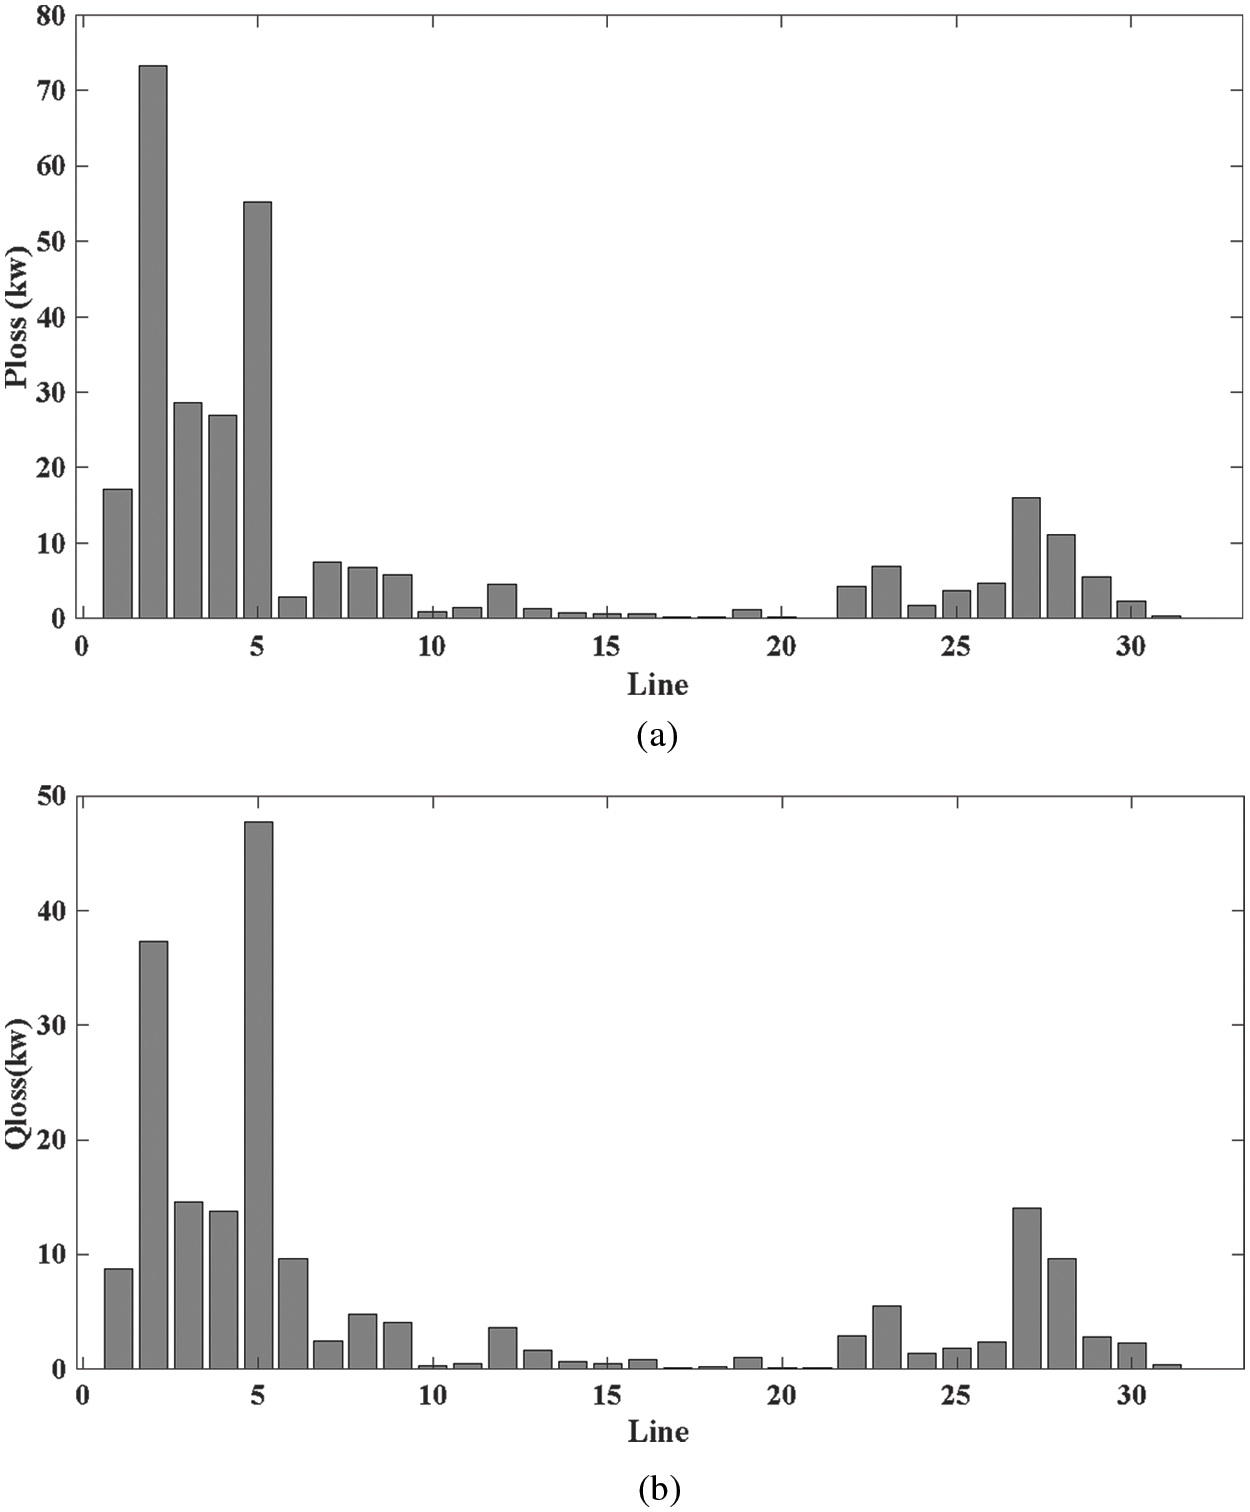
Figure 10: (a): Active line losses (EV in the 18th bus) (b): Reactive line losses (EV in the 18th bus)
Due to further distance, this condition has the biggest total line losses among all situations, subsequently, causes the biggest cost and greater air pollution for grids. Table 3 presents the total active and reactive line losses.
C) EV with 50 percent penetration rate at bus 25:

The electric vehicle is connected to the network at bus 25 which is different from two previous cases. Because the load consumption is closer to the generator bus in this case, the total power loss would expect to be lower than in either two previous cases, which is given in Table 4. The voltage of the buses and power losses in this case are illustrated in Figs. 11 and 12, respectively.

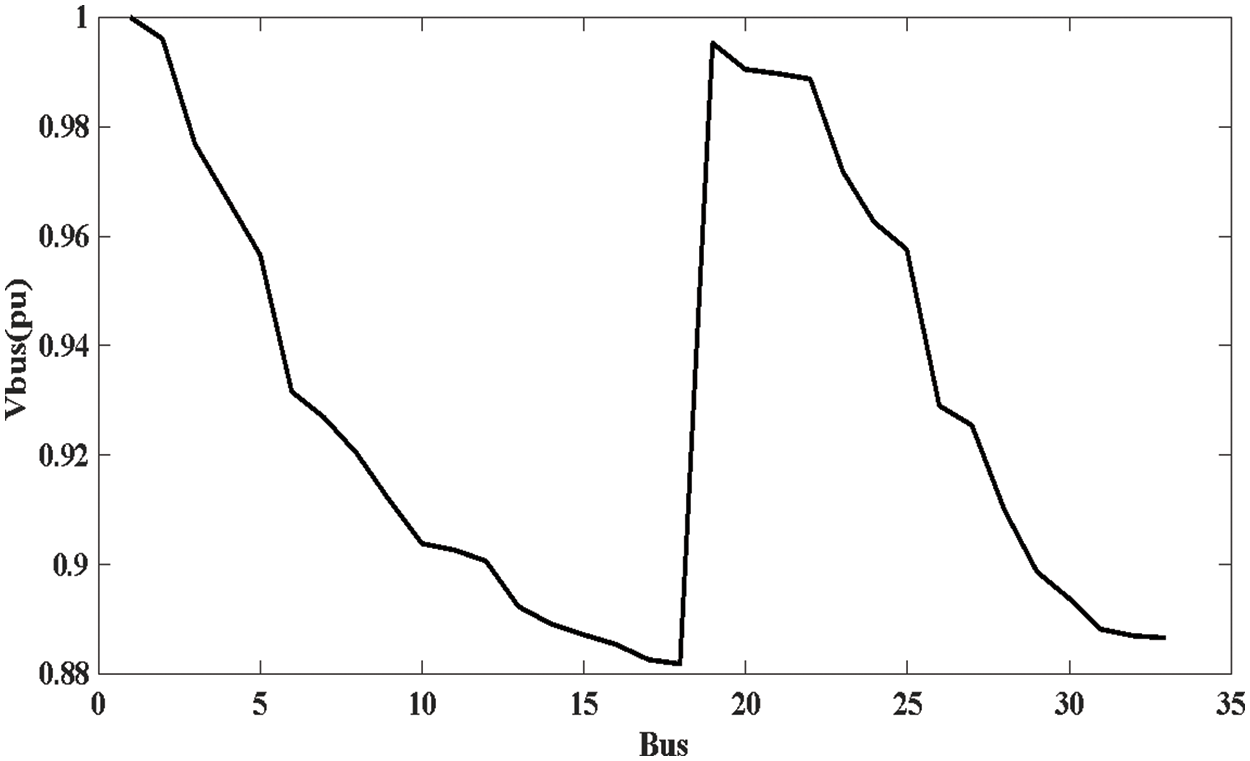
Figure 11: The voltage of all buses (EV in the 25th bus)
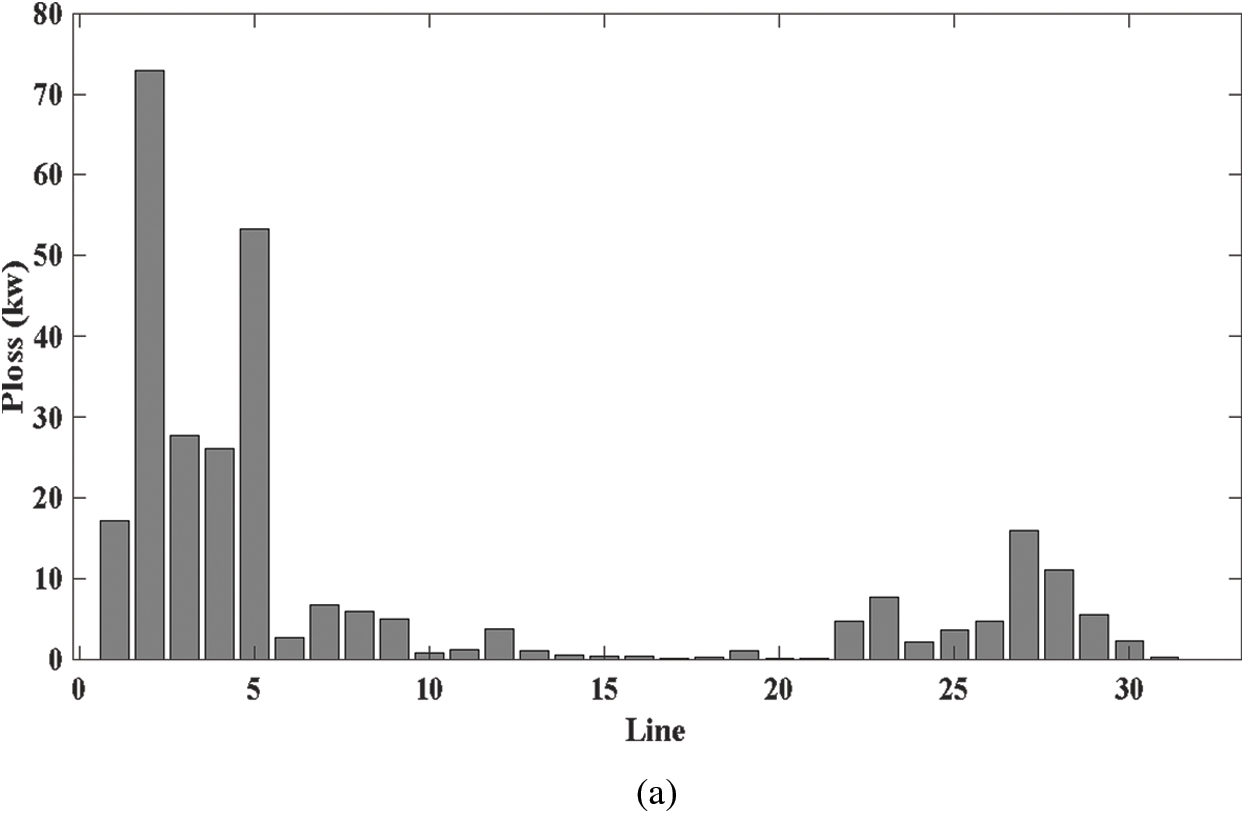
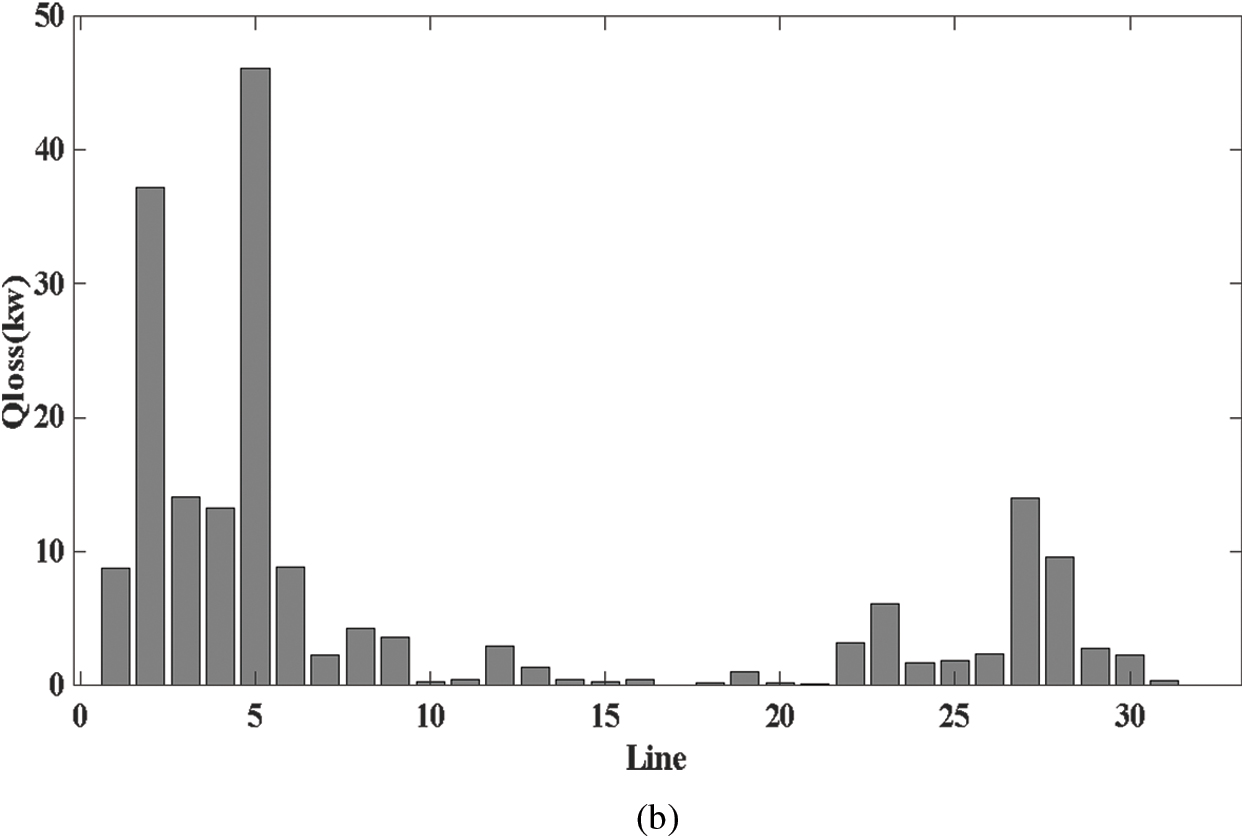
Figure 12: (a): Active line losses (EV in the 25th bus) (b): Reactive line losses (EV in the 25th bus)
Comparisons of these cases, which are shown in Fig. 13 and Table 5, remains an important issue also. According to this comparison, the nearer the location of the electric vehicle load to the generator the lower the buses voltages and further line power loss was. Hence, it is much better if EV loads are supported locally with a small size generator, or the EV charge station is built in a suitable and sustainable place. As depicted in Fig. 2, bus 18 is the farthest bus from the generator bus; consequently, bus 18 has the minimum voltage value among buses which is shown in all figures of voltages.
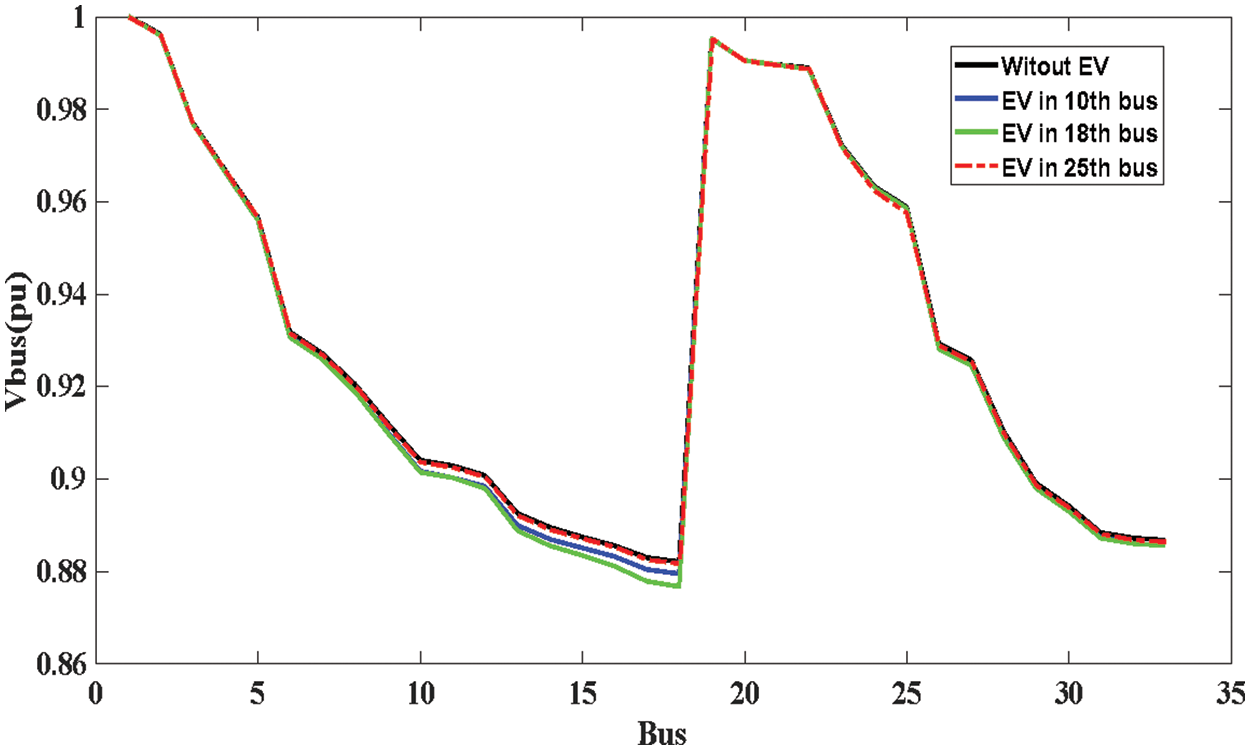
Figure 13: The voltage of all buses (Comparison between all cases of the first scenario)
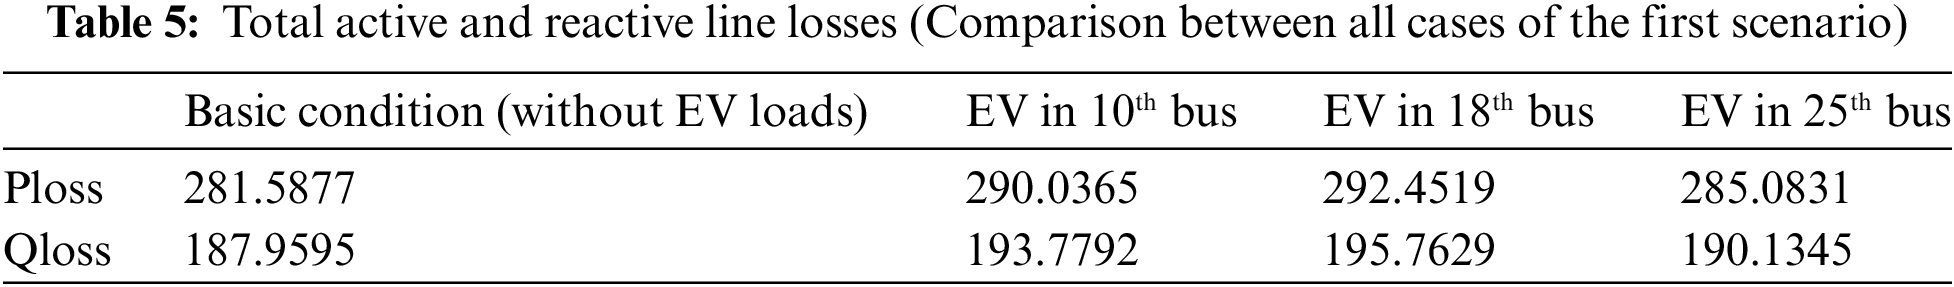
Table 5 emphasizes the above-mentioned claim that considering EV charge stations, or EV loads, a comprehensive analysis or even grids restructuring is necessary in some cases. As is evident from the following table, EV loads in the 25th bus provides minimum line losses and the best voltage response.
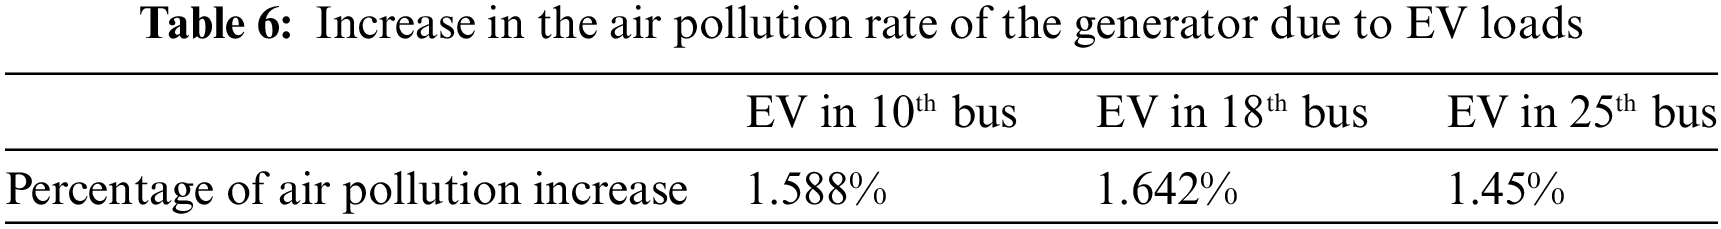
It is obvious that an increase in loads needs more supply generation because the balance between supply and generation should be always kept around a confident boundary. According to the definition, air pollution, which is produced by the increase in the supply of fuel-based generators, has been investigated here. The following table presents the growth in the percentage of air pollution due to various EV loads location. It can conclude from Table 6 that the EV loads and location of EV stations can even affect the rate of air pollution.
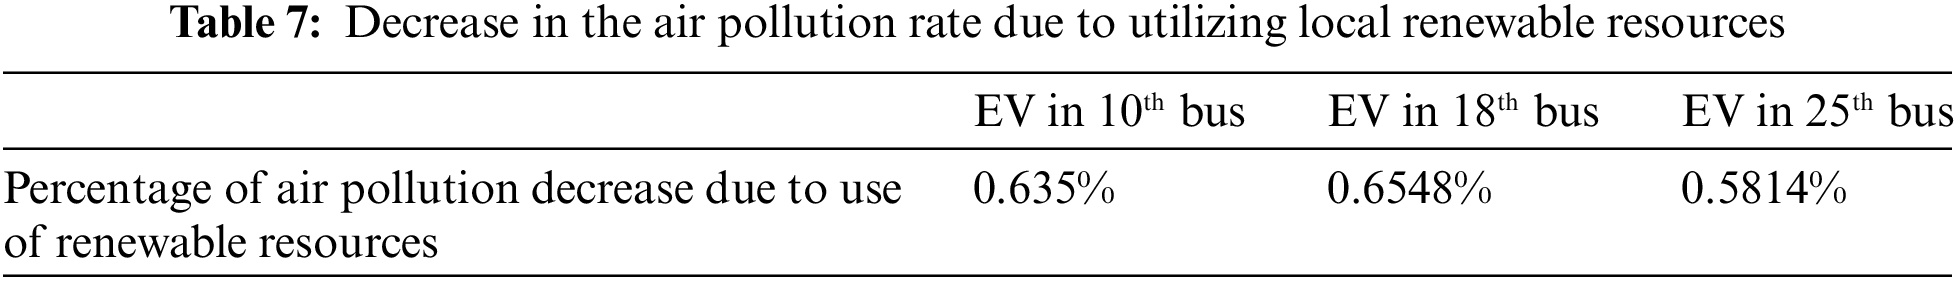
As mentioned previously, the local power generation, especially renewable energy-based power generation, can cause a decrease in the rate of air pollution which is caused by EV loads. The following Table 7 indicates the decrease in air pollution because of renewable resources including wind turbines and PV, which generate 40% of EV loads. This phenomenon has been developed over the last years and the number of charge stations with renewable energy facilities has considerably increased.
In this section, the effect of electric vehicle penetration rate on buses voltage and power losses are considered in a grid with electric vehicles at buses 8, 18, and 30. Fig. 14 illustrates the schematic of this grid and EV’s load buses.
Electric vehicles with different penetration rates have different effects on the voltage of buses. More penetration rate causes lower bus voltage and further line power losses. Therefore, the percentage of EV penetration is an important factor and should be considered in such systems and governments’ energy policies. Providing energy supply locally can be a suitable way for decreasing the percentage of penetration. According to this issue, solar-based EV stations have received special consideration recently and this concept is depicted in Figs. 15 and 16.
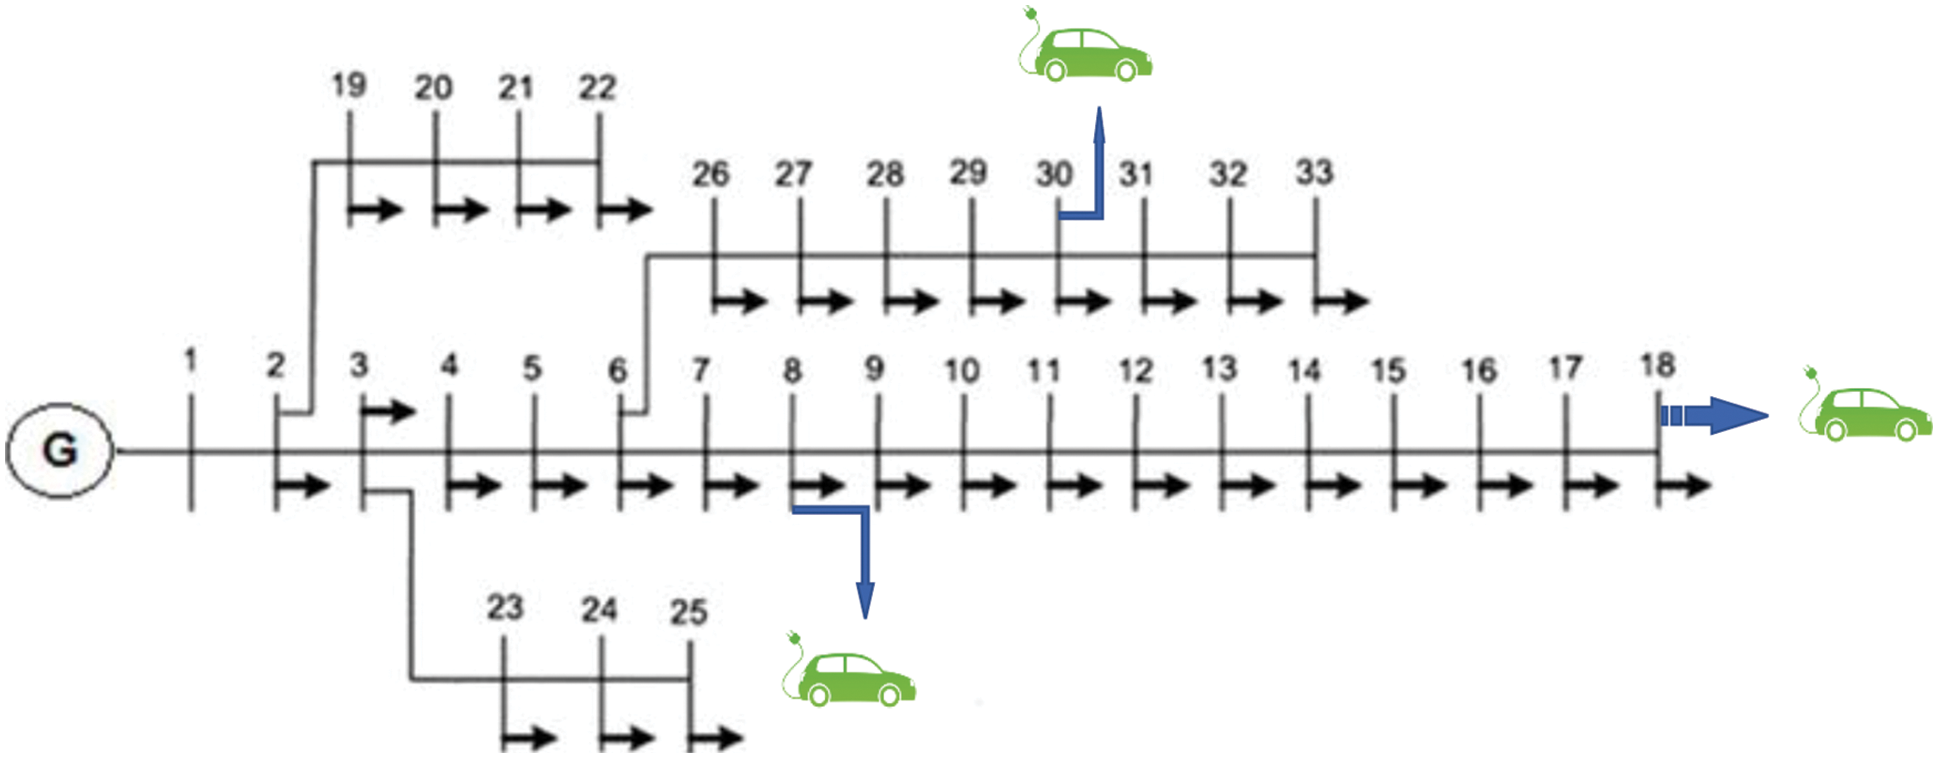
Figure 14: Outline of grids and EV location (second scenario)
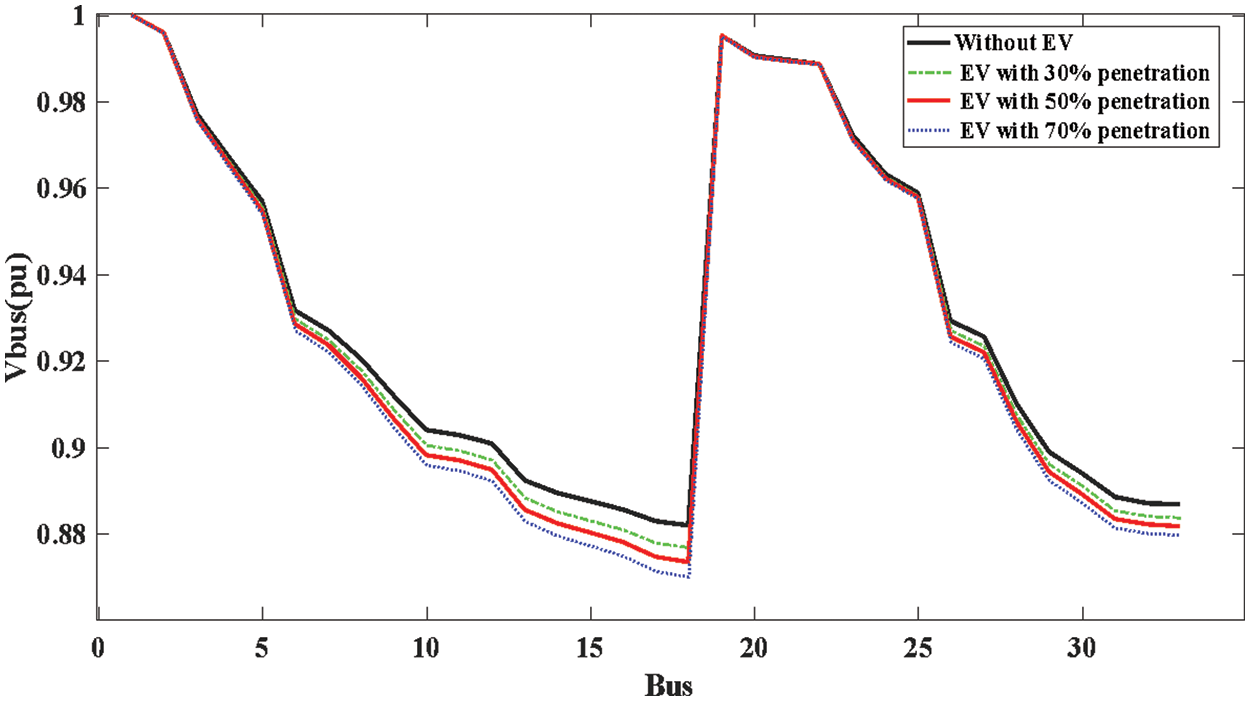
Figure 15: The voltage of all buses (second scenario)
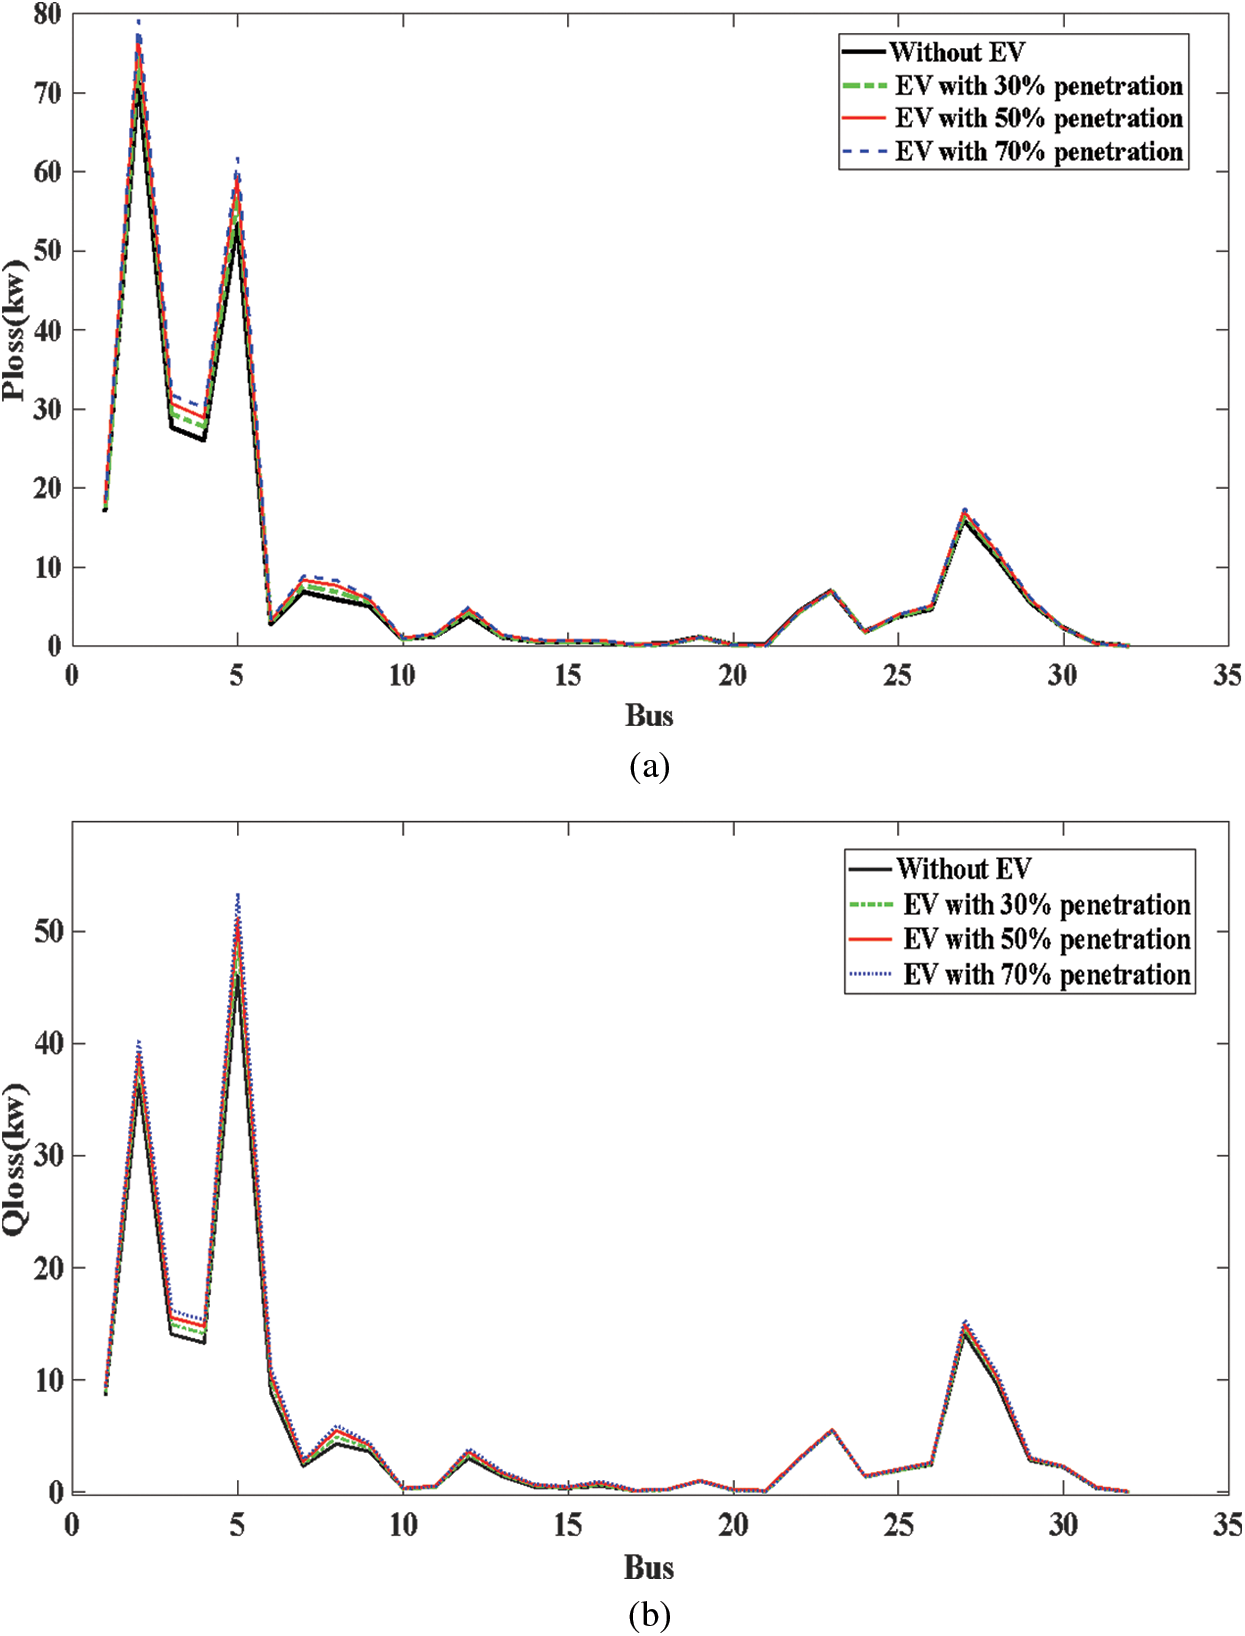
Figure 16: (a): Active line losses (second scenario) (b): Reactive line losses (second scenario)
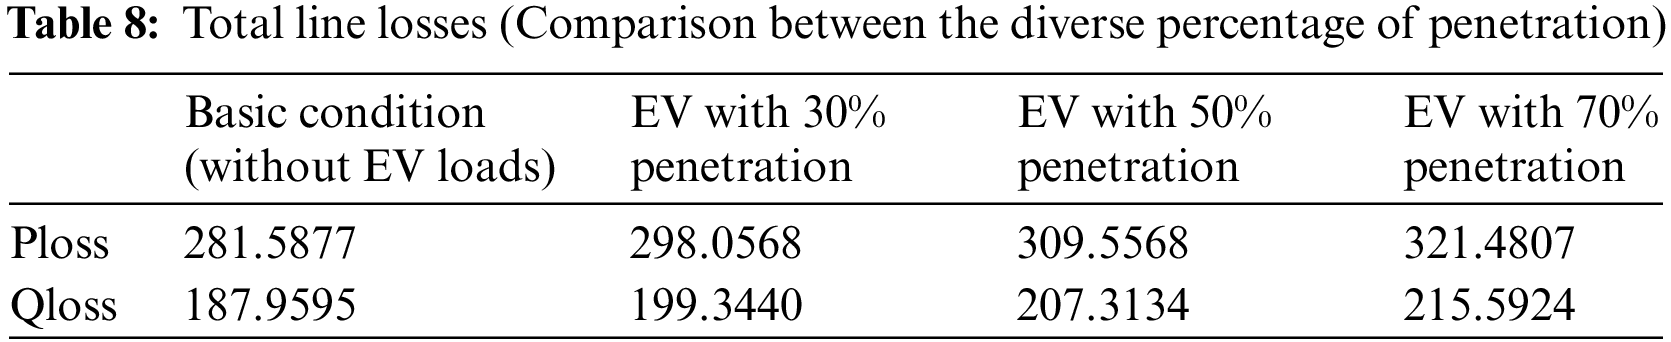
Ultimately, the growth of the percentage of EV penetration causes more line losses. Also, this growth decreases the voltage of buses. So, as was mentioned, to tackle the negative impact of the extra load caused by EVs, useful ways such as optimization, restructuring, or unit commitment should be employed to coincide with adding this extra load. The total line losses are presented in Table 8. It is evident that local energy sources, such as PV-based stations could be another effective way for reducing the negative effect of EV loads on grids.
The customer trends in the rate of consumption are not monotonous for different hours of a day. Therefore, there are peak and off-peak amounts in each consumption graph. Some approaches of demand response programs called peak-shaving methods focus on peak reduction. As a well-known recourse , the shiftable method has been applied in many demand response types of research.
In this research, the effects of shifting EV loads from peak times of loads to off-peak times of loads has been analyzed. EV loads have been employed on the 8th, 18th, 30th buses. Fig. 17 depicts the voltage of buses for both situations and Table 9 is given to show line losses. It is important to mention that the rate of EV loads is the same in both situations and only the hours of EV charging have been shifted, therefore, this scenario could be a suitable evaluation of a demand management strategy.
It is evident from Table 9 that the EV load on peak condition make a greater line active and reactive loss, Figs. 18 and 19 are shown the difference between peak and off-peak line losses in more detail. It can be concluded that a predefined plan could be able to offset disadvantages of EVs. Therefore, in addition to decreasing the distance between supply and EV load sides and also considering local generation, appropriate demand-side management can be an effective way to deal with increasing EV loads.
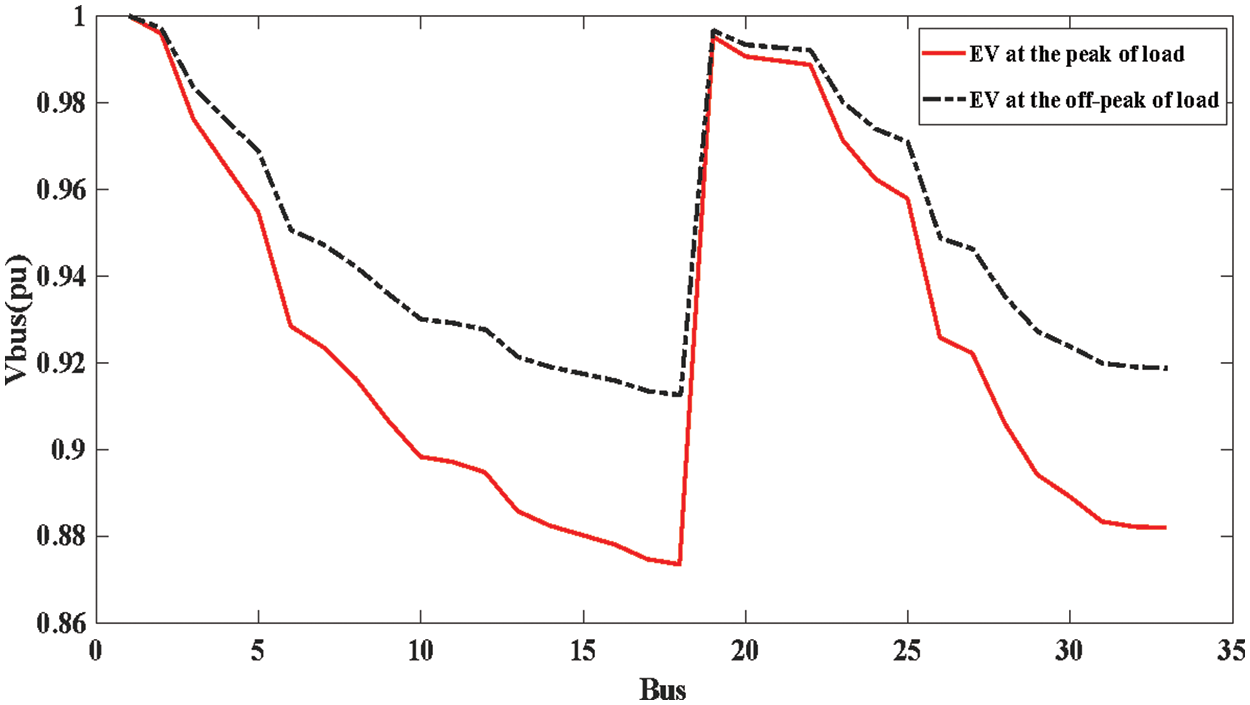
Figure 17: The voltage of all buses (third scenario)
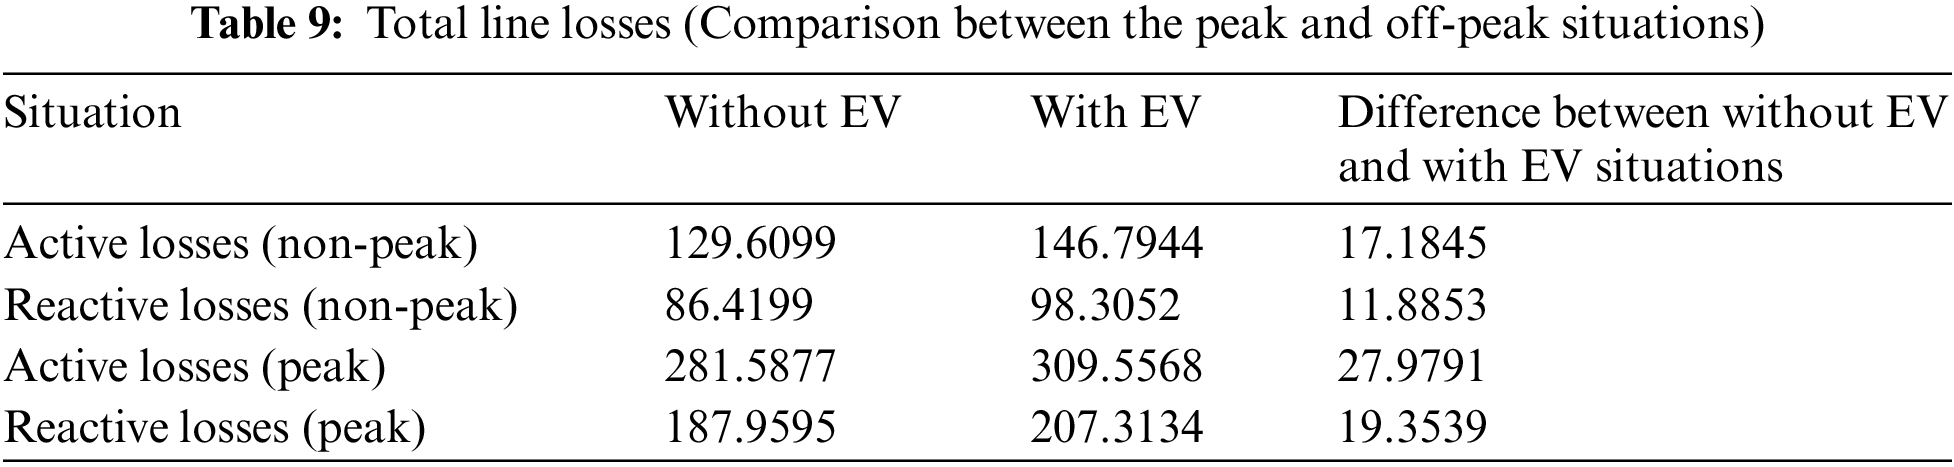
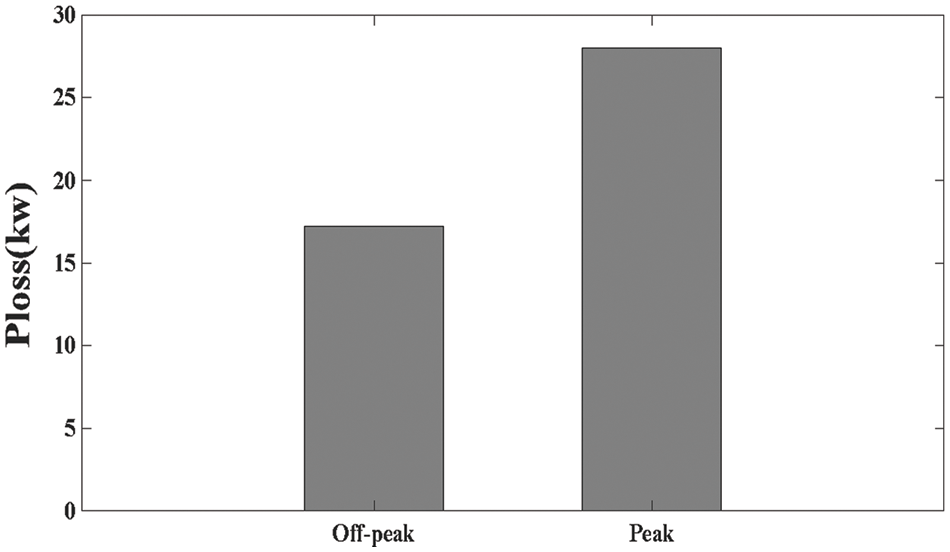
Figure 18: Difference between active losses before and after considering EV loads (peak and off-peak situations)
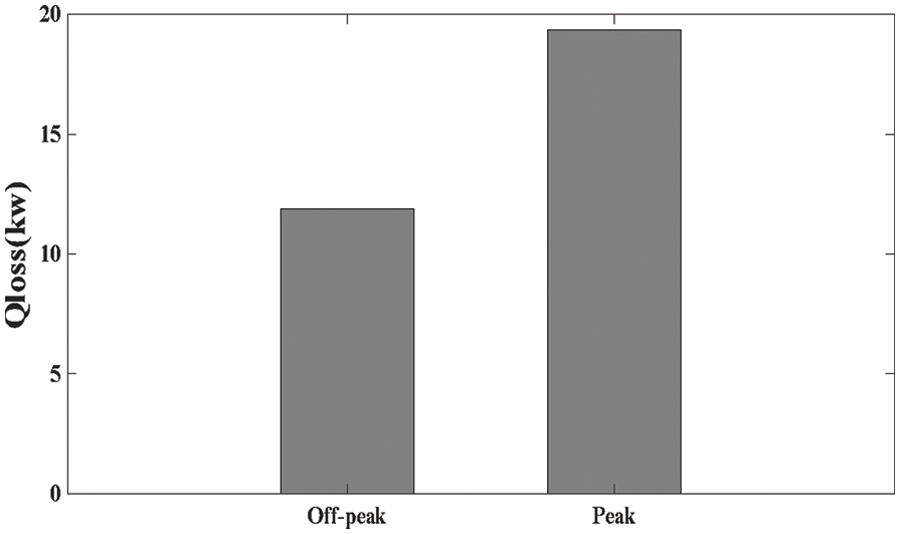
Figure 19: Difference between reactive losses before and after considering EV loads (peak and off-peak situations)
EVs have received significant attention from people and governments during the last few years in particularly, and have been spread all over the world rather quickly as well. So, it is important to consider all of the power grid challenges caused by EVs too. This research has investigated the effect of EVs on voltage stability such as line losses and air pollution rates. As an illustration, the line losses saw about a 3% decrease by relocating the EV’s station. Furthermore, various scenarios have been presented to show the interaction between diverse situations of grid and EV load, and also a possible way to deal with extra demands through simulation. Finally, the effectiveness of the demand response method has been discussed in this study. As a result of demand response, the active and reactive power losses have decreased from 27.9 to 17.1 and from 19.3 to 11.8, respectively.
Funding Statement: The authors received no specific funding for this study.
Conflicts of Interest: The authors declare that they have no conflicts of interest to report regarding the present study.
References
1. Babaei, M., Azizi, E., Beheshti, M. T., Hadian, M. (2020). Data-driven load management of stand-alone residential buildings including renewable resources, energy storage system, and electric vehicle. Journal of Energy Storage, 28, 101221. DOI 10.1016/j.est.2020.101221. [Google Scholar] [CrossRef]
2. Muratori, M. (2018). Impact of uncoordinated plug-in electric vehicle charging on residential power demand. Nature Energy, 3(3), 193–201. DOI 10.1038/s41560-017-0074-z. [Google Scholar] [CrossRef]
3. Khaloie, H., Toubeau, J. F., Vallee, F., Lai, C. S., Lai, L. L. (2021). An innovative coalitional trading model for a biomass power plant paired with green energy resources. IEEE Transactions on Sustainable Energy, 13, 892–904. DOI 10.1109/TSTE.2021.3138777. [Google Scholar] [CrossRef]
4. Crabtree, G. (2019). The coming electric vehicle transformation. Science, 366(6464), 422–424. DOI 10.1126/science.aax0704. [Google Scholar] [CrossRef]
5. Shen, Z. J. M., Feng, B., Mao, C., Ran, L. (2019). Optimization models for electric vehicle service operations: A literature review. Transportation Research Part B: Methodological, 128, 462–477. DOI 10.1016/j.trb.2019.08.006. [Google Scholar] [CrossRef]
6. Balouchi, R., Weisenstein, M., Wellssow, W. H. (2020). Pseudo-worst-case forecast for a preventive control in LV smart grids, Conference on Sustainable Energy Supply and Energy Storage Systems, pp. 1–6. Hamburg, Germany. [Google Scholar]
7. Khaloie, H., Vallée, F., Lai, C. S., Toubeau, J. F., Hatziargyriou, N. D. (2021). Day-ahead and intraday dispatch of an integrated biomass-concentrated Solar System: A multi-objective risk-controlling approach. IEEE Transactions on Power Systems, 37(1), 701–714. DOI 10.1109/TPWRS.2021.3096815. [Google Scholar] [CrossRef]
8. Babar, A. H. K., Ali, Y., Khan, A. U. (2021). Moving toward green mobility: Overview and analysis of electric vehicle selection, Pakistan a case in point. Environment, Development and Sustainability, 23(7), 10994–11011. DOI 10.1007/s10668-020-01101-5. [Google Scholar] [CrossRef]
9. Khaloie, H., Anvari-Moghaddam, A., Hatziargyriou, N., Contreras, J. (2021). Risk-constrained self-scheduling of a hybrid power plant considering interval-based intraday demand response exchange market prices. Journal of Cleaner Production, 282, 125344. DOI 10.1016/j.jclepro.2020.125344. [Google Scholar] [CrossRef]
10. Carley, S., Siddiki, S., Nicholson-Crotty, S. (2019). Evolution of plug-in electric vehicle demand: Assessing consumer perceptions and intent to purchase over time. Transportation Research Part D: Transport and Environment, 70, 94–111. DOI 10.1016/j.trd.2019.04.002. [Google Scholar] [CrossRef]
11. El Chehaly, M., Saadeh, O., Martinez, C., Joos, G. (2009). Advantages and applications of a vehicle to grid mode of operation in plug-in hybrid electric vehicles, 2009 IEEE Electrical Power & Energy Conference (EPEC), pp. 1–6. Montreal, QC, Canada. [Google Scholar]
12. Chakraborty, A., Kumar, R. R., Bhaskar, K. (2021). A game-theoretic approach for electric vehicle adoption and policy decisions under different market structures. Journal of the Operational Research Society, 72(3), 594–611. DOI 10.1080/01605682.2019.1678407. [Google Scholar] [CrossRef]
13. Kester, J., Noel, L., de Rubens, G. Z., Sovacool, B. K. (2018). Policy mechanisms to accelerate electric vehicle adoption: A qualitative review from the Nordic region. Renewable and Sustainable Energy Reviews, 94, 719–731. DOI 10.1016/j.rser.2018.05.067. [Google Scholar] [CrossRef]
14. Davis, L. W. (2019). How much are electric vehicles driven? Applied Economics Letters, 26(18), 1497–1502. DOI 10.1080/13504851.2019.1582847. [Google Scholar] [CrossRef]
15. Babaei, M., Abazari, A., Soleymani, M. M., Ghafouri, M., Muyeen, S. M. et al. (2021). A data-mining based optimal demand response program for smart home with energy storages and electric vehicles. Journal of Energy Storage, 36, 102407. DOI 10.1016/j.est.2021.102407. [Google Scholar] [CrossRef]
16. Abazari, A., Soleymani, M. M., Kamwa, I., Babaei, M., Ghafouri, M. et al. (2021). A reliable and cost-effective planning framework of rural area hybrid system considering intelligent weather forecasting. Energy Reports, 7, 5647–5666. DOI 10.1016/j.egyr.2021.08.196. [Google Scholar] [CrossRef]
17. Faraji, J., Hashemi-Dezaki, H., Ketabi, A. (2020). Multi-year load growth-based optimal planning of grid-connected microgrid considering long-term load demand forecasting: A case study of Tehran, Iran. Sustainable Energy Technologies and Assessments, 42, 100827. DOI 10.1016/j.seta.2020.100827. [Google Scholar] [CrossRef]
18. Gerritsma, M. K., AlSkaif, T. A., Fidder, H. A., van Sark, W. G. (2019). Flexibility of electric vehicle demand: Analysis of measured charging data and simulation for the future. World Electric Vehicle Journal, 10(1), 14. DOI 10.3390/wevj10010014. [Google Scholar] [CrossRef]
19. Dharmakeerthi, C. H., Mithulananthan, N., Saha, T. K. (2014). Impact of electric vehicle fast charging on power system voltage stability. International Journal of Electrical Power & Energy Systems, 57, 241–249. DOI 10.1016/j.ijepes.2013.12.005. [Google Scholar] [CrossRef]
20. Zhang, Y., Song, X., Gao, F., Li, J. (2016). Research of voltage stability analysis method in distribution power system with plug-in electric vehicle. 2016 IEEE PES Asia-Pacific Power and Energy Engineering Conference (APPEEC), pp. 1501–1507. Xi'an, China. [Google Scholar]
21. Deb, S., Tammi, K., Kalita, K., Mahanta, P. (2018). Impact of electric vehicle charging station load on distribution network. Energies, 11(1), 178. DOI 10.3390/en11010178. [Google Scholar] [CrossRef]
22. Marah, B., Bhavanam, Y. R., Taylor, G. A., Ekwue, A. O. (2016). Impact of electric vehicle charging systems on low voltage distribution networks. 2016 51st International Universities Power Engineering Conference (UPEC), pp. 1–6. Coimbra, Portugal. [Google Scholar]
23. Lyu, L., Yang, X., Xiang, Y., Liu, J., Jawad, S. et al. (2020). Exploring high-penetration electric vehicles impact on urban power grid based on voltage stability analysis. Energy, 198, 117301. DOI 10.1016/j.energy.2020.117301. [Google Scholar] [CrossRef]
24. Hemmatpour, M. H., Koochi, M. H. R., Dehghanian, P., Dehghanian, P. (2022). Voltage and energy control in distribution systems in the presence of flexible loads considering coordinated charging of electric vehicles. Energy, 239, 121880. DOI 10.1016/j.energy.2021.121880. [Google Scholar] [CrossRef]
25. Boonraksa, T., Paudel, A., Dawan, P., Marungsri, B. (2019). Impact of electric bus charging on the power distribution system a case study IEEE 33 bus test system. 2019 IEEE PES GTD Grand International Conference and Exposition Asia (GTD Asia), pp. 819–823. IEEE. [Google Scholar]
26. Eltamaly, A. M., Elghaffar, A. N. A. (2017). Load flow analysis by gauss-seidel method; A survey. International Journal of Mechatronics, Electrical and Computer Technology, 2411–6173. [Google Scholar]
 | This work is licensed under a Creative Commons Attribution 4.0 International License, which permits unrestricted use, distribution, and reproduction in any medium, provided the original work is properly cited. |