DOI: 10.32604/fdmp.2021.011185
ARTICLE
A Study on the Strength Surplus Coefficient of Cement
1Wuhan First Metallurgical Construction Installation Engineering Co., Ltd., Commercial Concrete Branch, Wuhan, 430080, China
2School of Municipal Engineering, Hubei Urban Construction Vocational and Technological College, Wuhan, 430200, China
*Corresponding Author: Jingyi Wang. Email: wjy519969948@163.com
Received: 24 April 2020; Accepted: 24 December 2020
Abstract: This study considers P.O42.5 cement from different sources and evaluates the related surplus coefficient (defined as the proportionality factor linking the measured compressive strength value of the cement after 28 days to the “standard” value of cement strength). The needed tests have been conducted using a mixer, a pressure testing machine, a flexural testing machine, a vibrating table a ramming rod, a feeder and a metal ruler. The average value of the measured cement strength surplus coefficient of cement produced by five distinct cement manufacturers has been found to be 1.16. These results can be used as the basis to reduce the production cost and improve the performance of commercial concrete.
Keywords: Cement; strength grade; surplus coefficient; commercial concrete
The key of concrete production is mix proportion design. The mixture ratio of concrete of different strength is also different, and water cement ratio is the most important factor affecting the concrete strength [1]. The water to cement ratio is the ratio of water consumption to cementitious materials, and cement is an indispensable component in the cementitious materials department. Strengthening cement performance and reducing the amount of sand in cement can effectively improve concrete performance and save production cost. The cement surplus coefficient is a very important factor in the design of mix ratio. The cement surplus coefficient directly affects the amount of cement. The low surplus coefficient will lead to an increase in the amount of cement, which will increase the strength of the original 28 day standard age and also make the concrete crack more easily. The increase in the amount of cement will increase the production cost. When the surplus coefficient is too high, the cement consumption will be reduced, and the strength at the standard age of 28 days may not reach the required strength.
The surplus coefficient is stipulated by building materials standard GB175-2007 as 1.13. Due to the different raw material sources and different production processes of various manufacturers, the properties of P.O42.5 cement produced by various manufacturers are also different [2]. In this article as a testbed we consider the actual situation of P.O42.5 cement in the Wuhan area in China (in the following simply referred to as W area). The reasonable value range of residual coefficient of P.O42.5 cement strength suitable for W area was obtained through multiple groups of comparative tests. On the premise of ensuring the quality of concrete, the production cost can be saved, the performance of cement can be fully utilized, and the amount of cement in the mix ratio design is more accurate and reasonable [3].
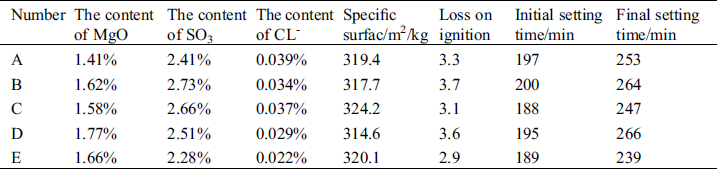
(1) Cement. P.O42.5 cement produced by different cement manufacturers in the area meets the technical requirements. The physical and chemical properties of P.O42.5 cement produced by A, B, C, D and E cement manufacturers are shown in Tab. 1. All indicators are in accordance with the technical regulations.
Table 1: The physical and chemical properties of P.O42.5 cement produced by A, B, C, D and E cement manufacturers
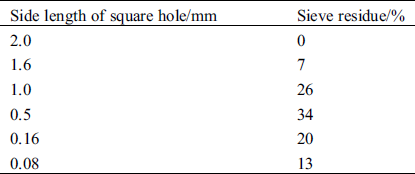
(2) Standard sand. Use ISO standard sand. The mass of each bag is 1350 ± 5 grams, the particle grade is 3.0, the content of SiO2 is greater than 96%, the loss on ignition is not more than 0.4%, and the content of mud is not more than 0.2%. The particle distribution of ISO standard sand is shown in Tab. 2.
Table 2: The particle distribution of ISO standard sand
Whether the raw materials meet the technical requirements or not is the main factor that affects whether the cement strength surplus coefficient is difficult to determine. Therefore, to ensure that the selected raw materials have good performance in accordance with the technical requirements is the premise of the research on cement strength surplus coefficient.
Mixer, pressure testing machine (the compression size is 40 mm × 40 mm), flexural testing machine, vibrating table, test mode (40 mm × 40 mm × 160 mm), rammer, feeder, metal ruler, scraper, etc.
In the same test environment, P.O42.5 cement and ISO standard sand were used. The actual strength value of the test piece was measured after curing by the standard aging (3 days and 28 days) standard curing method. The P.O42.5 cement surplus coefficient can be calculated by comparing the actual strength value with the standard value of P.O42.5 cement strength.
P.O42.5 cement produced by different manufacturers in W area was selected for the experiment, and cement test pieces were produced in accordance with GB/T 17671-1999 “Test Method for Strength of Cement Mortar (ISO Method)”. A total of 5 representative P.O42.5 cement manufacturers were selected for testing, which were represented by A, B, C, D and E respectively. The main test methods are as follows.
(1) The distribution ratio of the test piece: cement: sand: water consumption = 1:3:0.5. The water cement ratio is 0.5.
(2) Test piece size: 40 mm × 40 mm × 160 mm standard mold, test piece folding size of 40 mm × 160 mm, compression size of 40 mm × 40 mm.
(3) The main equipment and instruments used in the test: Mixer, pressure tester, bending tester, vibrating table, test mode (40 mm × 40 mm × 160 mm), rammer, feeder, metal ruler, scraper, etc.
(4) Mortar mixing: Put the weighed materials into the mixing pot for mixing. The mixing blade and the mixing pot rotate in opposite directions. First, stir at low speed for 30 s, then add ISO standard sand evenly at the beginning of the second 30 s. Then stir at high speed for 30 s, stop mixing for 90 s, and scrape the mortar of the blade into the pan within 15 s of stopping mixing. Stir at high speed for 60 s to complete.
(5) Sample formation: The thoroughly mixed mixture is put into the standard sample. Fill each tank with about 300 grams of mortar, level it with a picker, and then activate the vibrator 60 times. Then load the second layer of rubber sand, use a small picker to flatten it, vibrate it again 60 times, and finally scrape it flat.
(6) Maintenance of test piece: The test piece and the mold were cured in the standard curing box (temperature 20°C ± 1°C, relative humidity >90%) for 24 h, and then demoulded. After demoulding, continue to water in the standard incubator for 3 d and 28 d in two batches.
(7) Strength measurement: Take out the test piece and dry the surface moisture, first measure the flexural strength of 3d and 28d on the bending test machine (rate: 50N/S), and then measure the compressive strength of 3 d and 28d on the compression test machine (rate: 2400N/S).
3.1 Calculation of Surplus Coefficient Rc
Under the same test environment, the actual measured compressive strength value of 28d cement has the following relationship with the standard value of cement strength grade:

Among them: fc is the standard value of cement strength (here 42.5 Mpa);
fce is the measured compressive strength value of 28 d cement (Mpa);
γc is the cement strength surplus coefficient [4].
In this test, P.O42.5 ordinary Portland cement produced by 5 cement manufacturers from different sources in W area was selected. Each manufacturer is a set of 12 test pieces. The average values of the measured flexural strength and compressive strength of the cement test pieces 3 d and 28 d of each manufacturer are shown in Tab. 3. The standard deviation values of compressive and flexural strength at 3 d and 28 d are shown in Tab. 4.
Table 3: Average measured compressive and flexural strengths of different cement manufacturers P.O42.5 cement 3 d and 28 d
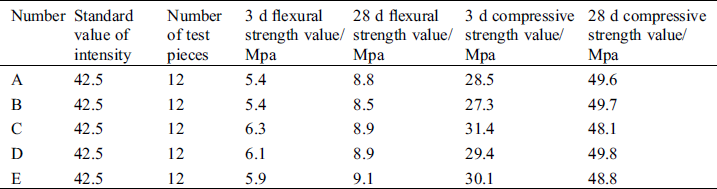
Table 4: The standard deviation values for the compressive and flexural strength at 3 d and 28 d
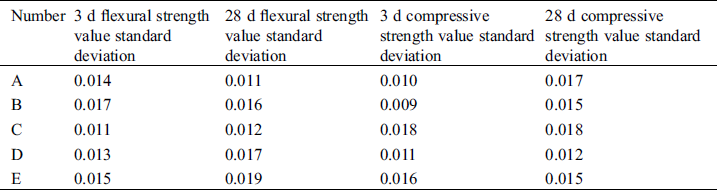
According to Tab. 3, the measured values of the 3 d and 28 d compressive strength and flexural strength of p. O. 42.5 ordinary Portland cement selected in this experiment all meet the standard [5], and the standard deviation values at 3 d and 28 d compressive strength and flexural strength are very small. Therefore, the average values of the measured compressive and bending strength of P.O42.5 ordinary Portland cement at 3 d and 28 d can reflect the compressive and bending strength of P.O. 42.5 ordinary Portland cement at 3 d and 28 d. They all meet the range of intensity values for specified ages (3 d and 28 d). The test process of compressive strength and flexural strength shall comply with GB/T 17671-1999 test method for strength of cement mortar (ISO method) [6].
Calculated from Formula (1), the cement strength surplus coefficient of P.O42.5 ordinary Portland cement produced by five different cement manufacturers is shown in Fig. 1.
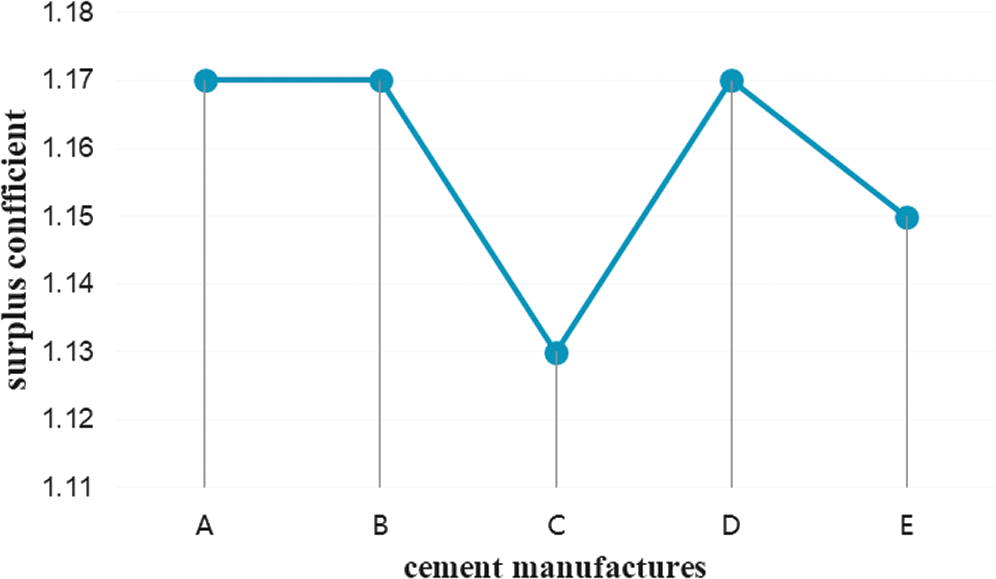
Figure 1: The coefficient of strength surplus of P.O42.5 cement produced by different manufacturers
It can be seen from Fig. 1 that the cement strength surplus coefficient of P.O42.5 ordinary Portland cement in W area is between 1.13 and 1.17, with the maximum value of 1.17 and the minimum value of 1.13. Among them, the surplus coefficient of cement produced by three cement manufacturers A, B and D is the highest. C production is the lowest and E production is the middle. The standard value of cement strength surplus coefficient is 1, and the cement strength surplus coefficient produced by cement manufacturers A, B, C, D and E all exceed the standard value. These five companies all meet the range of cement strength surplus coefficient of P.O42.5 ordinary Portland cement, and the surplus coefficient value can also be calculated [7].
According to the measured data of 3 d compressive strength, the 3 d compressive strength of cements produced by cement manufacturers A, B, C, D, and E are all higher than 50% of the 28 d compressive strength. These five companies all meet the quality requirements of P.O42.5 cement, and the factories have better quality control in the production process.
3.2 Reasonable Value of Surplus Coefficient Rc
The average value of the cement strength surplus coefficient of P.O42.5 cement produced by A, B, C, D and E cement manufacturers is taken as the average value: γc = μ = 1.16.
Through the standard deviation formula:
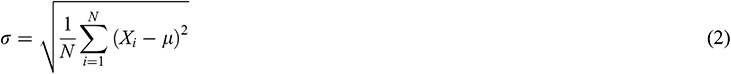
According to the calculation, the standard deviation of the cement strength surplus coefficient σ = 0.016, which is a small standard deviation. It can be concluded that for the mix design of P.O42.5 cement in W area, when there is no actual measured cement strength surplus coefficient value, the surplus coefficient value can be taken as γc = 1.16.
3.3 Significance of Surplus Coefficient to Actual Production
In actual production, if the influence of the surplus coefficient is not considered in the design of mixing ratio, the value of the surplus coefficient γc is 1.0. This will lead to an increase in the amount of cement used, which in turn leads to the actual strength of the concrete exceeding the design strength. When the actual strength of concrete is high, cracks are more likely to occur after the cement is formed, which will cause certain damage to the engineering construction. Take the concrete mix design with design strength of C30 as an example.
The strength of the concrete preparation:

Among them: fcu,o is the strength of concrete preparation;
fcu,k is the standard value of concrete design strength;
 is the standard deviation of concrete strength.
When the design strength of concrete is less than C60, the international water cement ratio [8]:

Among them: w is water consumption;
c is the amount of cement;
fc is the standard value of cement compressive strength;
γc is the surplus coefficient;
aa, ab are regression coefficient when the coarse aggregate used is crushed stone.
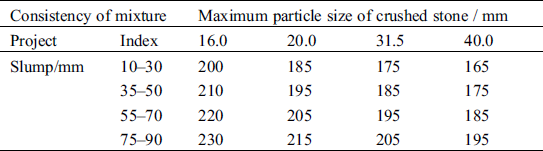
The coarse aggregate is crushed stone with a maximum nominal particle size is 31.5 mm, aa = 0.53, ab = 0.20 can be found in Tab. 5, slump is 75 mm, and water consumption w = 205 can be found in Tab. 6. When the value of γc is 1.0, the amount of cement is 387 kg, and when the value of γc is 1.16, the amount of cement is 342 kg. Water cement ratio is the decisive factor of concrete strength. It can be seen that under the premise of keeping the water cement ratio constant and considering the residual coefficient of cement strength, the cement consumption per square meter of concrete can be reduced by about 43 kg under the premise of ensuring the quality, which brings great economic savings.
Table 5: Value of regression coefficient
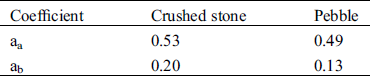
Table 6: Water consumption of plastic concrete / kg/m3
(1) The strength surplus coefficient of P.O42.5 cement in W area is 1.13–1.17, which indicates that the actual strength of P.O42.5 cement in W area is higher than the design strength value.
(2) In the design of the mix ratio, the amount of cement without considering the cement strength surplus coefficient is greater than that with considering the cement strength surplus coefficient. Considering the cement strength surplus coefficient can reduce the cement dosage and save production cost.
(3) Under the same design conditions, when considering the cement strength surplus coefficient, the actual strength of cement is higher than the design strength, which is conducive to improving concrete performance and ensuring engineering quality.
(4) The strength surplus coefficient of P.O42.5 cement measured by representative cement manufacturers in W area is consistent with the actual situation in W area. When there is no actual value of cement strength surplus coefficient in W area, the cement strength surplus coefficient of P.O42.5 can be taken as 1.16.
Acknowledgement: My thanks would go to my beloved family for their loving considerations and great confidence in me all through these years. I also owe my sincere gratitude to my friends and my colleagues who gave me their help and time in listening to me and helping me work out my problems during the difficult course of the thesis.
Funding Statement: The author(s) received no specific funding for this study.
Conflicts of Interest: The authors declare that they have no conflicts of interest to report regarding the present study.
1. Omer, D. (2019). Influences of construction material type and water-cement ratio reduction on thermal transmittance of sustainable concrete mixes. Construction and Building Materials, 196, 345–353. [Google Scholar]
2. Yue, L., Bo, F. (2017). Research on P.O42.5 cement strength surplus coefficient. North Building, 2(1), 56–58. [Google Scholar]
3. Zhang, X. H., Meng, Y. F., Xia, G. P. (2013). Research on Rc of cement strength surplus coefficient in Ningxia. Journal of Ningxia University (Natural Science Edition), 34(3), 246–249. [Google Scholar]
4. He, Y. Q. (2015). Discussion on the surplus coefficient of cement strength grade value. Cement, 10, 49–51. [Google Scholar]
5. Kubissa, W., Jaskulski, R., Reiterman, P. (2017). Ecological concrete based on blast-furnace cement with incorporated coarse recycled concrete aggregate and fly ash addition. Journal of Renewable Materials, 5(1), 53–61. DOI 10.7569/JRM.2017.634103. [Google Scholar] [CrossRef]
6. Wang, C. H., Li, Y. L. (2000). Research on the application of cement label surplus coefficient. Journal of Wuyi University (Natural Science Edition), (1), 49–51. [Google Scholar]
7. Zhu, M. (2000). Discussion on the surplus coefficient of cement label. Gansu Water Conservancy and Hydropower Technology, (2), 94–95. [Google Scholar]
8. Mubarak, K., Bois, K. J., Zoughi, R. (2001). A simple, robust, and on-site microwave technique for determining water-to-cement ratio (w/c) of fresh portland cement-based materials. IEEE Transactions on Instrumentation and Measurement, 50(5), 1255–1263. DOI 10.1109/19.963194. [Google Scholar] [CrossRef]
 | This work is licensed under a Creative Commons Attribution 4.0 International License, which permits unrestricted use, distribution, and reproduction in any medium, provided the original work is properly cited. |