DOI: 10.32604/fdmp.2021.011990
ARTICLE
High-Density Block Transformation to Increase Natural Ventilation Based on CFD Simulation
1Shaanxi Provincial Land Engineering Construction Group Co., Ltd., Xi’an, 710075, China
2Institute of Land Engineering and Technology, Shaanxi Provincial Land Engineering Construction Group Co., Ltd., Xi’an, 710075, China
3Center for Housing Innovations, Chinese University of Hong Kong, Hong Kong
4Guangzhou Urban Planning & Design Survey Research Institute, Guangzhou, 510060, China
*Corresponding Author: Guanqi Huang. Email: 4102090209@chd.edu.cn
Received: 09 July 2020; Accepted: 30 December 2020
Abstract: Many countries in the world have experienced extremely rapid urbanization during recent decades. The rapid development of densely populated areas has produced many urban environmental problems. This research explores the relationship between urban morphology and ventilation conditions. Through 3D modeling and Computational Fluid Dynamics (CFD) simulation, we focus on the large scale ventilation of an extended area with several buildings. As a testbed, in particular, the core part of Kwun Tong industrial park in Hong Kong is examined, and in order to validate the approach, 10 measurement points are used to get experimental values to be used for comparison (such points are located in different positions involving traffic road, pedestrian path and open space). The error range (±0.7 m/s) indicates that the agreement between field measurement and CFD calculation is good. On the basis of design guidelines and earlier studies, the effective configuration (in terms of building) of this area is partially transformed (virtually, i.e., in the numerical simulations) in order to assess the ensuing changes in terms of wind speed in different locations. This results in a general design and analysis methodology potentially applicable to other areas.
Keywords: CFD; thermal comfort; ventilation; open space
Hong Kong is one of the most densely populated areas in the world [1,2]. A large number of high-density blocks create necessary spaces for urban development. It promotes the economic development. However, the rapid development has resulted in the deterioration of the urban environment [3,4]. Urban heat island (UHI) is a significant urban environmental issue. It is one of the alarming phenomena, which is closely related to human health [5]. In general, it is effective to mitigate UHI by reducing building density [6]. According to precedent studies, the temperature in downtown place of Hong Kong is 4°C to 5°C higher than suburb’s [7]. The increasing UHI and air pollution makes people realize the importance of urban ventilation. Urban ventilation is directly affected by local meteorological conditions and urban morphology [8]. Many researches indicate that urban ventilation has strong cooling potential under different meteorological conditions, especially sea breeze in coastal cities. Through the introduction of cold and moisture air flow, the outdoor thermal comfort will be greatly improved [9,10].
Urban morphology is the main factor to determine the urban surface microclimate [11]. It is the study of urban forms including building configuration and land use pattern [12]. There is a negative correlation between building coverage ratio and pedestrian-level wind velocity in an urban block. Basically, the increase of building density causes the decrease of the ground air flow, which leads to an increase of surface temperature [13,14]. Many urban problems, even urban diseases, now widely exists in Hong Kong and influenced human’s health negatively [15]. Through the analysis of urban surface characteristics, involving urban block compactness, building height and street structure, regional ventilation performance can be researched synthetically [16]. As a passive strategy, it has been regarded as an important way to mitigate UHI and to improve outdoor air quality [17]. One of the main reasons is that appropriate urban form will be conducive to introducing air flow. Edward Ng indicated that wind is beneficial in high-density cities, and urban design guidelines, such as air path, orientation of street grids, linkage of open space, should be adopted to improve ventilation capacity [18]. The improvement of ventilation capacity can enhance air flow. As a result, it is conducive to dividing urban heat field, reducing regional temperature and alleviating UHI effect. In addition, it can accelerate the emission of pollutants, such as automobile exhaust, and finally improve air quality [19,20]. Therefore, the optimization of ventilation capacity should be taken into consideration during the process of urban design and urban planning.
Computational Fluid Dynamics (CFD) is a method of digital analysis and simulation for the problems of fluid mechanics [21]. Currently, many researchers utilized CFD to simulate building wind environment, thus analyzing the characteristics and regular pattern of air flow [22,23]. Eventually, the planning and building design will be optimized through CFD modeling and analysis. Scientific simulation for sustainable urban design and renovation can be used to eliminate negative effects and to facilitate community efficiency. With the rapid growth of urbanization, urban expansion and the increase of population has resulted in a decrease and deterioration of open space [24]. Open space is also a very important issue. Firstly, it reflects the diversity of land use. Through the reform of open space located at the center of the research site, the ventilation can be fairly improved. Secondly, from the view of humanistic concern, this method has a positive impact on pressure mitigation and social communication [25]. Lastly, it is believed that the establishment of open space can offer people especially the building owners long-term benefits resulting from the increase of productivity. The overhead space of ground floor (bottom) is an open ground space layer with only structural support and no external enclosure structure. The analysis on hypothetical renovation of bottom overhead space can be used to compare the ventilation efficiency in a bottom overhead construction and in a non-bottom overhead construction. It is a common design method of dehumidification and regional cooling in hot and humid areas, such as Pearl River Delta, south of China [26]. In Hong Kong, it had been widely used in various kinds of buildings. On the one hand, bottom overhead space can be used as parking lot, which meets the demands of car parking. On the other hand, bottom overhead construction increases thermal comfort in high-density area, which creates a good air flow condition. This research aimed at: (1) Analyzing the present ventilation situation of high-density block through CFD; (2) Analyzing the ventilation after hypothetical improvements through CFD, especially bottom overhead design strategy; (3) Exploring the significance of urban block forms for promoting regional ventilation and human thermal comfort.
Kwun Tong is located in the east of the Kowloon Peninsula and it is one of the largest administrative regions of Hong Kong. The land area of Kwun Tong is 11.26 km2 and the population was about 58 million people. Kwun Tong includes Kwun Tong Town Centre, Ngau Tau Kok, and Kowloon Bay, Sau Mau Ping, Lam Tin, Yau Tong and some other places. The north is Lion Mountain, the south is Lei Yue Mun, the east is Fei Ngo Shan and the west is coastal area connecting the old airport runway in the north.
With the manufacturing industry declining, a large number of factories in this area were unused and neglected since 1990s. The areas near Kwun Tong Station were converted into commercial buildings or warehouses and the private residential areas only accounted for 30% of the whole area. Since 2005, the Redevelopment Authority established Kwun Tong district advisory committee and the redevelopment of Kwun Tong area began. In this research, a core area inside Kwun Tong was selected as an example. Like the majority of the areas in Kwun Tong, there were a lot of compact high-rise industrial buildings. The design considered less about the natural ventilation in the past. Therefore, this area had been suffered from narrow streets and limited open space. Nowadays, people paid more attention to the comfort and heath of living and working environment. Thus, urban transformation and renewal was of great significance to urban sustainable development. Now the Hong Kong government had proposed a series of strategies and measures to create a better environment and lots of rebuilding projects were born, which was also a good opportunity for Kwun Tong area to renovate the unreasonable urban forms.
As shown in Fig. 1, the site area of this research is a rectangle defined by How Ming Street, Hoi Yuen Road, Hung To Road and Tsun Yip street. The surrounding area is surrounded by King Yip street, Wai Yip street and How Ming street. The long edge of the site is about 213 m and the short one is about 192 m. The total area is approximately 40896 m2.
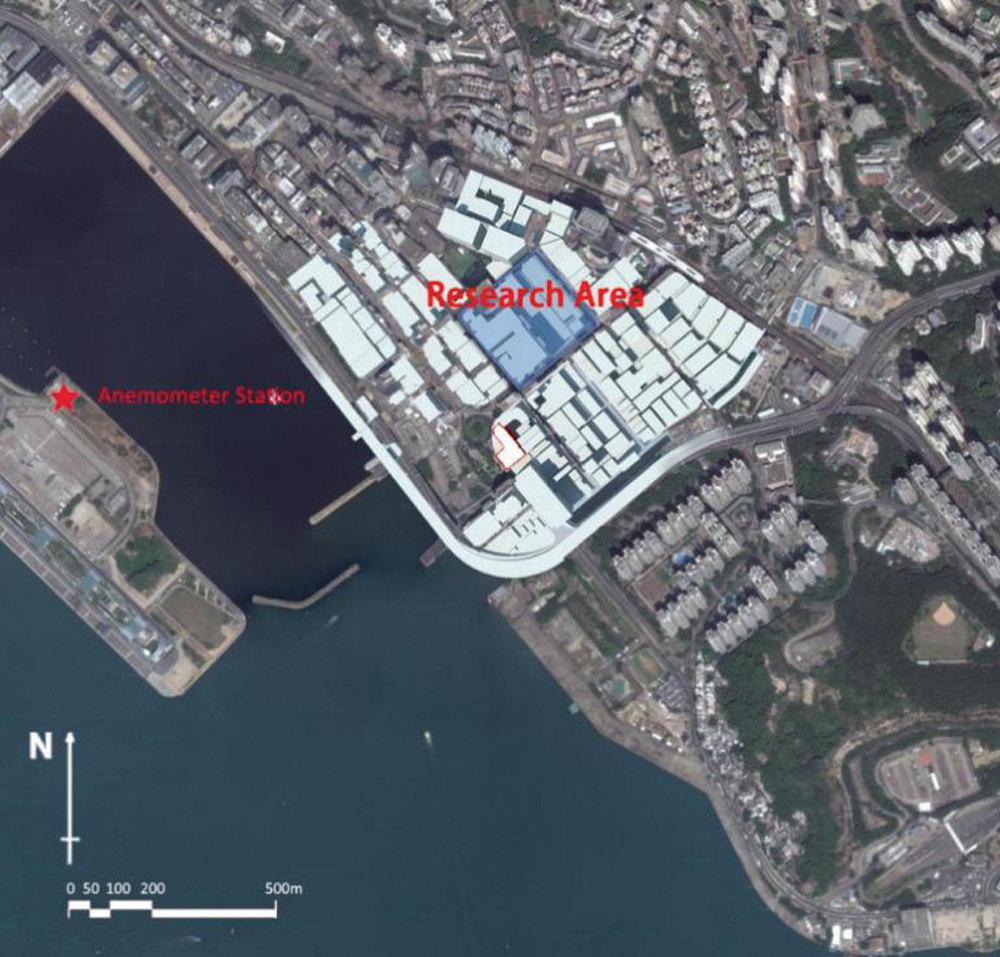
Figure 1: The core of Kwun Tong area (Google Earth)
Hong Kong (22.32°N, 114.17°E), which is located in the south of China, has a subtropical climate. The temperatures are relatively high throughout the year, and the annual average temperature is 22.8°C. The weather in summer is hot and humid that temperatures are between approximately 26°C–32°C, while the weather in winter is cool and dry, however, the temperatures are rarely dropped below 5°C. It is rainy between May and September. There may be typhoon between summer and fall and it is typhoon season from July to September in Hong Kong. Hong Kong’s average annual rainfall is 2,214.3 mm. The maximum rainfall month is August while the least rainfall month is January. In terms of wind information of our study area, Kwun Tong had not built its own meteorological observation station, so data were collected from Kai Tak wind station (Anemometer Station), which was the nearest anemometer station to the Kwun Tong area (Fig. 1).
From the wind statistics, it could be seen that the prevailing wind was from southeast and east directions. Totally over 30% came from these directions. 135°, 112.5° and 90° were the largest percentage occurrence of wind directions respectively. In terms of wind speed, it was in the range from 3.3 m/s to 7.9 m/s normally in non-typhoon weather [27]. In this area, monsoon climate was obvious.
In this research, the usage characteristics of each building were specified through field investigation. It was found that the building density in research area was very high. The buildings were mainly used for industrial and storage, whose first floor was normally private parking lot. Additionally, there were very narrow paths between buildings, which were also piled up with various sundries. The narrowest place of these paths was only about 1 m while they were very important to pedestrian. Combined with satellite images and field measurements, a geometric model, consistent with the actual scale, was established in SketchUp Pro (Trimble, Inc., 8.0). The building coverage scope was 213 × 192 m2 (W × L), and the highest building was 141 m. As shown in Fig. 2, obviously it was a high-density block and the spatial forms were very complicated.
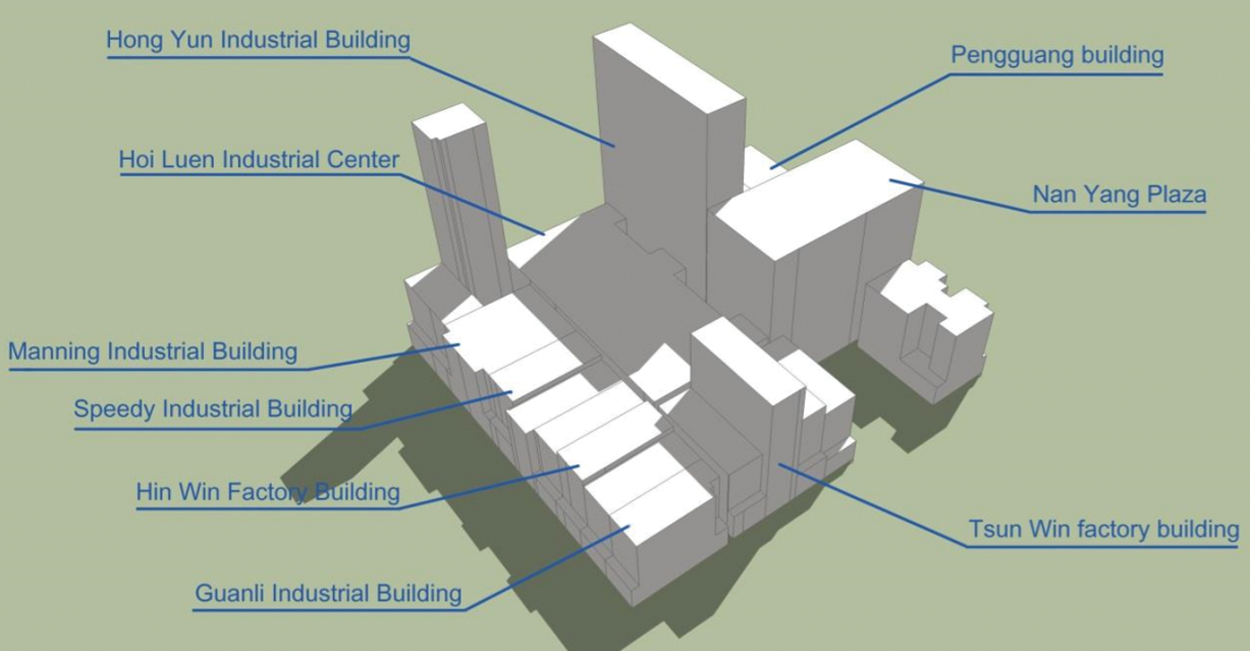
Figure 2: The geometric model in SketchUp Pro and their usage characteristics
This research used SketchUp Pro to build a scale of 1:1 model. In order to ensure that the simulation conditions were similar to the actual situation as much as possible, we made the surrounding buildings of the study area. In this research, domain meshes were created in Harpoon (Sharc, Ltd., v4.3a). Considering the influence of surrounding urban morphology, the surrounding buildings, especially in the southeast of the research area, were added in the computational geometry, which made the calculation more correspond to the actual situation. The block in the southeast would reduce the wind velocity. As a result, the domain dimension was 700 × 700 × 200 m3 (W × L × H) (Fig. 3). The surface cell size was 2 m and the mesh type were hex dominant. Based on the research focus, a refinement zone was created at pedestrian level (1 m < z < 2 m) (Fig. 4). The cell size was 1 m in the refinement zone [28]. Totally, there were 1369015 cells and 1580282 nodes (Tab. 1).
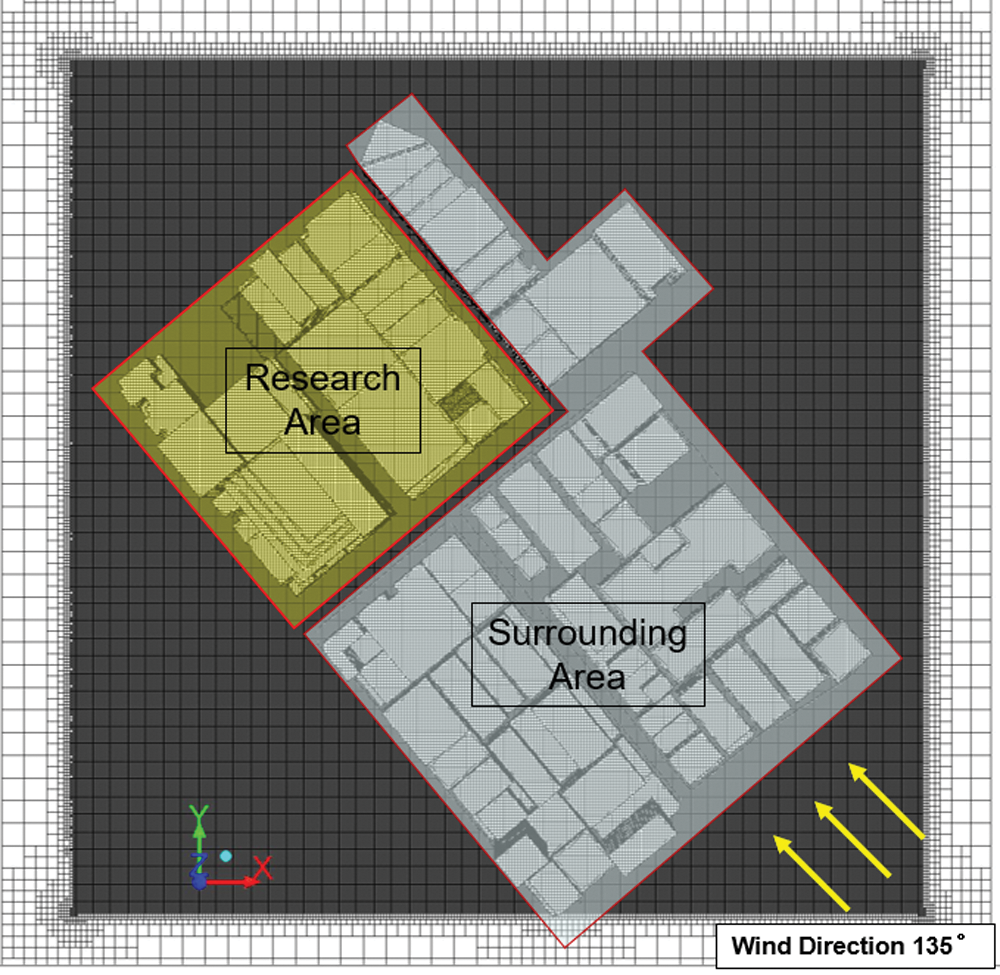
Figure 3: The meshes of research area and its surrounding area
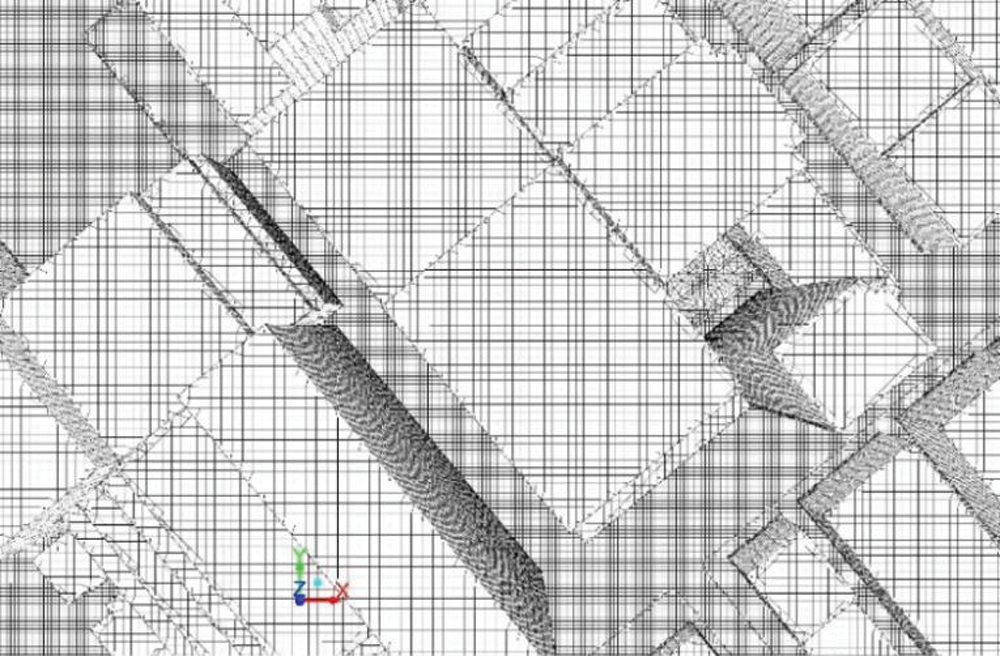
Figure 4: The detail view of meshes and the refinement in pedestrian level

Fluid flow is mainly divided into laminar flow and turbulent flow [29]. In general, laminar flow only occurs in a very few specific cases and turbulence flow is very common. Fluent provides various turbulence models, such as Spalart-Allmaras model, k-epsilon (k-ε) model, k-omega model and Reynolds stress model. The realizable k-ε model was utilized to simulate urban air flow in this research. Urban air is viscous incompressible gas [30]. Compared with standard k-ε model, realizable k-ε model uses a new turbulent viscosity formula. The calculation results more accord with the actual situation. The transport equations of turbulent kinetic energy and dissipation rate of the realizable k-ε model are given as follows:


where:

In the above equations, Gk represents the generation of turbulent kinetic energy caused by the average velocity gradient, Gb is used for the generation of turbulent kinetic energy caused by buoyancy effect, and YM is the effect of turbulent pulsating expansion on the total dissipation rate. C2 and C1ε are constants; σk and σε are turbulent Prandtl numbers of turbulent kinetic energy and its dissipation rate respectively. In Fluent, as default constants, C1ε is 1.44, C2 is 1.9, σk is 1.0 and σε is 1.2. Standard Wall Functions were selected to conduct Near-Wall treatment.
The calculation of Fluent is based on the finite volume method. By dividing the calculation area into grids and making each grid point have a non-repeating control volume, the differential equations to be solved are integrated into each control volume, thus a set of discrete equations is obtained. The finite volume method is suitable for irregular meshes and parallel computation, but its accuracy is relatively low. This study focused on the analysis of the impact of urban morphology on urban ventilation, and finding out its change rules. Therefore, Fluent can fully meet the demands of this research.
The Fluent fluid materials were set to air. Its properties are constants that density is 1.225 kg/m3 and viscosity is 1.7894 × 10⁻⁵ kg/ms. The solid materials were set to aluminum (al), whose density is 2719 kg/m3. This research mainly considered about the prevailing wind that was from southeast (135°). The boundary conditions would reflect the actual situation as much as possible. Therefore, the type of velocity-inlet was applicable to the far fields Max-x and Min-y. Influenced by the building height, the wind velocity increases with the raise of the distance from the ground, and finally reaches the maximum and becomes constant [31,32]. Therefore, according to on-site investigation, a calculated point profile of boundary condition was imported to specify the flow from the boundary. Velocity boundary conditions that velocity was positively correlated with altitude were applied at the velocity-inlets (Fig. 5). The maximum in the top was 6.67 m/s. While the far fields of Min-x and Max-y were pressure outlets. The Min-z was the type of stationary wall that the roughness constant was 0.5 and the Max-z was symmetry. Semi-implicit method for pressure-linked equations (SIMPLE) pressure-velocity coupling was applied to solution methods. Through specifying Under-Relaxation Factors, the nonlinear variation was controlled. Among these fixed parameters, the turbulent kinetic energy and the turbulent dissipation rate were both 0.3.
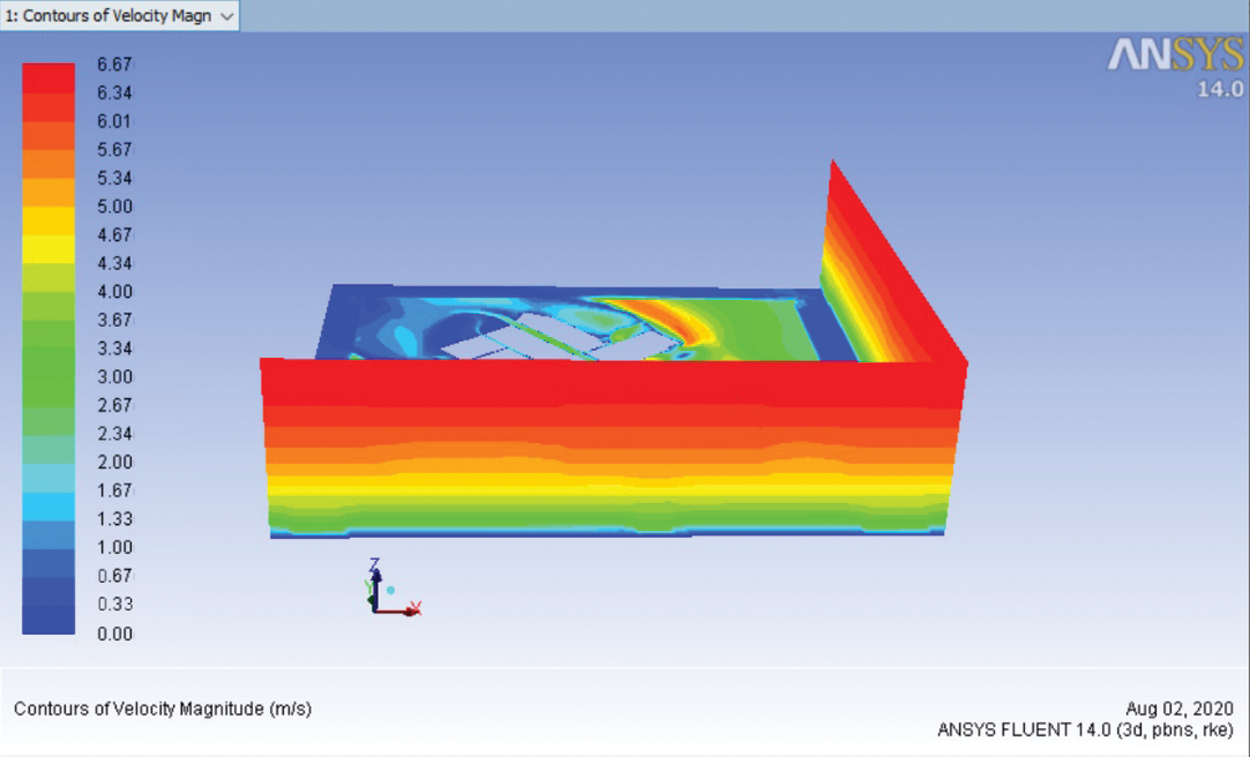
Figure 5: The contours of velocity magnitude (m/s)
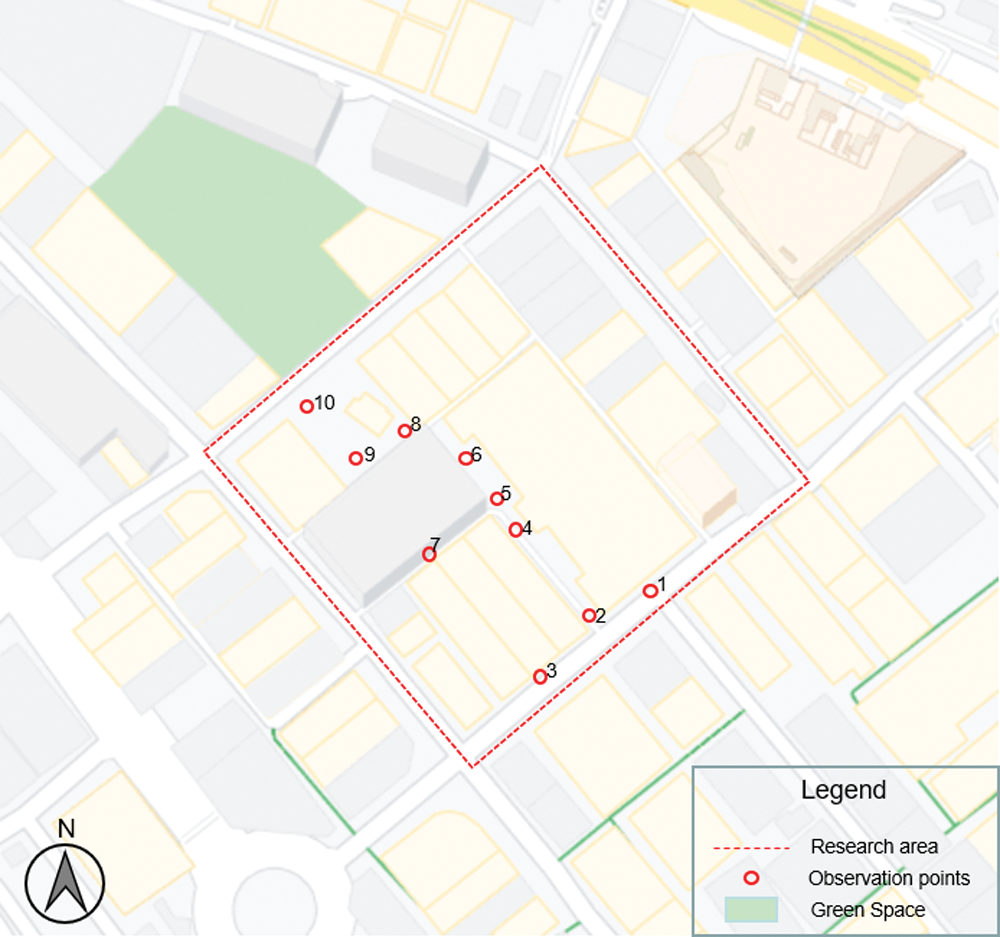
Figure 6: The observation points in research area
There were totally 10 observation points in research area. According to different spatial forms, observation points were divided into 3 classifications, including traffic road, pedestrian path and open space (Fig. 6). The mobile anemometer (Ambient Weather, WM-4) was utilized to conduct field measurement. According to relevant researches, October, November and December are considered to be windy months. Based on the analysis of meteorological data of Hong Kong observation station (HKO), the wind speed usually reaches the maximum value at 12:00 noon [33]. Therefore, the field measurement started at 12:00 noon. Each point was measured 10 min. The wind speed was recorded every minute and then the mean velocity was calculated. Compared with Fluent result, it could be found that the error range of mean wind speed of field measurement (Vm) and mean wind speed of Fluent calculation (Vc) was within ±0.7 m/s except point 5 (Fig. 7). Additionally, Vm and Vc had the same variation trend. Within each group, the numerical relationship between different values was very similar. Consequently, there was a good correspondence between Vm and Vc. With the development of CFD technology, many guidelines were proposed, which was reliable. Compared with wind tunnel experiment, CFD is more practical and efficient [34]. In order to obtain more accurate results, this study referred to these guidelines.
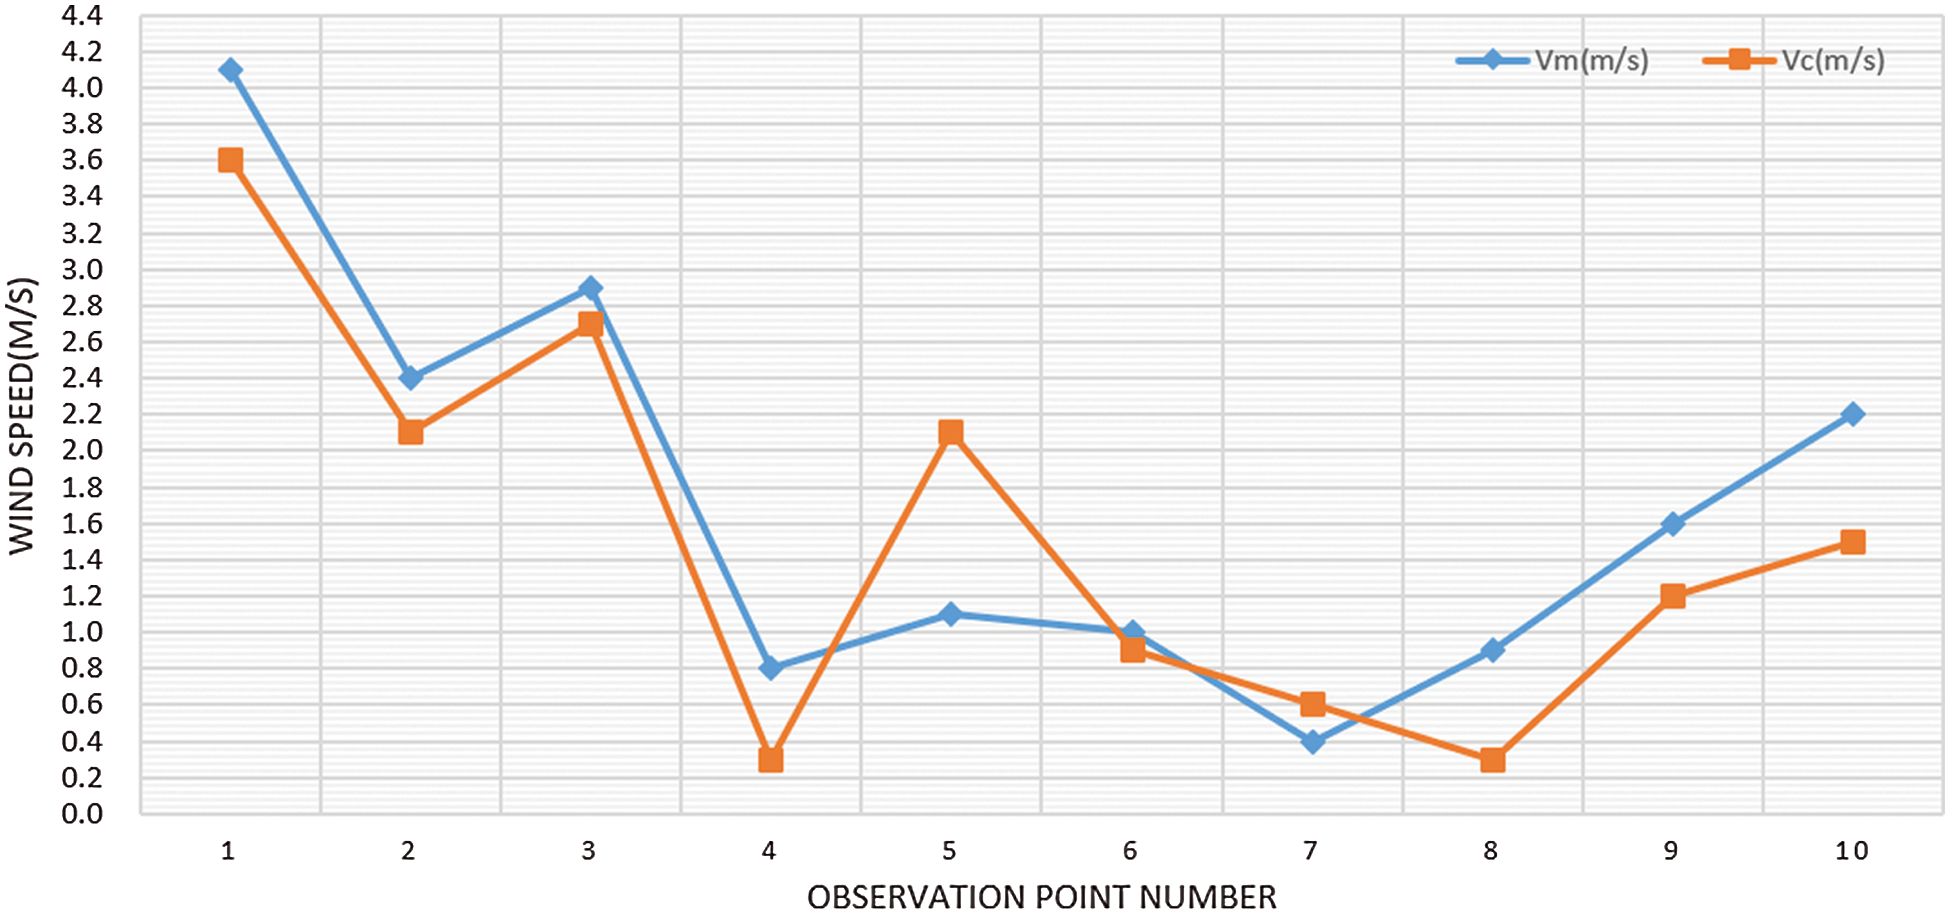
Figure 7: Mean wind speed of field measurement and Fluent calculation
Reduction of floor area and properly increasing the height of building will create much more ground space, which can be partly used as open space. At the same time, pedestrian path widening and stepping height profile of building will have positive impacts on improving ventilation. Based on on-site survey, it is believed that open space can bring vitality into this area. The released ground space assists to increase the diversity of land use. Therefore, it offers people enough space to relax. The open space is not limited within ground space. The open space which is on the roof is also available. More importantly, it is regarded as a very efficient way to enrich people’s life. Lastly, a lot of existing problems can be solved according to these strategies mentioned above, such as insufficient parking space, poor street environment and interior space ventilation. This old industrial area would be regenerated and full of vitality.
According to the precedent analysis, the existing problems regarding thermal comfort were apparent. In order to solve these problems through building design and space transformation, the basic improvements were made based on the modelling of SketchUp Pro. As a result, the new model was built and analyzed for conducting CFD simulation afterwards. Fig. 8 showed the general improvements from the plan view. The colored areas in the new model manifested big changes we made. This project was about regional renovation. Therefore, only effective configurations of buildings were partially transformed. The core of improvements was to increase the ventilation environment not only at pedestrian level but also on podium level. These improvements mainly resulted from the analysis of air flow simulation. According to the design guidelines and sustainable understanding, the improvements mainly included widening pedestrian path, terraced podium, varying height profile, enlarging open space, and bottom overhead space transformation. Fig. 8 clearly showed the reduction of building scale which made the pedestrian path much wider from 3 m to 15 m. And the building height was partly reduced from 42 m to 37 m. It could have positive impacts on introducing air flow from southeast (135°). Adding new terraced podium in the south of the site was shown in Fig. 8. The blue block was the new terraced podium whose total height was about 20 m. This improvement was to increase central plot ratio. In addition, it would mitigate the negative influences originated from the excessive wind pressure in this corner and introduce air flow to deep area. It was worth mentioning that the terraced podium design would also offer people, who were walking on the street, a good view experience. The lack of variety in building height inside the site especially along the road could not facilitate the air flow. Through partly reducing building height in the north of the site, there could generate air re-circulation. Besides, varying height profile could make air movements stronger.
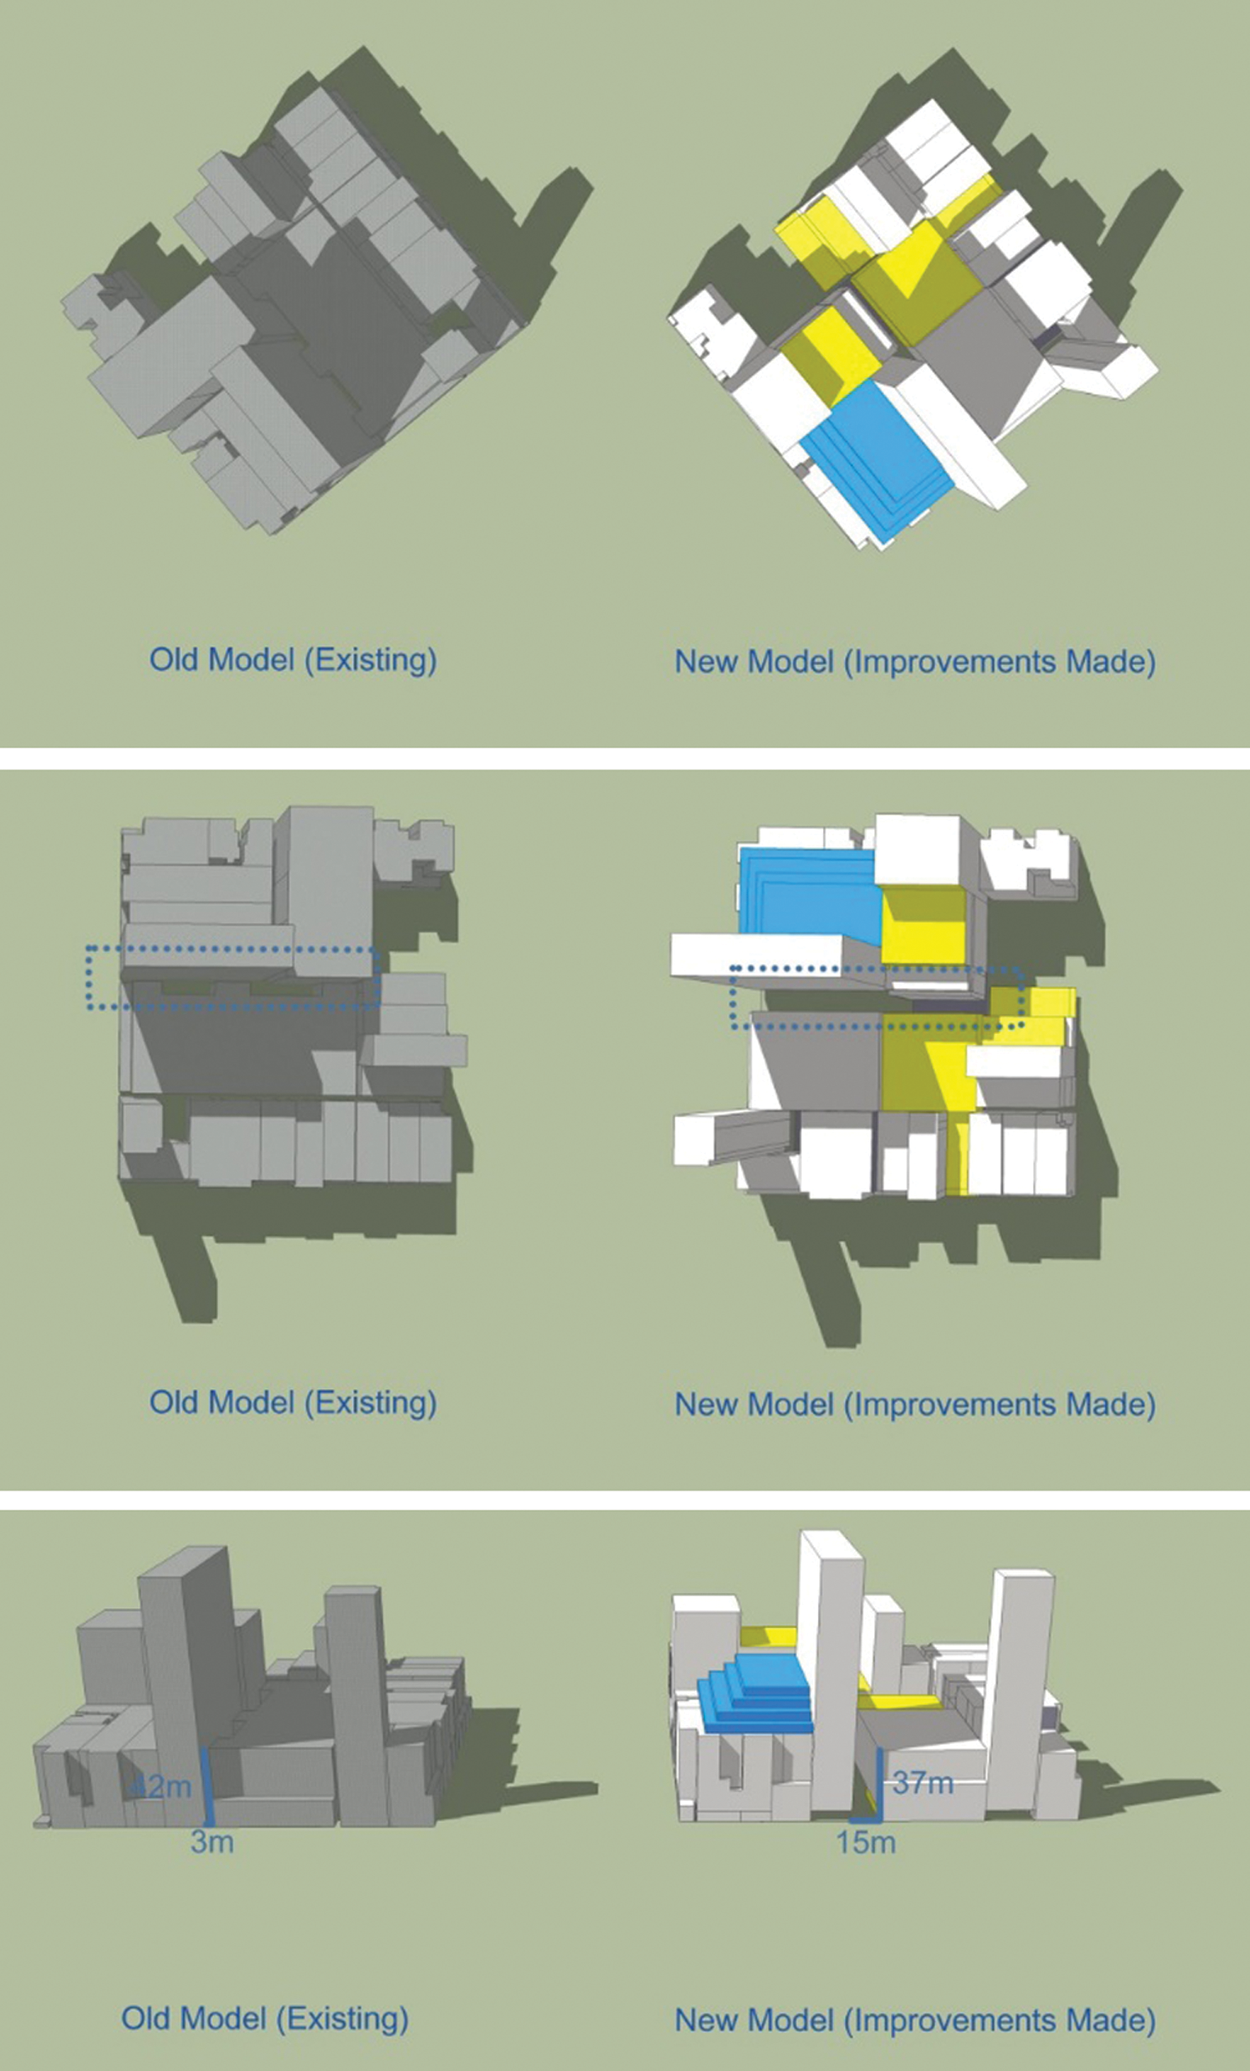
Figure 8: The old model with existing shape and new model with design improvements
As elaborated above, the podium open space was as important as ground open space, which formed an integrated open space system. Another key point was about open space connection. To the west of the site, there was a relatively big existing open space. Considering the lack of open space both inside and outside the site, the improved open space was made in the west of the site. From Fig. 8, it could be seen that various open spaces were in a close relationship. To an extent, they were deemed as a whole. Combined with bottom overhead space, it was believed that the combination of open space and semi-open space would be energetic.
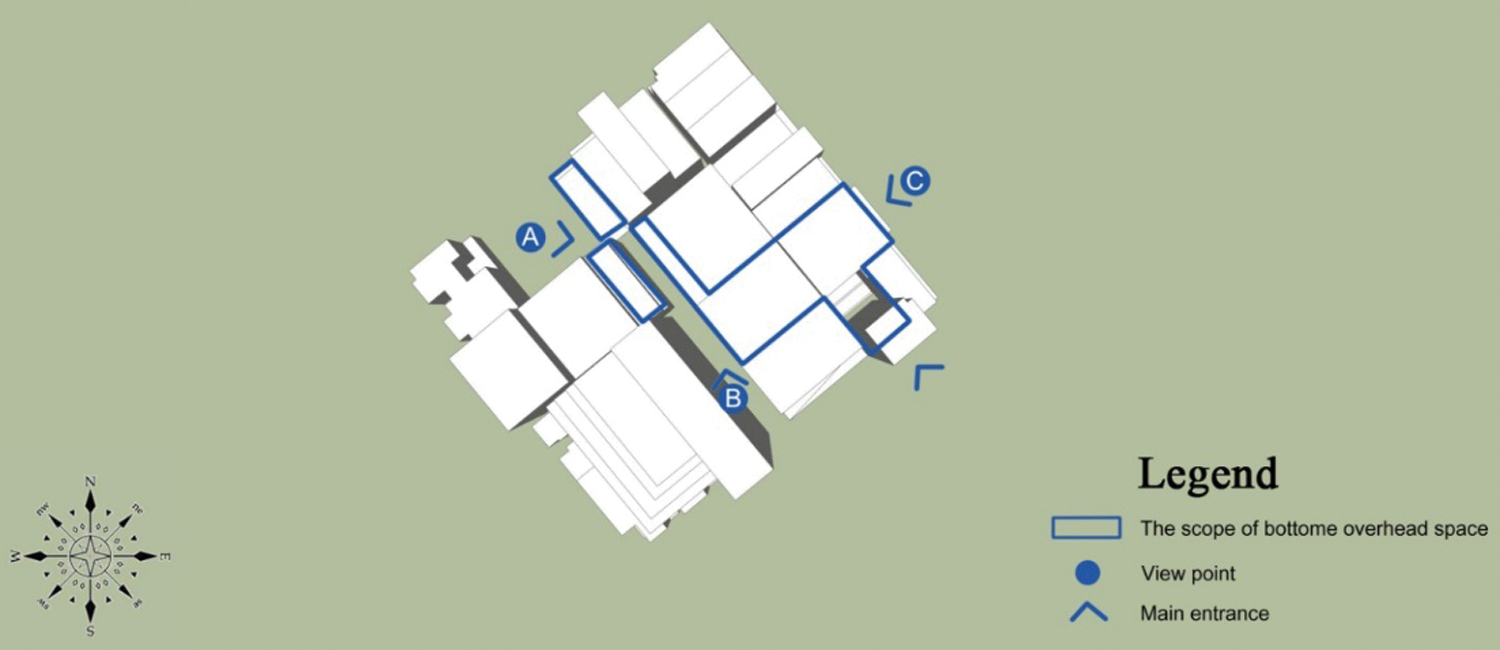
Figure 9: The scope of bottom overhead space
During the process of on-site survey, the parking issue was very obvious. From the view of building function, it could be found that generally the ground floor of every building was used for parking lot. These parking lots were close and discrete spaces. In order to solve thermal comfort issue as well as social issue, the parking connection and bottom overhead space was utilized as an important method. Fig. 9 showed the boundaries of bottom overhead space. The bottom overhead space would be partially used as parking lots, which could raise the thermal comfort of people especially at pedestrian level. The size of pillar was a 1 m long square with 6 m high. The distance between each pillar was set to 8 m, which accorded with the basic economic requirements and regional codes (Fig. 10).
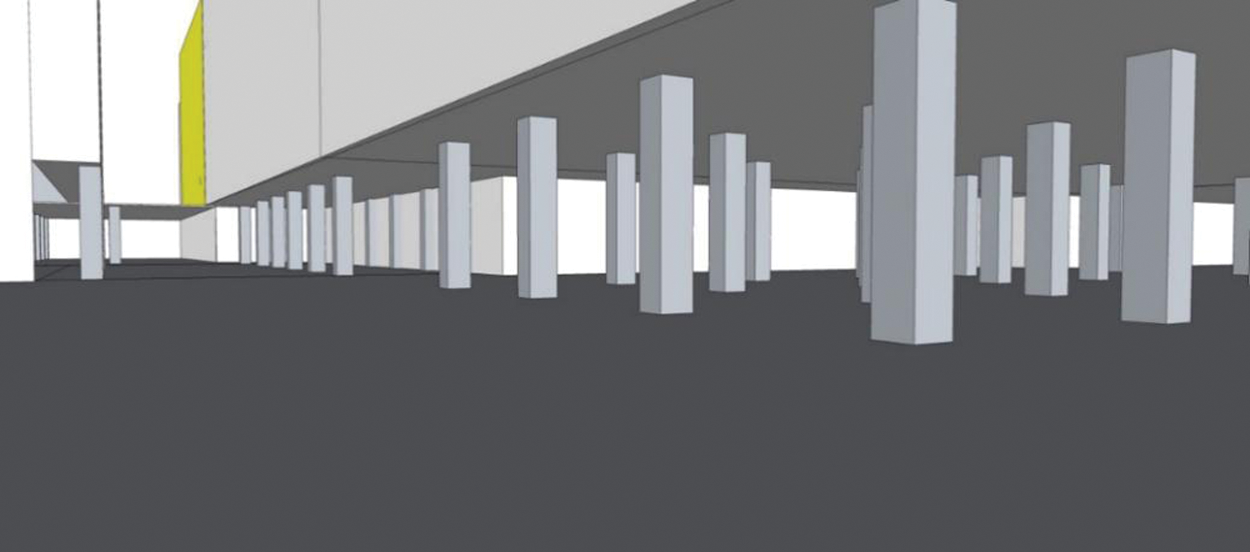
Figure 10: The pillars in view point B
Fig. 11 showed the wind speed contours on pedestrian level (z = 2 m). The air flow was good on the traffic road towards the southeast. The wind speed decreased from north (VC = 5.7 m/s) to south (VC = 2.7 m/s) gradually. In the scope of research area, wind speed reached the maximum in observation point 1, which was 3.6 m/s. Obviously, the traffic road towards southeast created a wind corridor. However, the air flow on pedestrian path was weak, the wind speed in points 4, 6 and 7 were all less than 1.0 m/s. Especially observation point 4, it was almost windless and wind speed was only 0.3 m/s. Similarly, the wind speed of points 8, 9 and 10 did not reach the expected value. These three points were located in the open space inside the block, whose mean wind speed value was 1.0 m/s. Open space is very important for human activity and it is necessary to create a good ventilation environment.
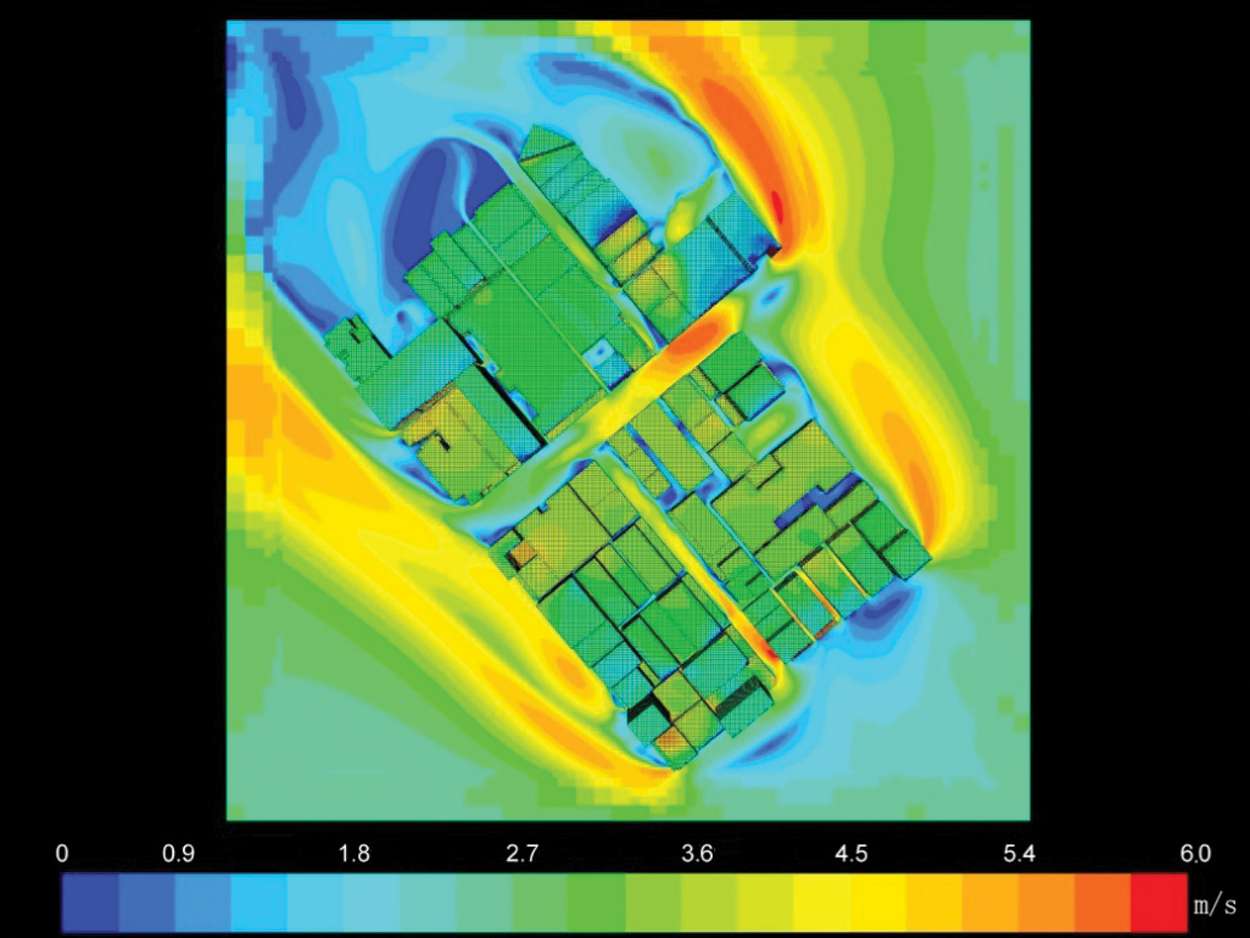
Figure 11: Wind speed contours at plan view (135°)
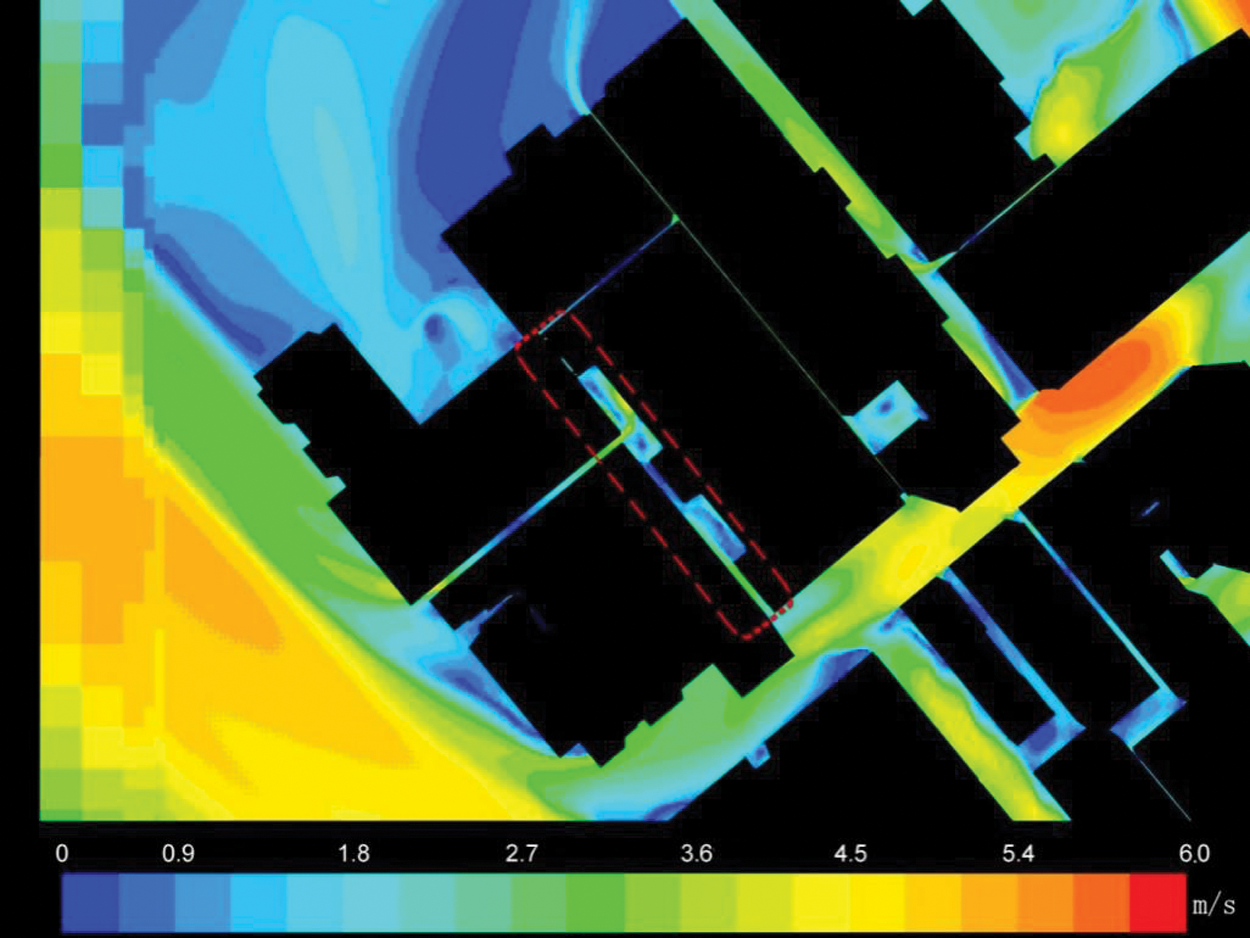
Figure 12: Wind speed contours at research area (135°)
Fig. 12 showed the wind speed contours at detail view on pedestrian level (z = 2 m). Some existing problems were more obvious. The surrounding road towards the southeast generated a good ventilation corridor. However, the high construction wall and narrowly pedestrian path had significantly restrained the interior ventilation efficiency. According to prevailing wind direction, ground space was enlarged inside the site through pedestrian path widening and building setback. Through partly increasing central plot ratio, the ground space could be released as well. At the same time, the gross floor area would not be cut down. On the contrary, it could be added to a certain degree.
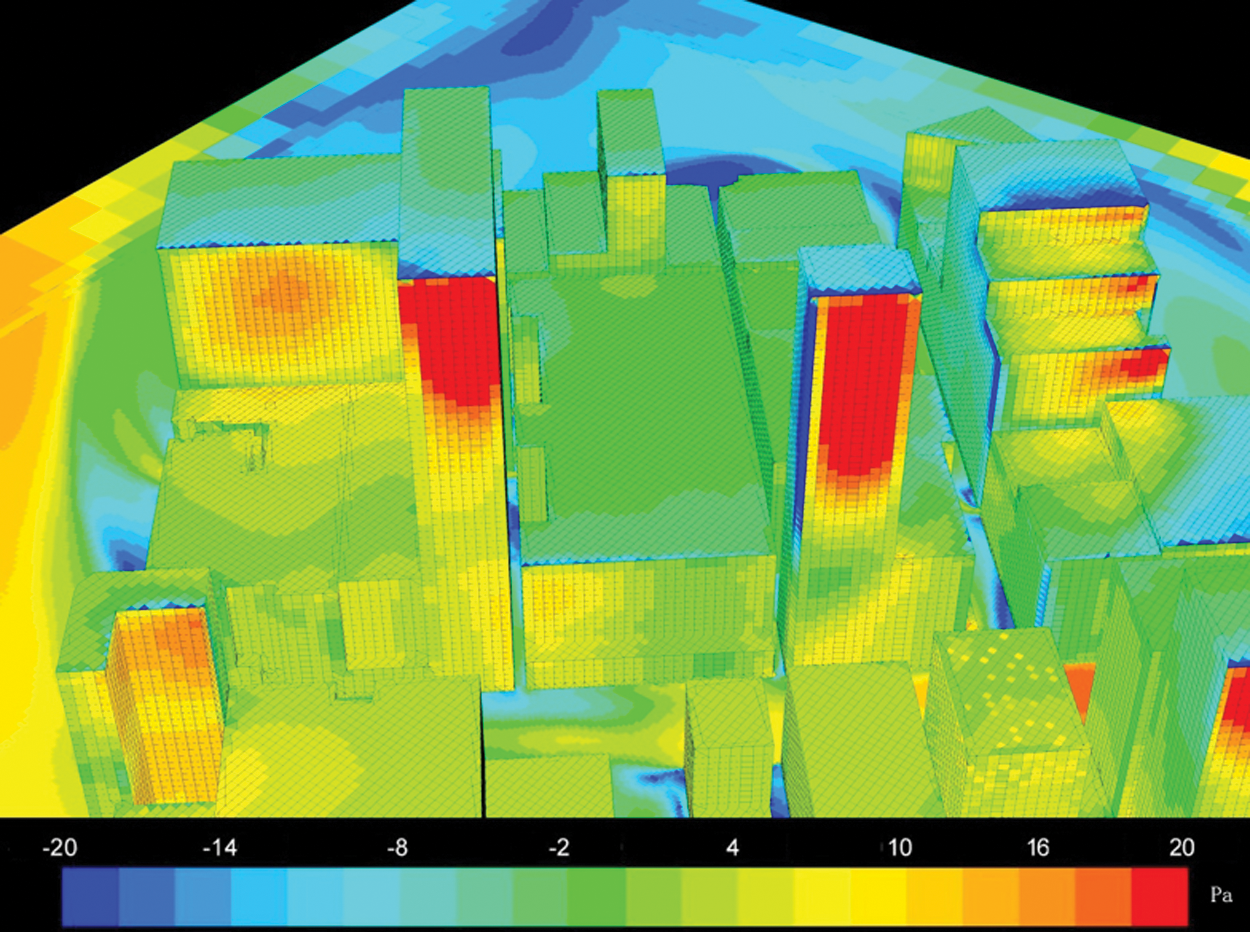
Figure 13: Wind pressure on buildings surface (135°)
The contours on buildings represented the different wind pressure on them (Fig. 13). The wind pressure range was from –20 Pa to 20 Pa. Through the identification of wind pressure on buildings, the spatial wind resource could be better recognized. On the one hand, due to the viscous effect of roughness on air flow, the wind speed decreases with the height decreasing. The maximum pressure appears on the windward side of the building top. On the other hand, high wind pressure on building surface were probably impacted by along-wind corridor.
In order to maintain consistency of our research, the basic parameters were the same, which was convenient to carry out comparison. The wind speed contours at plan view (Fig. 14) showed the air flow improvements on pedestrian level (z = 2 m). Especially the air flow efficiency in some narrow public space had been enhanced significantly.
From Fig. 15, it could be found that the regional ventilation environment had been greatly improved at pedestrian level (z = 2 m), especially on pedestrian path. There were totally 5 observation points whose ventilation capacity was raised. Among them, the point 4 was the most obvious, which increased from 0.3 m/s to 3.3 m/s, 10 times larger than before. Besides, the wind speed in points 5, 6, 8 respectively increased 42.9%, 166.7% and 600.0%. At the entrance of the path, the wind speed in point 2 increased from 2.1 m/s to 3.3 m/s, which was 57.1% larger than before.
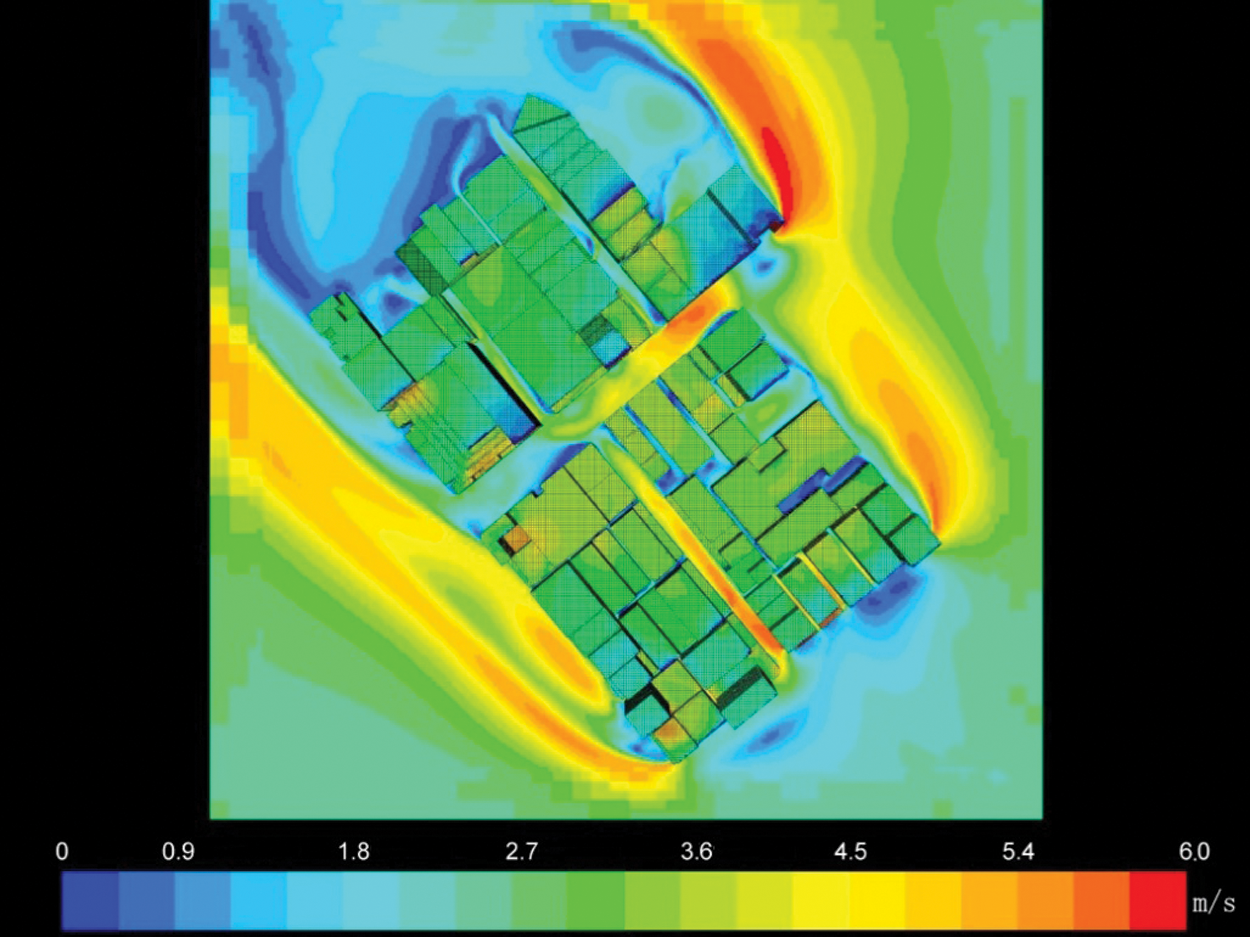
Figure 14: Wind speed contours at plan view (135°) (Improvement Plan)
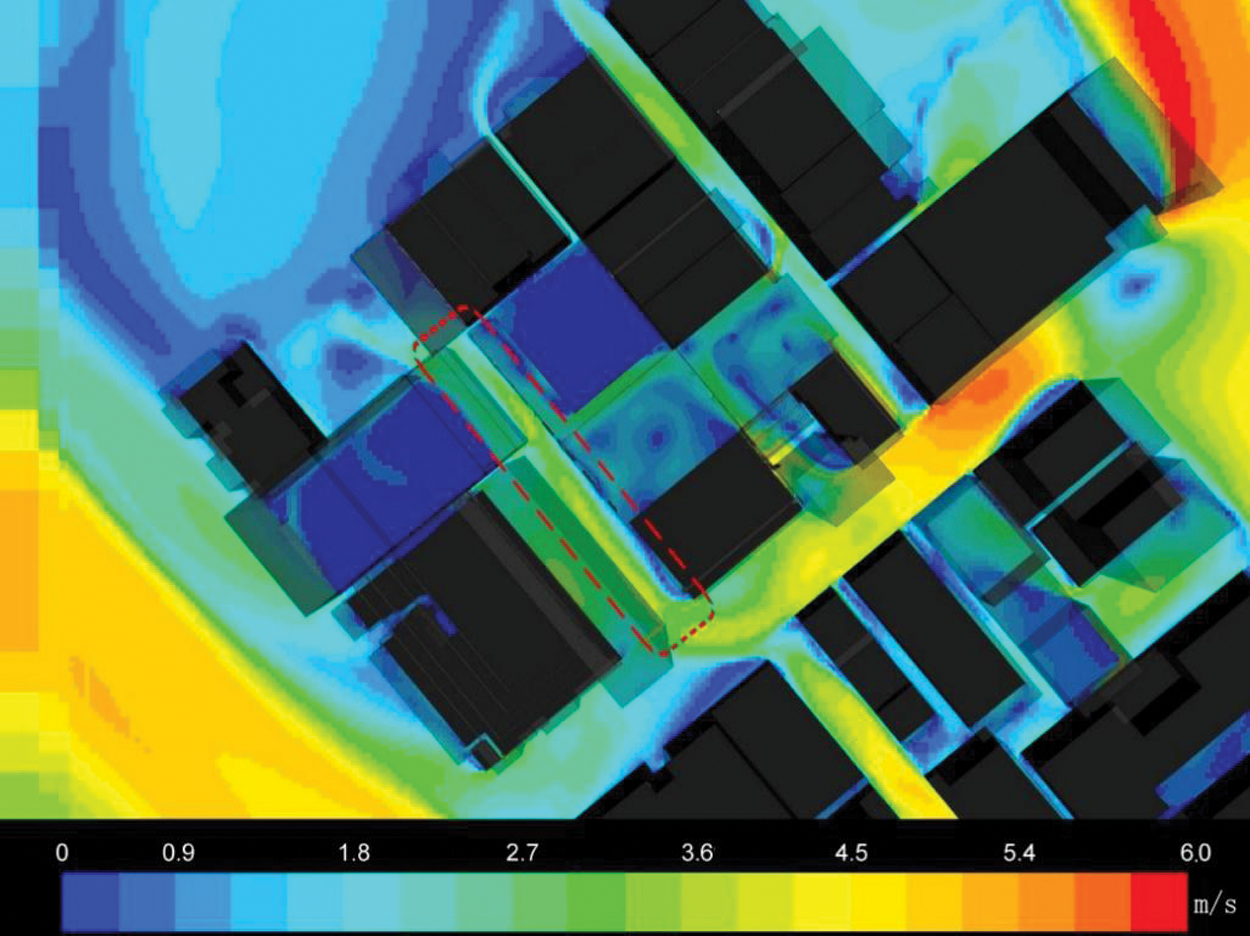
Figure 15: Wind speed contours at research area (135°) (Improvement Plan)
As mentioned before, the width of this road which was dotted in Fig. 15 had been increased from 3 m to 15 m. According to the analysis of prevailing wind direction, especially the southeast wind (135°), the existing roads towards the east of the chosen site generated a good air flow corridor. The open space in the west of the site also enjoyed the improvement of widen street. In the southeast façade of the site, the decrease of building scale directly facilitated the air flow from this wind direction. Besides, the bottom overhead space had active impacts on air flow at pedestrian level as well, especially the southeast wind direction (135°). From the view of the whole area, this kind of change was effective. The contours on buildings showed the difference of wind pressure. The air flow on the ground parking lots could be seen through semi-transparent areas. Through the transformation of bottom overhead space, the wind was introduced into the interior buildings. Importantly, some small-size wind corridors were generated on ground floor of different buildings, and the maximum of wind speed could reach 3.0 m/s. This boosted the circulation of air flow in parking lots and the emission of the car exhaust.
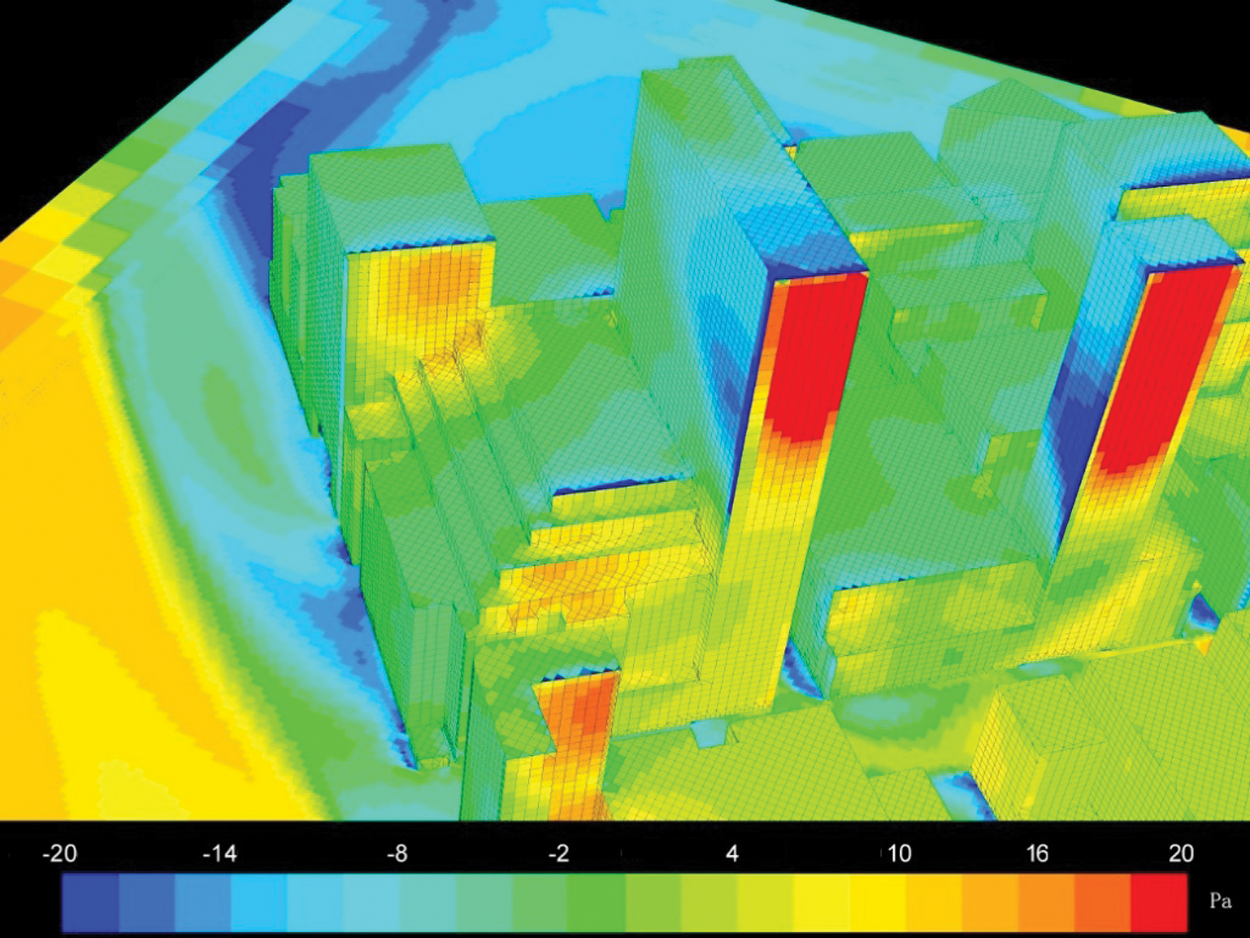
Figure 16: Wind pressure on buildings surface in research area (Improvement Plan)
The wind pressure on buildings would be helpful to do comparative analysis, the terraced podium design not only formed a good view, but also better introduced air flow (Fig. 16). Similarly, the widened pedestrian path played an important role in improving the internal ventilation.
Urban morphology is complicated. Focusing on the human comfort, some specific areas related to human activities should be renewed with sustainable methods. CFD provides an efficient way to analyze urban environment, especially ventilation. Based on design guidelines and precedent studies, this research adopted scientific simulation and field measurement to analyze the relationship between building forms and air flow condition in high-density block in Hong Kong. Based on renovation assumptions and CFD technology, the ventilation condition before and after the transformation were compared. The results showed that small adjustment of building forms could cause great improvement of air flow. Main conclusions were summarized as follows:
(1) The strategies of pedestrian path widening and reducing site coverage of the podia were very useful and efficient to improve ventilation condition at pedestrian level (z = 2 m). The wind speed on pedestrian path had been greatly improved, whose maximum increase reached 3.0 m/s, 10 times larger than before.
(2) From the perspective of using natural ventilation, the strategies of terraced podium design, varying height profile and increase of open space could better introduce air flow. In addition, it could create more spaces for human activities. Urban forms and spaces became more diverse.
(3) From the perspective of improving the environment of the industrial zone, bottom overhead design could fully release the ground space. Based on simulation results, wind corridors were generated on ground floor between different buildings, and the maximum of wind speed reach 3.0 m/s. As a result, the air flow in parking lots and the discharge of car exhaust could be improved to a large degree.
Through the improvement of ventilation, both the environment and production efficiency of industrial zone in Kwun Tong areas were promoted greatly. Firstly, the use of natural ventilation was able to dilute harmful substances in the air and to improve the indoor air quality. Secondly, using natural ventilation contributed to save energy and to reduce the environmental pollution, which also achieved harmony of natural environment and artificial construction. Thirdly, energy saving reduced industrial costs and improved production efficiency. Fourthly, the improvement of ventilation was benefit for people’s physical and mental health and help to meet the physical and psychological needs of people. Overall, the improvement strategies followed the development trend and reflected the requirements of sustainable development.
Acknowledgement: The authors would like to thank Dr. Benny Chow and Dr. Biao Peng for their valuable discussion. The authors are also grateful to the reviewers for providing fruitful comments and suggestions.
Funding Statement: The author received no specific funding for this study.
Conflicts of Interest: The authors declare that they have no conflicts of interest to report regarding the present study.
1. Tang, W. S., Lee, J. W. Y., Hui, T. W., Yip, M. K. C. (2018). The Urban density question in Hong Kong: From absolute space to social processes. City, Culture and Society, 17, 46–53. DOI 10.1016/j.ccs.2018.10.002. [Google Scholar] [CrossRef]
2. Lang, W., Chen, T., Chan, E. H. W., Yung, E. H. K., Lee, T. C. F. (2018). Understanding livable dense urban form for shaping the landscape of community facilities in Hong Kong using fine-scale measurements. Cities, 84, 34–45. DOI 10.1016/j.cities.2018.07.003. [Google Scholar] [CrossRef]
3. Yuan, C., Ng, E. (2012). Building porosity for better urban ventilation in high-density cities—A computational parametric study. Building and Environment, 50, 176–189. DOI 10.1016/j.buildenv.2011.10.023. [Google Scholar] [CrossRef]
4. Yang, L., Li, Y. (2011). Thermal conditions and ventilation in an ideal city model of Hong Kong. Energy and Buildings, 43(5), 1139–1148. DOI 10.1016/j.enbuild.2010.06.005. [Google Scholar] [CrossRef]
5. Hicham, B., Hicham, M., Hassan, R. (2020). Review of methods for retrieving urban heat islands. Materials Today: Proceedings, 27(4), 3004–3009. DOI 10.1016/j.matpr.2020.03.272. [Google Scholar] [CrossRef]
6. Liu, Y., Li, Q., Yang, L., Mu, K., Liu, J. (2020). Urban heat island effects of various urban morphologies under regional climate conditions. Science of the Total Environment, 743, 140589. DOI 10.1016/j.scitotenv.2020.140589. [Google Scholar] [CrossRef]
7. Wu, M. C., Lee, T. C., Liu, W. M., Leung, Y. K. (2009). A study on the difference between urban and rural climate in Hong Kong. Hong Kong: Hong Kong Observatory. [Google Scholar]
8. He, B. J., Ding, L., Prasad, D. (2020). Wind-sensitive urban planning and design: Precinct ventilation performance and its potential for local warming mitigation in an open midrise gridiron precinct. Journal of Building Engineering, 29, 101145. DOI 10.1016/j.jobe.2019.101145. [Google Scholar] [CrossRef]
9. He, B. J., Ding, L., Prasad, D. (2020). Relationships among local-scale urban morphology, urban ventilation, urban heat island and outdoor thermal comfort under sea breeze influence. Sustainable Cities and Society, 60, 102289. DOI 10.1016/j.scs.2020.102289. [Google Scholar] [CrossRef]
10. Zhou, Y. F., Guan, H. D., Huang, C. Y., Fan, L. L. (2019). Sea breeze cooling capacity and its influencing factors in a coastal city. Building and Environment, 166, 106408. DOI 10.1016/j.buildenv.2019.106408. [Google Scholar] [CrossRef]
11. Yuan, C., Adelia, A. S., Mei, S. J., He, W. H., Li, X. X. et al. (2020). Mitigating intensity of urban heat island by better understanding on urban morphology and anthropogenic heat dispersion. Building and Environment, 176, 106876. DOI 10.1016/j.buildenv.2020.106876. [Google Scholar] [CrossRef]
12. Tetsu, K., Masao, M., Yoshihide, T., Akashi, M. (2008). Wind tunnel tests on the relationship between building density and pedestrian-level wind velocity: Development of guidelines for realizing acceptable wind environment in residential neighborhoods. Building and Environment, 43(10), 1699–1708. DOI 10.1016/j.buildenv.2007.10.015. [Google Scholar] [CrossRef]
13. Yang, J., Jin, S. H., Xiao, X. M., Jin, C., Xia, J. H. et al. (2019). Local climate zone ventilation and urban land surface temperatures: Towards a performance-based and wind-sensitive planning proposal in megacities. Sustainable Cities and Society, 47, 101487. DOI 10.1016/j.scs.2019.101487. [Google Scholar] [CrossRef]
14. Guo, F., Zhu, P., Wang, S., Duan, D., Jin, Y. (2017). Improving natural ventilation performance in a high-density urban district: A building morphology method. Procedia Engineering, 205, 952–958. DOI 10.1016/j.proeng.2017.10.149. [Google Scholar] [CrossRef]
15. Mason, T. G., Schooling, C. M., Chan, K. P., Tian, L. (2019). An evaluation of the air quality health index program on respiratory diseases in Hong Kong: An interrupted time series analysis. Atmospheric Environment, 211, 151–158. DOI 10.1016/j.atmosenv.2019.05.013. [Google Scholar] [CrossRef]
16. He, B. J., Ding, L., Prasad, D. (2019). Enhancing urban ventilation performance through the development of precinct ventilation zones: A case study based on the Greater Sydney. Australia Sustainable Cities and Society, 47, 101472. DOI 10.1016/j.scs.2019.101472. [Google Scholar] [CrossRef]
17. Hassan, A. M., ELMokadem, A. A., Megahed, N. A., Abo Eleinen, O. M. (2020). Urban morphology as a passive strategy in promoting outdoor air quality. Journal of Building Engineering, 29, 101204. DOI 10.1016/j.jobe.2020.101204. [Google Scholar] [CrossRef]
18. Ng, E. (2008). Policies and technical guidelines for urban planning of high-density cities—Air ventilation assessment (AVA) of Hong Kong. Building and Environment, 44(7), 1478–1488. DOI 10.1016/j.buildenv.2008.06.013. [Google Scholar] [CrossRef]
19. Zeng, S. P. (2016). Research on the theory of source-flow-sink ventilated corridor system construction and planning strategy—The case of the center district of Tianjin (Ph.D. Dissertation). Tianjin University, China. [Google Scholar]
20. Murakami, S., Ooka, R., Mochida, A., Yoshida, S., Kim, S. (1999). CFD analysis of wind climate from human scale to urban scale. Journal of Wind Engineering and Industrial Aerodynamics, 81(1–3), 57–81. DOI 10.1016/S0167-6105(99)00009-4. [Google Scholar] [CrossRef]
21. Middel, A., Häb, K., Brazel, A. J., Martin, C. A., Guhathakurta, S. (2014). Impact of urban form and design on mid-afternoon microclimate in phoenix local climate zones. Landscape and Urban Planning, 122, 16–28. DOI 10.1016/j.landurbplan.2013.11.004. [Google Scholar] [CrossRef]
22. Wang, Q., Wang, J., Hou, Y., Yuan, R., Luo, K. et al. (2018). Micrositing of roof mounting wind turbine in urban environment: CFD simulations and lidar measurements. Renewable Energy, 115, 1118–1133. DOI 10.1016/j.renene.2017.09.045. [Google Scholar] [CrossRef]
23. Gough, H., King, M. F., Nathan, P., Grimmond, C. S. B., Robins, A. et al. (2019). Influence of neighbouring structures on building façade pressures: Comparison between full-scale, wind-tunnel, CFD and practitioner guidelines. Journal of Wind Engineering and Industrial Aerodynamics, 189, 22–33. DOI 10.1016/j.jweia.2019.03.011. [Google Scholar] [CrossRef]
24. Faragallah, R. N. (2018). The impact of productive open spaces on urban sustainability: The case of El Mansheya Square—Alexandria. Alexandria Engineering Journal, 57(4), 3969–3976. DOI 10.1016/j.aej.2018.02.008. [Google Scholar] [CrossRef]
25. Capeluto, I. G. (2005). A methodology for the qualitative analysis of winds: Natural ventilation as a strategy for improving the thermal comfort in open spaces. Building and Environment, 40(2), 175–181. DOI 10.1016/j.buildenv.2004.07.003. [Google Scholar] [CrossRef]
26. Chen, W. (2010). Research of the space landscape on the ground open floor of the Shenzhen high-rise residential community (Master Degree Dissertation). South China University of Technology, China. [Google Scholar]
27. Environmental Protection Department. www.epd.gov.hk. [Google Scholar]
28. Dai, Z. Y., Li, T., Zhang, W. H., Zhang, J. Y. (2020). Numerical study on aerodynamic performance of high-speed pantograph with double strips. Fluid Dynamics & Materials Processing, 16(1), 31–40. DOI 10.32604/fdmp.2020.07661. [Google Scholar] [CrossRef]
29. Zang, Y., Street, R. L., Koseff, J. R. (1993). A dynamic mixed subgrid-scale model and its application to turbulent recirculating flows. Physics of Fluids A, 5(12), 3186–3196. DOI 10.1063/1.858675. [Google Scholar] [CrossRef]
30. Ayadi, A., Nasraoui, H., Bouabidi, A., Driss, Z., Bsisa, M. et al. (2018). Effect of the turbulence model on the simulation of the air flow in a solar chimney. International Journal of Thermal Sciences, 130, 423–434. DOI 10.1016/j.ijthermalsci.2018.04.038. [Google Scholar] [CrossRef]
31. Yoshie, R., Mochida, A., Tominaga, Y., Kataoka, H., Harimoto, K. et al. (2007). Cooperative project for CFD prediction of pedestrian wind environment in the architectural institute of Japan. Journal of Wind Engineering and Industrial Aerodynamics, 95(911), 1551–1578. DOI 10.1016/j.jweia.2007.02.023. [Google Scholar] [CrossRef]
32. Li, G. L. (2020). Simulation of the thermal environment and velocity distribution in a lecture hall. Fluid Dynamics & Materials Processing, 16(3), 549–559. DOI 10.32604/fdmp.2020.09219. [Google Scholar] [CrossRef]
33. Shu, Z. R., Li, Q. S., Chan, P. W. (2015). Statistical analysis of wind characteristics and wind energy potential in Hong Kong. Energy Conversion and Management, 101, 644–657. DOI 10.1016/j.enconman.2015.05.070. [Google Scholar] [CrossRef]
34. Blocken, B., Janssen, W. D., Van Hooff, T. (2012). CFD simulation for pedestrian wind comfort and wind safety in urban areas: General decision framework and case study for the Eindhoven University campus. Environmental Modelling & Software, 30, 15–34. DOI 10.1016/j.envsoft.2011.11.009. [Google Scholar] [CrossRef]
 | This work is licensed under a Creative Commons Attribution 4.0 International License, which permits unrestricted use, distribution, and reproduction in any medium, provided the original work is properly cited. |