Materials Processing
| Fluid Dynamics & Materials Processing |
DOI: 10.32604/fdmp.2021.011213
ARTICLE
Computational Fluid Dynamics Simulation of Indoor Air Quality and Thermal Stratification of an Underfloor Air Distribution System (UFAD) with Various Vent Layouts
1Mechanical Engineering Department, De La Salle University, Manila, Philippines
2Index Workshop LLP, Singapore
*Corresponding Author: Neil Stephen Lopez. Email: neil.lopez@dlsu.edu.ph
Received: 26 April 2020; Accepted: 26 January 2021
Abstract: The underfloor air distribution (UFAD) system has not been able to penetrate the residential and commercial air conditioning industry significantly until now. To date, the most notable applications are found in datacenters because of their more demanding thermal stratification and cooling requirements. In addition to highlighting the advantages of the UFAD system over the traditional overhead (OH) system, this study compares various ventilation layouts for a UFAD system. Four different UFAD ventilation layouts are compared and one OH layout. The results show that using multiple swirl-type diffusers creates a more uniform floor-to-knee temperature and less air recirculation than the rectangular grille-type diffusers. Placing the return vents on the sides of the room creates a cooler environment by isolating recirculating air to a smaller space. At the end of the study, a design guide matrix is presented to summarize how the supply and return vent layout affects air conditioning performance.
Keywords: CFD; UFAD; ventilation; ANSYS
A properly designed underfloor air distribution (UFAD) system can potentially have significant benefits on energy efficiency [1–3], indoor air quality (IAQ) and indoor thermal comfort (ITC) [4–8], and life cycle costs [9,10]. However, the performance of existing UFAD systems usually deteriorate in the actual implementation [11].
A comprehensive analysis of the advantages, disadvantages and barriers to the UFAD technology can be found in Zhang et al. [12]. Aside from having limited literature, the key issues of UFAD include the need for simplified load calculation, control of thermal stratification and high energy consumption in humid climates. Another issue of UFAD is air leakage in the floor/tile joints. A comparative study on the leakage characteristics of plenum- and duct-supplied UFAD and OH system can be found in Iyengar et al. [13]. The study concluded that OH systems only experience leakage due to exfiltration of air in window and door gaps, while leakage in UFAD systems may be reduced by up to 64% by using a ducted supply.
Better indoor air quality in UFAD systems is achieved by delivering fresh air at occupant level. With regards to cost, Webster et al. [14] showed that the capital cost for UFAD is only 4%–6% greater compared to an OH system. The additional investment cost can be easily offset by improvement in productivity and health due to better ITC and IAQ. Several studies have investigated the capital and operational costs of UFAD versus OH systems. UFAD has a first cost premium of about 3.5 USD per gross square foot (gsf) [14]. This is mostly because of the construction of a raised floor plenum. In terms of annual operating costs, it has been estimated that UFAD systems can be cheaper by 1 to 3 USD per gsf [14]; 0.45 USD per gsf [15]; and 0.26 to 1.82 USD per gsf [2]. Furthermore, Germershausen [16] claimed that for every 1 USD additional expense, about 5 USD is saved over the building’s life cycle with UFAD. The operational cost savings are mostly due to reduced fan power resulting from improved thermal stratification.
The most important characteristic of an effective UFAD system is its thermal stratification. Energy savings, comfortable room temperature and good air quality are mostly the result of properly controlled vertical temperature gradients [17,18]. However, thermal stratification of UFAD usually deteriorates in actual implementation [11]. Because of this, their actual energy consumption is usually higher than designed. There is definitely a need for investigating the complex pattern of airflow in UFAD [19].
With regards to vent positioning, Bauman et al. [20] recommend task air conditioning (TAC) to further improve ITC and IAQ. This strategically positions vents within workstations to condition only the immediate environment of the user. However, modeling particle dispersion in a personalized ventilation system, Zhao et al. [21] observed that personalized ventilation, is not always effective in removing contaminant particles, especially due to the wide variation in particle sizes. On a different note, Almesri et al. [22] looked into the effect of changing the supply diffuser used to thermal comfort.
Furthermore, a few studies have utilized computational fluid dynamics (CFD) simulation to investigate ventilated enclosures. The use of building simulation in assisting the conceptual design stage is discussed in Xia et al. [23]. On the other hand, a comparison study between UFAD and OH using two-dimensional CFD simulation was done in Ho et al. [24]. The study concluded that UFAD performs better than OH systems in terms of contaminant removal and energy consumption. As mentioned above, Zhao et al. [21] modeled particle dispersion in a personalized ventilation system. A numerical model of thermal stratification in UFAD systems concluded that the ratio between jet length and enclosure height (thermal length) is a good predictor for thermal stratification in a ventilated space [25]. Finally, Kim et al. [26] used CFD to observe thermal stratification of a UFAD equipped indoor theater space, showing that UFAD can control thermal stratification better than OH systems.
There is clearly a need for more investigative studies to further the development and wide adoption of UFAD technology. This is not possible without the availability of studies providing quantitative evidence supporting the claimed benefits of UFAD over OH systems. As understood from the above review of related literature, there is a clear need to further study the effects of vent positioning on thermal comfort and air quality.
This present work hypothesizes that significant performance improvement can be derived from a more strategic placement of supply and return vents, especially from UFAD systems which have a more pronounced thermal stratification.
Through computational fluid dynamics simulation, the present study augments existing literature on UFAD performance improvement. Four ventilation layouts are simulated to understand their effects on air flow path, temperature and air quality. Novelty is elaborated further in the proceeding section on literature review.
This section summarizes previous studies observing the effects of varying supply, return and exhaust vent positioning in UFAD systems. With regards to vent positioning, three types of studies have generally been conducted: (a) Comparing OH and UFAD; (b) Varying supply and return vent location; (c) Effects of separating exhaust and return vent locations.
A few studies of Shrivastava et al. [27] and Chou et al. [28] have used CFD methods to compare UFAD- and OH-based vent layouts and favored UFAD over OH configurations based on pollutant removal and thermal comfort. Also, Petrone et al. [29] investigated different ventilation systems in a theatre room configuration. According to this study, UFAD systems provide a more uniform thermal distribution. Similar results were obtained by Kong et al. [30]. On a different note, Taherl et al. [31] commented that optimal operation of the ventilation systems under study would require continuous monitoring and feedback from the occupants.
On the other hand, Heidarinejad et al. [32] investigated the relationship between various return ventilation heights to ITC and IAQ using CFD simulation (Airpak 2.0). Results suggested installing the return vent at just about the upper boundary of the occupied zone. Using CFD methods, de Carli et al. [33] investigated the effect of supply and return vent layout, highly similar to the present work, but focused only on ventilation effectiveness for contaminant removal. It was concluded that it is best to have the return vents on the ceiling than on the walls, regardless of where the supply vent is located.
Recently, it was observed that separating the location of exhaust and return vents in UFAD systems could result to significant energy savings. Xu et al. [34] and Cheng et al. [35] discussed how a reduced cooling load may be attained by separating the exhaust and return vents. Fathollahzadeh et al. [36] showed that as much as 10.5% energy savings can be achieved with this. Cheng et al. [37] added that separating exhaust and return while lowering return vent height, results to energy savings but decreases ITC by increasing the vertical temperature gradient. This discomfort is observed to be more common to female occupants, as reported by Matsunawa et al. [38] and Bos et al. [39].
In cases wherein the ventilation system cannot be manipulated anymore, Zhuang et al. [40] looked into how furniture layout can be varied to control IAQ and ITC. A CFD simulation model was then pre-validated using published data, such as in the present work.
Following literature review, it is noted that CFD is widely used and accepted in the analysis of air distribution systems. Also, when the supply vent location was varied, the return vent location had always been held constant in previous studies. Also, for studies varying both, the focus had only been on ventilation effectiveness and contaminant removal. This present study augments existing literature by providing a focus on thermal stratification, simultaneously varying both supply and return locations, and analyzing air flow trajectory to reveal potential IAQ issues.
The calculations were done using a vertex-centered, finite volume approach. Meshing information and boundary conditions can be found in Section 4 of this manuscript. The High Resolution Upwind Advection Scheme was used for discretization. This is based on the boundedness principles of Barth et al. [41]. In place of the total energy equation, the thermal energy equation was used in this study to simplify the iterations. For flows not exceeding a Mach number of 0.3, the mean flow kinetic energy effects can be neglected [42]. Regarding pressure-velocity coupling, the Rhie-Chow approach was used. Furthermore, automatic timescale selection was used in the simulations, making use of CFX’s built-in heuristics for selecting appropriate timescales based on the method.
Other details pertaining to the turbulence model used, number of iterations, and others can be found in the latter part of this section. The details pertaining to the use of ANSYS CFX in obtaining the solutions for this study are elaborated below.
The CFD simulations were conducted on the software platform ANSYS CFX 14.5 [43]. The following set of governing incompressible flow equations are solved iteratively using the software package [44]. Eq. (1) is the continuity equation; Eqs. (2) and (3) constitute the momentum balance equation; while Eq. (4) shows the thermal energy equation, which is used over the total energy equation.
where,
where ρ is density, which is assumed to be constant all-throughout the volume; t is time; τ is shear stress; μ is dynamic viscosity; T is static temperature; h is specific static enthalpy; p is static pressure; U is the velocity vector; g is the acceleration due to gravity for the buoyancy term; and S_E is the energy source, which is assumed to be zero in this simulation. It should be noted that Boussinesq approximations are used in this simulation, which assumes that density changes within the flow field are insignificant, except in the generation of buoyancy forces where density is assumed to depend on temperature only.
The turbulence model used in the study is the Shear Stress Transport (SST) model by Menter et al. [45]. This model is based on k-ω and has an advantage over the traditional k-epsilon model, which underpredicts flow separation effects. The SST model takes advantage of a fine mesh near the wall when necessary and the simplicity of k-epsilon based models in the bulk flow region, allowing it to accurately predict flow separation under adverse pressure gradients. This makes it ideal for the application, which creates adverse pressure gradients at the vents. The mathematical formulation of this model has had multiple variations over the years. The original formulation of this two-equation turbulence model can be found in Menter et al. [46,47]. NASA [48] provides a detailed documentation of this model, including corrections and developments applied to it from 2003 to 2015.
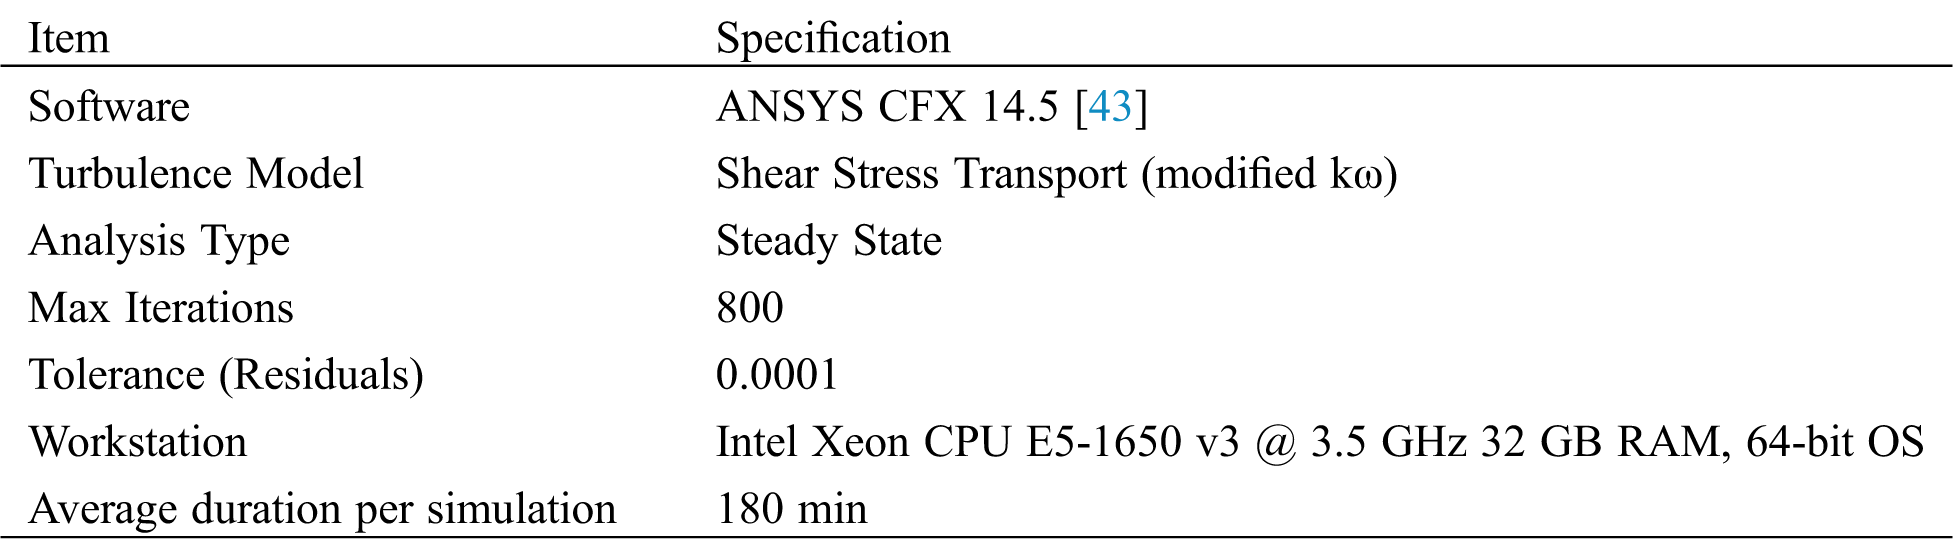
On the number of iterations, the study started with 100 iterations and progressed all the way to 1000 iterations. It was found that the results did not significantly change anymore beyond 800 iterations. Relevant information on the simulation can be found on Tab. 1.
Table 1: Relevant information on running the simulations
4 Model Development and Validation
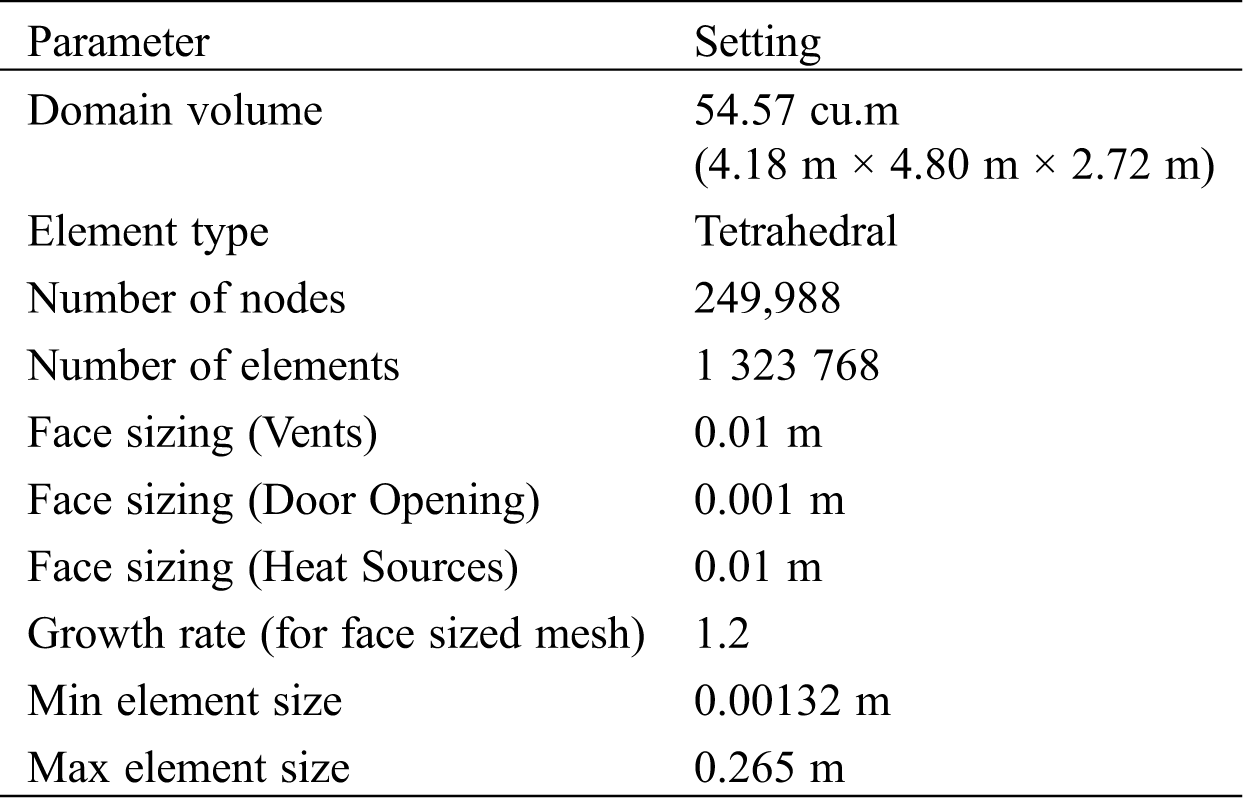
To determine the final mesh configuration, a grid refinement study was conducted. This was done by gradually decreasing element sizes inside the control volume (see Fig. 1). These were adjusted using the ‘relevance’ feature of ANSYS CFX. All the element sizes considered had a relevance center of Fine, while the relevance was gradually increased from –70 to +30 in order to reduce the element sizes in each simulation. Adjusting the relevance parameter in ANSYS CFX Meshing allows the user to change element size within the control volume, while maintaining the size ratios of the elements coming from different areas of the volume. If preferred, this feature saves the user from manually adjusting the element size on each area. The final element sizes (at different areas) are shown on Tab. 2. Grid independence was achieved using a fine mesh with a relevance of 10. This is equivalent to approximately 1.3 million elements. Meshing was refined in key areas of the volume using face sizing, i.e., on door gaps and ventilation openings.
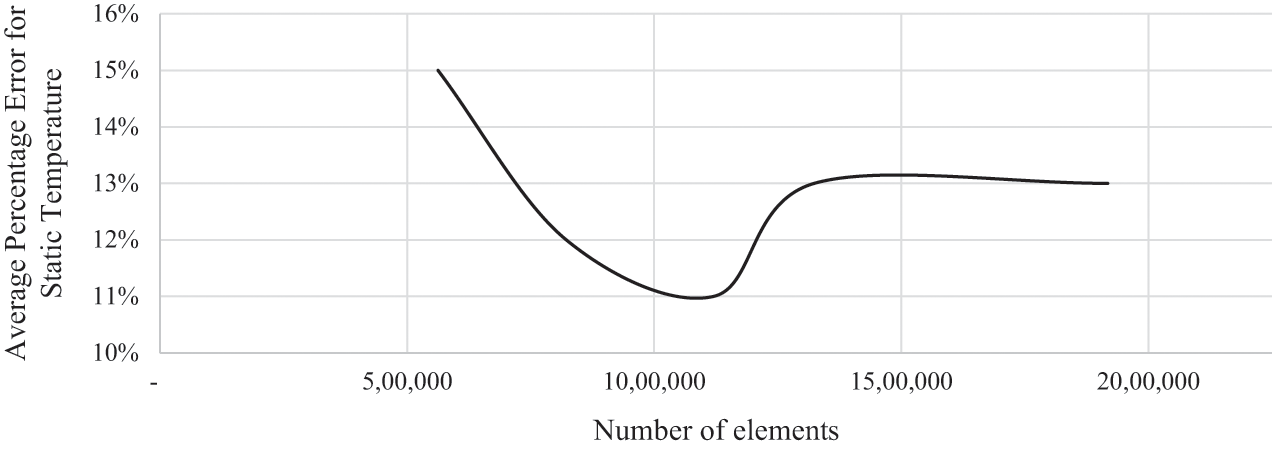
Figure 1: Grid refinement study results, plotting number of elements against the average percentage error for the prediction of static temperature
Table 2: Meshing model details
4.2 Validation of the Simulation Model
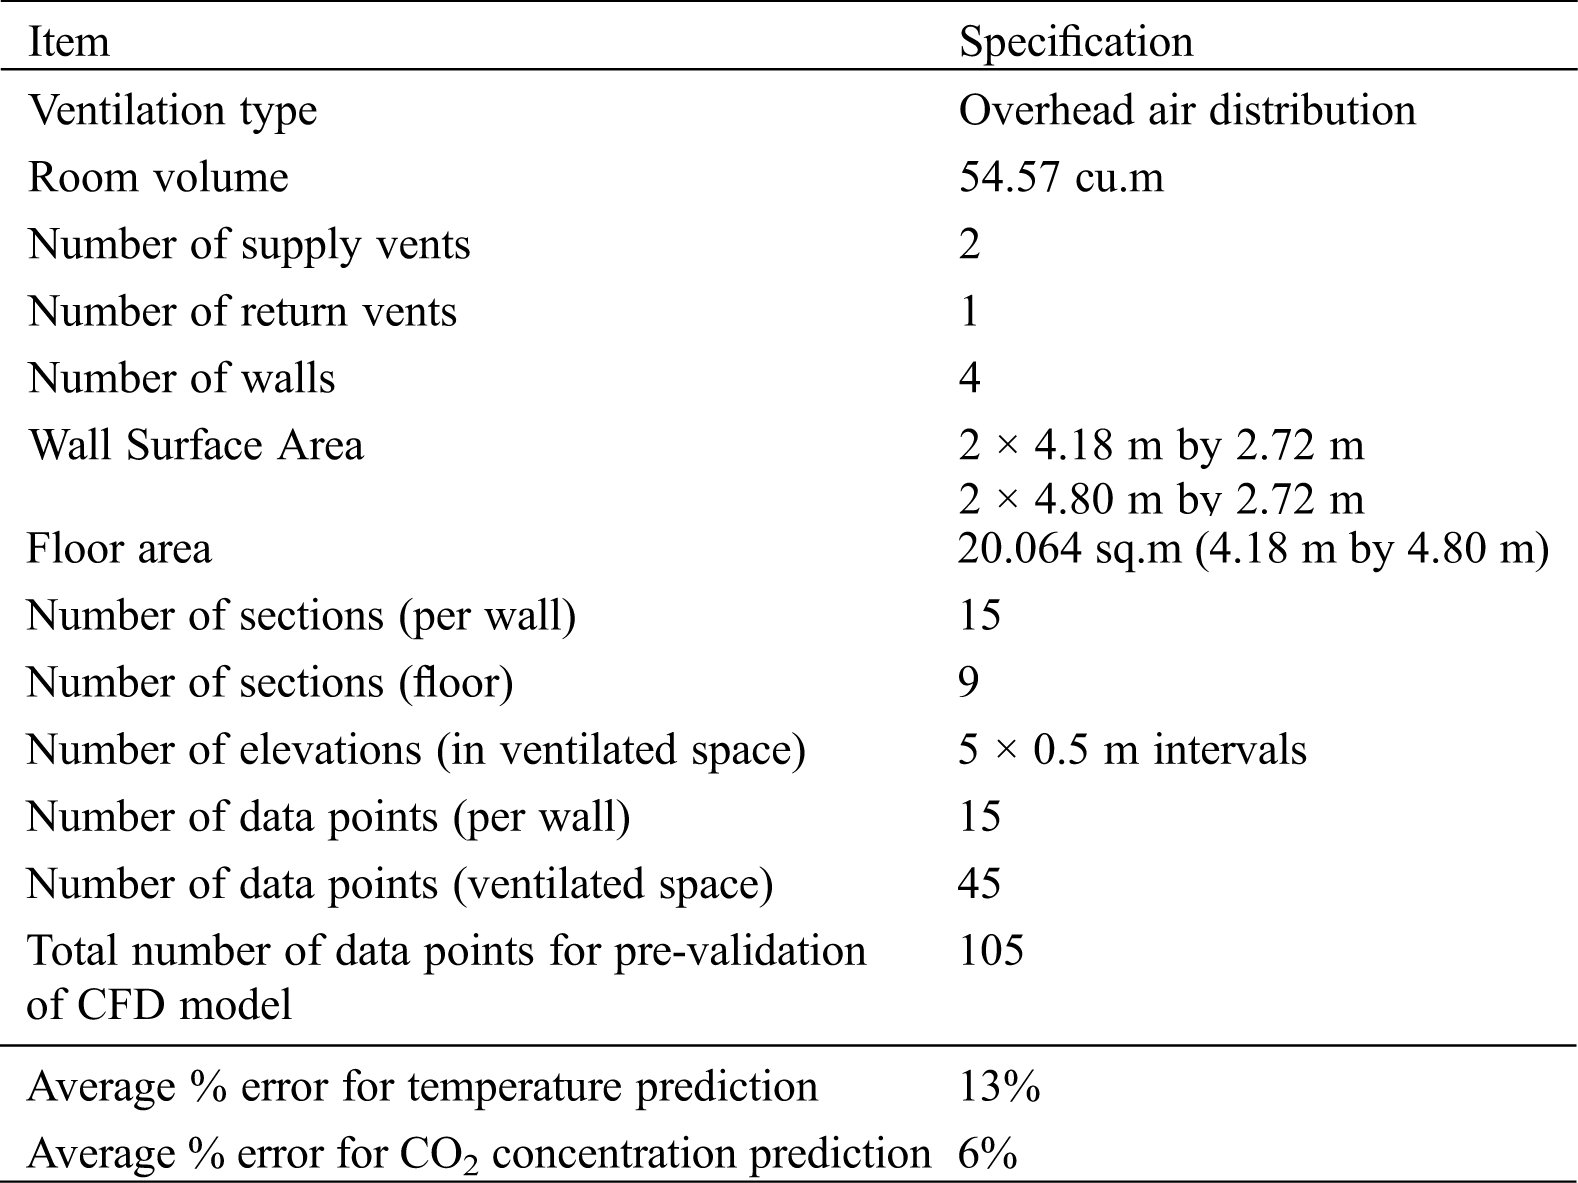
The computational fluid dynamics simulation model used in this paper was validated by means of actual experimentation. The experiment was conducted inside a 54.57 cu.m. room with overhead ventilation. The layout of this room is shown on Fig. 2. The experiment did three cycles of measurements, taking the average at the end. Temperature was measured at 105 points using a combination of infrared thermometers and digital thermometers, and CO2 concentration at 45 points using a CO2 analyzer. Additionally, air speed, temperature and CO2 concentration measurements were taken at the openings of the supply and return vents, and door gap. The details of this experiment are summarized in Tab. 3.
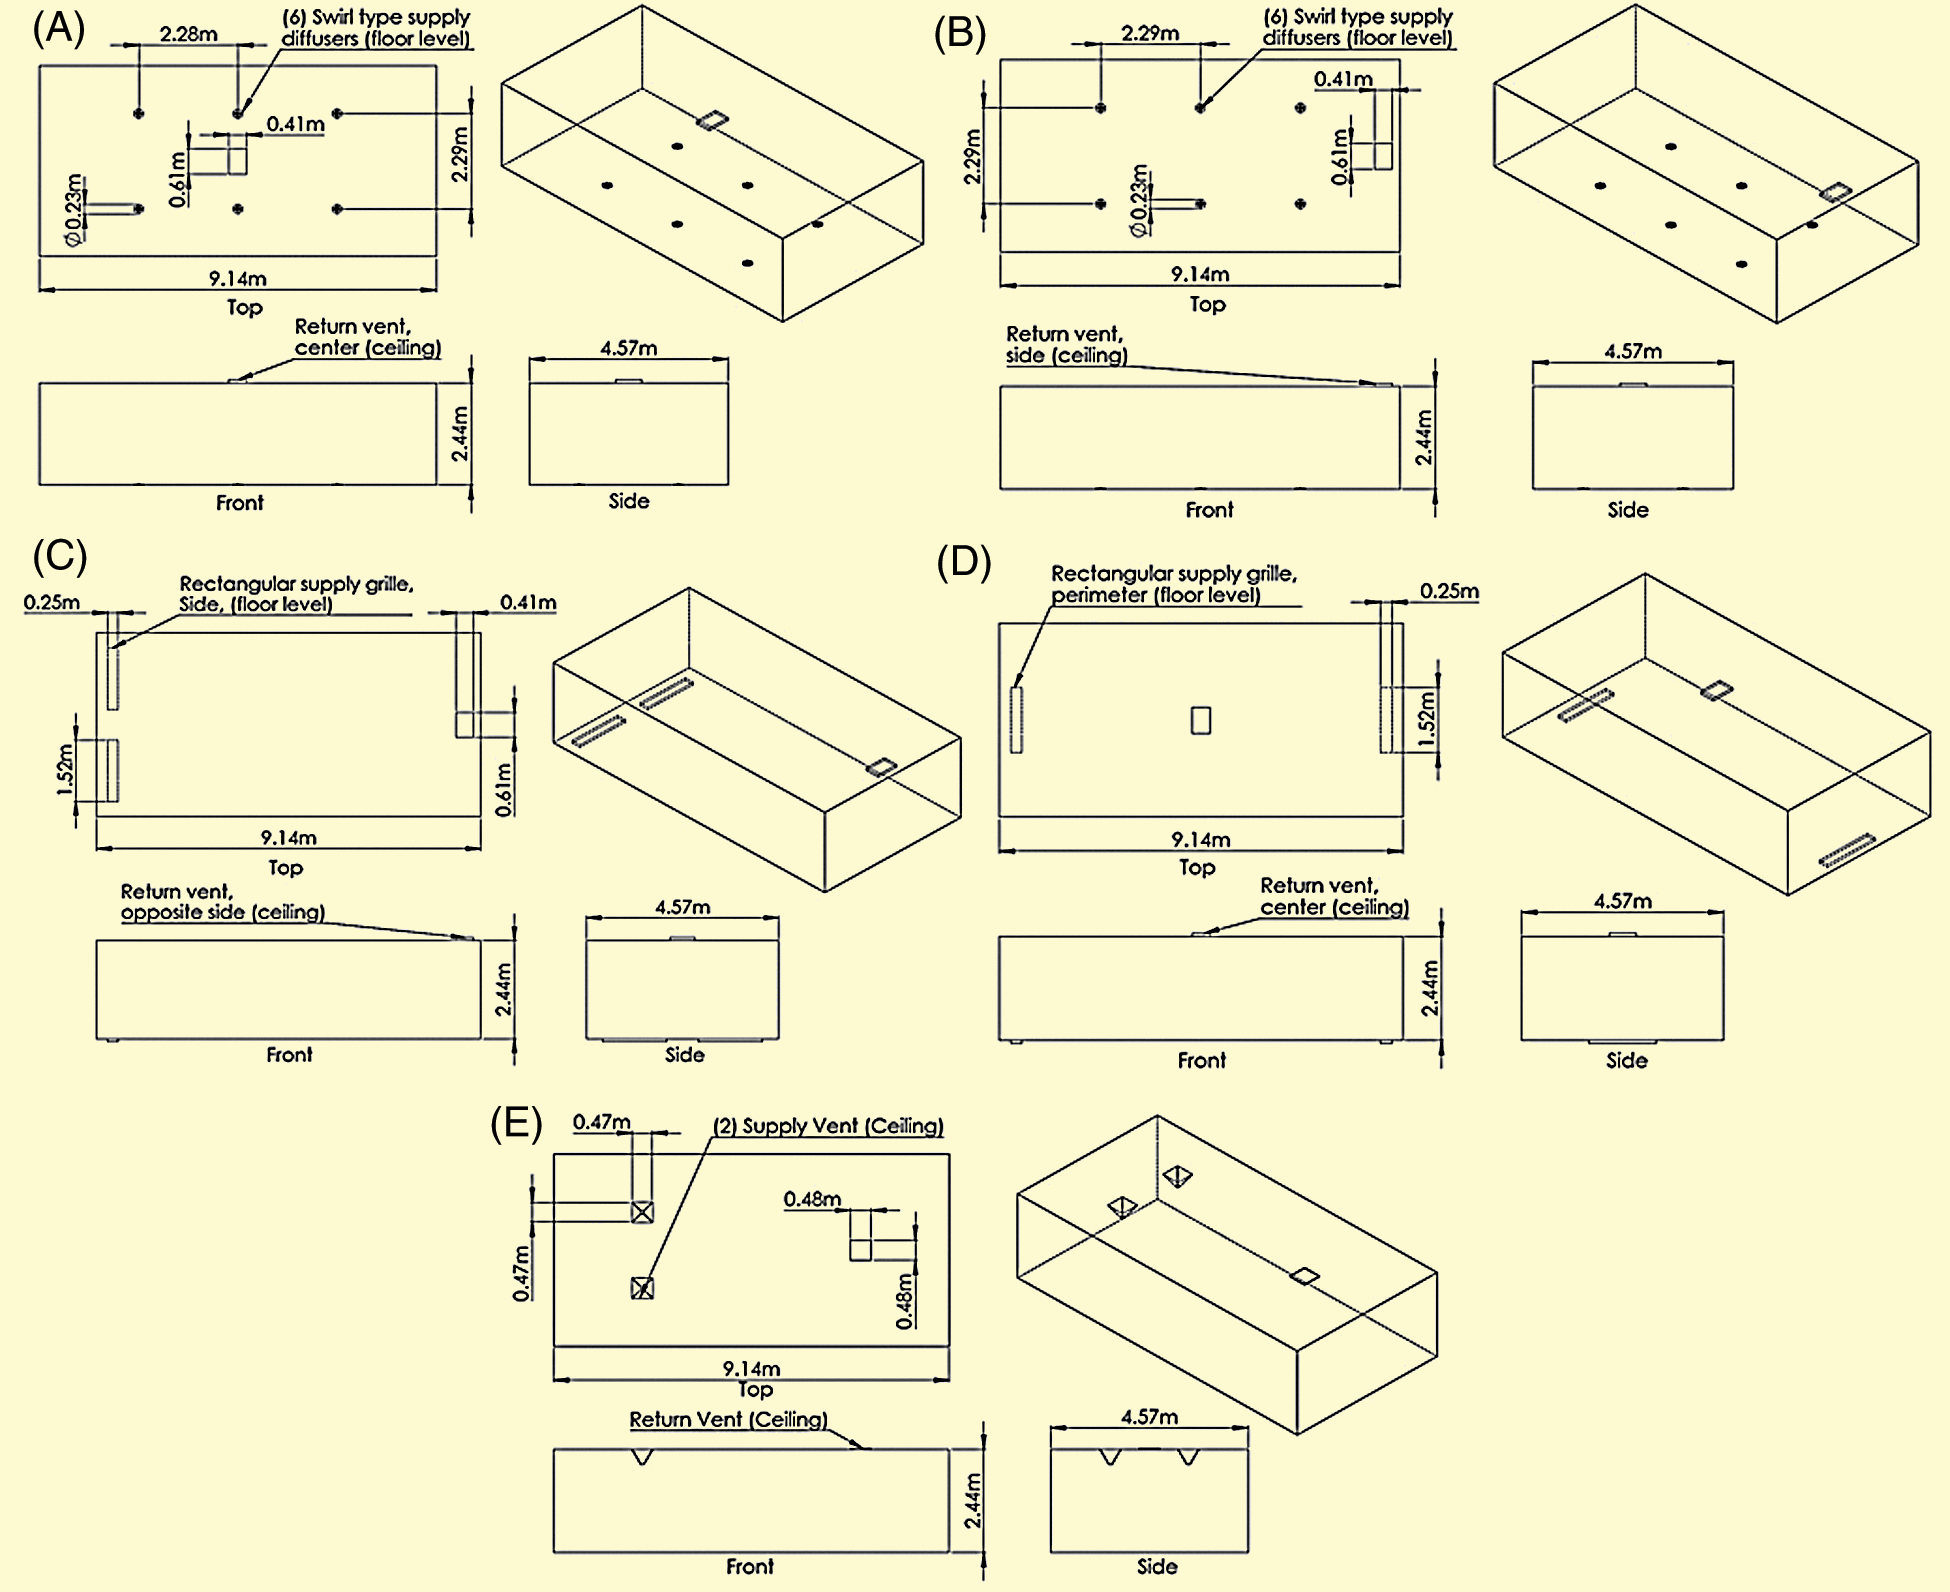
Figure 2: Layouts investigated in the study. (A) Surrounded; (B) Distributed; (C) Lengthwise; (D) Perimeter; and (E) Overhead
Table 3: Details of experimental data gathering
The average percentage errors between the ANSYS CFX computational model and the actual experiment were 13% for temperature and 6% for CO2 concentration. For temperature, there were a few points which reached an error of 27.4%, 27.1%, 23.2% and 15.7%. These were the measurement points on the glazing, beside the door air gap, directly under the diffuser vent, and beside the glazing again, respectively. The rest of the hundred-plus measurement points recorded an error of 10% or less. The large errors were attributed to the effect of substantial air movement directly below the vents and near the door gap. Fortunately, there were no glazing and door air gaps used in the experimental portion of the study, addressing majority of these errors. In the experiments, temperature readings at the mouth of the diffuser vents were analyzed knowing that the simulation underpredicts them (i.e., predicted to be cooler). For CO2 concentration, 80% of the measured points had an error of 5% or less. However, a few points recorded an error of 35%, 13% and 12%. These were points directly below the supply vent, and return vent (i.e., 13% and 12%), respectively. Similarly, the researchers attribute these errors to the substantial air movement affecting the readings of the CO2 analyzer. Aside from those, the authors believe the simulation model predicts temperature and CO2 concentration with acceptable accuracy.
Past the pre-validation stage of the CFD model, 5 ventilation layouts were studied—4 of which were utilizing UFAD. The selected layouts for UFAD were general layouts which were given the following names for the purpose of this study: Surrounded, distributed, lengthwise and perimeter. Small swirl diffusers were used when it is desired to spread plenty of supply diffusers within the room. Alternatively, rectangular grilles were used when the diffusers had to be situated beside the walls [49]. For this reason, the surrounded and distributed layouts were equipped with multiple swirl type supply diffusers, whereas the lengthwise and perimeter layouts used rectangular grille diffusers in this study. For the purpose of comparison, the last layout studied is a traditional OH layout. More details on the selected ventilation layouts can be found in Lopez et al. [50], an earlier study of the authors. The simulated rooms are also illustrated in Fig. 2.
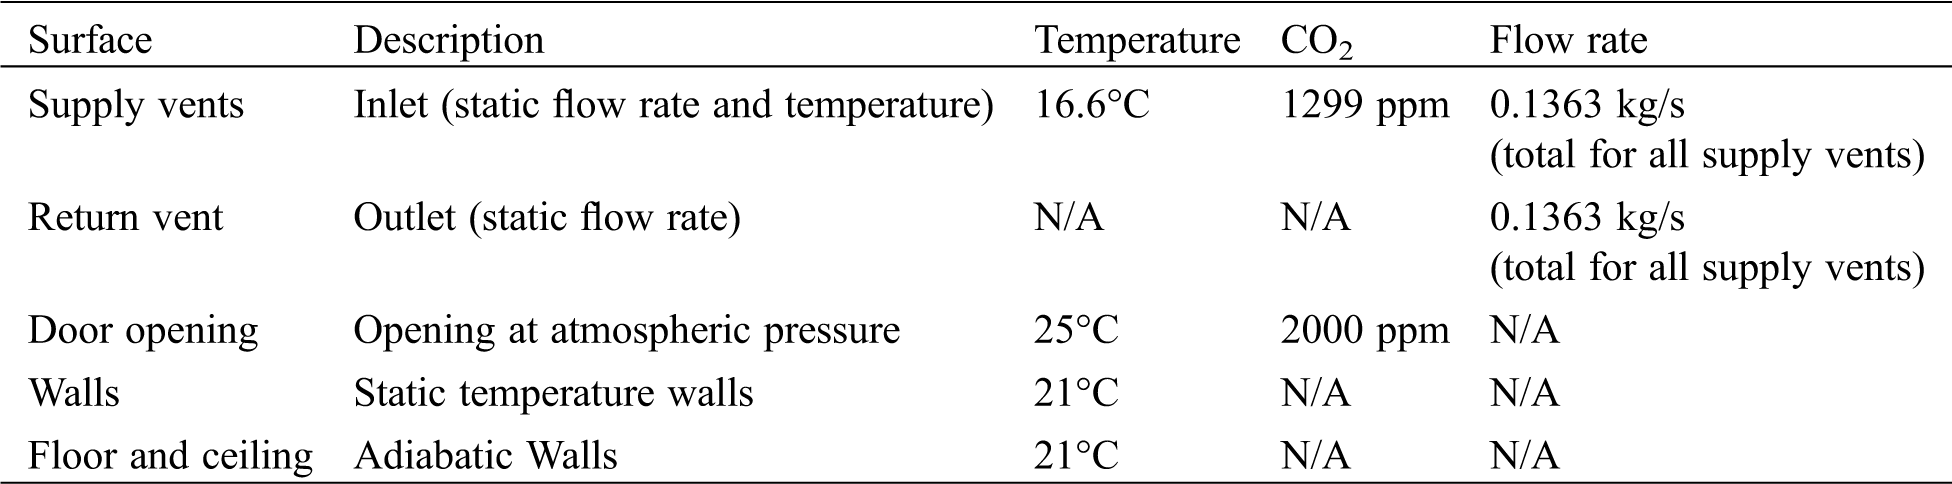
To ensure that the effects are due to ventilation layout changes only, the boundary conditions are maintained for all setups. These are shown in Tab. 4. The only momentum sources in the control volume are the supply vents. To ensure that there is no accumulation inside the control volume, the return vent (sink) is given a static flow rate that matches the total of all the supply vents. As for energy transfer, the control volume is given an initial condition of 25°C and allowed to reach steady state temperature through convection with the conditioned air supplied at 16.6°C. To simplify and ensure that only the vent positioning effects are observed, glazing and other objects (e.g., furniture) were removed in the experimental part of the study. This should also reduce the effects of radiative heat transfer.
Temperature is plotted on three different locations and six different heights for each layout (Fig. 3). Greater vertical temperature gradients for underfloor layouts (~7 degrees) were obtained compared to the overhead layout (~2 degrees). The larger temperature gradient is desired energy-wise, especially if only the occupied space is cooled. For UFAD ventilated enclosures, warmer air naturally accumulates at the exhaust zone due to buoyancy effects, which is promoted by the flow of conditioned air from floor to ceiling. However, this vertical gradient can sometimes be uncomfortable to some occupants. As expected, the temperature distribution in an OH system is almost uniform due to complete mixing of air. It is common for some energy to be lost at ceiling level for OH systems because the supply air has to exchange heat with exhaust air. This is avoided in a UFAD system.
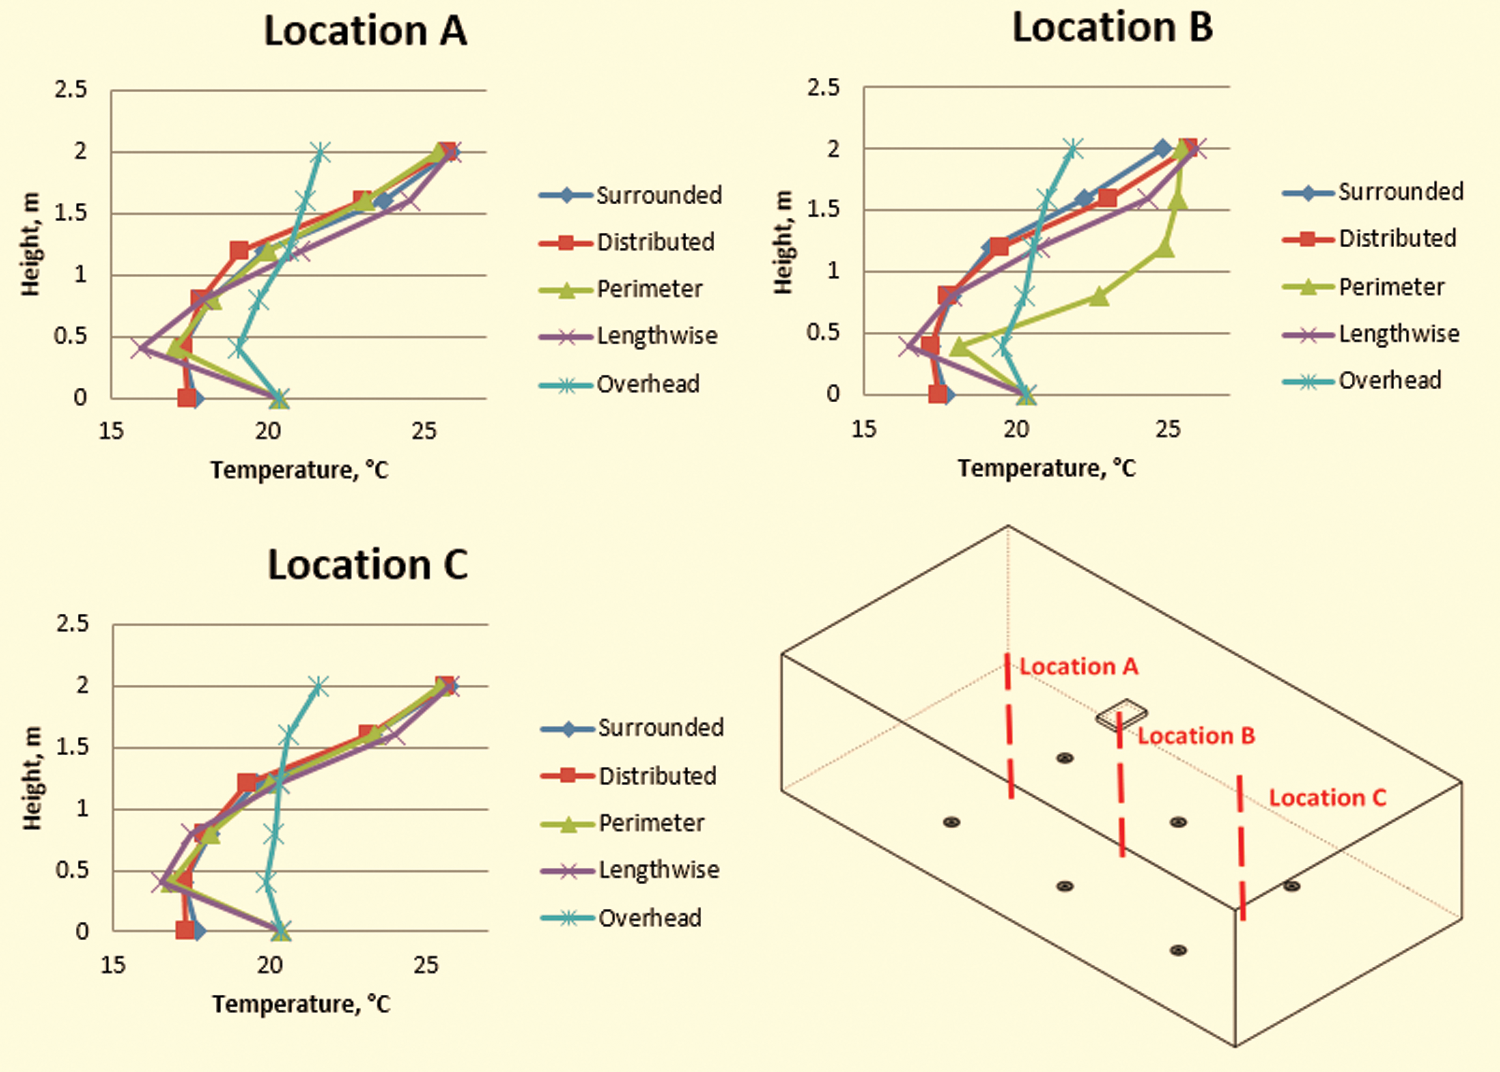
Figure 3: Temperature plots at selected locations of the rooms
Layouts using spread-out swirl type diffusers (i.e., surrounded and distributed layouts) show an almost constant temperature from floor-to-knee (i.e., height of 0.5 m). Even if those using rectangular grille-type supply vents showed a higher, more comfortable temperature near the floor area, the temperature significantly drops by as much as 4°C within the first 0.5 m. From the height of 0.5 m up to the ceiling, the increase in temperature is almost identical for all layouts—with the exemption of the perimeter layout. The center of the room is warmer by 2°C to 5°C in the perimeter layout compared to the other layouts (see Fig. 3). Due to complete mixing, temperature inside an OH-ventilated room is almost uniform, only varying by up to 2°C from floor to ceiling.
Temperature distribution of front, center and back zones are also compared in Fig. 4. Focusing on the occupied zone, it is seen that the UFAD system can provide a cooler environment than an OH system using the same supply air temperature and flow rate. Interestingly, it can also be observed that the UFAD layouts with return vents on the sides had a lower average temperature. Air trajectory is discussed in the next section to understand these results better.
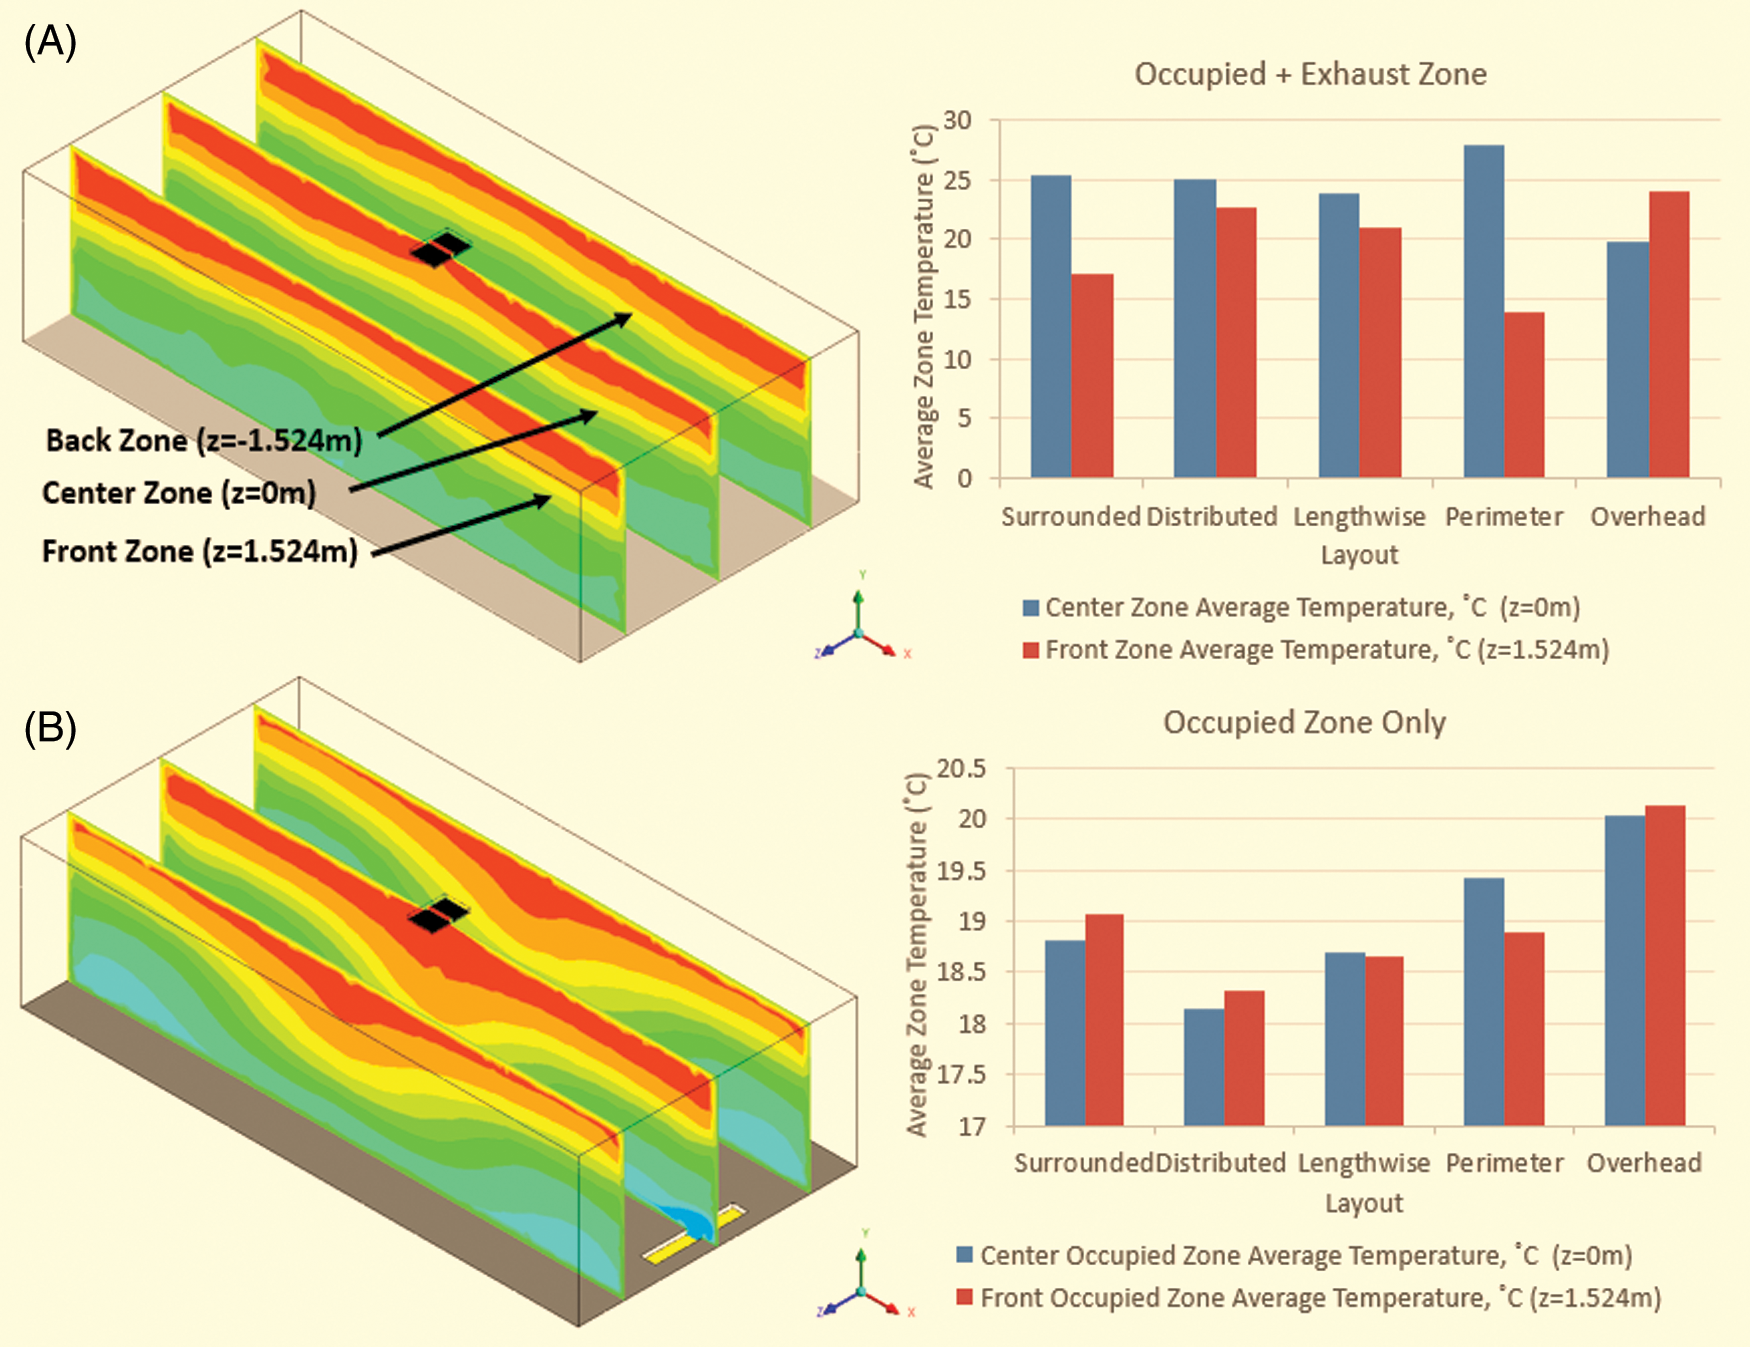
Figure 4: Temperature plots across front to back zones of: (A) Surrounded; and (B) Perimeter
Basing on the air flow trajectories generated through the simulation (see Fig. 5), layouts using multiple swirl-type supply diffusers are better ventilated. Conditioned air in these layouts do not recirculate or stagnate too much, as observed in other layouts. On the other hand, UFAD layouts which utilize rectangular grille-type supply diffusers experience significant recirculation inside the room. In the lengthwise layout, the recirculation occurs directly under the return vent, while it occurs in the east half of the room in the perimeter layout. The authors believe this significant recirculation is because of the low throw height of the rectangular grille-type diffusers. Since the mass flow rate had to be maintained constant across all layouts, the larger orifice of the rectangular grille resulted to a lower supply air velocity. Because of the minimal momentum, the supply air needs to reside longer inside the space. The longer residence time allows it to build pressure to leave the room through the return vent on the ceiling. From an indoor air quality perspective, having stagnant air inside the room is bad because of potentially accumulated contaminants in the room. For further studies, it would be interesting to validate if this is due to choking in the return vent, and if the issue can be resolved by increasing relative distance between supply and return vents or by increasing suction pressure at the return vent.
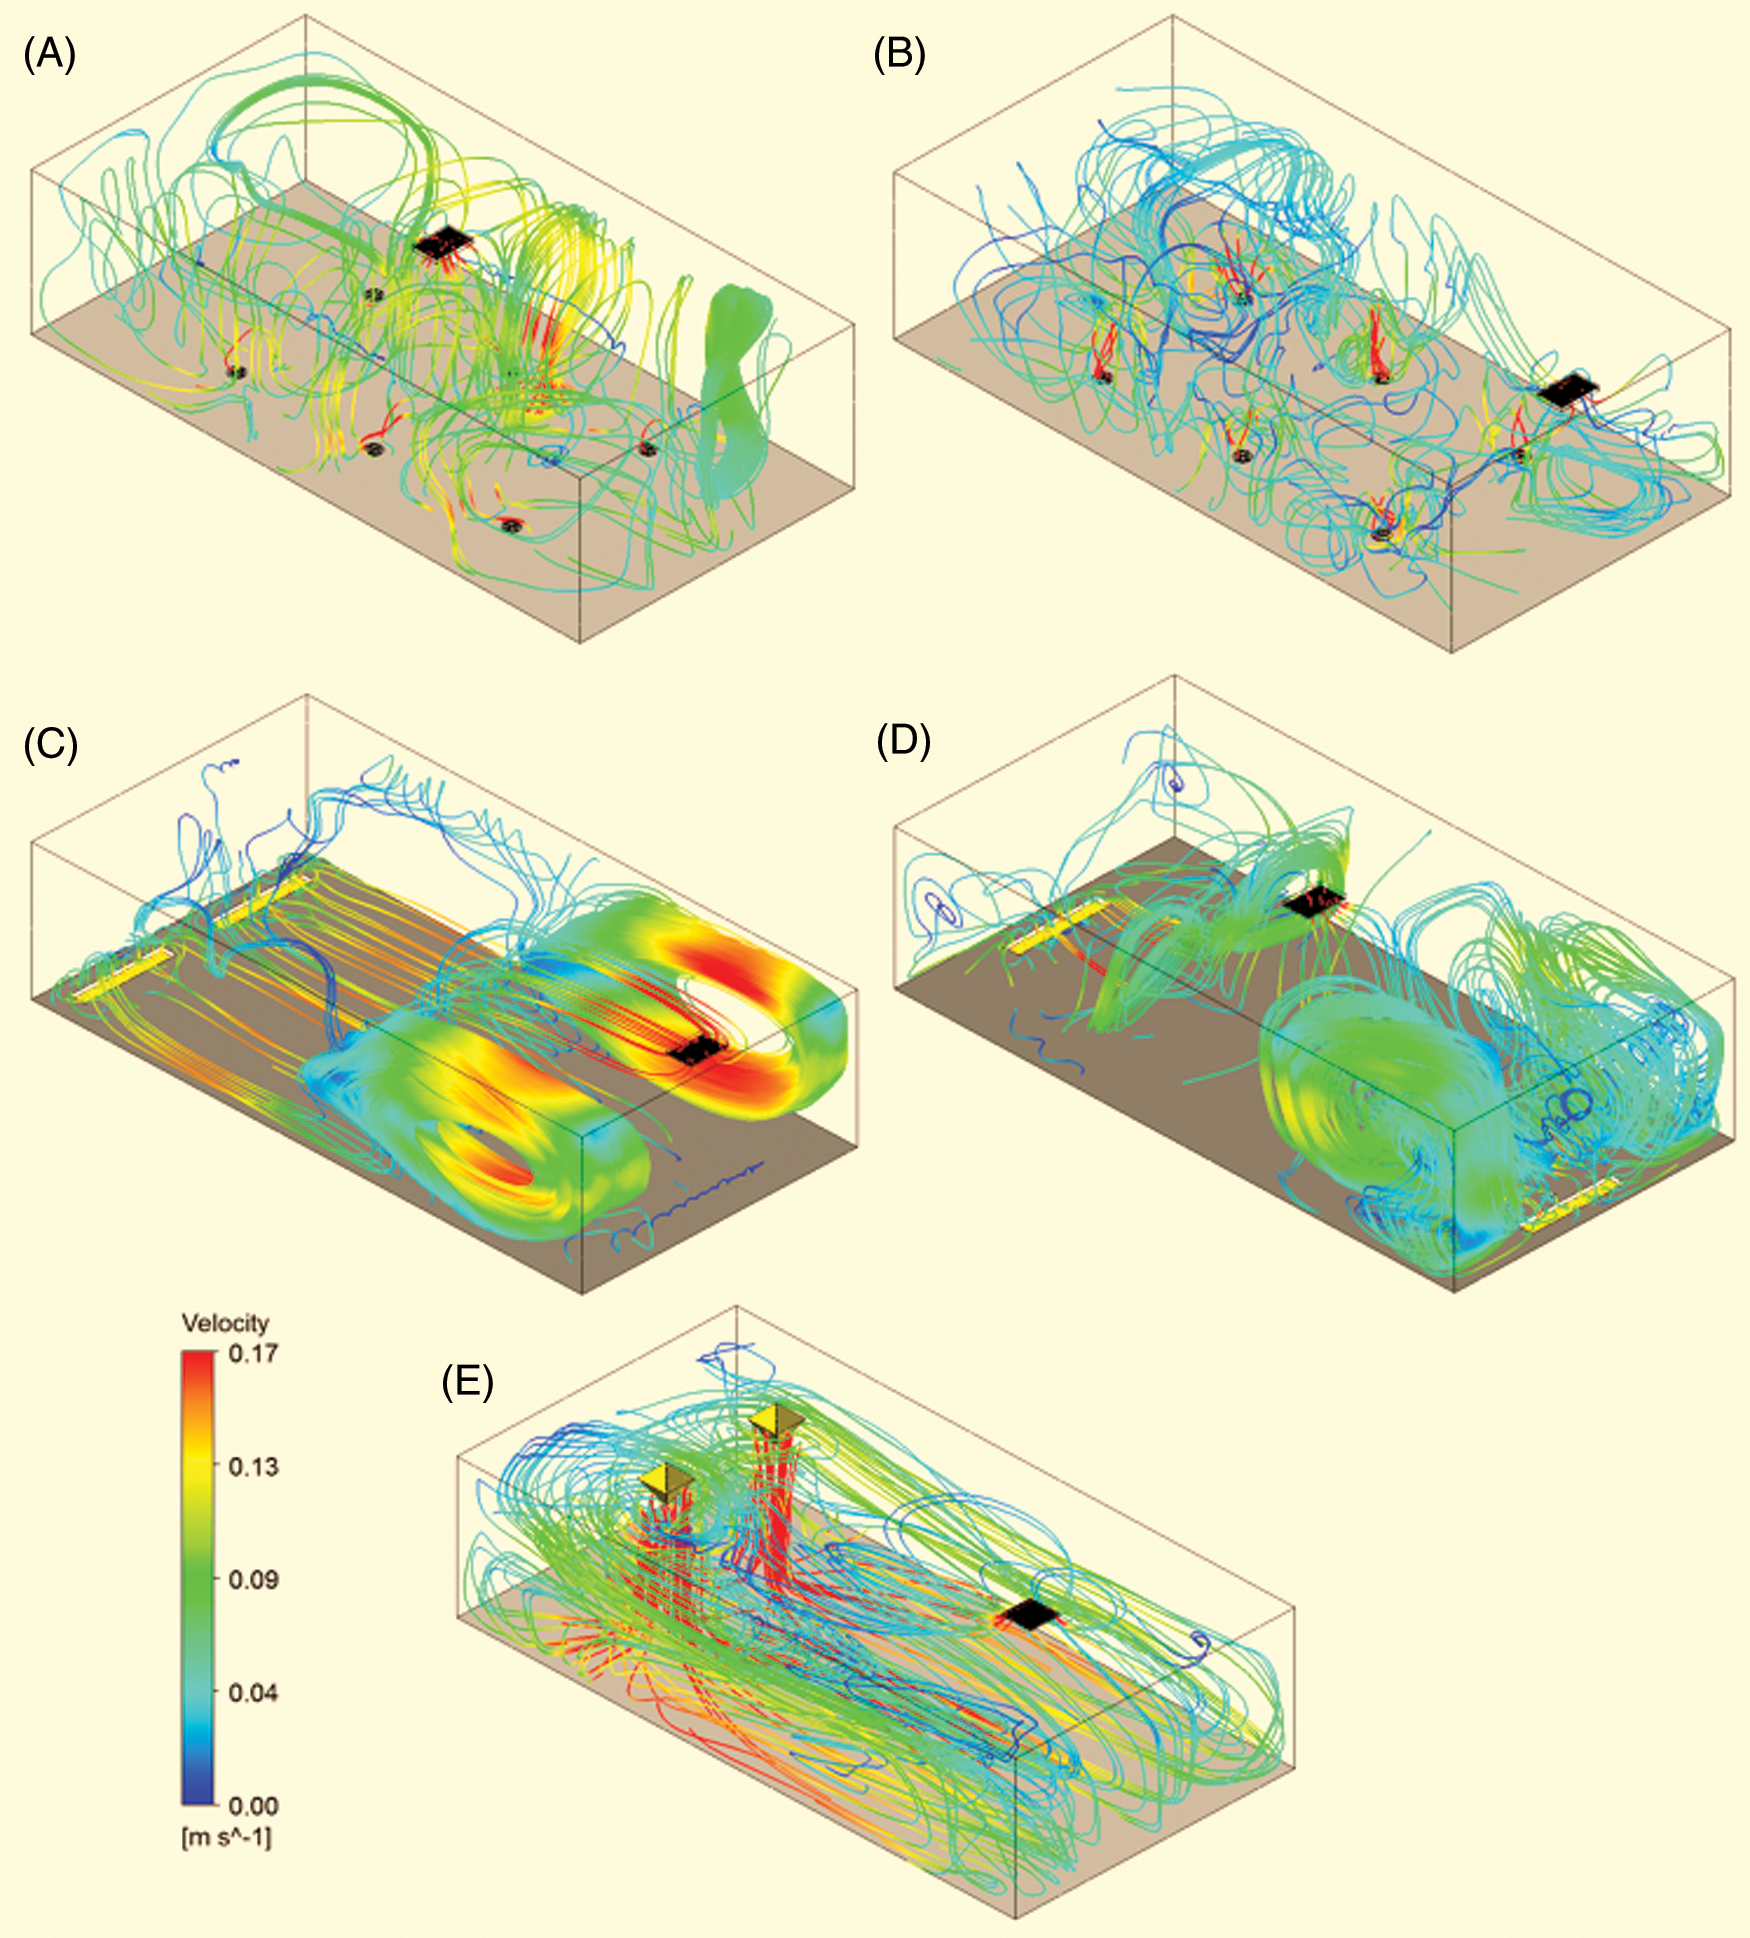
Figure 5: Air trajectory plots for different ventilation layouts. (A) Surrounded; (B) Distributed; (C) Lengthwise; (D) Perimeter; and (E) Overhead
Related to maintaining room temperature, it is observed in all layouts that some kind of air accumulation always occurs underneath the return vent. Layouts having the return vent on the side of the room can isolate this accumulation in a smaller space, producing a lower average room temperature.
CO2 concentration inside the ventilated room is showed in Fig. 6. The distribution of CO2 concentration is directly proportional to the thermal stratification of the room. Because of buoyancy effects in a UFAD system, the contaminated air is pushed out to the exhaust region by the new supply air, keeping the occupied region safe and healthy. However, for an OH system, it is seen that the air is completely mixed. In the OH configuration, the contaminated air is only diluted instead of flushed out. This is one of the major advantages of UFAD over OH systems.
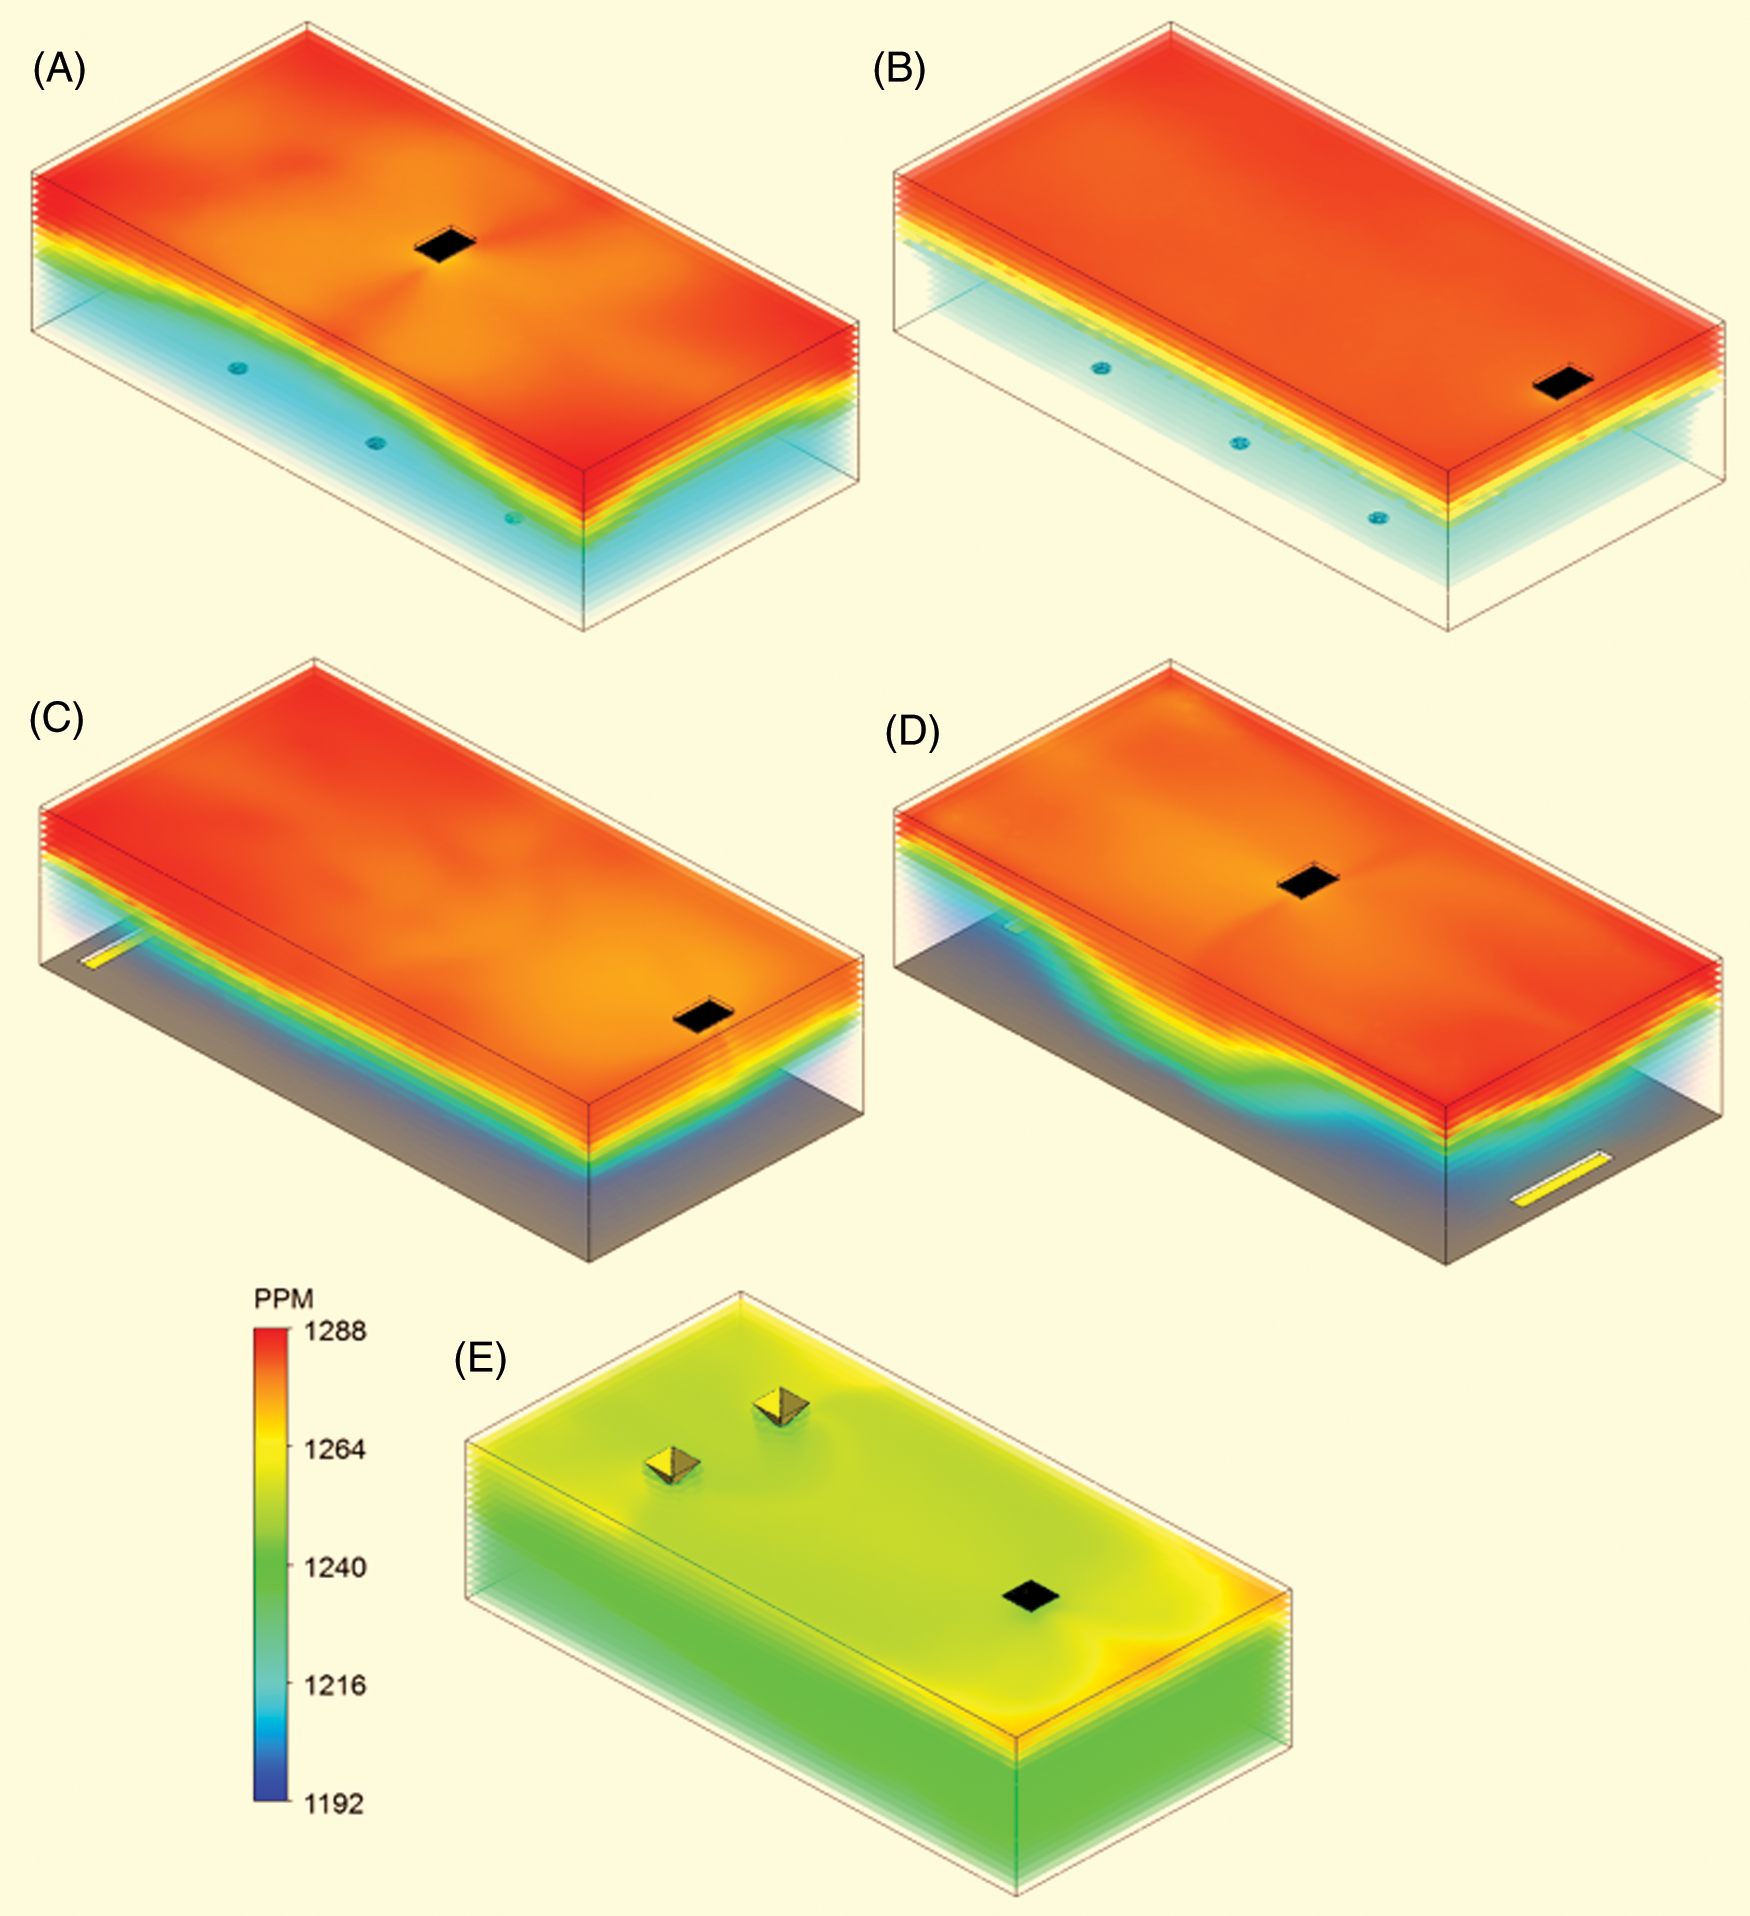
Figure 6: Carbon dioxide concentration distribution (in parts per million). (A) Surrounded; (B) Distributed; (C) Lengthwise; (D) Perimeter; and (E) Overhead
In this study, the advantages of UFAD over OH systems are demonstrated via computer simulation. Transferring the supply vents to floor level creates the advantage of buoyancy effects. The pronounced thermal stratification in UFAD systems create potential energy savings by only cooling the occupied space. The same is true for indoor air quality—buoyancy effects cause contaminated air to be flushed out of the room, instead of simply being diluted.
A few key design findings have been uncovered in this study. First, it is observed that using multiple swirl-type diffusers avoids significant air recirculation and produces uniform temperature from the floor up to a height of 0.5 m. The constant temperature from floor to about 0.5 m is important for thermal comfort. Also, it is observed that layouts having the return vent on the side of the room produce a cooler environment, primarily because the room is able to isolate air stagnation in a smaller area. Unfortunately for rectangular grille-type diffusers, their low throw height causes plenty of air recirculation which is not desirable from an indoor air quality perspective.
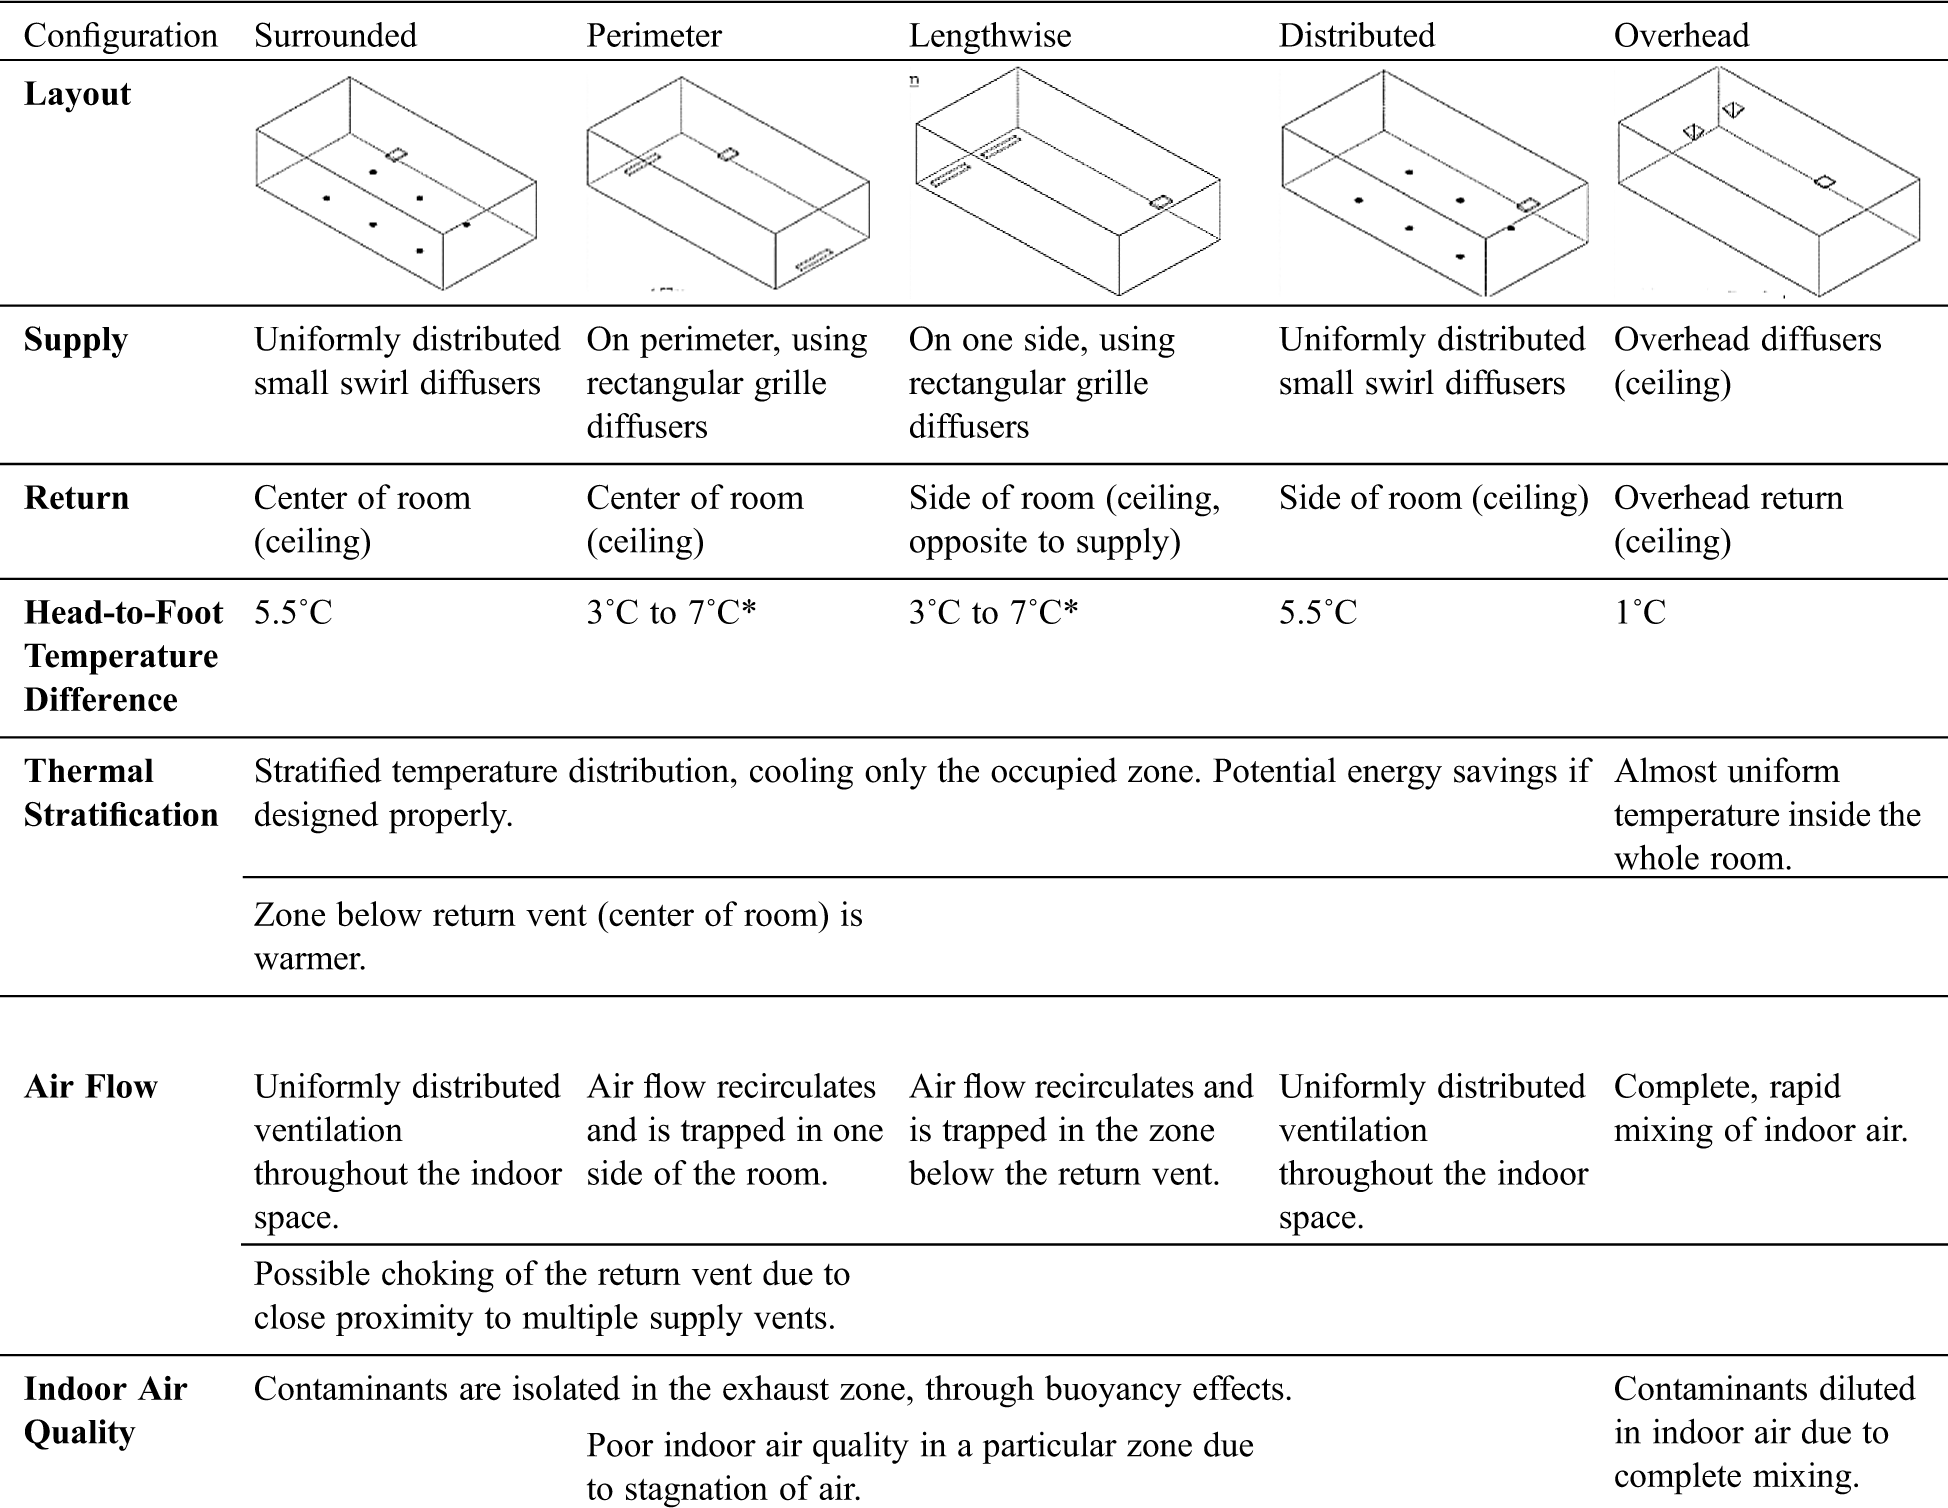
With this knowledge, more consideration should be put into the positioning and design of supply and return vents. To aid designers and researchers, the findings of the study are summarized in a design matrix in Tab. 5. The design guidelines, however, have to be taken with consideration of the actual furniture layout and the presence of other obstacles.
Table 5: Design matrix summarizing the findings of the study
For future work, researchers should investigate on the predicted mean vote (PMV) and predicted percentage of dissatisfied (PPD) of such ventilation layouts to conclude if the obtained air flow and thermal stratifications are comfortable to actual occupants of the room. This can be done with guidance from ASHRAE Standard 55 [51] and ISO 7730:2005 [52].
Acknowledgement: The authors would like to acknowledge the guidance given by Engr. Efren Dela Cruz of De La Salle University, Engr. Hans Felix Bosshard of Mapua University, and Dr. Manuel Belino of Far Eastern University Institute of Technology in the conduct of this study.
Funding Statement: The authors received no specific funding for this study.
Conflicts of Interest: The authors declare that they have no conflicts of interest to report regarding the present study.
1. Inatomi, T. A. H., Abe, V., Leite, B. C. (2006). Energy consumption of underfloor air distribution systems: A literature overview. Proceedings of the 23rd Conference on Passive and Low Energy Architecture, Geneva, Switzerland. [Google Scholar]
2. Lehrer, D., Bauman, F. (2003). Hype vs. reality: New research findings on underfloor air distribution systems. Proceedings of Green Build. Pittsburgh, PA. [Google Scholar]
3. Lian, Z., Ma, R. (2006). The principle and design of underfloor air-conditioning system. Shanghai, China: Shanghai Jiaotong University Press. [Google Scholar]
4. Lim, T. S., Shaefer, L., Kim, J. T., Kim, G. (2012). Energy benefit of the underfloor air distribution system for reducing air conditioning and heating loads in buildings. Indoor and Built Environment, 21(1), 62–70. DOI 10.1177/1420326X11419345. [Google Scholar] [CrossRef]
5. Xue, G., Lee, K., Jiang, Z., Chen, Q. (2012). Thermal environment in indoor spaces with under-floor air distribution systems: Part 2. Determination of design parameters (1522-RP). HVAC&R Research, 18(6), 1192–1201. [Google Scholar]
6. Yu, B. F., Hu, Z. B., Liu, M., Yang, H. I., Kong, Q. X. et al. (2009). Review of research on air-conditioning systems and indoor air quality control for human health. International Journal of Refrigeration, 32(1), 3–20. DOI 10.1016/j.ijrefrig.2008.05.004. [Google Scholar] [CrossRef]
7. Li, R., Sekhar, S. C., Melikov, A. K. (2010). Thermal comfort and IAQ assessment of under-floor air distribution system integrated with personalized ventilation in hot and humid climate. Building and Environment, 45(9), 1906–1913. DOI 10.1016/j.buildenv.2010.03.003. [Google Scholar] [CrossRef]
8. Zagreus, L., Huizenga, C., Arens, E., Lehrer, D. (2004). Listening to the occupants: A web-based indoor environmental quality survey. Indoor Air, 14(8), 65–74. DOI 10.1111/j.1600-0668.2004.00301.x. [Google Scholar] [CrossRef]
9. Webster, T. (2005). Alternative air conditioning technologies: Underfloor air distribution (UFAD). Energy Engineering, 102(6), 58–77. DOI 10.1080/01998590509509447. [Google Scholar] [CrossRef]
10. Webster, T., Benedek, C., Bauman, F. (2008). CBE UFAD cost analysis tool: Life cycle cost model, issues and assumptions. Berkeley, CA: Center for the Built Environment, University of California. [Google Scholar]
11. Yin, P. (2010). Identification of air conditioning energy conservation technologies and measures: Some uncertain points in UFAD system design. HV&AC, 40(5), 64–73. [Google Scholar]
12. Zhang, K., Zhang, X., Li, S., Jin, X. (2014). Experimental study on the characteristics of supply air for UFAD system with perforated tiles. Energy and Buildings, 80(6), 1–6. DOI 10.1016/j.enbuild.2014.05.007. [Google Scholar] [CrossRef]
13. Iyengar, R. S., Sekhar, C., Karimabad, A. S., Haghighat, F., Zhu, K. (2016). A comparative study of leakage characteristics between an under floor air distribution system and an over head air distribution system. International Journal of Ventilation, 14(1), 1–10. DOI 10.1080/14733315.2015.11684065. [Google Scholar] [CrossRef]
14. Webster, T., Benedek, C., Bauman, F. (2006). Underfloor air distribution (UFAD) cost study: Analysis of first cost tradeoffs in UFAD systems. CA, Berkeley: Center for the Built Environment, University of California. [Google Scholar]
15. Hartkopf, V., Loftness, V. (1997). Systems integration for the Owens Corning Headquarters. Toledo. [Google Scholar]
16. Germershausen, M. (2000). Wired for success. Buildings, 94(7), 53–58. [Google Scholar]
17. Webster, T., Bauman, F. (2006). Design guidelines for stratification in UFAD systems—Guidance for sizing interior and perimeter zones of underfloor-air-distribution systems. HPAC Engineering, 78(6), 6–27. [Google Scholar]
18. Bauman, F., Webster, T. (2001). Outlook for underfloor air distribution. ASHRAE Journal, 43(6), 18–27. [Google Scholar]
19. Li, R., Sekhar, S. C., Melikov, A. K. (2011). Thermal comfort and indoor air quality in rooms with integrated personalized ventilation and under-floor air distribution systems. HVAC&R Research, 17(5), 829–846. [Google Scholar]
20. Bauman, F., Carter, T., Baughman, A., Arens, E. A. (1998). Field study of the impact of a desktop task/ambient conditioning system in office buildings. ASHRAE Transactions, 104, 1–19. [Google Scholar]
21. Zhao, B., Guan, P. (2007). Modeling particle dispersion in personalized ventilated room. Building and Environment, 42(3), 1099–1109. DOI 10.1016/j.buildenv.2005.11.009. [Google Scholar] [CrossRef]
22. Almesri, I. F., Awbi, H. B. (2011). Predictions of thermal comfort in stratified room environment. Building Simulation, 4(2), 169–180. DOI 10.1007/s12273-011-0036-5. [Google Scholar] [CrossRef]
23. Xia, C., Zhu, Y., Lin, B. (2008). Building simulation as assistance in the conceptual design. Building Simulation, 1(1), 46–52. DOI 10.1007/s12273-008-8107-y. [Google Scholar] [CrossRef]
24. Ho, S. H., Rosario, L., Rahman, M. M. (2011). Comparison of underfloor and overhead air distribution systems in an office environment. Building and Environment, 46(7), 1415–1427. DOI 10.1016/j.buildenv.2011.01.008. [Google Scholar] [CrossRef]
25. Wan, M. P., Chao, C. Y. (2005). Numerical and experimental study of velocity and temperature characteristics in a ventilated enclosure with underfloor ventilation systems. Indoor Air, 15(5), 342–355. DOI 10.1111/j.1600-0668.2005.00378.x. [Google Scholar] [CrossRef]
26. Kim, G., Schaefer, L., Lim, T. S., Kim, J. T. (2013). Thermal comfort prediction of an underfloor air distribution system in a large indoor environment. Energy and Buildings, 64(6), 323–331. DOI 10.1016/j.enbuild.2013.05.003. [Google Scholar] [CrossRef]
27. Shrivastava, S., Schmidt, R., Sammakia, B., Iyengar, M. (2005). Comparative analysis of different data center airflow management configurations. Proceedings of ASME IPACK2005, San Francisco, California, USA. [Google Scholar]
28. Chou, P., Chiang, C., Lee, C., Ho, M. (2006). Influence of ventilation routes on indoor pollutant elimination in a working environment. Indoor and Built Environment, 15(5), 473–481. DOI 10.1177/1420326X06068987. [Google Scholar] [CrossRef]
29. Petrone, G., Cammarata, L., Cammarata, G. (2011). A multi-physical simulation on the IAQ in a movie theatre equipped by different ventilating systems. Building Simulation, 4(1), 21–31. DOI 10.1007/s12273-011-0027-6. [Google Scholar] [CrossRef]
30. Kong, M., Zhang, J., Wang, J. (2015). Air and air contaminant flows in office cubicles with and without personal ventilation: A CFD modeling and simulation study. Building Simulation, 8(4), 381–392. DOI 10.1007/s12273-015-0219-6. [Google Scholar] [CrossRef]
31. Taherl, M., Schuss, M., Fall, A., Mahdavi, A. (2016). A performance assessment of an office space with displacement, personal, and natural ventilation systems. Building Simulation, 9(1), 89–100. DOI 10.1007/s12273-015-0252-5. [Google Scholar] [CrossRef]
32. Heidarinejad, G., Fathollahzadeh, M. H., Pasdarshahri, H. (2015). Effects of return air vent height on energy consumption, thermal comfort conditions and indoor air quality in an under floor air distribution system. Energy and Buildings, 97(6), 155–161. DOI 10.1016/j.enbuild.2015.04.004. [Google Scholar] [CrossRef]
33. de Carli, M., Tomasi, R., Zecchin, R., Villi, G. (2012). Comparison of displacement ventilation and mixing ventilation systems with regard to ventilation effectiveness in offices. Proceedings of 2012 Air Infiltration and Ventilation Centre TightVent Conference, Copenhagen, Denmark. [Google Scholar]
34. Xu, H. T., Gao, N. P., Niu, J. L. (2009). A method to generate effective cooling load factors for stratified air distribution systems using a floor level air supply. HVAC&R Research, 15(5), 915–930. DOI 10.1080/10789669.2009.10390872. [Google Scholar] [CrossRef]
35. Cheng, Y. D., Niu, J. L., Gao, N. P. (2012). Stratified air distribution systems in a large lecture theatre: A numerical method to optimize thermal comfort and maximize energy saving. Energy and Buildings, 55(2), 515–525. DOI 10.1016/j.enbuild.2012.09.021. [Google Scholar] [CrossRef]
36. Fathollahzadeh, M. H., Heidarinejad, G., Pasdarshahri, H. (2015). Prediction of thermal comfort, IAQ, and energy consumption in a dense occupancy environment with the under floor air distribution system. Building and Environment, 90(7), 96–104. DOI 10.1016/j.buildenv.2015.03.019. [Google Scholar] [CrossRef]
37. Cheng, Y., Niu, J., Liu, X., Gao, N. (2013). Experimental and numerical investigations on stratified air distribution systems with special configuration: Thermal comfort and energy saving. Energy and Buildings, 64, 154–161. DOI 10.1016/j.enbuild.2013.04.026. [Google Scholar] [CrossRef]
38. Matsunawa, K., Iizuka, H., Tanabe, S. I. (1995). Development and application of an underfloor air-conditioning system with improved outlets for a “smart” building in Tokyo. ASHRAE Transactions, 101, 887–901. [Google Scholar]
39. Bos, M. A., Love, J. A. (2013). A field study of thermal comfort with underfloor air distribution. Building and Environment, 69(2), 233–240. DOI 10.1016/j.buildenv.2013.08.008. [Google Scholar] [CrossRef]
40. Zhuang, R., Li, X., Tu, J. (2014). CFD study of the effects of furniture layout on indoor air quality under typical office ventilation schemes. Building Simulation, 7(3), 263–275. DOI 10.1007/s12273-013-0144-5. [Google Scholar] [CrossRef]
41. Barth, T., Jespersen, D. (1989). The design and application of upwind schemes on unstructured meshes. Proceedings of 27th Aerospace Sciences Meeting. [Google Scholar]
42. ANSYS® (2011a). ANSYS CFX-Solver Modeling Guide. Canonsburg, Pennsylvania, USA. [Google Scholar]
43. ANSYS®, Academic Research, Release 14.5. Canonsburg, Pennsylvania, USA. [Google Scholar]
44. ANSYS® (2011b). ANSYS CFX-Solver Theory Guide. Canonsburg, Pennsylvania, USA. [Google Scholar]
45. Menter, F. R. (2009). Review of the shear-stress transport turbulence model experience from an industrial perspective. International Journal of Computational Fluid Dynamics, 23(4), 305–316. DOI 10.1080/10618560902773387. [Google Scholar] [CrossRef]
46. Menter, F. R. (1992). Improved two-equation k-omega turbulence models for aerodynamic flows. NASA TM 103975. California, USA. [Google Scholar]
47. Menter, F. R. (1994). Two-equation eddy-viscosity turbulence models for engineering applications. AIAA Journal, 32(8), 1598–1605. DOI 10.2514/3.12149. [Google Scholar] [CrossRef]
48. NASA (2015). The Menter shear stress transport turbulence model. Langley Research Center—Turbulence modeling resource. https://turbmodels.larc.nasa.gov/sst.html. [Google Scholar]
49. UFAD Diffusers (n.d.). (2016). UFAD diffusers. Center for Built Environment, University of California, Berkeley. http://www.cbe.berkeley.edu/underfloorair/diffusers.htm. [Google Scholar]
50. Lopez, N. S., Galeos, S. K., Calderon, B. R., Dominguez, D. R., Uy, B. J. et al. (2020). Numerical simulation of thermal stratification and air quality in an underfloor air distribution system (UFAD). Proceedings of International Conference on Sustainable Energy and Green Technology 2019, Bangkok, Thailand. [Google Scholar]
51. ASHRAE (2013). Thermal Environmental Conditions for Human Occupancy. ANSI/ASHRAE Standard 55-2013. https://www.ashrae.org/technical-resources/bookstore/thermal-environmental-conditions-for-human-occupancy#:~:text=ANSI%2FASHRAE%20Standard%2055%2D2013,buildings%20and%20other%20occupied%20spaces. [Google Scholar]
52. ISO (2015). Ergonomics of the thermal environment—Analytical determination and interpretation of thermal comfort using calculation of the PMV and PPD indices and local thermal comfort criteria. ISO 7730: 2005. https://www.iso.org/standard/39155.html. [Google Scholar]
 | This work is licensed under a Creative Commons Attribution 4.0 International License, which permits unrestricted use, distribution, and reproduction in any medium, provided the original work is properly cited. |