Materials Processing
| Fluid Dynamics & Materials Processing |
DOI: 10.32604/fdmp.2021.011486
ARTICLE
A Pressure-Drop Model for Oil-Gas Two-Phase Flow in Horizontal Pipes
1Engineer Technology Research Institute of Xinjiang Oilfield Company, Karamay, 834000, China
2School of Petroleum Engineering, Yangtze University, Wuhan, 430100, China
3Laboratory of Multiphase Pipe Flow of Gas Lift Innovation Center, CNPC (Yangtze University), Wuhan, 430100, China
4Kumasi Technical University, Kumasi, Ghana
*Corresponding Author: Ruiquan Liao. Email: liaoruiquan@263.net
Received: 11 May 2020; Accepted: 12 January 2021
Abstract: The accurate prediction of the pressure distribution of highly viscous fluids in wellbores and pipelines is of great significance for heavy oil production and transportation. The flow behavior of high-viscosity fluids is quite different with respect to that of low-viscosity fluids. Currently, the performances of existing pressure-drop models seem to be relatively limited when they are applied to high-viscosity fluids. In this study, a gas-liquid two-phase flow experiment has been carried out using a 60 mm ID horizontal pipe with air and white oil. The experimental results indicate that viscosity exerts a significant influence on the liquid holdup and pressure drop. At the same gas and liquid volume, both the liquid holdup and pressure drop increase with an increase in the viscosity. Combining two existing models, a modified pressure drop method is developed, which is applicable to horizontal pipes for different viscosities and does not depend on the flow pattern. This new method displays a high accuracy in predicting the new experimental data presented here and other published data in literature.
Keywords: Horizontal pipe; different viscosities; pressure drop model; gas-liquid two-phase flow
Recently, more attention is being paid to heavy oil production. However, improving the development efficiency of heavy oil production remains an important challenge to the oil industry. High viscosity fluids have significantly increased challenges to the exploitation and transportation of heavy oils. Due to the limitation of experimental conditions, there are few studies on pressure drop models of fluids with different viscosities. Studying the pressure drop of gas-liquid two-phase flow with different viscosities can provide theoretical and practical support for the development and efficient transportation of heavy oils [1,2].
In recent years, some research on different viscosity of gas-liquid two-phase flow in horizontal pipes have been carried out and the influence of viscosity on flow parameters studied. Andritsos et al. [3] conducted gas-liquid two-phase flow experiments in a horizontal pipe with a pipe diameter of 95.3 mm and a length of 25 m. The liquid viscosity was varied from 1 to 80 mPa·s. The experiments focused on the transition of stratified flow and slug flow under different viscosities. NäDler et al. [4] studied the influence of different fluid viscosities on the phase distribution of slug flow in horizontal pipe. The experimental pipe diameter was 59 mm, and the fluid viscosity range was between 14 and 37 mPa·s. The authors observed increased liquid holdup values with the increase of viscosity. Matsubara et al. [5] studied the effect of liquid viscosity on the flow pattern of gas-liquid two-phase flow in horizontal pipes, with a liquid viscosity range from 1 to 11000 mPa·s. The results revealed that two-phase flow pattern is dependent on the viscosity of the liquid. With the increase of the viscosity of the liquid phase, the wave flow and stratified flow regions were replaced by annular flow and intermittent flow, respectively. Sarica et al. [6] studied the gas-liquid two-phase flow law of medium viscosity oils (39 to 180 mPa·s) in horizontal pipe and the effect of viscosity on pressure gradient, liquid holdup and flow pattern observed. The study reported that when the viscosity of oil increases, the smooth region of stratification decreases. In addition, in comparison with the low viscosity conditions, the dispersed bubble flow presents a larger bubble concentration at the top of the pipe.
Some scholars have also developed and presented models to predict liquid holdup and pressure drop for oils of different viscosities. Gokcal et al. [1] studied the effect of high viscosity oil on the flow pattern in horizontal tubes. It was found that the existing mechanistic models need to be modified, and in some cases, new models developed to predict flow patterns, liquid holdup and pressure drop more accurately for higher-viscosity oils. Colmenares et al. [7] studied the pressure drop prediction slug flow model of horizontal pipe with high viscosity. The authors pointed out that the existing closure relationships should be improved in order to predict the parameters of high viscosity gas-liquid two-phase flow. Their modified mechanistic model provided better performance when compared with the existing models. Smith [8] conducted oil-gas two-phase flow experiments in horizontal pipes with 69 mm and 52 m pipe diameters respectively. His study suggested that the common multiphase flow models generally predict large pressure drop. Al-Safran et al. [9] studied the influence of high viscosity liquid on the liquid holdup of horizontal slug flow, and presented a physical explanation for the phenomena observed in the experiment. A new empirical model was presented to predict the liquid holdup of high viscosity liquid horizontal slug flow. Foletti et al. [10] used their experimental data to verify the Petalas [11] and Orell [12] mechanistic models, and the agreement is not satisfactory.
Previous experimental studies demonstrate that the multiphase flow modelling of high viscosity liquid differs from that of low viscosity liquid. Most of the gas-liquid two-phase flow models are based on the low viscosity liquid experiments, when these models used to predict liquid holdup and pressure drop of high viscosity gas-liquid two-phase flow, in most of the cases, the comparison is poor, and showing the need to develop a modified model.
In this paper, the influence of viscosity on gas-liquid two-phase flow was analyzed by carrying out two-phase flow oil-gas experiments in a horizontal pipe with oils of different viscosity. Models which predict of liquid holdup and pressure drop in horizontal pipe were studied. A modified pressure drop model, independent of flow pattern, in horizontal pipes for different viscosities was developed and its accuracy verified using experimental data and data from literature.
2 Experiment of Oil-Gas Two-Phase Flow with Different Viscosity in Horizontal Pipe
2.1 Experimental Device and Experimental Measurement
The experiment was carried out on the multiphase flow experimental platform at the Gas Lift Innovation Center located at Yangtze University. The platform, described in detail by Liu et al. [13] can be used to study multiphase pipe flow dynamics under different inclinations, diameters and temperatures. Pressure, temperature, and pressure differential sensors, as well as quick-closing valves and other devices, are installed on the pipe section. Data collection is done directly online at the control center. The inner diameter of the test section used in the experiment was 60 mm. This inner diameter is commonly used in petroleum industry. A high-speed camera installed on the pipe section (L/D ≈ 100) is used to record the flow patterns. The length between the two quick-closing valves and length between the two differential pressure sensors are 9.5 m and 8 m, respectively. This study provides approximately 2.4 m for the flow to develop [13], and the first differential pressure sensor is installed in the pipe 2.4 m away from the inlet. The length of 8 m is enough to observe all the fully developed flow patterns. The flowchart and the original experimental setup are shown in Fig. 1.
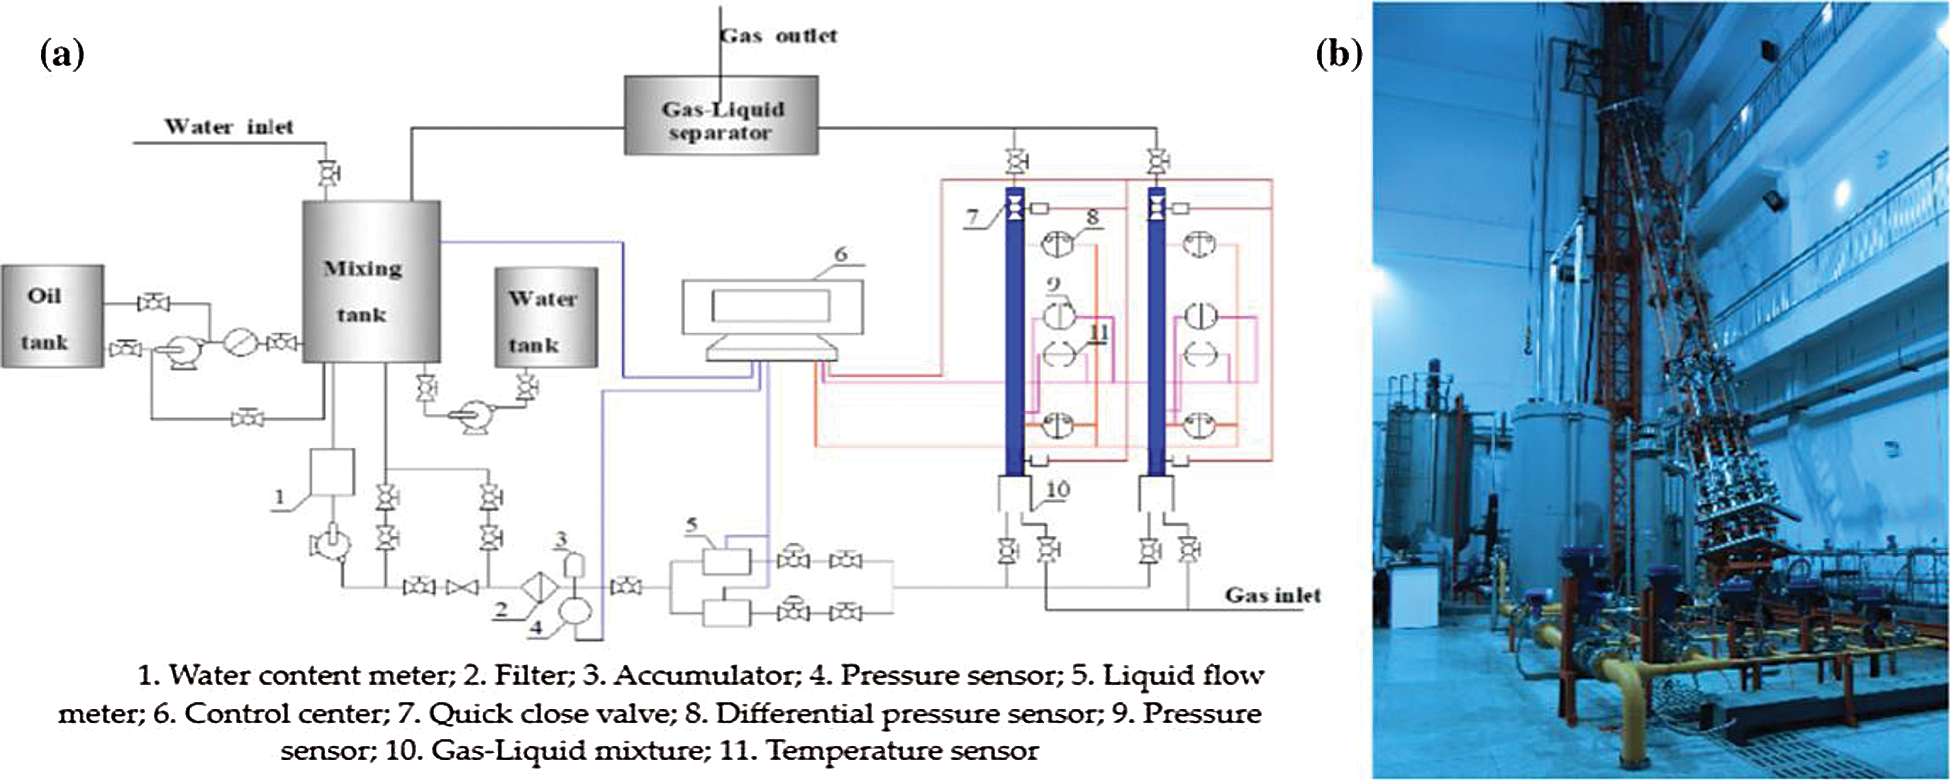
Figure 1: Flowchart of the experimental (a) and the original picture of the experiment (b)
In the experiment, a constant liquid flow rate was maintained, while the gas flow rate was adjusted. When the system was steady, the data were recorded, and the experimental flow pattern was observed. The experimental data were recorded every 5 s for 3 min; finally, the average value of each measurement parameter was obtained. After completing the data recording, the quick-closing valve was closed, and the liquid holdup was measured. Liquid holdup was calculated as the ratio of the volume of the residual liquid to the volume of the whole pipe was used as the average liquid holdup of the experiment.
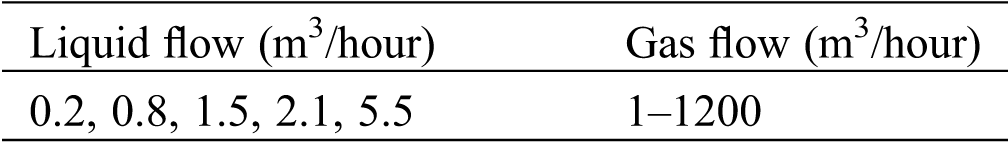
The ranges of experimental parameters are shown in Tab. 1, and all the typical flow patterns can be captured in the experiment. The flow range of liquid phase flowmeter was from 0 to 20 m3/hour with a measurement error of ±0.3%. The flow range of gas phase flowmeter was between 0 and 2100 m3/hour with a measurement error of ±1%. The inclination angle of the whole section could be adjusted from 0° to 90°. The error of the differential pressure sensors was ±0.025%. The uncertainty for pressure drop and liquid holdup are within ±2% and ±5%, respectively [14].
Table 1: Experimental parameters range
For this experiment, air was the gas phase, while the liquid phase was white oil with tackifier, which can be soluble in white oil and increase viscosity of the white oil. The relationship between density and temperature, viscosity and temperature of liquid phase were obtained by fitting a curve to the measured data. The physical properties of the liquids are shown in Tab. 2. Tab. 2 shows that the viscosities of the white oil vary with temperature. Therefore, the viscosity of the oil was controlled by keeping the temperature constant in the experiments.
Table 2: Physical parameters of fluid medium

In the experiment, when the liquid volume is kept constant, bubble flow, stratified flow, wave flow, slug flow, churn flow and annular flow were observed with the increase of gas volume. The typical flow patterns observed in the experiment captured by the high-speed camera are as shown in Fig. 2, and these flow patterns are different from the flow patterns in inclined and vertical pipes [15,16]. The churn flow is the transition region from slug to annular flow. It is found that the transition region decreases with the increase of viscosity.
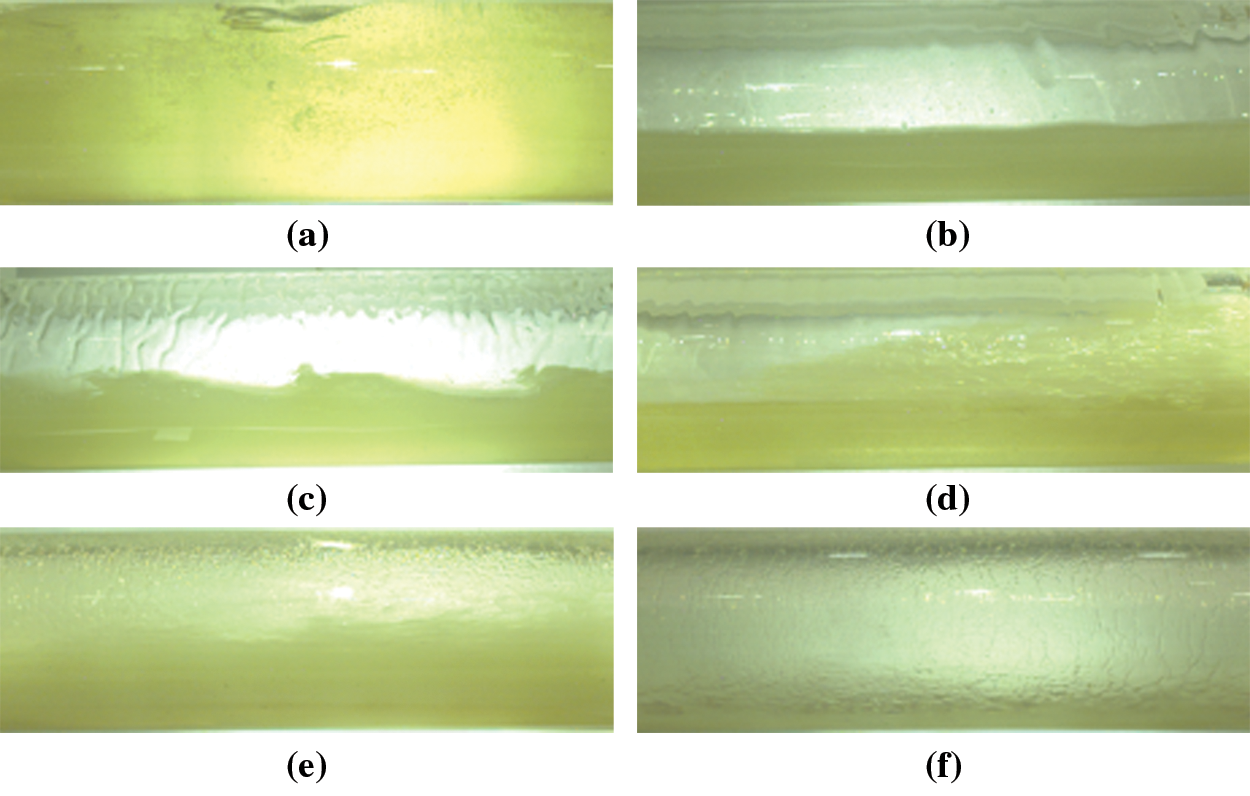
Figure 2: Typical flow patterns in this experiment (a) Bubble flow, (b) Stratified flow, (c) Wave flow, (d) Slug flow, (e) Churn flow, (f) Annular flow
3.2 Effect of Viscosity on Liquid Holdup
The changes of liquid holdup with liquid viscosity are shown in Figs. 3 and 4. It can be seen that the liquid holdup decreases with the increase of gas volume flow rate, and increases with the increase of liquid volume flow rate. This is because when the gas volume flow in the pipeline increases, the apparent gas flow rate will increase, and the gas has a stronger liquid carrying capacity, which leads to the decrease of liquid holdup in the pipeline. In addition, it can be seen from the Figs. 3 and 4 that when the gas flow rate (>200 m3/hour) or liquid flow rate (>2 m3/hour) is large, their influence on liquid holdup becomes smaller, however, viscosity has a great on liquid holdup at different flow rates.
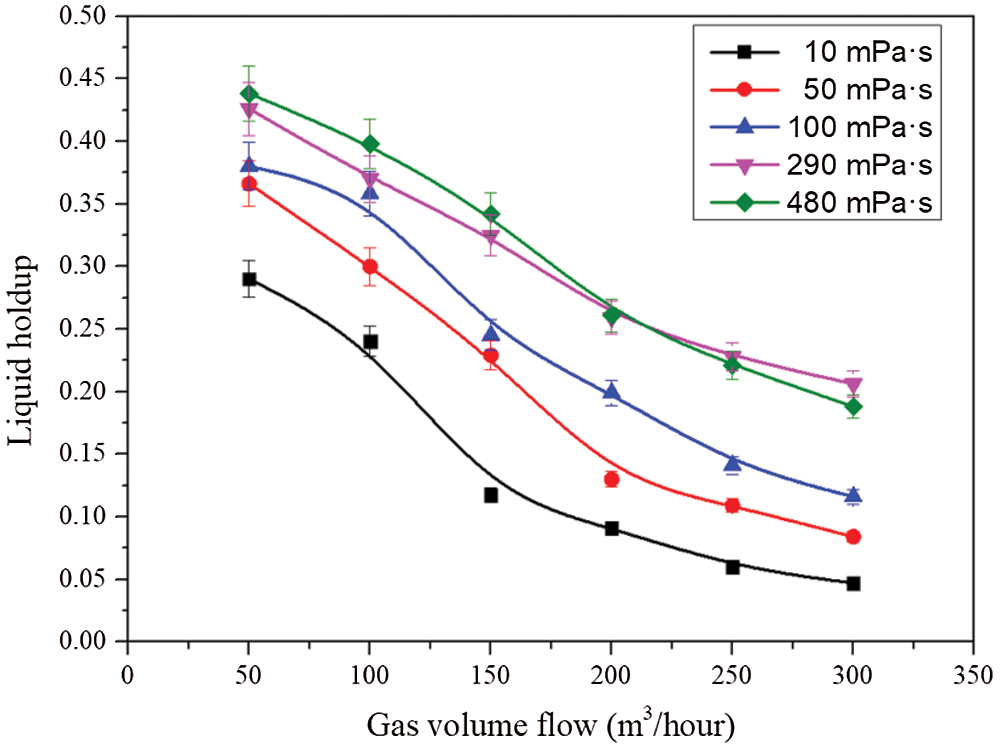
Figure 3: Liquid holdup under different gas volume flow and viscosity
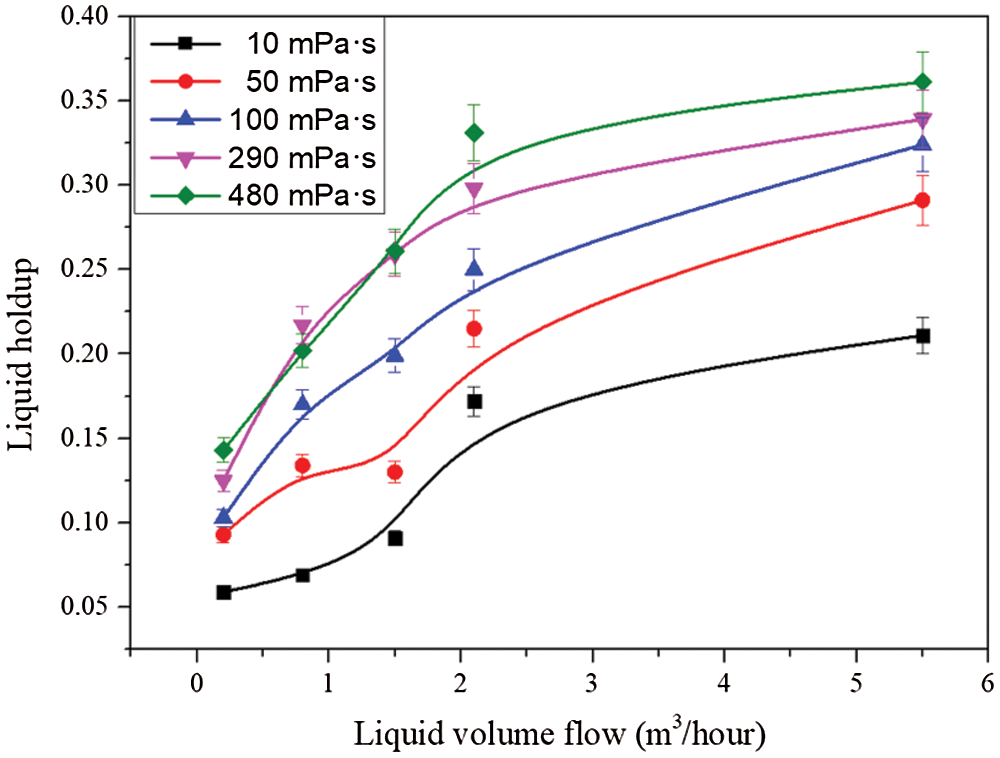
Figure 4: Liquid holdup under different liquid volume flow and viscosity
3.3 Effect of Viscosity on Pressure Drop
The change of pressure drop with viscosity under the same gas and liquid volume are shown in Figs. 5 and 6. It can be seen from the Fig. 5 that when the volume flow rate of gas is constant, the pressure drop increases with the increase of the liquid viscosity. This is because when the viscosity is greater, the friction drop between the liquid in the pipe and the pipe wall will become greater. It can be seen from the Fig. 6 when the volume flow rate of the liquid phase is constant, the pressure drop increases obviously with the increase of the volume flow rate of the gas phase, which is caused by the ratio of the pressure drop to the quadratic power of the velocity. Moreover, with the increase of the volume flow rate of the gas phase, the liquid film gradually forms and spreads on the pipe wall, and the friction pressure drop between the liquid and the pipe wall increases. When the volume flow rate of the gas phase is constant, the pressure drop will increase with the increase of the volume flow rate of the liquid phase. This is because when the volume of the liquid phase increases, the proportion of the nearly smooth pipe wall covered by the rough interface formed by the liquid phase and the gas phase is larger, and the larger the volume of the liquid phase is, more energy is needed to overcome the viscous resistance in the pipe to promote the viscous fluid, which leads to the friction coefficient and friction pressure increased. It can be also seen from the figure that, with the increase of liquid flow rate or gas flow rate, the influence of viscosity on pressure drop becomes larger.
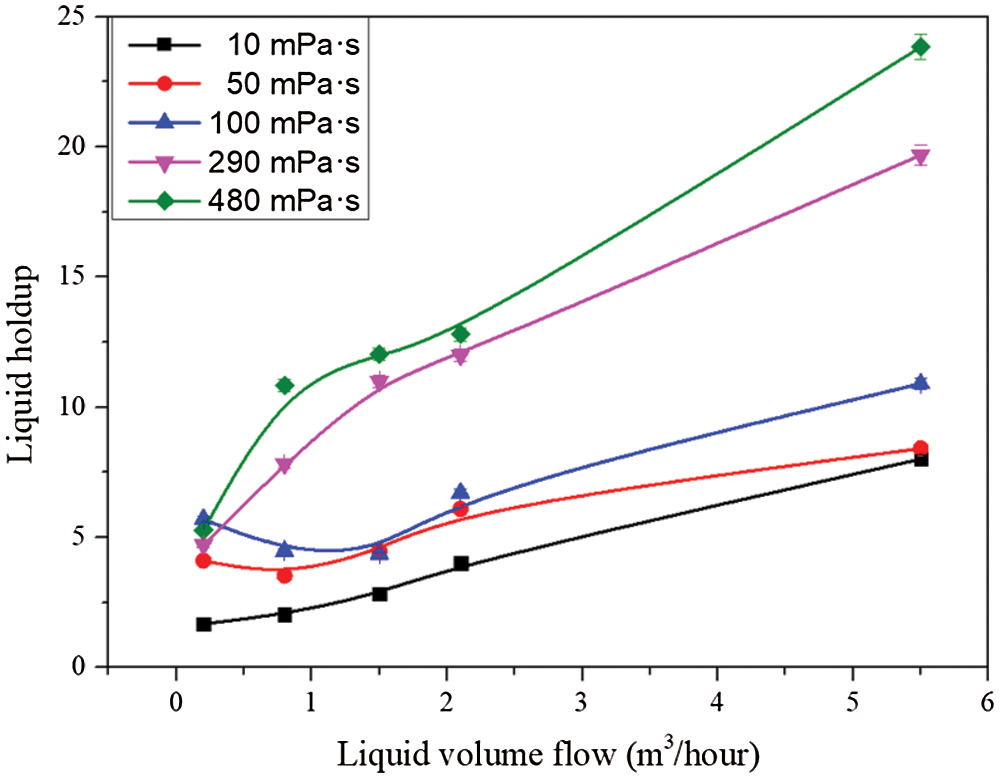
Figure 5: Pressure drop under different liquid volume flow and viscosity
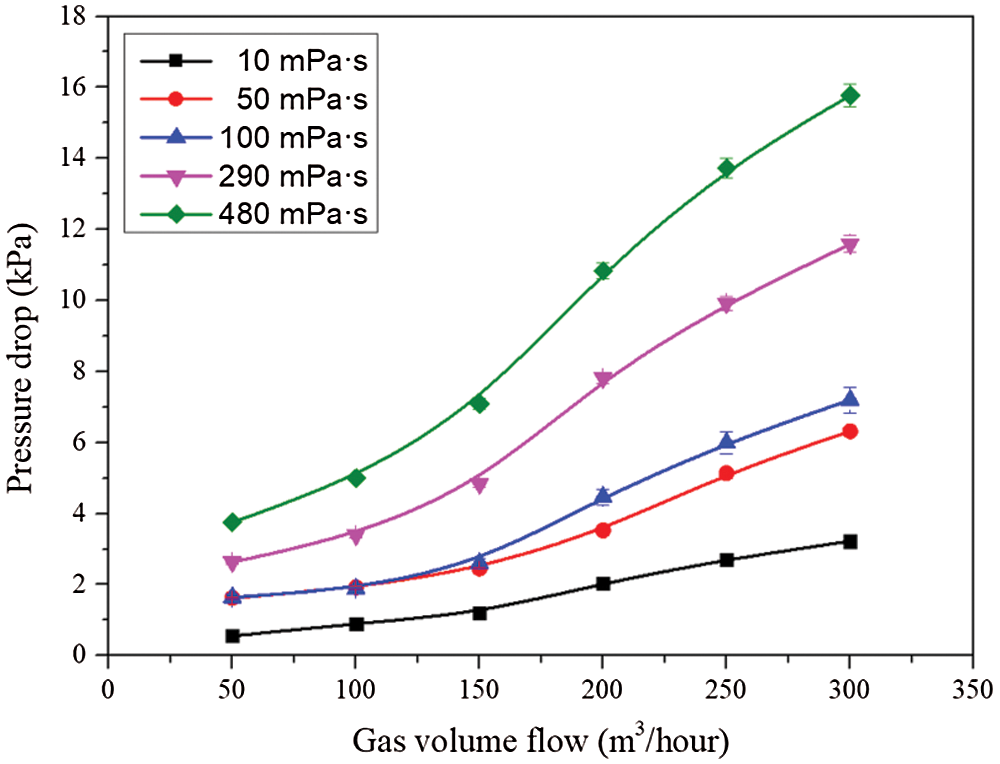
Figure 6: Pressure drop under different gas volume flow and viscosity
4 Development and Evaluation of Oil-Gas Two-Phase Pressure Drop Model in Horizontal Pipe
The liquid holdup directly affects the gravity pressure drop in the pressure drop of inclined and vertical pipes. Although there is no gravity pressure drop in the horizontal pipe, previous studies have shown that the calculation of friction pressure drop in the horizontal pipe is needed to determine the liquid holdup. In the horizontal pipes, Taitel et al. [17] indicated that when the liquid flow rate is small, with the increase of gas flow rate, the flow pattern will change from bubble flow to laminar flow, and then to slug flow. However, when the liquid flow rate exceeds a certain value, the flow pattern will directly change from bubble flow to slug flow. Therefore, this paper developed a liquid holdup model, and then proceeded to develop a pressure drop model independent of flow pattern based on the given liquid holdup model.
4.1 Calculation Method of Liquid Holdup in Horizontal Pipe
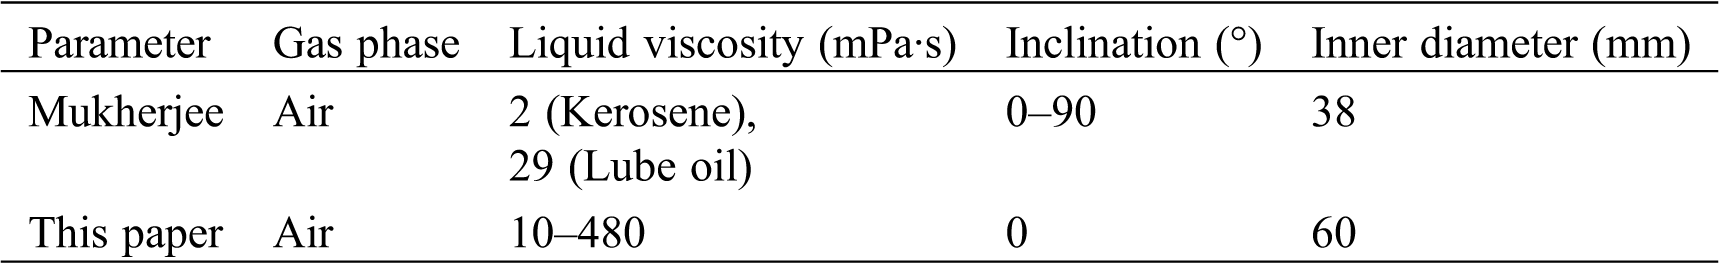
Many researchers have recognized the method of analyzing the liquid holdup by using dimensionless criterion, for instance Abdul-Majeed et al. [18] introduced Lockhart [19] dimensionless parameter to calculate the liquid holdup. The Mukherjee [20] liquid holdup model is expressed by a set of dimensionless standard numbers, among which the liquid viscosity number
Table 3: The comparison of the experiments in this paper and Mukherjee et al. [20]
According to Mukherjee et al. [20] model, in the paper, the liquid holdup
The coefficients obtained by experimental data fitting are shown in Tab. 4.
Table 4: Liquid holdup coefficient

4.2 Pressure Drop Model of Horizontal Pipe
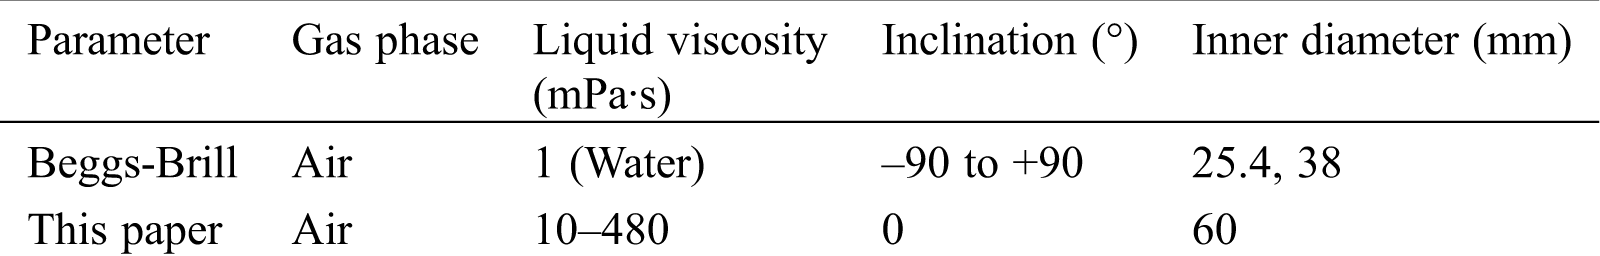
Considering that Beggs et al. [21] pressure drop model is also independent of the flow pattern. The comparison of the experiments in the paper and Beggs et al. [21] is shown in Tab. 5.
Table 5: The comparison of the experiments in the paper and Beggs et al. [21]
In the paper, a modified model is proposed based on the Beggs-Brill model. The general formula for calculating the pressure drop in the horizontal pipe of Beggs et al. [21] model is as follows:
The friction coefficient can be calculated by the following equation:
where
In the Beggs et al. [21] model, the important parameter to determine the friction pressure drop is the hydraulic friction coefficient
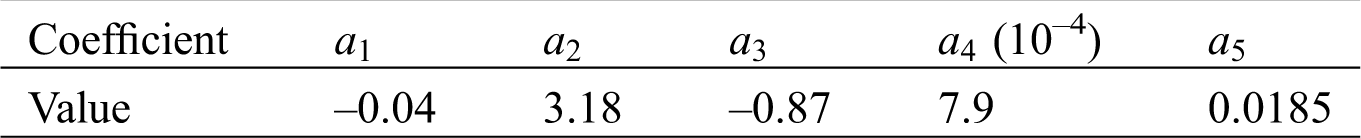
In this paper, we use the similar form of n to add the factor of
where
Finally, according to the experimental data, the fitting coefficient values are shown in Tab. 6.
Table 6: New coefficient of friction pressure drop
4.3 Evaluation of Pressure Drop Model
In order to compare the accuracy of the new model, six existing pressure drop models (Beggs et al. [21], Mukherjee et al. [20], Dukler I et al. [22], Dukler II et al. [23], Shannak [24], Baker [25]) were validated by using the experimental data. Beggs et al. [21] model, Mukherjee et al. [20] model and Baker model are empirical models, Beggs et al. [21] model and Mukherjee [20] model can be used to predict the pressure drop from horizontal to vertical pipes, Baker [25] model can only be used for pressure drop prediction of horizontal pipes. Dukler I et al. [22] model and Dukler II et al. [23] model are assuming that between the two phases is no slip flow and slip flow, respectively. Shannak [24] model includes a new definition of the Reynolds number and the friction factor of two-phase flow. The friction pressure drop correlation is as follows:
Two statistical parameters (The average percentage error and the absolute average percentage error) are employed for evaluating the performance of the models. The average percentage error (APE) is a statistical indicator used to measure the accuracy of prediction, and the absolute average percentage error (AAPE) can accurately reflect the actual prediction error. N is the number of experimental groups, and the formula is as follows:
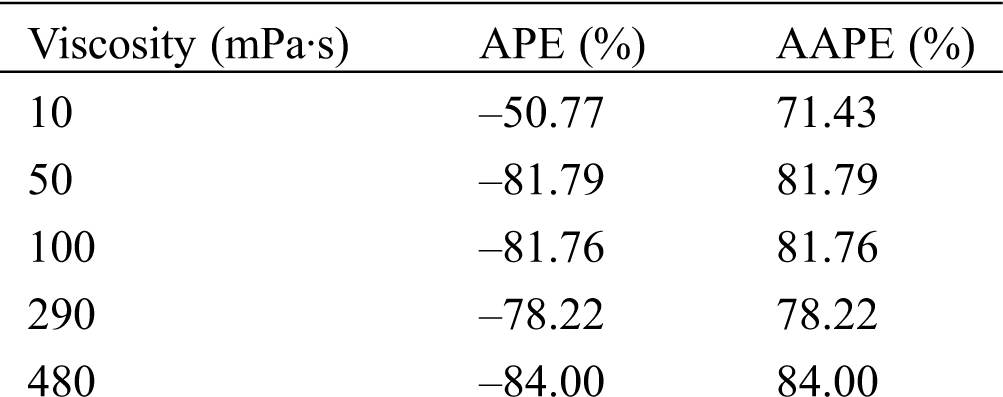
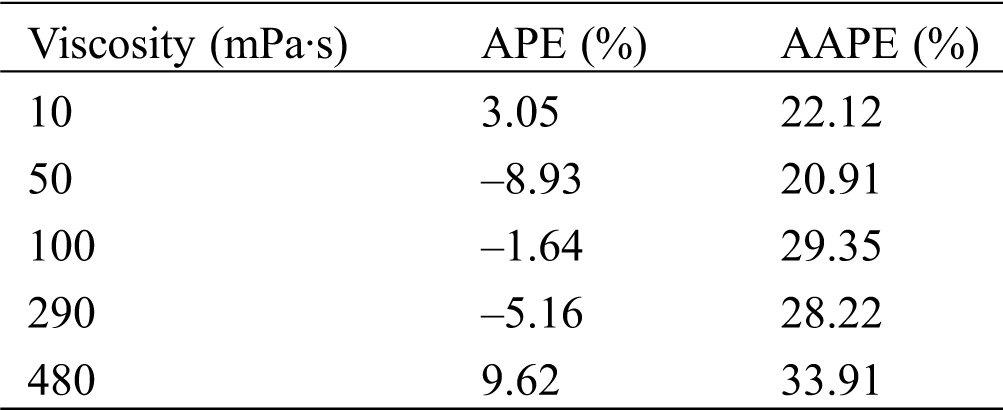
The prediction errors of the six pressure drop models are shown from Tabs. 7–12. It can be seen from the results that, when the liquid viscosity is low (10 mPa·s), the performance of Beggs et al. [21] model, Mukherjee et al. model [20] and Shannak [24] model is better. However, the prediction accuracy becomes worse with the increase of viscosity. The prediction performances of the Dukler I et al. [22], Dukler II et al.[23] and Baker [25] models are poor for all viscosity experimental data. Overall, it can be seen that the six models are not suitable for high viscosity fluid flow, and the errors increase with the increase of viscosity, and the predicted results are smaller than the experimental values.
Table 7: Verification of pressure drop calculation of Beggs et al. [21]
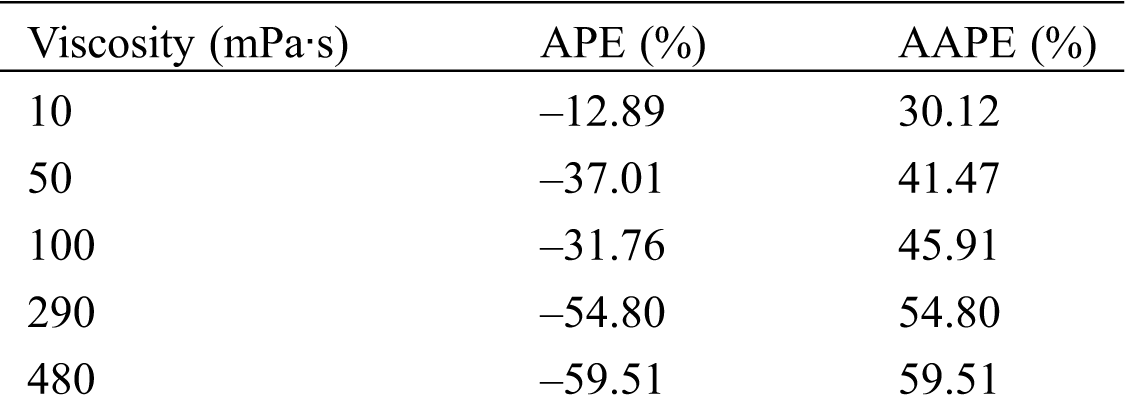
Table 8: Verification of pressure drop calculation of Mukherjee et al. [20]
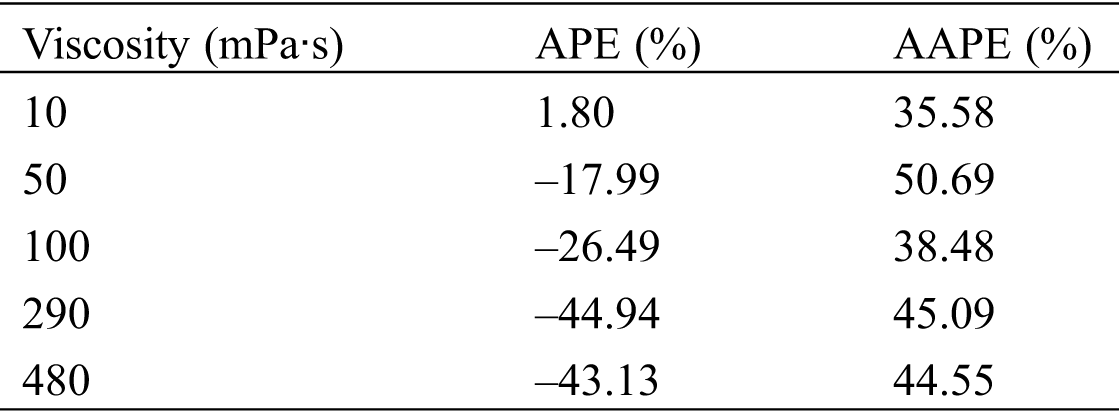
Table 9: Verification of pressure drop calculation of Dukler I et al. [22]
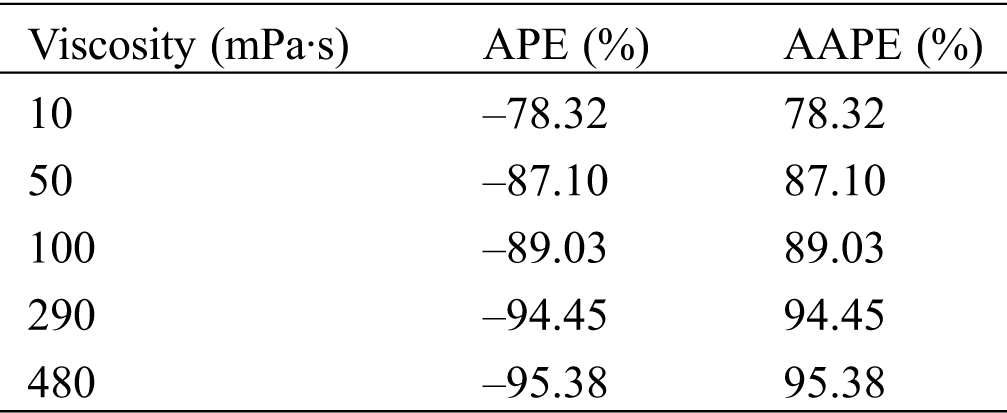
Table 10: Verification of pressure drop calculation of Dukler II et al. [23]
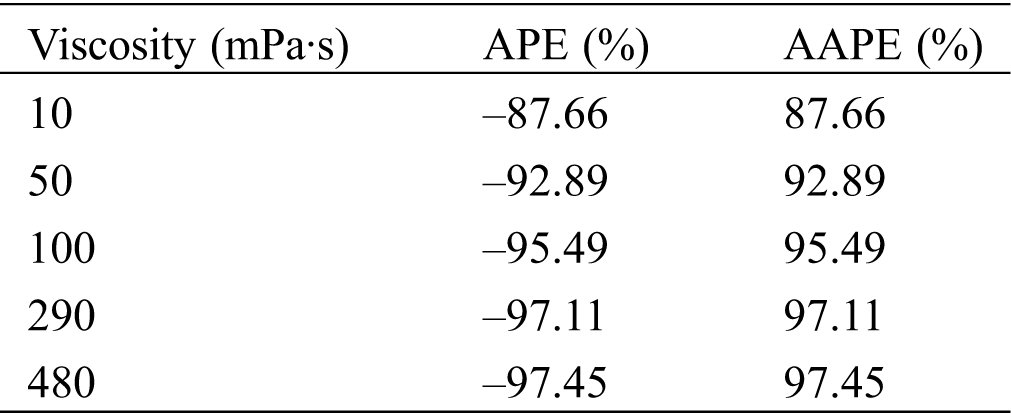
Table 11: Verification of pressure drop calculation of Shannak [24]
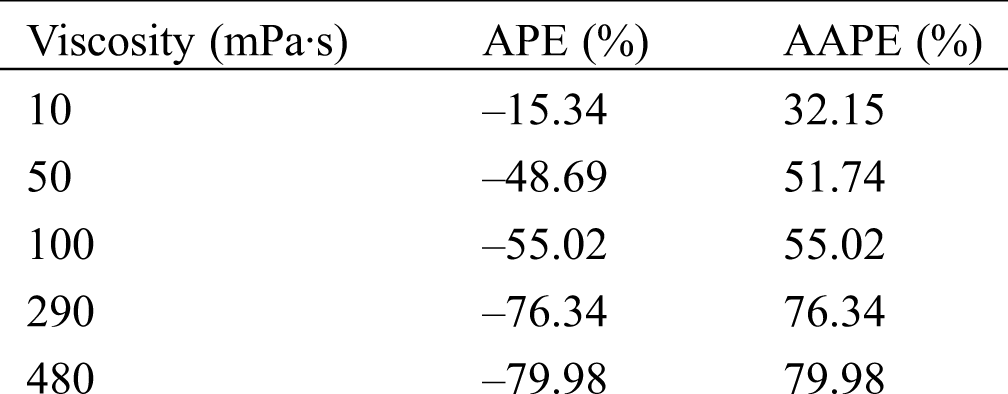
Table 12: Verification of pressure drop calculation of Baker [25]
The prediction error of the new model is shown in Tab. 13. It can be seen from the results that the prediction accuracy of the modified formula has been improved under various viscosity conditions, and the average percentage error APE is within ±10%. The results indicate that the new model can be applied to the conditions of high gas-liquid ratio and high viscosity, and broaden the scope of application.
Table 13: Verification of pressure drop calculation of present model
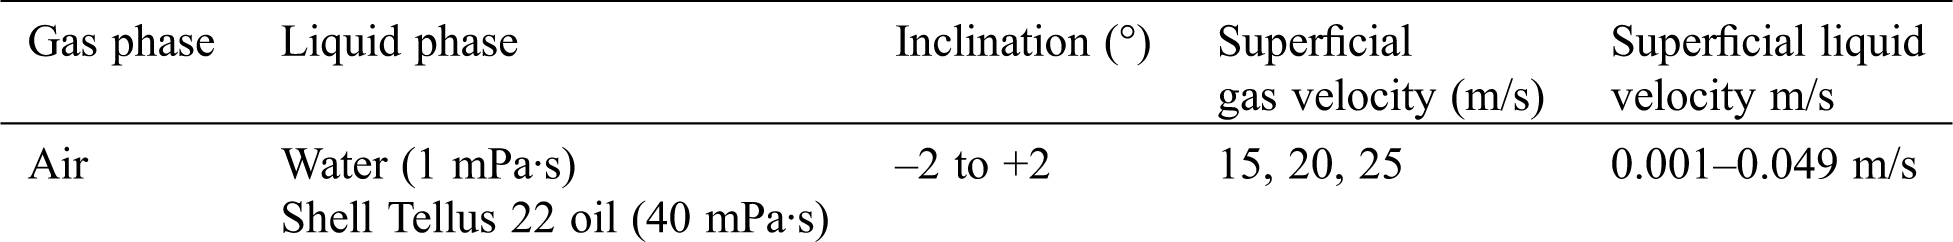
In order to better evaluate the applicability of the new model, the new model was used to predict the experimental pressure drop data of horizontal tube disclosed by Badie et al. [26]. The experimental conditions of Badie [26] are shown in Tab. 14.
Table 14: The experimental conditions of Badie et al. [26]
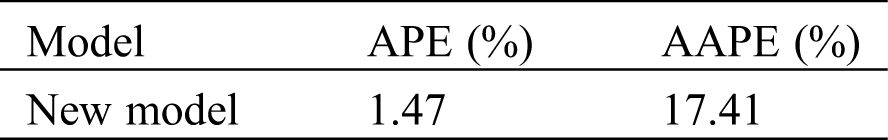
The results are shown in Tab. 15. The APE between the pressure drop predicted by the modified formula and the experimental data is within 10%, and the prediction accuracy is higher.
Table 15: Verification of the new model to open experimental data
In order to obtain the accurate calculation method of oil-gas two-phase pressure drop of different viscosity in horizontal pipe, experiments of gas-liquid two-phase flow with different viscosities were carried out. Through the analysis of the experimental data, it can be seen that viscosity has a great influence on the liquid holdup and pressure drop. Under the condition of a certain flow rate of gas and liquid, with the increase of liquid viscosity in the pipe, the viscosity between the liquid-phase fluid and the pipe wall will increase with the increase of viscosity as the friction between the liquid and the wall increases, the liquid holdup and pressure drop increase with the increase of viscosity. Based on the methods of Beggs et al. [21] and Mukherjee et al. [20], a new model for prediction of two-phase flow pressure drop in horizontal pipe is presented. The verification results of the new model, implemented by using experimental data and published literature data, show that the new model has higher prediction accuracy and can be applied to the case of high gas-liquid ratio and high viscosity.
Acknowledgement: Gratitude is extended to Ruiquan Liao, the corresponding author for the article. The authors would also like to acknowledge the support provided by the National Natural Science Fund Project (61572084), Major National Projects (2016ZX05056004-002) and Guiding Project of 2016 Scientific Research Plan of Hubei Provincial Education Department (B2016031).
Funding Statement: This work was supported by National Natural Science Foundation of China (No. 61572084) and the National Key Research and Development Program of China (2016ZX05056004-002).
Conflicts of Interest: The authors declare that they have no conflicts of interest to report regarding the present study.
1. Gokcal, B. (2005). Effects of high oil viscosity on two-phase oil-gas flow behavior in horizontal pipes (Ph.D. Thesis). University of Tulsa, USA. [Google Scholar]
2. Fan, Y., Wang, Q., Zhang, H. Q., Danielson, T. J., Sarica, C. (2007). A model to predict liquid holdup and pressure gradient of near-horizontal wet-gas pipelines. SPE Projects, Facilities & Construction, 2(2), 1–8. DOI 10.2118/95674-PA. [Google Scholar] [CrossRef]
3. Andritsos, N., Hanratty, T. J. (1987). Interfacial instabilities for horizontal gas-liquid flows in pipelines. International Journal of Multiphase Flow, 13(5), 583–603. DOI 10.1016/0301-9322(87)90037-1. [Google Scholar] [CrossRef]
4. NäDler, M., Mewes, D. (1995). Effects of the liquid viscosity on the phase distributions in horizontal gas-liquid slug flow. International Journal of Multiphase Flow, 21(2), 253–266. DOI 10.1016/0301-9322(94)00067-T. [Google Scholar] [CrossRef]
5. Matsubara, H., Naito, K. (2011). Effect of liquid viscosity on flow patterns of gas-liquid two-phase flow in a horizontal pipe. International Journal of Multiphase Flow, 37(10), 1277–1281. DOI 10.1016/j.ijmultiphaseflow.2011.08.001. [Google Scholar] [CrossRef]
6. Sarica, C., Pereyra, E. J., Brito, R. (2013). Effect of medium oil viscosity on two phase oil gas flow behavior in horizontal pipes (Master Thesis). . University of Tulsa, USA. [Google Scholar]
7. Colmenares, J., Ortega, P., Padrino, J., Trallero, J. L. (2001). Slug flow model for the prediction of pressure drop for high viscosity oils in a horizontal pipeline. Society of Petroleum Engineers SPE International Thermal Operations and Heavy Oil Symposium. DOI 10.2523/71111-ms. [Google Scholar] [CrossRef]
8. Smith, I. E., Krampa, F. N., Fossen, M., Brekken, C., Unander, T. E. (2011). Investigation of horizontal two-phase gas-liquid pipe flow using high viscosity oil: Comparison with experiments using low viscosity oil and simulations. BHRG International Comference of Multiphase Flow Cannes, France. [Google Scholar]
9. Al-Safran, E., Kora, C., Sarica, C. (2015). Prediction of slug liquid holdup in high viscosity liquid and gas two-phase flow in horizontal pipes. Journal of Petroleum Science and Engineering, 133(6), 566–575. DOI 10.1016/j.petrol.2015.06.032. [Google Scholar] [CrossRef]
10. Foletti, C., Farisè, S., Grassi, B., Strazza, D., Lancini, M. et al. (2011). Experimental investigation on two-phase air/high-viscosity-oil flow in a horizontal pipe. Chemical Engineering Science, 66(23), 5968–5975. DOI 10.1016/j.ces.2011.08.019. [Google Scholar] [CrossRef]
11. Petalas, N., Aziz, K. (2000). A mechanistic model for multiphase flow in pipes. Journal of Canadian Petroleum Technology, 39(6). DOI 10.2118/98-39. [Google Scholar] [CrossRef]
12. Orell, A. (2005). Experimental validation of a simple model for gas-liquid slug flow in horizontal pipes. Chemical Engineering Science, 60(5), 1371–1381. DOI 10.1016/j.ces.2004.09.082. [Google Scholar] [CrossRef]
13. Liu, Z., Liao, R., Luo, W., Su, Y., Ribeiro, J. X. F. (2020). A new model for predicting slug flow liquid holdup in vertical pipes with different viscosities. Arabian Journal for Science and Engineering, 45, 7741–7750. DOI 10.1007/s13369-019-04308-5. [Google Scholar] [CrossRef]
14. Liu, Z., Liao, R., Luo, W., Ribeiro, J. X. F., Su, Y. (2019). Friction pressure drop model of gas-liquid two-phase flow in an inclined pipe with high gas and liquid velocities. AIP Advances, 9(8), 085025. DOI 10.1063/1.5093219. [Google Scholar] [CrossRef]
15. Wang, Z., Luo, W., Liao, R., Xie, X., Wang, H. (2019). Slug flow characteristics in inclined and vertical channels. Fluid Dynamics and Materials Processing, 15(4), 583–595. DOI 10.32604/fdmp.2019.06847. [Google Scholar] [CrossRef]
16. Liu, Y., Su, Y., Wu, Z., Luo, W., Liao, R. (2020). Effect of the inclination angle on slippage loss in gas-liquid two-phase flow. Fluid Dynamics & Materials Processing, 16(3), 475–488. DOI 10.32604/fdmp.2020.08896. [Google Scholar] [CrossRef]
17. Taitel, Y., Dukler, A. E. (1976). A model for predicting flow regime transitions in horizontal and near horizontal gas-liquid flow. AIChE Journal, 22(1), 47–55. DOI 10.1002/aic.690220105. [Google Scholar] [CrossRef]
18. Abdul-Majeed, G. H., Al-Mashat, A. M. (2019). A unified correlation for predicting slug liquid holdup in viscous two-phase flow for pipe inclination from horizontal to vertical. SN Applied Sciences, 1(1), 27. DOI 10.1007/s42452-018-0081-0. [Google Scholar] [CrossRef]
19. Lockhart, R. W. (1949). Proposed correlation of data for isothermal two-phase, two-component flow in pipes. Chemical Engineering Progress, 45(1), 39–48. [Google Scholar]
20. Mukherjee, H., Brill, J. P. (1985). Pressure drop correlations for inclined two-phase flow. Journal of Energy Resources Technology, 107(4), 549–554. DOI 10.1115/1.3231233. [Google Scholar] [CrossRef]
21. Beggs, D. H., Brill, J. P. (1973). An experimental study of two-phase flow in inclined pipes. Journal of Petroleum Technology, 25(5), 607–617. DOI 10.2118/4007-PA. [Google Scholar] [CrossRef]
22. Dukler, A. E., Wicks, M., Cleveland, R. G. (1964). Frictional pressure drop in two-phase flow: A comparison of existing correlations for pressure loss and holdup. AIChE Journal, 10(1), 38–43. DOI 10.1002/aic.690100117. [Google Scholar] [CrossRef]
23. Dukler, A. E., Hubbard, M. G. (1975). A model for gas-liquid slug flow in horizontal and near horizontal tubes. Industrial & Engineering Chemistry Fundamentals, 14(4), 337–347. [Google Scholar]
24. Shannak, B. A. (2008). Frictional pressure drop of gas liquid two-phase flow in pipes. Nuclear Engineering & Design, 238(12), 3277–3284. DOI 10.1016/j.nucengdes.2008.08.015. [Google Scholar] [CrossRef]
25. Baker, O. (1958). Multiphase flow in pipelines. Oil and Gas Journal, 10, 156–l67. [Google Scholar]
26. Badie, S., Hale, C. P., Lawrence, C. J., Hewitt, G. F. (2000). Pressure gradient and holdup in horizontal two-phase gas-liquid flows with low liquid loading. International Journal of Multiphase Flow, 26(9), 1525–1543. DOI 10.1016/S0301-9322(99)00102-0. [Google Scholar] [CrossRef]
 | This work is licensed under a Creative Commons Attribution 4.0 International License, which permits unrestricted use, distribution, and reproduction in any medium, provided the original work is properly cited. |