Materials Processing
| Fluid Dynamics & Materials Processing |
DOI: 10.32604/fdmp.2021.014126
REVIEW
A Review on the Evaporation Dynamics of Sessile Drops of Binary Mixtures: Challenges and Opportunities
1Department of Mechanical and Aerospace Engineering, Indian Institute of Technology Hyderabad, Sangareddy, Telangana, India
2Department of Chemical Engineering, Indian Institute of Technology Hyderabad, Sangareddy, Telangana, India
*Corresponding Author: Kirti Chandra Sahu. Email: ksahu@che.iith.ac.in
Received: 01 September 2020; Accepted: 25 January 2021
Abstract: The wetting and evaporation dynamics of sessile droplets have gained considerable attention over the last few years due to their relevance to many practical applications, ranging from a variety of industrial problems to several biological systems. Droplets made of binary mixtures typically undergo complex dynamics due to the differential volatility of the considered components and the ensuing presence of thermocapillary effects. For these reasons, many research groups have focused on the evaporation of binary droplets using a variegated set of experimental, numerical, and purely theoretical approaches. Apart from reviewing the state-of-the-art about the existing experimental, analytical, and computational techniques used to study the evaporation dynamics of binary sessile droplets, we also provide some indications about possible future research directions in this specific area.
Keywords: Wetting dynamics; evaporation; sessile droplet; binary mixture; thermocapillary flow
The study of the wetting and evaporation dynamics of sessile droplets has seen a lot of advancement in recent years due to its relevance in many practical applications ranging from industrial to biological systems [1–5]. A recent review by Brutin et al. [6] also highlighted the importance of this topic, especially in energy applications, with an increased number of droplet and evaporation publications in recent years. This subject also has applications in several modern technologies, such as spray cooling, DNA analysis, and complex fluid printing. Therefore, it is important to take cognizance of the state-of-the-art knowledge and understanding of this field and its future prospects that have been reviewed in the present study.
The present work undertakes an extensive review of wetting and evaporation dynamics for binary fluids. It is structured into five sections, namely the experimental, the semi-empirical (theoretical), the numerical, the influence of surface and fluid properties, and the future scope. The first three sections cover the various methodologies used in studying sessile binary droplets, and the last two sections discuss the effect of various parameters on the droplet dynamics and future scope, respectively. A deep look into this work shows the complexity involved in actually understanding the entire dynamics of sessile droplet evaporation. There are several ways of looking at a droplet evaporation problem based on the application. However, due to the inherent complexity, the physics considered in such an application-oriented approach remains limited and is difficult to generalize from one application to another. Hence, while work on understanding the evaporation of binary mixtures has gained momentum over the years owing to its practical applications, the theoretical models are limited in scope with regards to explaining the complete wetting and evaporation dynamics.
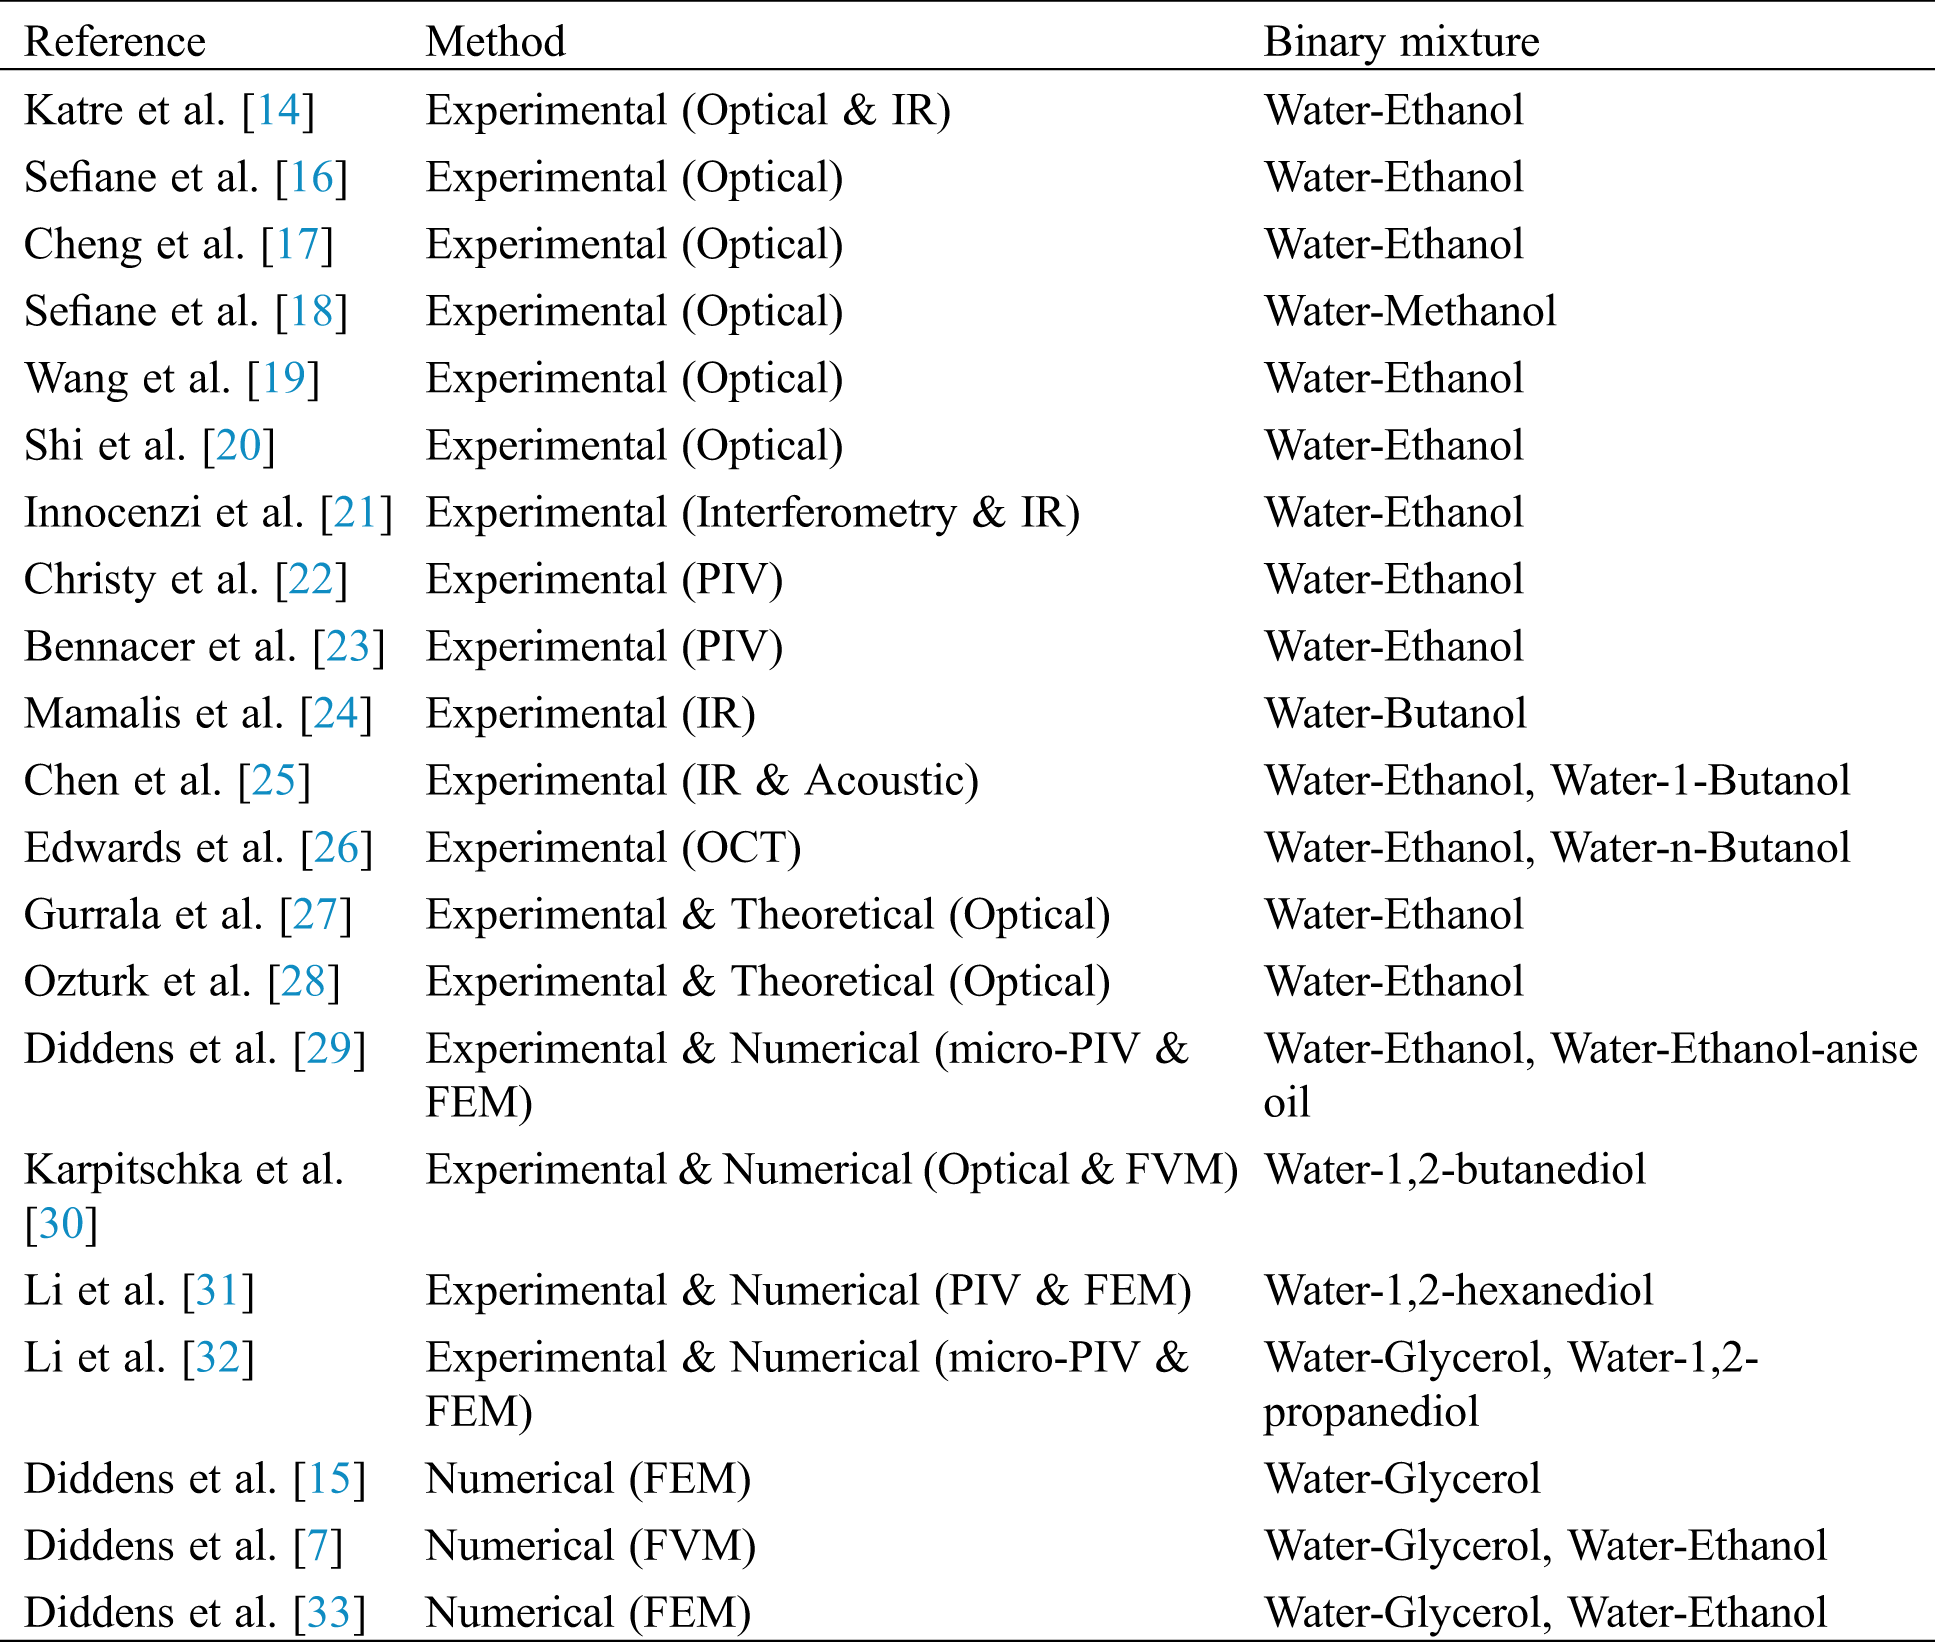
The evaporation of multi-component droplets is encountered in nature in many forms. In multi-component (binary, ternary) liquids, the interaction between different components produces new effects that are not observed in single-component (or pure) liquids. These effects have to be considered a part of the evaporation system. In many practical applications, such as combustion, ink-jet printing, drug delivery, assembly of autonomic fluidic machines, and nanostructure fabrication, binary mixtures are used (see [7,8]). Specifically, several researchers are considering novel fuel mixtures as alternative fuels, particularly for space applications. Extensive reviews have already been done on pure fluids [6,9] covering many aspects of the evaporation dynamics of the droplets. Several studies have used infrared (IR) thermography technique to study the evaporation of methanol, ethanol, and FC-72 droplets at room and elevated substrate temperatures [10–13]. Temperature pulsations were observed in those studies, and the pulsations were identified as the hydrothermal waves (HTWs) [11–13] that evolve due to Marangoni instabilities occurring as the droplet evaporates. Recently, Katre et al. [14] have observed pulsations in the case of a water-ethanol binary droplet on an inclined surface using IR thermography. Diddens et al. [15] have used finite element methodology to validate a quasi-stationary model for simulating the flow inside evaporating binary sessile and pendant droplets. A sharp interface Arbitrary Lagrangian-Eulerian (ALE) is used to examine under what circumstances the flow is dominated by the Marangoni effect and when by natural convection. While different methodologies (analytical, experimental, and numerical) have been successfully developed in predicting the evaporation of pure fluids, multi-component droplets add more complexity to the system by adding more parameters (e.g., mixture concentration) which might need new experimental and numerical simulation, image processing and analytical techniques in completely understanding the evaporation pattern. A summary of the literature on the evaporation of binary sessile droplets is given in Tab. 1.
Table 1: Summary of the earlier studies on the wetting and evaporation dynamics of binary sessile droplets. Abbreviations, PIV: Particle image velocimetry; IR: Infrared; OCT: Optical coherence tomography; FEM: Finite element method; FVM: Finite volume method; LBM: Lattice Boltzmann method
The motivation of the current work is to review the progress in binary component mixtures and present the challenges and future opportunities. A graphical representation of sessile droplet evaporation, which is similar to the one presented by [6], provides the keywords related to this field. The keywords are grouped into branches and sub-branches, and the authors have addressed all of them over a range of sections. A similar map is presented in Fig. 1 to give an idea of the scope of this review and a better picture of the cross-links that exist. The keywords within the circle represent the various external parameters. These parameters change the droplet dynamics that are represented in the outer boxes. The parameters in italics imply that very little or no work has been carried out relating to them and may lead to scope for future work. The tick marks beside the parameters indicate that they are considered in this study and the circle beside them indicates that they are beyond the scope of this study, and therefore are not discussed.
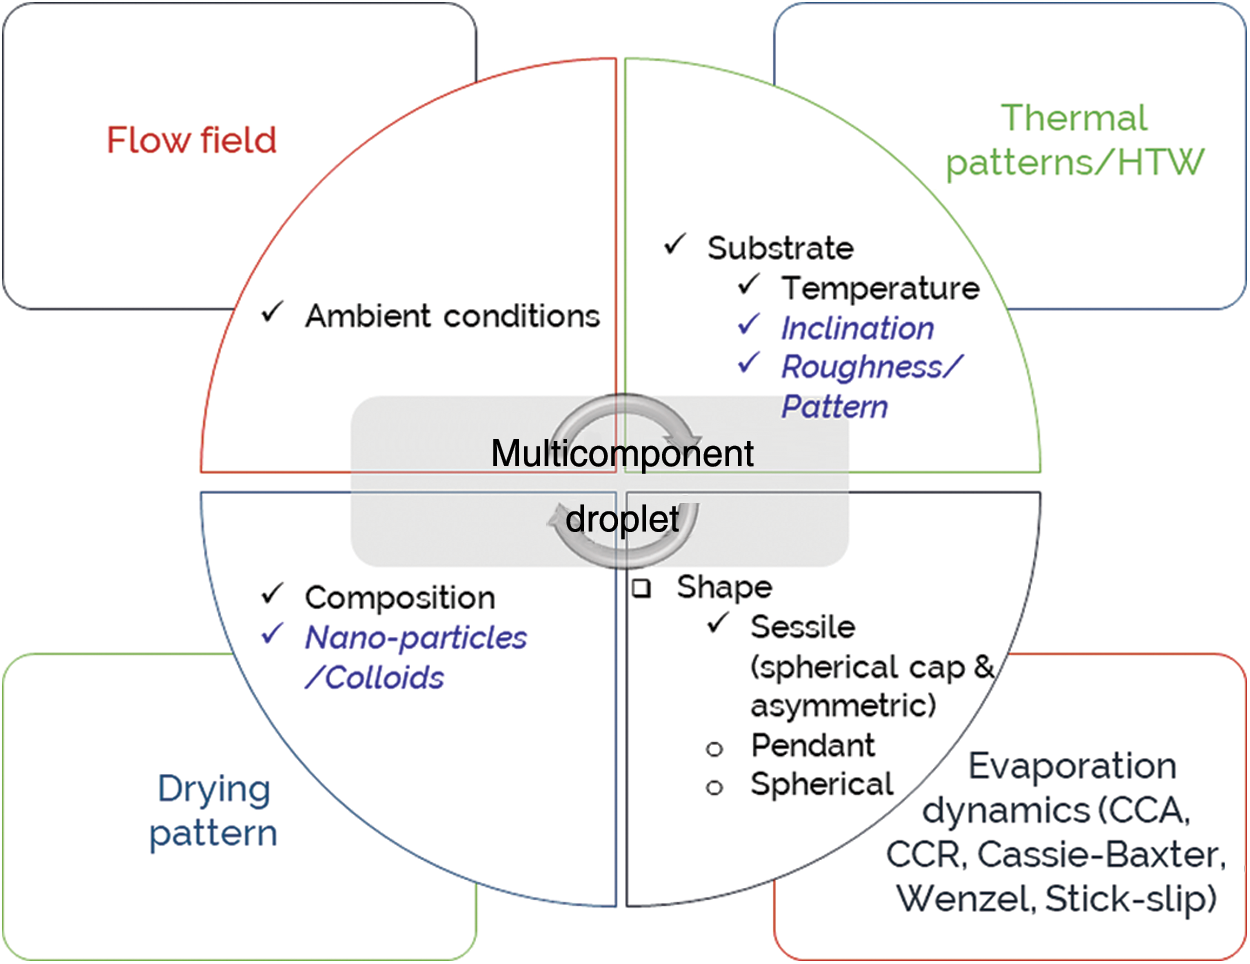
Figure 1: A map showing different aspects considered in the literature on droplet evaporation. Here, CCA and CCR denote the constant contact angle and constant contact radius, respectively, and HTW refers to hydrothermal waves
The experimental techniques used in the study of sessile droplets are primarily optical, using a charge-coupled device (CCD)/complementary metal-oxide semiconductor (CMOS) camera to evaluate parameters such as droplet height, wetting radius, and contact angle. The setup typically includes a syringe (with/without a motor control), a suitable substrate on which the droplet is placed, and a CCD/CMOS camera that captures the evaporation of the droplet. The droplet is often illuminated by a light at the back to observe the contour very clearly. Many other techniques, such as infrared (IR) thermography, particle image velocimetry (PIV), and acoustic methods, have been used to study various thermal patterns and flow field visualizations, which are discussed in this section.
Sefiane et al. first studied the evaporation of a binary water-ethanol droplet on a rough polytetrafluoroethylene substrate in a controlled pressure environment [16]. The effect of the droplet composition and profile on the evaporation rate was investigated experimentally using an optical technique. The droplet height, radius, volume, and dynamic contact angle are measured as a function of time. The optical technique allows the measurement of the dynamic contact angle, the drop volume, and the base width as a function of time. In the case of pure substances like water or ethanol, the evaporation rate and the drop profile are observed to have a monotonous evolution over time. However, in the case of binary water-ethanol mixtures, three stages with different wetting behaviors are identified. The evaporation rate calculation shows that the more volatile component evaporates completely in the first stage, while the less volatile component evaporates dominantly in the last stage. Later studies [17–20] used similar methods (as shown in Fig. 2) to investigate the evaporation of the droplet and presented the respective findings.
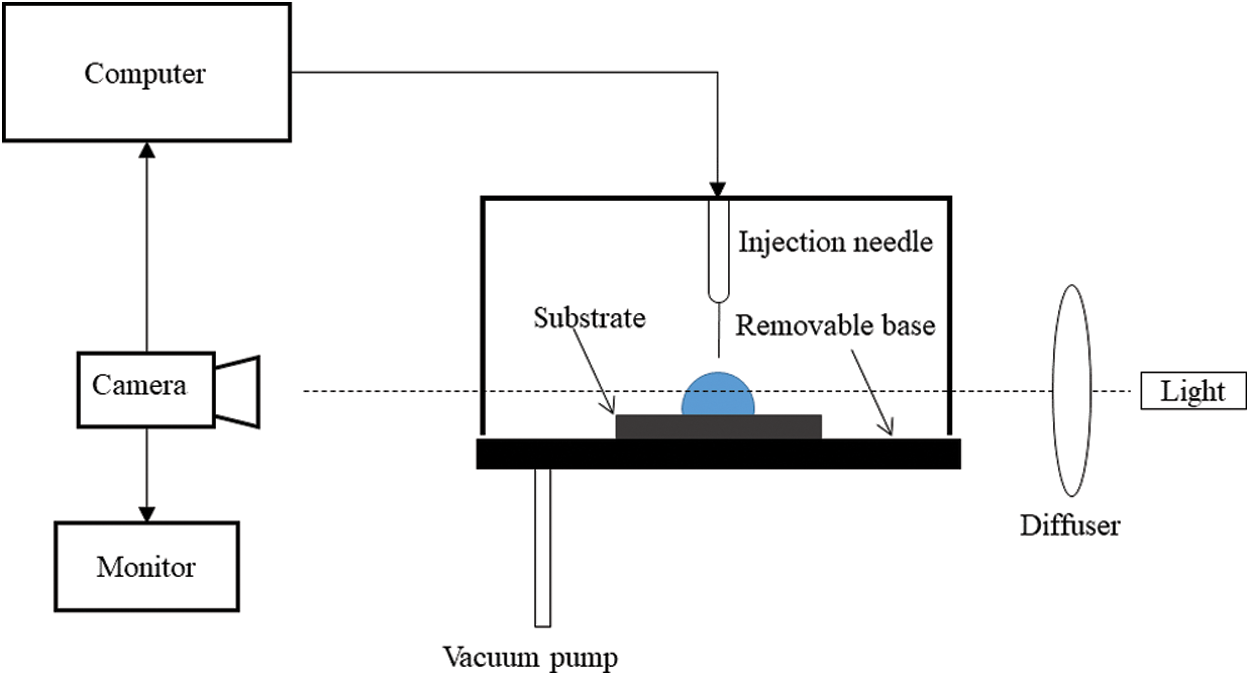
Figure 2: An experimental setup used to study evaporation of sessile droplets [16]
The hydrothermal waves (HTWs) are traveling waves that are induced by thermal effects in the liquid. The thermal instability in sessile droplets can be experimentally observed using two techniques, viz. infrared thermography and laser refracted shadowgraphy [34]. Riley et al. [35] first observed the presence of HTWs in a layer of silicone oil experimentally. Sefiane et al. [36] observed self-excited HTWs in the case of sessile droplet evaporating on a heated substrate. They defined HTWs as the spontaneous development of surface tension gradient driven thermal-convective instabilities along the free surface of droplets during the evaporation process. Later, Karapetsas et al. [37] have observed a different kind of temperature perturbations that are three-dimensional in a spiral-like shape and are oscillatory traveling wave trains organized radially with a uniform azimuthal angle. Sobac and Brutin have discussed the dynamics of HTWs in [38].
The process of binary droplet evaporation is complex because the components exhibit different volatilities in the mixture, leading to Marangoni convection and HTWs [18]. Few researchers have implemented interferometry [21] and IR thermography [38,12,39] to study the thermal convections/patterns in binary sessile droplets (water-ethanol) at different temperatures. Sáenz et al. [39] considered the evaporation of water droplets into nitrogen gas, and the thermal patterns were observed. With a similar experimental setup, Mamalis et al. [24] studied thermal patterns on the surface of a sessile binary (water + 1 – butanol) droplet evaporating on an inclined substrate at a temperature of 60°C and inclination of 5°. Droplets of volume 3 μl to 5 μl having 5% by volume of 1-butanol in water are placed on a borosilicate-glass substrate. A layer of silicone oil covers the substrate allowing the binary droplet to slide on the oil layer. In some cases, the droplet moved upwards (against the slope) due to dominant thermocapillary forces opposing the gravitational force. This is due to the non-monotonic dependency of the surface tension of butanol on temperature; it was also observed that the droplet spreading rate increases as the body forces and thermocapillary forces interact more. A schematic of the setup used by Brutin is shown in Fig. 3.
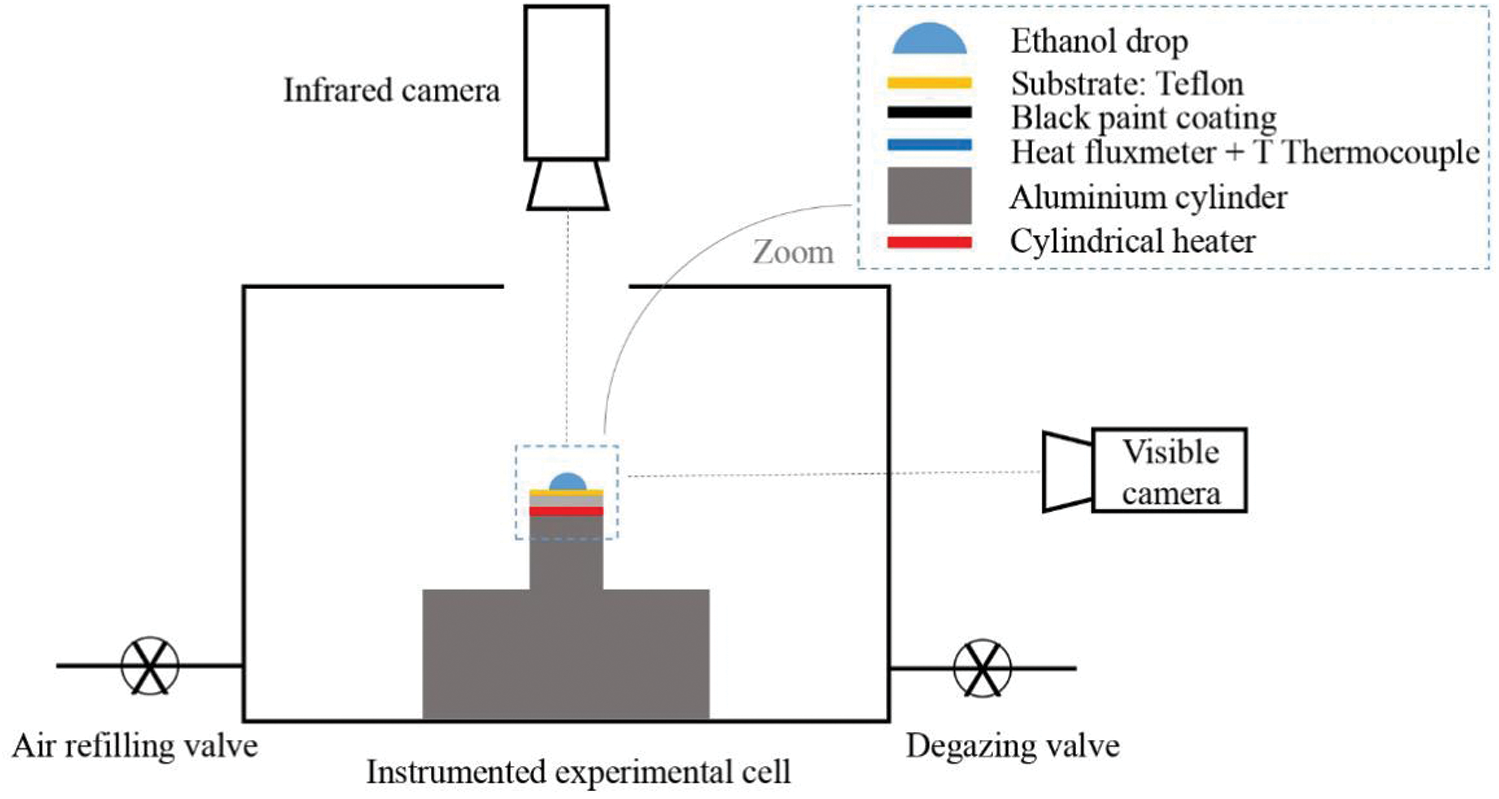
Figure 3: Schematic of the experimental setup using infrared camera. This setup is similar to that of Brutin et al. [10]
Christy et al. [22] have tried to explain the three different phases of water-ethanol evaporation in terms of the flow field. Particle image velocimetry (PIV) technique is used to observe the flow fields in the binary droplet 10 μm above the base of the drop. It was observed that the first stage has multiple dominant vortices. In the second stage, a distinguished spike in outward flow was observed, which was not previously identified. The outward flow was dominant in the third stage, which is similar to that found in pure water. They have concluded that the first phase is a chaotic regime occurring as a result of concentration difference due to the ethanol evaporation. The transition stage is explained by depletion of ethanol near the apex of the drop, causing instability in surface tension. In the third stage, the flow is radially outward and is directed towards the contact line to match the evaporative flux. This stage is commonly observed in the evaporation of pure water. Bennacer et al. [23] have conducted similar experiments on water-ethanol binary droplets using the PIV method, and the same observations were reported. It was also discovered that the vortices are caused by shear stress (induced by surface tension) emerging at the interface, and the flow dynamics and transition is determined by the viscous dissipation. They have compared the experimental data with the results of the analytical expression for vorticity decay that is based on viscous dissipation, and the agreement is good. It was also observed that for same-sized drops, irrespective of the initial concentration, the flow transition follows the same exact trend, which was not previously studied by Christy et al. [22]. A schematic of the PIV setup is shown in Fig. 4, where the base of the drop is under observation. A mirror setup is used to direct the laser and the camera to the base of the drop.
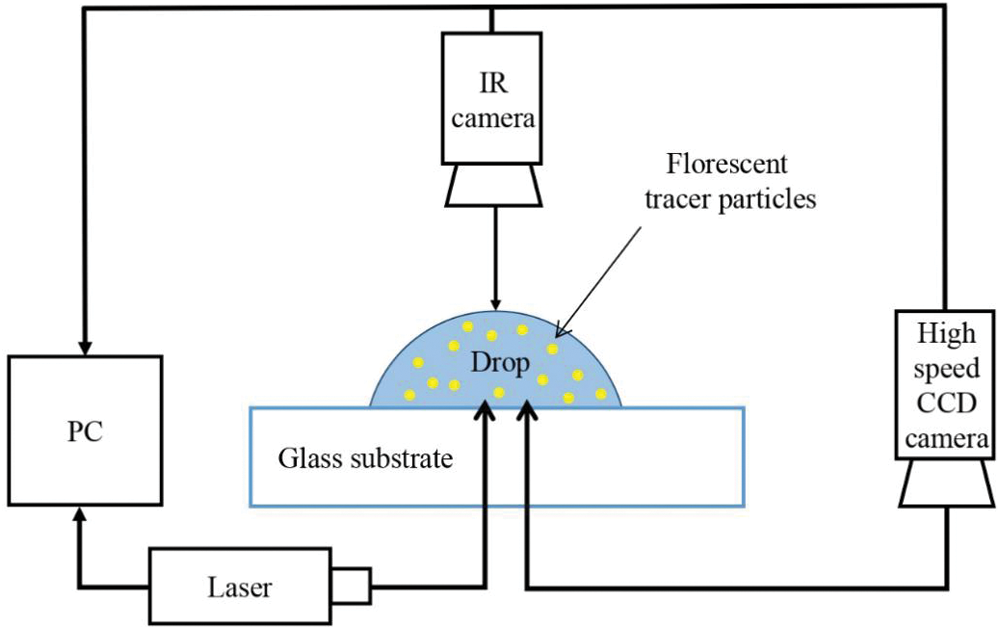
Figure 4: Schematic of a particle image velocimetry setup with an infrared camera mounted on the top. This figure is similar to the one presented by Bennacer et al. [23]
The optical and infrared methods give macroscopic information about the phenomenon at the liquid-gas interface (drop surface). In contrast, acoustics-based methods also enable tracking of exchange mechanisms at the local interface, i.e., the liquid-solid interface at the bottom of the drop. Chen et al. [25], for the first time, have used an IR and acoustic method to track the alcohol concentration in a binary sessile droplet at the surface and the interface. The evaporation of four binary droplet solutions (water +5% 1-butanol by weight and water +5%, 25%, and 50% by weight ethanol solutions) along with three pure liquids (water, ethanol, and 1-butanol) and were investigated on a hydrophobic silicon substrate. An acoustic high-frequency (ultrasound) echography technique was used, which gives high contrast in mechanical impedances between some alcohols like ethanol and 1-butanol. This difference in mechanical impedance enables to track the alcohol concentration at the liquid-substrate interface. The optical and IR measurements were taken first, and separate equipment is used for measuring the acoustic reflection coefficient. The experimental conditions remained the same in both devices. For optical and IR measurements, the substrates were placed in a vapor chamber, which can control the relative humidity and ambient temperature. Acoustic measurements were made under a controlled atmosphere under an air-conditioning system. An S/G (Signal/Ground) probe is placed on a piezoelectric transducer (50 μm in diameter) for electrical measurements. A probe system Cascade PM8 is used to control the S/G probe at a micro-scale, as shown in Fig. 5 (schematic reproduced). This probe is used to make electrical contact at the bottom side of the wafer over which the piezoelectric transducer was placed. The probes are connected to a Vector Network Analyzer (Rhode & Schwarz ZVA8), which captures the acoustic signals. A microfluidic device is used to deposit the droplet on the top side of the substrate. To check the alignment of the transducer and probe, a backside view camera is used. To check the correct position of the drop above the transducer surface, a top view camera is used. The side-view camera is used to measure the contact angle. This method, however, gives the concentration of the alcohol at the interface as some alcohol is still present in the bulk of the binary droplet.
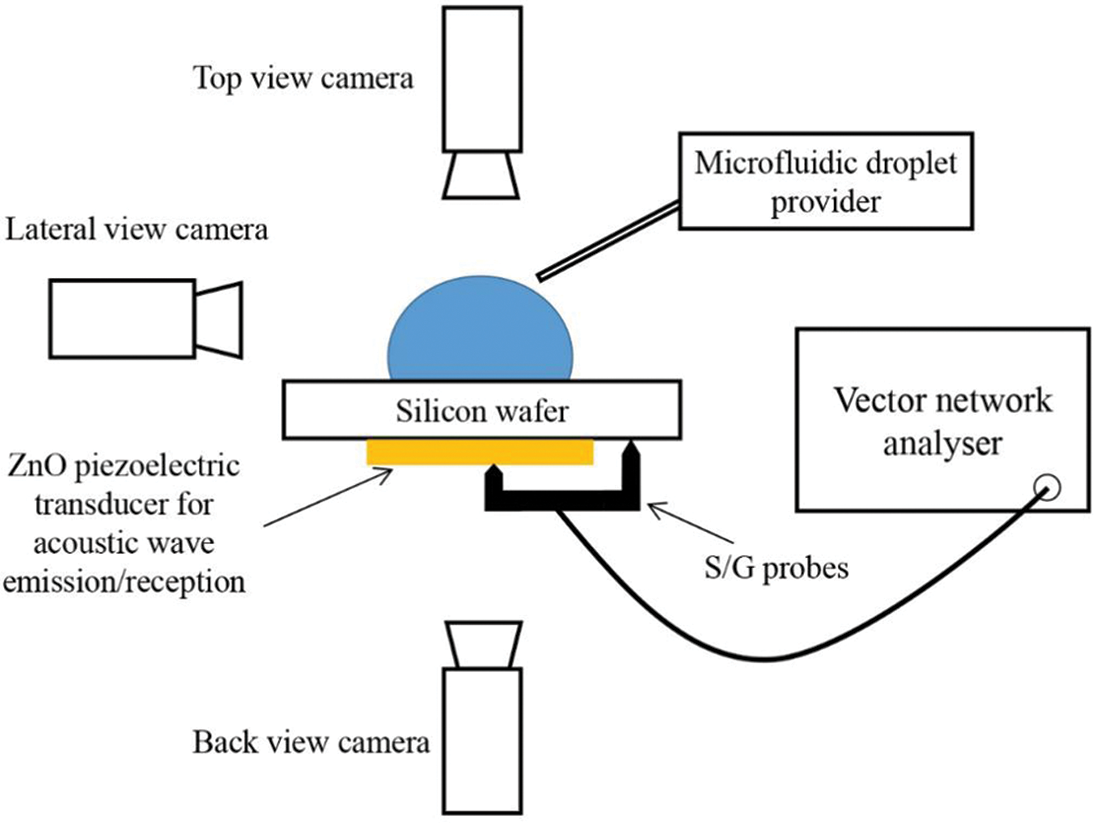
Figure 5: Schematic of an experimental setup similar to the one used by Chen et al. [25]
Edwards et al. [26] used a high-speed Fourier domain (FD) optical coherence tomography (OCT) to measure the flow profiles in an evaporating binary droplet. The OCT is a Michelson interferometer that allows non-contact 3D imaging of subsurface microstructures. FD-OCT enables the rapid acquisition of thin cross-sections with a more substantial 3D field of view than microscopy as it captures the depth profile in one measurement. This study explored the influence of gravity in the convective flow (characterized as Stage II flow, which is also mentioned in Christy et al. [22]). Gas chromatography (GC) was used to measure the ethanol concentration during evaporation. Eleven identical ethanol-water sessile droplets were placed in an enclosure with one droplet under continuous OCT monitoring. The other droplets were assumed to be evaporating similarly and are removed at regular intervals, transferred into vials, and sealed for GC analysis.
Recently, Ozturk et al. [28] have used the refractive index to track the change in ethanol concentration in the bulk binary (water-ethanol) droplet. This is the first attempt to date, to the best of our knowledge, to identify the bulk concentration in a binary droplet. The process consists of the following steps. The refractive index of the binary drop is known to vary as the droplet composition varies with time. Therefore, first, the refractive index of the binary mixture at certain known concentrations of alcohol (in this case, ethanol) is obtained. A series of experiments are then conducted to find the concentration of ethanol from the evaporating drop at a certain time. This is done as follows:
1. The droplet is allowed to evaporate for a known time and sucked into the syringe from the closed cell through a rubber septum, and the refractive index is determined rapidly by the refractometer.
2. A fresh drop of the same composition and volume is again placed and allowed to evaporate for a longer time, and the process is repeated to find the concentration of ethanol at various times throughout the evaporation.
For a 25% ethanol droplet by weight, the total evaporation process took about 80 min, but refractive index measurement could be made up to 48 min due to insufficient volume of the drop. For a 50% ethanol by weight, drop measurements were made up to 24 min. The measured refractive index at different times of binary drop is compared with the known values of refractive index (measured at the beginning) to obtain the bulk concentration of ethanol in the binary droplet. This experimentally obtained concentration of ethanol is used in their theoretical modeling, which is discussed in Section 3.5.
3 Theoretical/Empirical Models
To understand the physics of the evaporation dynamics, several researchers have worked and developed theoretical models related to droplet wetting, dimensions of the deposit pattern, and evaporation rate. In general, to understand the dynamics very clearly, the numerical models (which have their limitations discussed in Section 4) prove more effective. However, the theoretical models are extremely useful in engineering applications given their simplicity compared to numerical models. The earlier theoretical models (for example [40–42]) have analytically solved the Fick’s law equation and Laplace equation. Deegan et al. [42] have used the electrostatic analogy to solve these equations and proposed a theory that predicts the flow velocity, the rate of colloids deposit, and the distribution of these colloids in the drop. Hu et al. [40] have used diffusion analogy and FEM to propose a simple empirical expression for the droplet evaporation rate that depends on the contact angle of the drop. Popov [41] has used the electrostatic analogy to develop a model that accounts for finite spatial dimensions of the deposit pattern in an evaporating droplet with a colloidal solution. Sefiane et al. [18] have used Deegan et al. [42] expression for mass loss (ignoring suspended particles) to theoretically predict the droplet spreading rate (for pure and binary fluids) expressed as the local speed of triple line recession. In all these models [40–42], the droplet evaporation rate considers only the diffusion mechanism. These empirical models developed are used to date in many studies for theoretical estimations. Therefore, all the studies later developed their correlations based on these models and thus are mostly empirical in nature [43]. Carle et al. [44] provided experimental evidence for convection-driven fluxes, which become significant as the substrate temperature rises above the ambient conditions. They also proposed an empirical relation that is later extended to all fluids [45] and combines the diffusion and convection mechanism to calculate the evaporation rate. This model, however, does not model the time evolution behavior and the correlation provides mean evaporation over the entire droplet lifetime. Further, the convection due to concentration gradients is not accounted for in this model. It was only recently that Kelly-Zion et al. [46] had developed an empirical model that considers both the diffusive and the concentration driven natural convective mass fluxes. The correlations were developed for a wide range of hydrocarbons but for unheated substrates.
In this section, our aim is to discuss the recent developments in the analytical methods used to model the evaporation of sessile binary droplets and present the challenges further. As several models are already devoted to the evaporation of single component (pure) droplets at room temperature (ambient condition maintained at 20°C–25°C) [43], the recent analytical models considering a higher substrate temperature and binary component droplets are discussed. As mentioned earlier, these models are based on the correlations developed in the previous studies on pure droplets. Section 3.1 to Section 3.4 discuss the modeling of a water-ethanol binary droplet on heated substrate developed by Gurrala et al. [27], and Section 3.5 discusses a simple diffusion-driven model for binary droplet implemented by Ozturk et al. [28].
Assuming the shape of the droplet during the evaporation process is of a spherical cap, the experimental droplet volume is calculated as
where
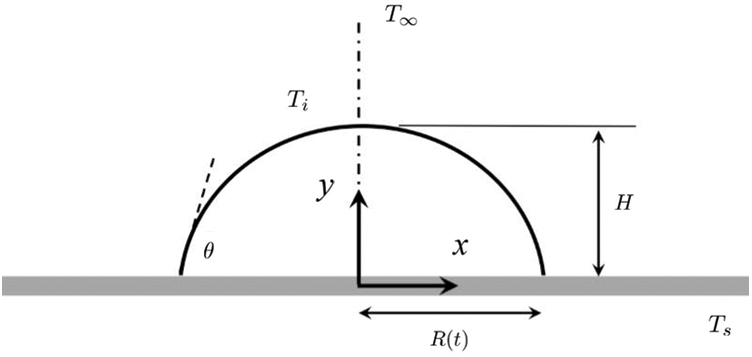
Figure 6: The schematic diagram for theoretical modeling. A droplet placed on a heated substrate maintained at temperature,
Throughout the evaporation process, the droplet is considered to be isothermal and at the same temperature as the substrate, i.e., Ti = Ts (see Fig. 6). In addition, the concentration of vapor at the liquid-vapor interface is assumed to be in saturated condition (say
The evaporation rate for a pure droplet modeled by considering only diffusion is given by Hu et al. [40]
where
The steady-state diffusion model, although satisfactory in predicting the evaporation of the water droplet, under-predicts the evaporation rate of the pure ethanol droplet at
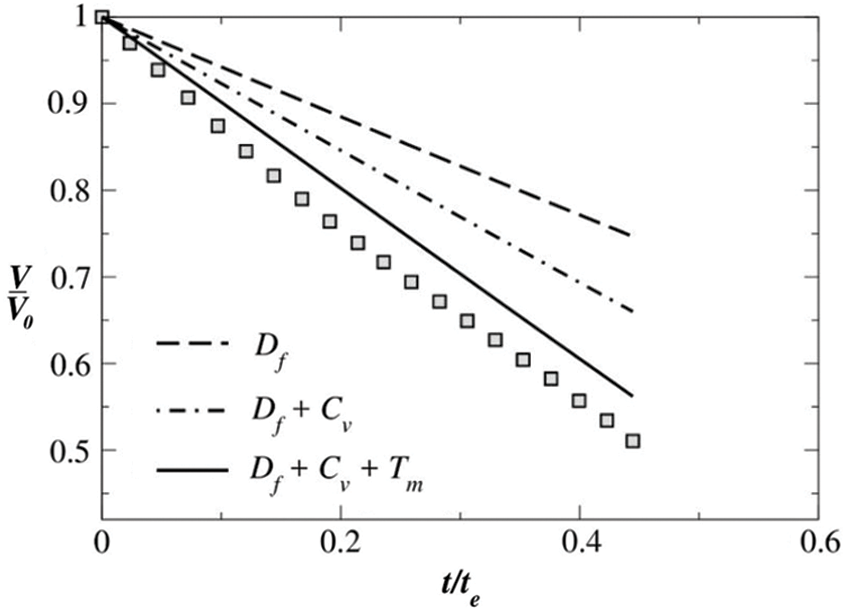
Figure 7: Comparison of the experimental and theoretically obtained normalised volume versus normalised time at substrate temperature
The evaporation mass transport rate due to the free convection can be expressed as
where
Neglecting the Stefan flow, the total mass transport rate is given by
where
However, practically the diffusion and convection phenomena occur simultaneously, and the combined mass transfer rate is calculated using the combined Sherwood number. The Sherwood numbers for the convective mass transfer and diffusion are defined as
Here,
where
Note: Eq. (8) can be used for the evaporation of both pure ethanol and pure water droplets at room temperature. For a more detailed explanation of this section, the authors refer to Gurrala et al. [27].
3.3 Passive Transport due to Free Convection of Air
In the case of a sessile droplet on a heated substrate, the temperature gradient results in free air convection. The associated transport mass flux
where
Here,
Considering the contributions from the diffusion, convection and passive transport, the mass evaporation rate of ethanol from the substrate at elevated temperatures is given by
From this expression,
Fig. 7 shows the relative contributions of all the three evaporation mechanisms for a pure ethanol droplet at
For binary droplets, the volatility and the component mole-fractions in the evaporating vapor varies with the concentration of liquid water and liquid ethanol and is governed by the vapor-liquid equilibrium (VLE) of the binary mixtures. Figs. 8a and 8b present the typical VLE diagrams of the water-ethanol binary mixture at
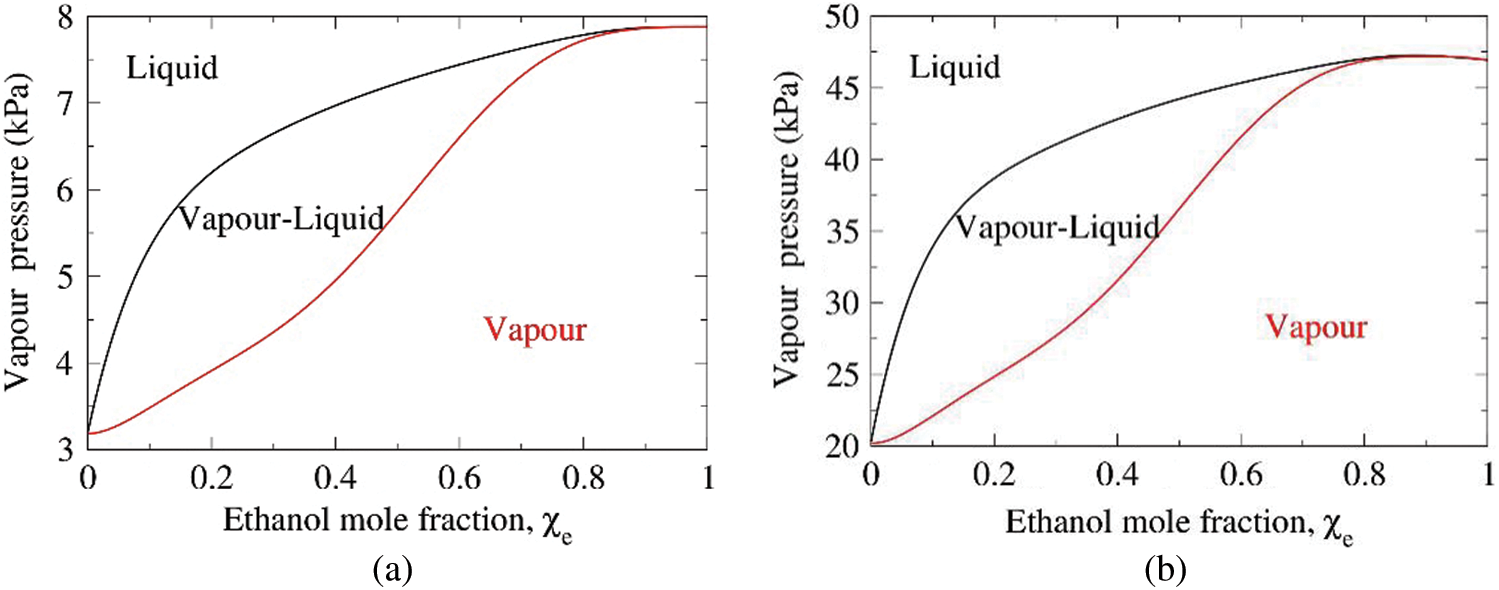
Figure 8: The vapor-liquid pressure curves for the binary mixture at (a)
The mass of the droplet,
where
, respectively.
The mole fractions of water,
Being a non-ideal solution, the ethanol-water mixture requires an estimation of the excess molar volume of mixing
Using Eqs. (12) and (15), the volume of the droplet of the ethanol-water mixture at any instant is given as
Figs. 9a and 9b show the comparison between the experimentally obtained and theoretically calculated binary droplet volume against normalized time for an ethanol 50% + water 50% droplet at substrate temperatures of 25°C and 50°C, respectively. It is evident that the VLE based volume calculation for a binary droplet shows very good agreement with the experimental data. The relative error is below 10% in both cases. The error between the theoretical and experimental is primarily due to the several assumptions stated and the semi-empirical method used. It is to be noted that the binary model developed above is applied to water-ethanol due to the wide use of this combination in the literature and is yet to be tested with different liquids.
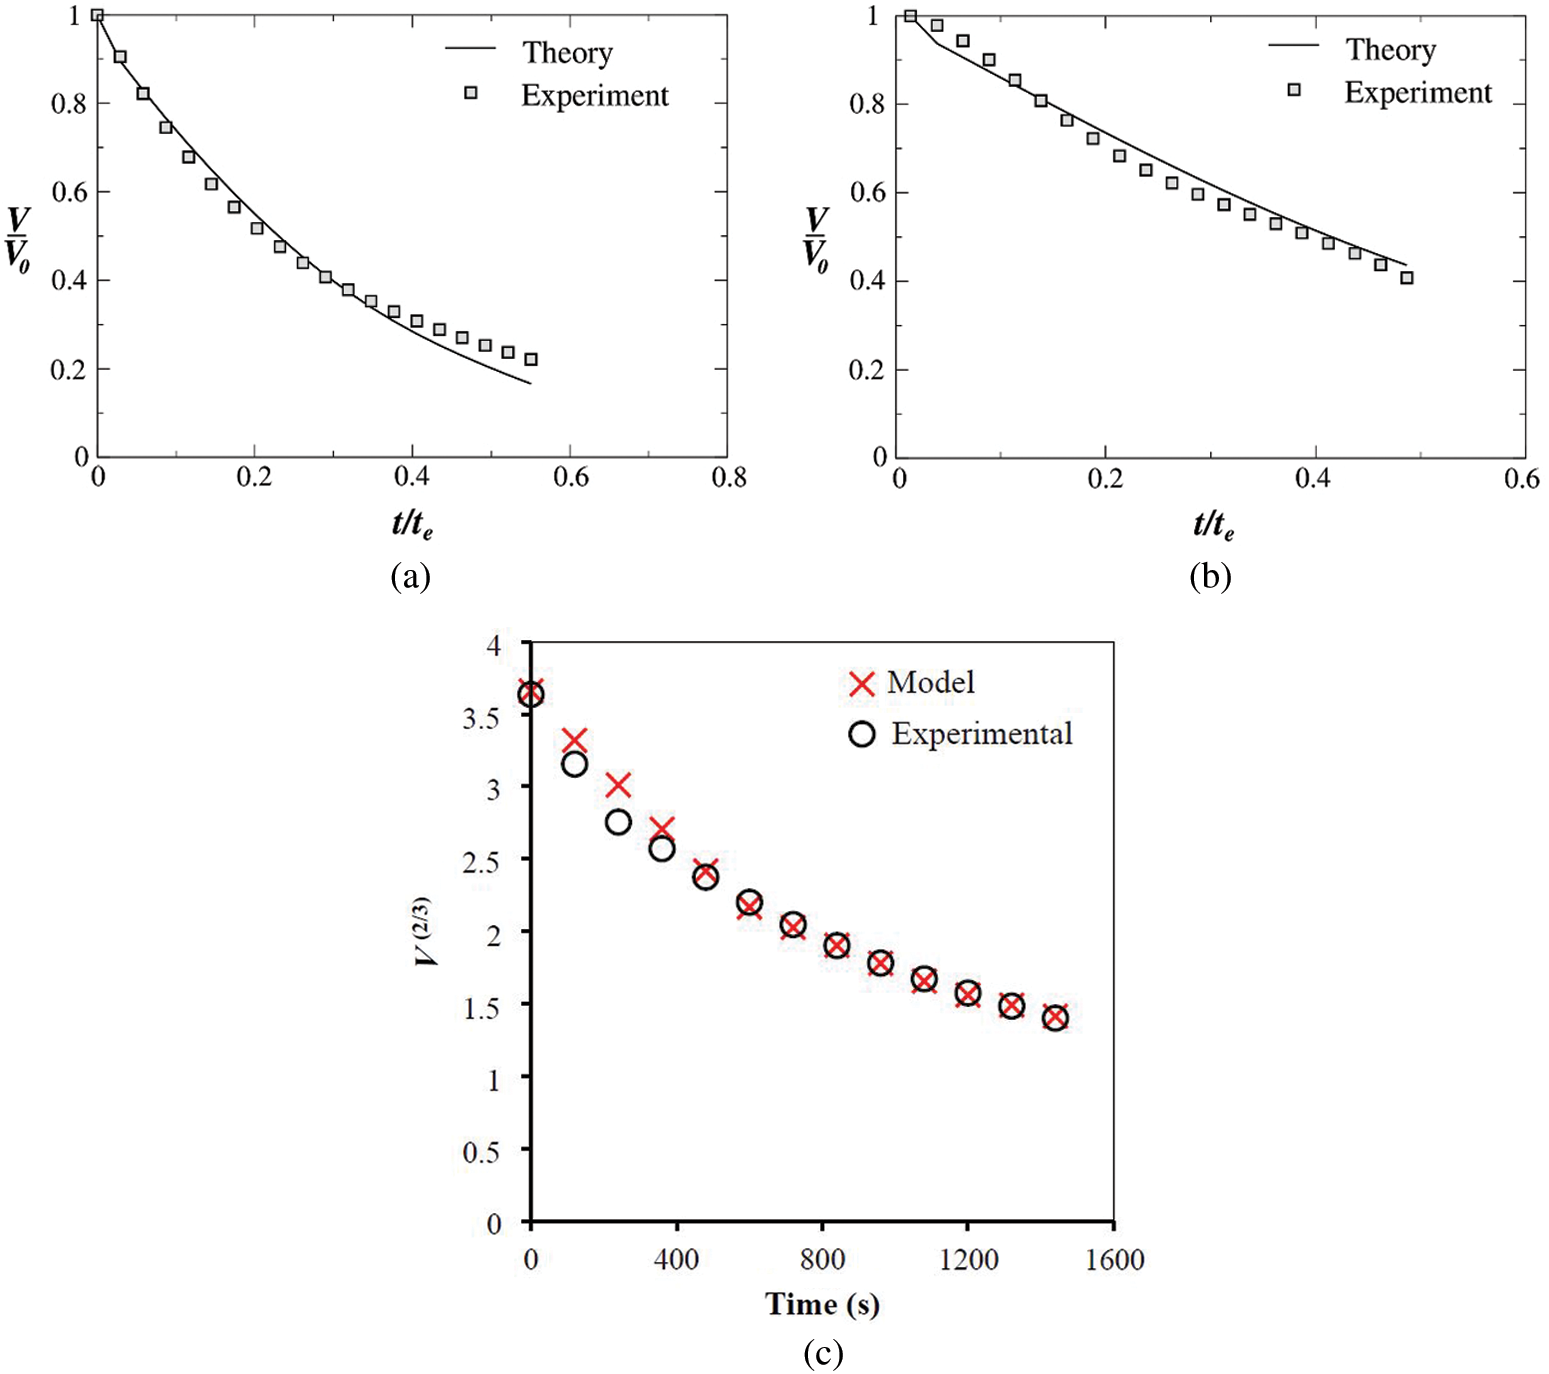
Figure 9: Comparison of the evolutions of the normalized volume a binary droplet of ethanol 50% + water 50%
3.5 Simple Diffusion Limited Evaporation Model for Binary Ethanol-Water Drops [28]
As mentioned earlier, Ozturk et al. [28] have reported a novel diffusion-limited model for binary drops by experimental evaluation. The ethanol concentration is measured in the bulk of a binary droplet of volume 7
The volume of the binary droplet
where
where
The theoretical models presented above and also in all related studies, to the best of our knowledge are mostly backed by experimental evidence. In the case of pure fluids, the limitations exist with certain assumptions, such as the contact angle and uniform surface temperature. For example, in calculating the rate of evaporation (Eq. 2), the function
where,
wherein
It was also evident that at room temperature, the diffusion-driven mechanism dominates, and therefore the simple diffusion model predicts the mass transfer accurately for both pure and binary liquids (as observed from Figs. 7 and 9c, respectively). As the substrate temperature increases, the pure diffusive model underpredicts the evaporation rate; the error between the experimental evaporation rate and diffusion model deviates according to a power law. An error of up to 70% was reported by Brutin [43] when the difference between substrate and ambient temperature is 35°C. The convective flow comes into play as the substrate temperature deviates from ambient conditions and therefore has to be considered. In cases where the droplet liquid vapor is heavier than that of air, passive mass transport becomes important. The Stefan flow gives a better prediction of evaporation rate at higher substrate temperatures (for example, in the Spalding model compared by Brutin [43]) but still underpredicts the global evaporation rate when combined with a pure diffusion model.
From a physical perspective, an evaporating multi-component droplet in a host gas (example: Air or any controlled medium) involves combined multiphase and multi-component flow, including a phase transition, and therefore can be modeled in several ways. A complete description of this process should necessarily draw from various fields of fluid mechanics, thermodynamics, as well as some concepts in the field of chemistry.
The process of droplet evaporation is a complex phenomenon of diffusion, heat conduction, and Marangoni convection, and the underlying physics which controls these phenomena has been the topic of many recent reviews. For example, Hu et al. [40] have considered diffusion-driven evaporation and used a finite-element method (FEM). An empirical expression for the evaporation rate is derived, a mathematical model to study the internal flow is also developed coupling the effects of Marangoni convection. Semenov et al. [55] considered a quasi-steady-state approach to simulate the evaporation process; the changing spherical-cap profile (as the droplet volume reduces) is used to convert the moving boundary problem to a series of fixed boundary problems. Karapetsas et al. [56] have studied the contact-line dynamics of a drop on an inclined plate subjected to a thermal gradient. A two-dimensional finite element method using lubrication theory is implemented to study the effect of gravity, capillarity, and thermocapillarity. While the previous methods were constrained to a fixed contact angle, a relation between the contact line speed and the difference between dynamics and equilibrium contact angle was established in this study, which was then used to model the contact line motion. In numerical simulations, a free-moving surface is difficult to track; therefore Yang et al. [57] used an Arbitrary Lagrangian-Eulerian (ALE) method to develop a mathematical model. Contrary to the earlier studies using the level-set method [58] or the volume-of-fluid method [59], the ALE method allows precise tracking of the interfaces of a multi-material system. Another work by Karapetsas et al. [60] features the effect of thermocapillary-driven motion on droplets of ordinary and self-rewetting fluids [61,62]. The lubrication theory was used to model a non-uniformly heated substrate, and an evolution equation was derived for an interface that takes into account the capillarity and thermocapillarity. The Cox-Voinov relation was used that relates the equilibrium contact angle and substrate wettability, which is dependent on the local temperature. The effect of non-interacting particles and insoluble surfactants on the evaporation flux was also studied using a finite-element based lubrication model [63]. This model considers the reduction in the effective area on the liquid-air interface due to the presence of particles, which may inhibit the evaporation rate.
Recently, Chen et al. [64] have investigated a droplet evaporation process on a heated substrate under microgravity conditions using a 2D axisymmetric numerical model in the ALE method. Wang et al. studied the effect of Marangoni convection on the evaporation rate by simulating an ethanol droplet on a heated substrate using the Volume of Fluid (VOF) and Continuum Surface Force (CSF) model [65]. It was observed that the Marangoni convection has a significant impact on the evaporation rate. Sáenz et al. [39] performed a three-dimensional direct numerical simulation (DNS) using a novel fully coupled two-phase diffuse-interface (DI) method. Both experimental and numerical work is carried out in this study. Fig. 10 shows the 3D view of streamlines colored by temperature. Fig. 10a shows that the flow is driven along the interface from the contact line to the apex and then recirculated back towards the contact line through the drop core (see Fig. 10a). The dotted lines indicate the direction of the azimuthal velocity as a result of the temperature gradient. In Fig. 10b, it can be observed that the streamlines along the interface are bent towards the longest axis. It can be seen in Figs. 10c and 10d that the flow into the second vortex generated along the XZ plane (longest axis of the ellipse), and the origin of the flow coincides with the center of the vortex along the YZ plane (shortest axis of the ellipse), respectively. Later they have done experimental and numerical work to develop a universal scaling law for evaporation rate [66]. The numerical work is, however, limited to pure drops. Only the gas phase was considered for modeling the evaporation kinetics for pure drops on the non-heated substrate. Fig. 11a shows the two-dimensional schematic domain; the actual simulation is, however, three dimensional. Here,
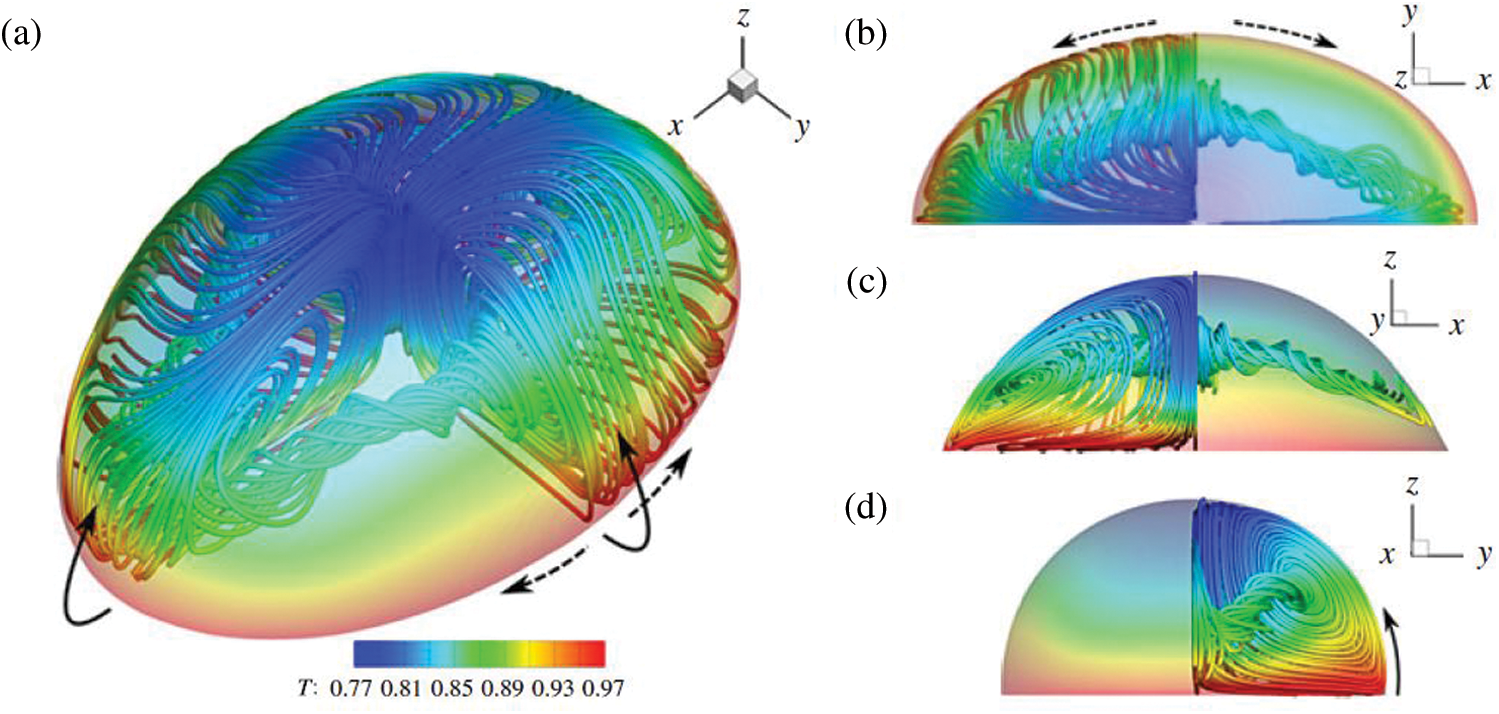
Figure 10: The streamlines and the temperature field in a water droplet in nitrogen gas. (a) 3D view, (b,c,d) top, front, and side views, respectively. Reproduced with permission from Sáenz et al. [39]
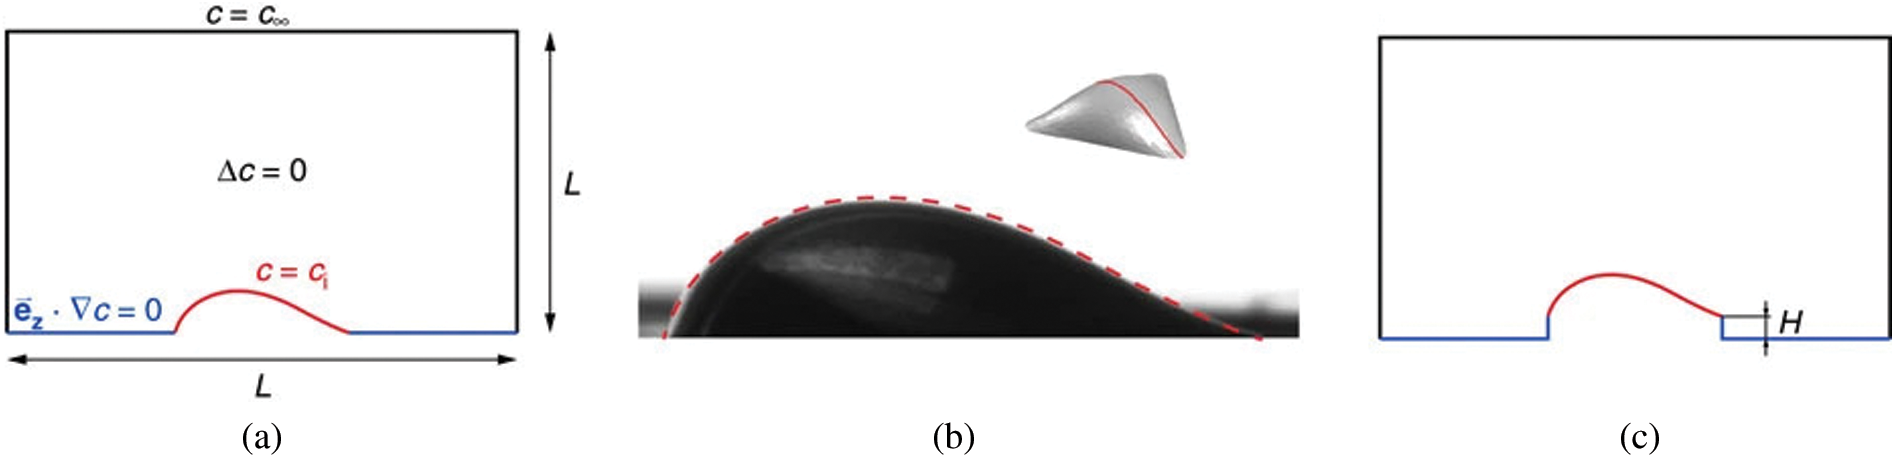
Figure 11: (a) Two-dimensional representation of the domain. (b) Comparison of the drop shape obtained experimentally and the geometry calculated with Surface Evolver (in dotted line). (c) Problem investigating the effect of the pedestal height. Reproduced with permission from Sáenz et al. [66]
In the case of multi-component droplets, solutal Marangoni flow exists, which is stronger than the thermal Marangoni effect. The difference in the volatilities of the individual constituents leads to preferential evaporation of one or the other component, and thereby compositional gradients are induced. Since the surface tension varies with composition, a surface tension gradient across the liquid-gas interface can build up and result in a similar Marangoni circulation as in the thermally-driven case. The nature of the resulting flow can be quite different, mostly depending on whether the evaporation process leads to an overall decrease or increase in the surface tension, i.e., whether the more volatile component has a higher or lower surface tension than the less volatile component. In a binary droplet consisting, e.g., of water and glycerol, with water being more volatile and having the higher surface tension, the overall surface tension decreases during the preferential evaporation of water, and the resulting Marangoni flow is usually regular, axisymmetric, and directed towards the position of the lowest evaporation rate of water, i.e., towards the contact line for contact angles above 90° and towards the apex for contact angles below 90° [7,33]. In contrast, e.g., in the case of a binary droplet consisting of water and ethanol, where the overall surface tension increases due to the predominant evaporation of ethanol, the typical Marangoni effect is way more violent and chaotic [22,23]. Here, in particular, the axial symmetry of the droplet is usually broken, leading to a complicated scenario of initially chaotic flow driven by the solutal Marangoni effect and followed by either thermal Marangoni flow or the typical coffee-stain flow, when almost only water is left [29]. Remarkably, the presence of a strong Marangoni effect can also have a significant influence on the shape and wetting behavior of droplets [67,30]. Finally, the evaporation of mixture droplets can show a variety of additional intriguing phenomena, e.g., multiple phase changes and microdroplet nucleation in ternary droplets like ouzo [68,69], and phase segregation in binary droplets [31] or rather homogeneous deposition patterns by an interplay of Marangoni flow, surfactants and polymers [70].
Apart from surface tension gradients, i.e., in the interfacial forces, gradients in the mass density, i.e., in the bulk force due to gravity, also can influence the flow by natural convection. Mass density is a function of temperature (like surface tension) and, the in case of multi-component drops, of the composition. So it is possible to capture the thermal and solutal driven natural convection in evaporating droplets. However, most of the studies on droplet evaporation have not considered the natural convection attributing to the fact that natural convection occurs in large spatial dimensions and the small droplet, associated with the small Bond number is dominated by surface tension effect over gravity. Recent studies by Edwards et al. [26] and Li et al. [32], however, showed that under certain conditions, natural convection affects the internal flow and not Marangoni flow. Edwards et al. [26] have found this even at the later stages of water-ethanol droplets, which initially show a very intense chaotic Marangoni flow. Diddens et al. [15] have tried to study this effect in an evaporating binary droplet. A simplified quasi-stationary model based on justified assumptions is developed that only requires three parameters, viz. the contact angle, the Rayleigh, and the Marangoni number. Fig. 12 shows a schematic of the model implemented. Five different flow patterns were observed; however, limitations exist in this model. The influence of thermal effects must be negligible as compared to solutal ones. Both the liquids must be miscible, and droplets should not be too large so that the capillary and Bond numbers are small to make sure the spherical cap shape is consistent throughout the evaporation process. The spatial variation in the composition should be small and also the Reynolds number. The Marangoni number has to be positive, which means that the evaporation leads to a decrease in the surface tension. Lastly, the influence of local composition change should not be too strong on the vapor-liquid equilibrium.
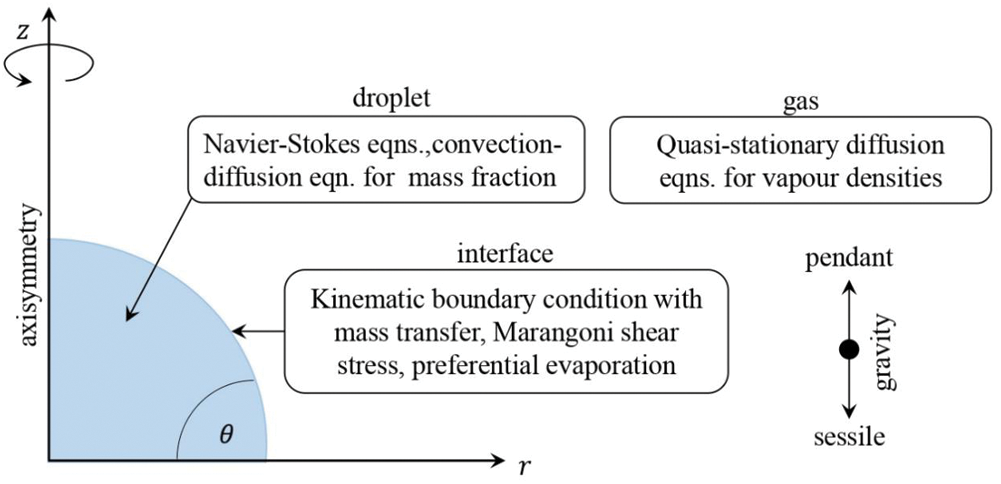
Figure 12: Schematic of the numerical model considered by Diddens et al. [15]. For the composition in the droplet, the flow and the advection-diffusion equation are solved by considering the effect of gravity and the composition-dependence of the liquid mass density, diffusivity, and dynamic viscosity. For the gas phase, a diffusion-limited transport equation is used. At the interface, Raoult’s law is used to impose the vapor-liquid equilibrium, mass transfer due to evaporation, and the Marangoni shear stress due to composition-dependent surface tension are considered
Over the last few years, studies show that the relative humidity of moist air also has a significant effect on droplet evaporation [71–74]. Fujita et al. [71] and Fukatani et al. [72] experimentally studied the impact of relative humidity on heat transfer during evaporation of sessile droplets, and Girard et al. and Wu et al. [73,74] carried numerical simulations. In many numerical or theoretical studies of droplet evaporation, a vapor concentration diffusion model is used to simulate moist air neglecting the effect of moist air convection on the evaporation of droplets [57,74–76]. Due to this, the droplet’s evaporation rates are underestimated [77–79]. Zhang et al. [80] studied the impact of non-condensable gas on condensation heat transfer. They have implemented a multi-component/multiphase (MCMP) lattice Boltzmann method (LBM). A small amount of non-condensable gas is simulated for thermal and flow behaviors of moisture and gas separately, taking moist air natural convection into consideration. Guo et al. [81] attempted to extend the MCMP LBM used by Zhang et al. [80] to simulate moist air in which vapor partial pressure is small and partial air pressure is large. A schematic of the computational domain of 200
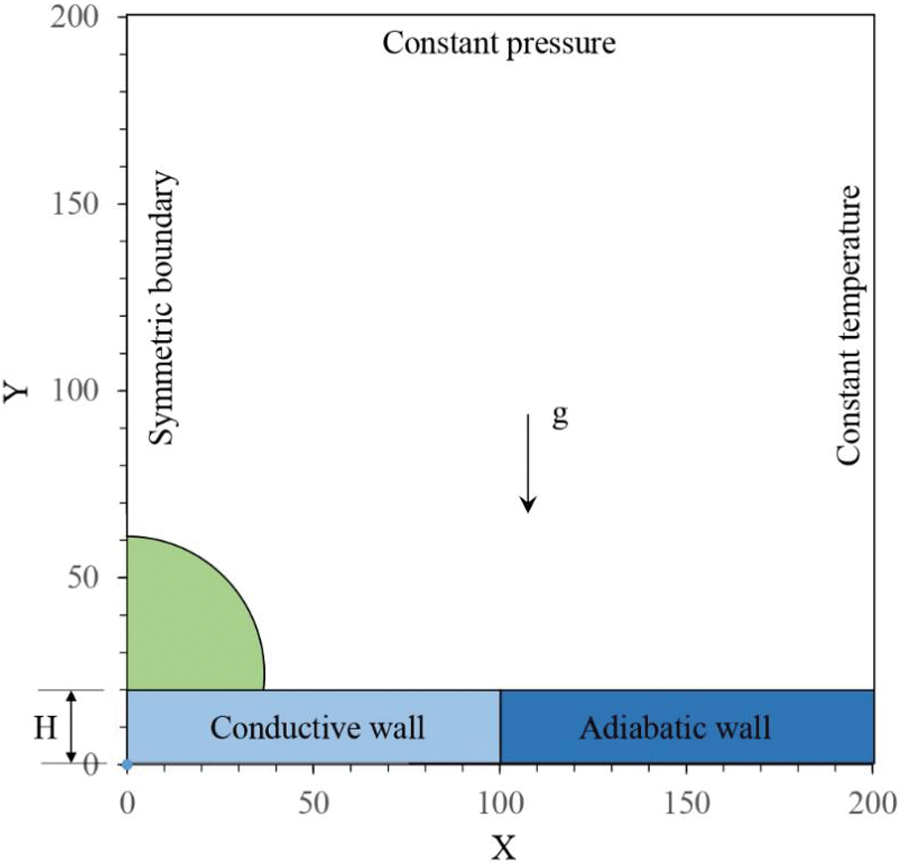
Figure 13: An axisymmetric computational domain a sessile droplet in moist air [81]
The numerical models developed in the recent years discussed above present a great challenge and potential in modeling the complexity underlying multi-component droplet evaporation. The discussion in this section indicates that a variety of numerical studies on sessile droplets are available in the literature, including several review articles on pure droplets. Thus, our objective here is to summarize the numerical work on pure droplets and those particularly on binary fluids and give a perspective of the complex high computational requirements involved as more and more considerations come into the picture.
5 Influence of Surface and Fluid Properties
In this section, we focus on the multi-component (binary) droplet evaporation and how the various factors that influence the capillary and Marangoni effects compete and combine to drive the evaporating fluid along different evolutionary trajectories through its lifetime. As mentioned earlier, the wetting behavior of the fluid, substrate system, and other external factors (refer to Fig. 1) like temperature, roughness, humidity, etc., all affect the end result. The fluid components of the mixture may have similar or different properties of surface tension, volatility, viscosity, boiling point, thermal diffusivity, and diffusion coefficient. Therefore, they interact differently with the substrate properties like surface energies, roughness, wetting and spreading coefficients, and hydrophobicity or hydrophilicity, resulting in complex droplet evaporation dynamics. This section, therefore, includes the discussion on the evaporation dynamics, the flow and concentration field, the thermal waves, and the deposition pattern of sessile droplets composed of various mixtures of miscible fluids. It is crucial to individually isolate the effect of each of these parameters on the evaporation dynamics and the mass transfer rates and hence on end result in order to successfully harness this knowledge for practical applications.
The pinning/depinning of the Triple-Phase Contact Lines (TPCL) and contact angle in an evaporating droplet have a significant role to play in the mass transfer and the droplet internal flow. Picknett and Bexon, in 1977, have distinguished two modes of evaporation based on the behavior of the TPCL and the contact angle.
i) Constant Contact Radius (CCR) mode where the contact radius and thus contact area remains constant throughout the evaporation process and
ii) Constant Contact Angle (CCA) mode, where the contact angle remains constant throughout the evaporation process while the radius of the drop decreases with time [82].
The observations were made on an evaporating methyl acetoacetate drop placed on a Teflon (polytetrafluoroethylene) substrate. It was also observed that a transition from one mode to another during the evaporation changes the liquid drop shape. The TPCL moves in steps, maintaining CCR mode (pinned phase) for a short time, and quickly moves into a new position. A Stick-slip (SS) mode [83,84] of the TPCL is observed towards the last stage of evaporation, which is also the dominant mechanism.
Birdi et al. [85] have observed that for a liquid making a contact angle
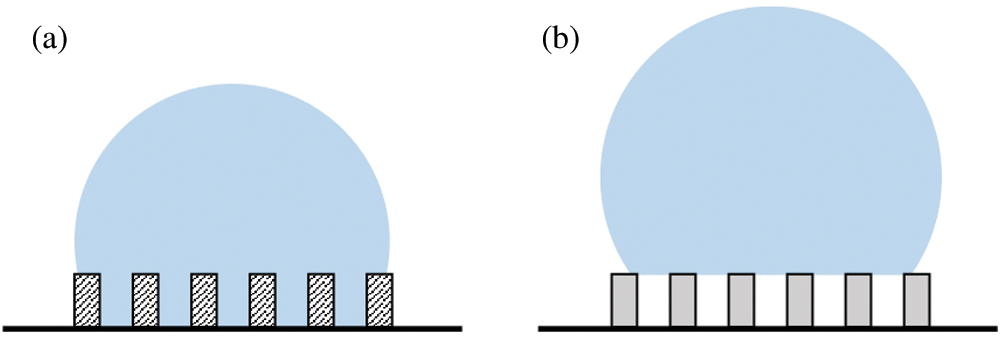
Figure 14: Schematic representation of (a) the Wenzel state and (b) the Cassie-Baxter state encountered by a sessile droplet on a rough surface
With the addition of another component in the fluid, as in the case of binary droplets, the prediction of these modes gets more complicated. Gurrala et al. [27] have experimentally observed the wetting dynamics of an ethanol-water (E 50% + W 50%) droplet on a cellulose acetate surface (roughness = 668 nm) at different temperatures. It was observed that at the substrate temperature of 25°C the binary droplet shows both CCR and CCA mode while pure droplets have exhibited a CCR mode for 80% of the droplet lifetime. Fig. 15 shows the contour of the droplet over its normalized evaporation time
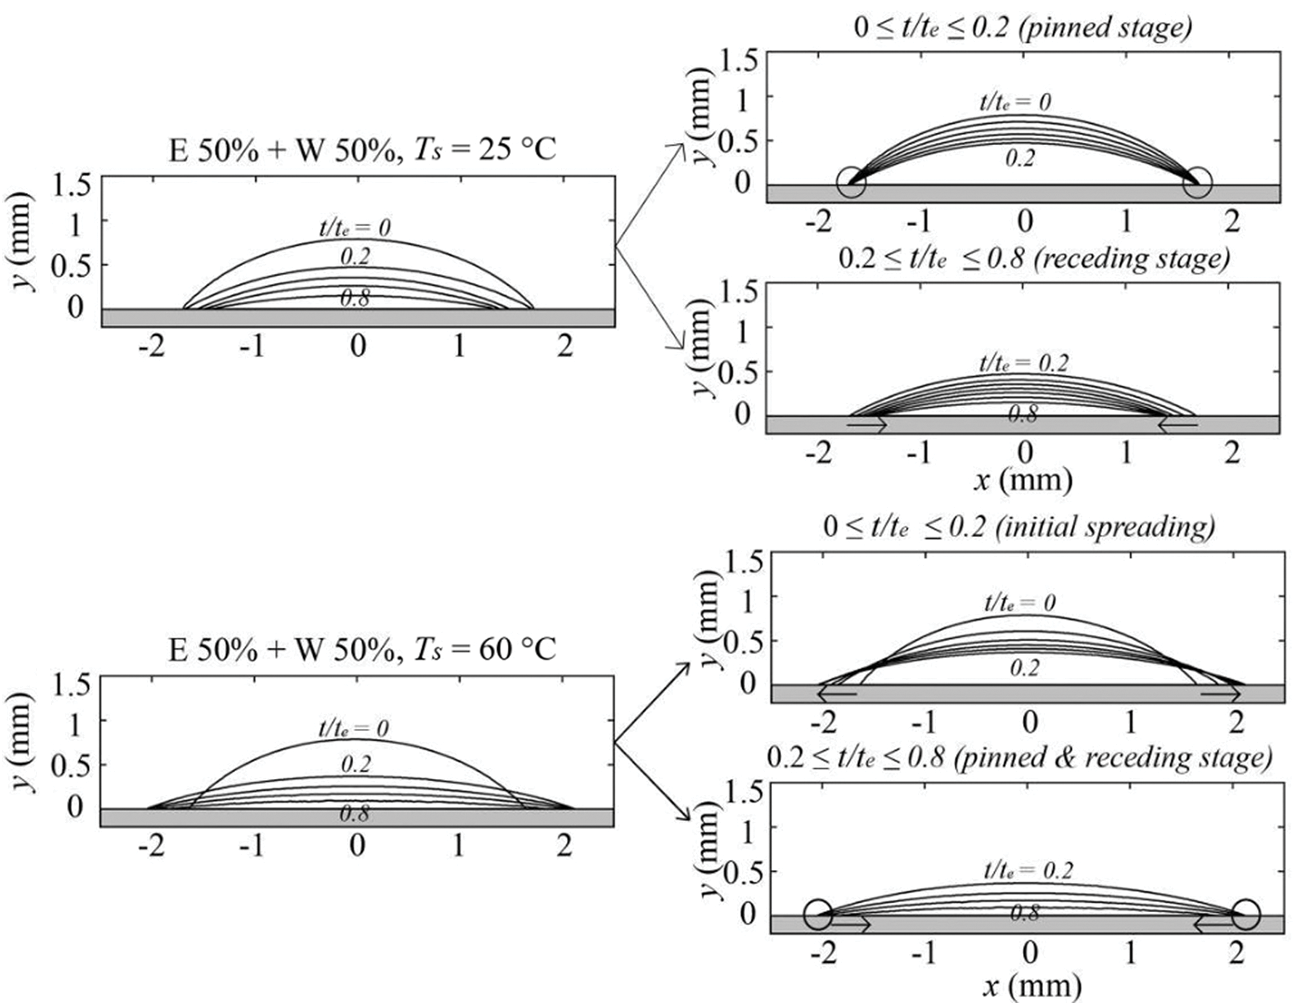
Figure 15: Wetting modes of 50% ethanol-water binary droplet at two different substrate temperatures (25°C & 60°C). Reproduced with permission from Gurrala et al. [27]
He et al. [93] reported the effect of micro-patterned surfaces on the wetting dynamics of water-ethanol droplets. Experiments were carried out with varying ethanol concentrations on a squared-pillared Teflon substrate (50
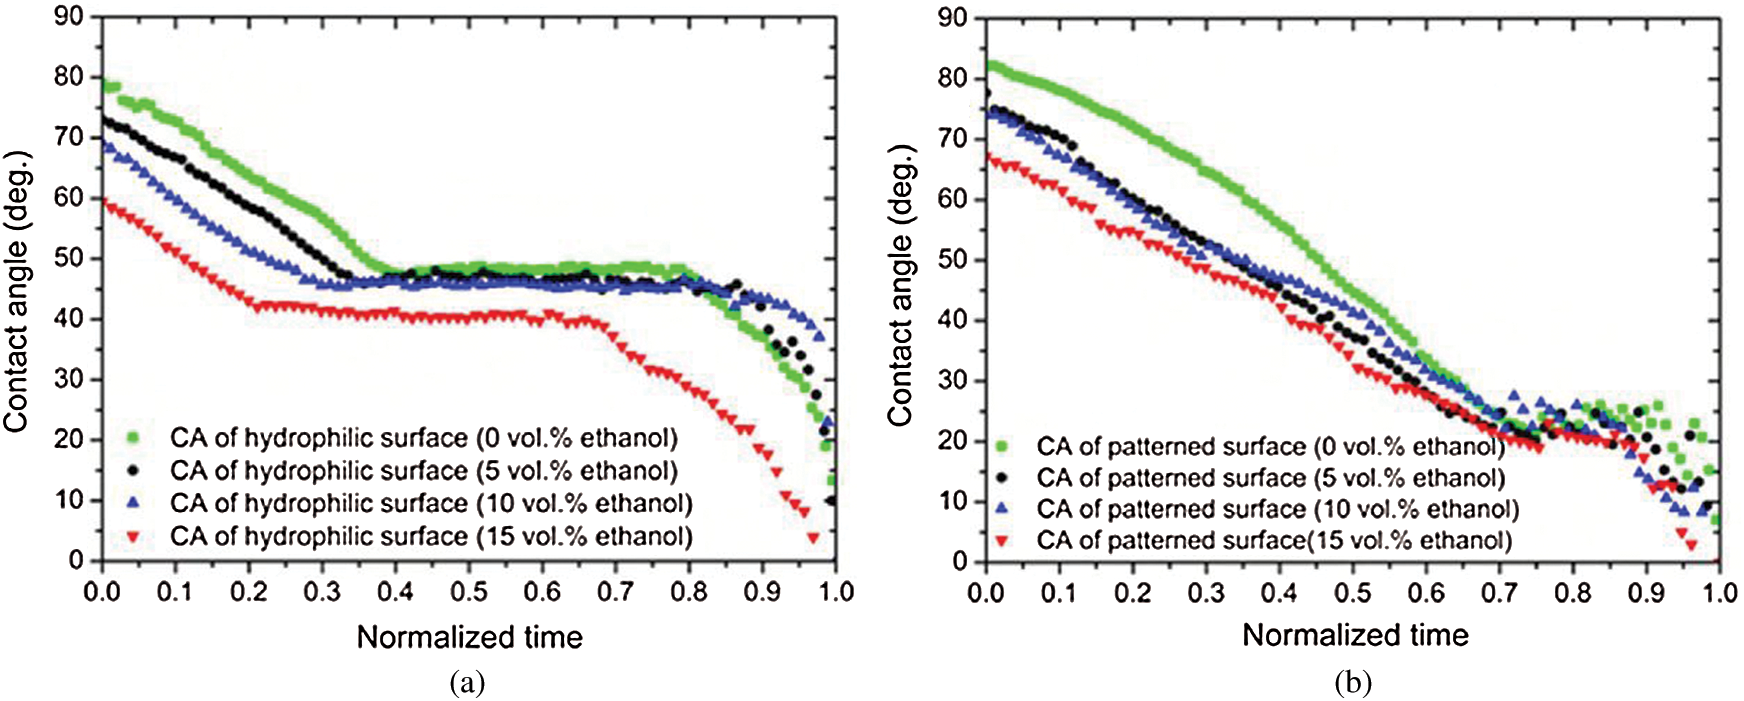
Figure 16: Variation of contact angle with normalized time for a water-ethanol droplet of varying concentration on (a) normal substrate (b) patterned substrate [93]
It is evident that the binary components have a definite impact on the wettability, and with elevated substrate temperatures, the dynamics get even interesting. Added to this, Katre et al. [14] have investigated the dynamics of the ethanol-water binary droplet at different temperatures on an inclined plate. It was found that as the substrate temperature increases, the critical angle of inclination, i.e., the angle of the substrate at which the drop tends to slide, increases. Fig. 17 shows the droplet contour evolution for different substrate temperatures. It can be observed from (a) and (b) that the advancing side of the droplet is pinned at low substrate temperatures but very slowly tends to migrate at higher temperatures, as shown in (c) and (d). Hence the substrate inclination and temperature are vital in the contact line dynamics.
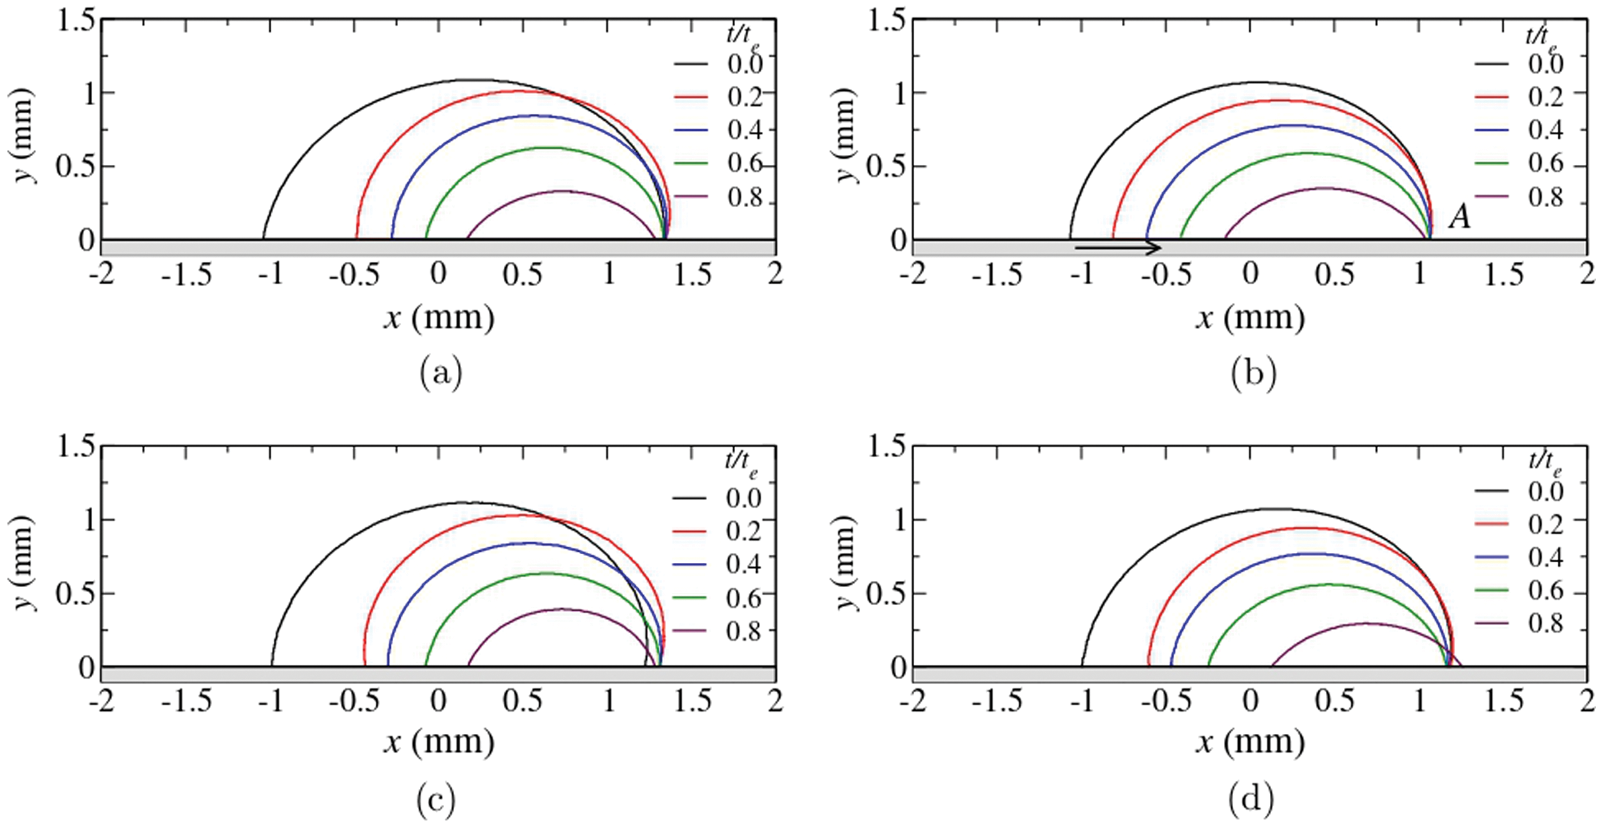
Figure 17: Droplet contour evolution at substrate temperatures (
5.2 Convection & Thermal Patterns
Droplets formed by water-rich binary mixtures such as alcohol and water have been extensively studied in the last decade [17,18,20]. The experimental observations of velocity fields (spatial and temporal) in droplets of pure water and ethanol-water binary mixture evaporating on a glass substrate were compared and reported by Hamamoto et al. [95]. The velocity field in the drop was correlated with the mapped surface temperature of the drop and variation in the drop profile. The preferential evaporation of ethanol from the ethanol-water mixture led to concentration gradients and the formation of multiple vortices, which could not be explained by considering only capillary convection. Complete depletion of ethanol from the apex of the droplet is observed, followed by an exponential decline in vorticity. Due to this, the apex and the contact line of the droplet had different concentrations of ethanol, which resulted in the development of a large toroidal vortex. The last stage of evaporation showed radially outward flow to the contact line. The flow measurements and evaporative flux of the third stage matched with that of pure water, implying complete evaporation of ethanol at this stage. Solutal Marangoni driven vortices due to concentration variation as a result of ethanol evaporation were also reported by Christy et al. [22] and Bennacer et al. [23].
Fig. 18 shows an OCT cross-section image (time-averaged) of sessile and pendant drops of ethanol-water and water-n-butanol composition [26]. The figure shows the effect of gravity in Stage II (convection) flow as mentioned earlier; as the droplet is inverted (a to b for ethanol-water & c to d for water-n-butanol), the flow direction is reversed, indicating a strong effect of gravity on the flow. In the case of the ethanol-water droplet, as the ethanol evaporates at the interface, a water-rich layer is formed around the droplet, which is denser than the bulk region. This layer, due to gravity force, falls, and therefore the flow is from the apex towards the contact line. In water-n-butanol, the flow is opposite due to evaporation of water first creating a low-density region at the interface than in bulk. This causes the flow to go from the contact line to the apex. Similar behavior is also observed in the numerical work of Diddens et al. [15]. Fig. 19 shows the flow pattern (streamlines) of a 1
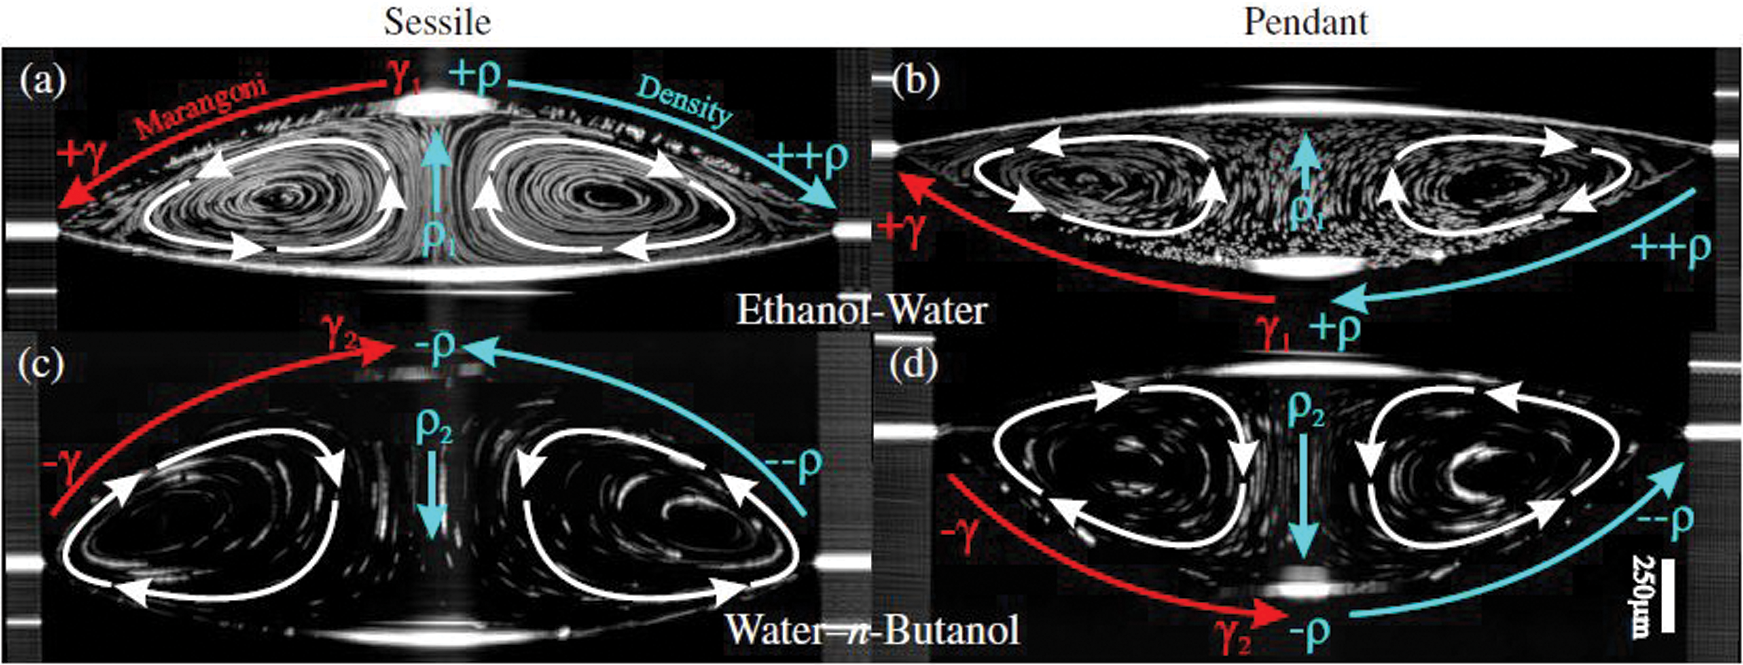
Figure 18: Time-averaged OCT cross-section images of sessile (left) and pendant (right) 2
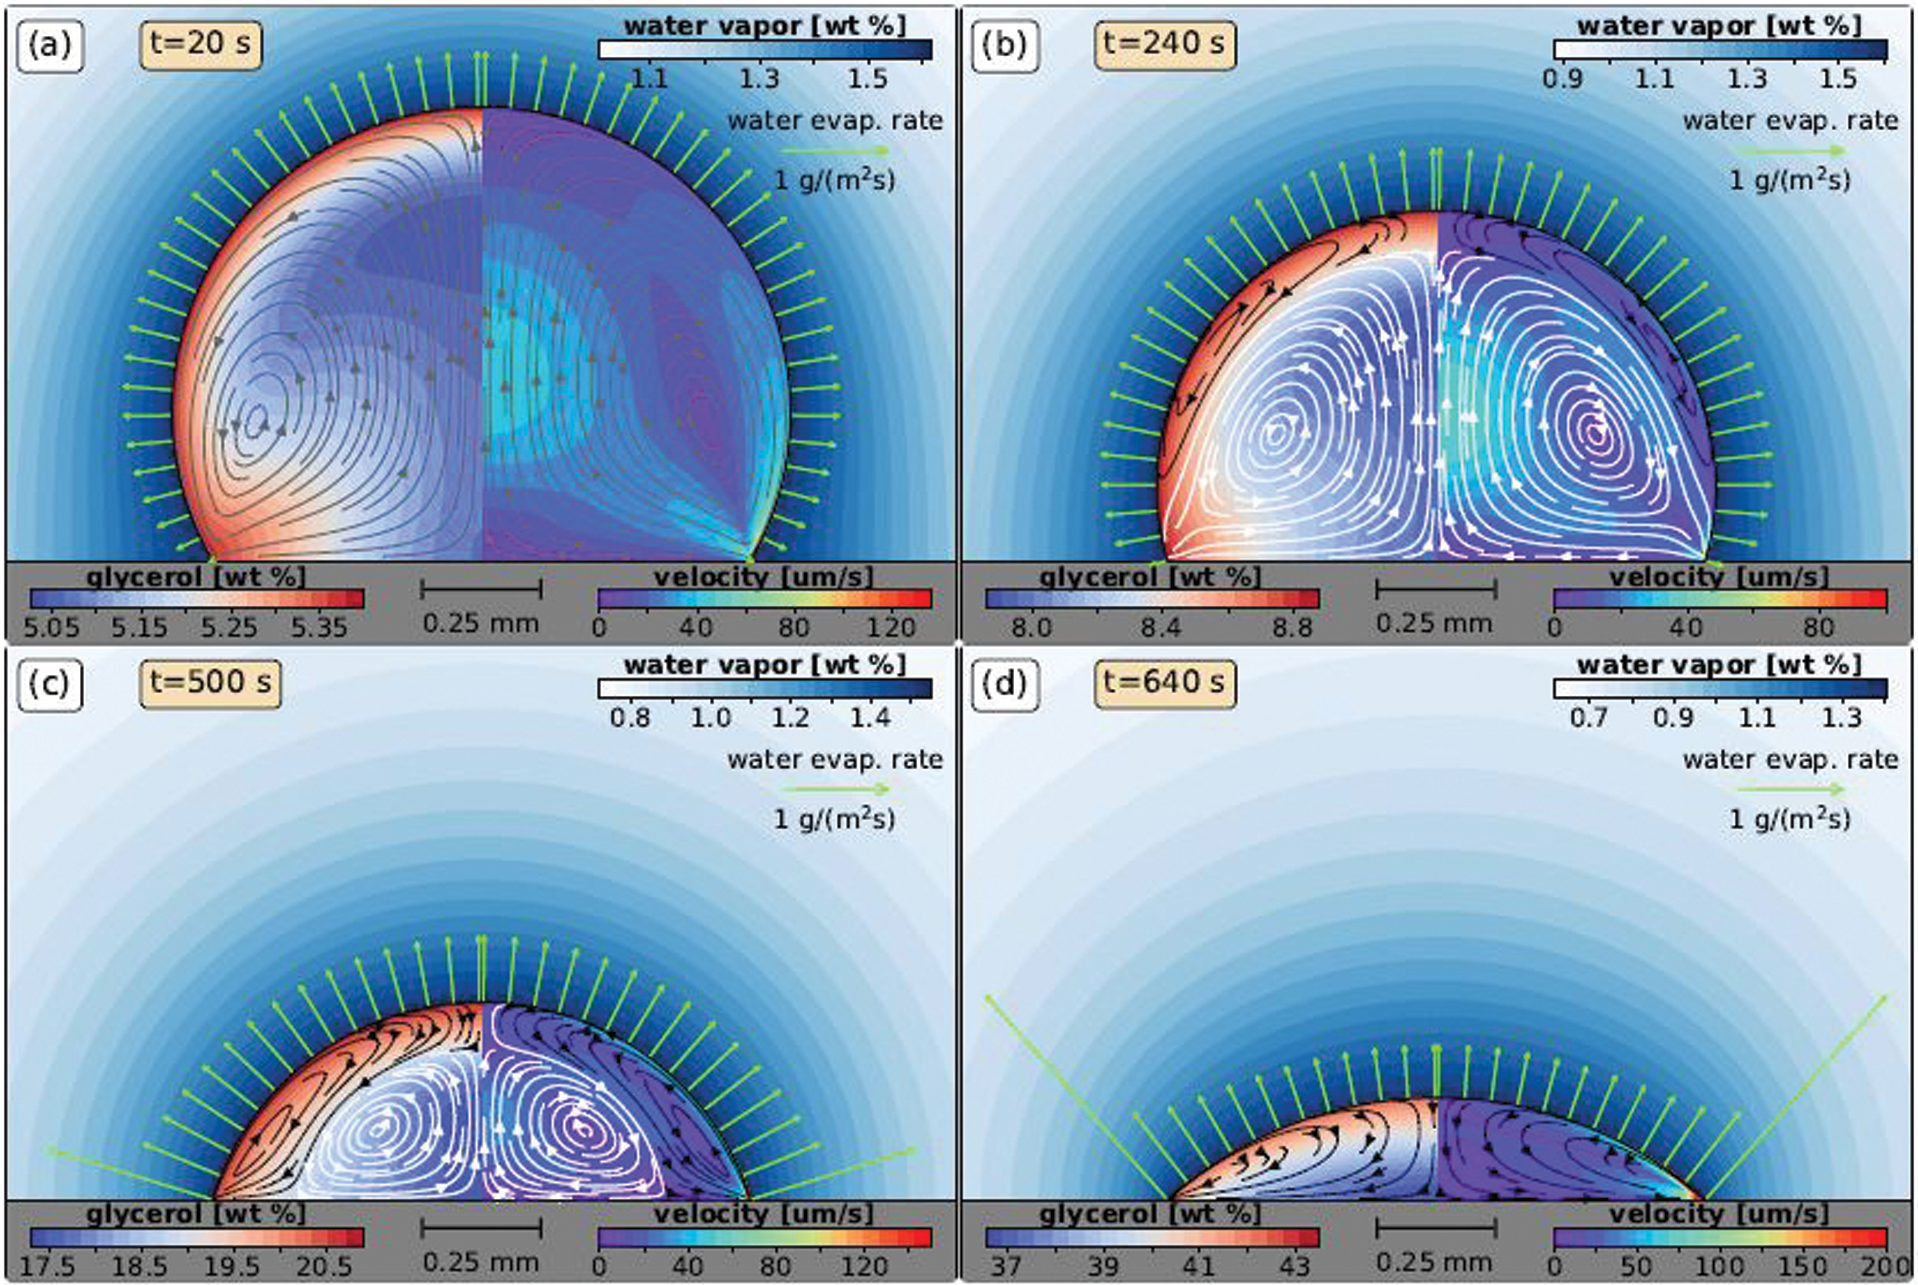
Figure 19: Simulation results of a 1
As mentioned earlier, several researchers have used infrared visualization techniques to study thermal patterns. Considerable literature already exists on single-component (pure fluid) droplets, but IR visualization in multi-component droplets still has a lot of potential. To the best of our knowledge, IR visualization on multi-component droplets is still qualitatively analyzed and not quantitatively in terms of the surface temperature. Chen et al. [25] have reported that the color difference of convection cells is due to the difference in emissivity of different substances and does not indicate the temperature difference. The analysis was used to understand the point where complete evaporation of butanol took place (leaving just water), which is the point where all thermal waves disappeared. Sáenz et al. [66] have studied the evaporation of non-spherical droplets and found that in binary mixtures, the interfacial turbulence always tends towards the contact line. In the case of spherical drops, no preferential location is identified, but in non-spherical drops, the interfacial turbulence always moved towards the region of lowest curvature. Fig. 20 shows the evaporation of ethanol-water droplets (E 25% + W 75%) of the same volume in different shapes. The shapes are such that the perimeter is the same for all. The red dots indicate the interfacial turbulence region, which is proportional to the ethanol concentration, i.e., the more the ethanol concentration, the more the turbulence. The area of this turbulence, in all cases, tended towards the region adjacent to the contact line. In spherical drops, no preferred location of turbulence is observed around the perimeter of the drop, but in non-spherical drops, the geometry decided the region of interfacial turbulence. It can be seen that for a drop with an elliptical shape where both curvatures are positive, the preferred region is either of the two ends on the short axis (Fig. 20b). In a triangular-shaped drop where the curvature is large at the corners and zero everywhere else, the preferred region is any one of the three sides (Fig. 20c). For a shape like a kidney where there is positive and negative curvature (dimple), the preferred region is the one with negative curvature, i.e., the dimple.
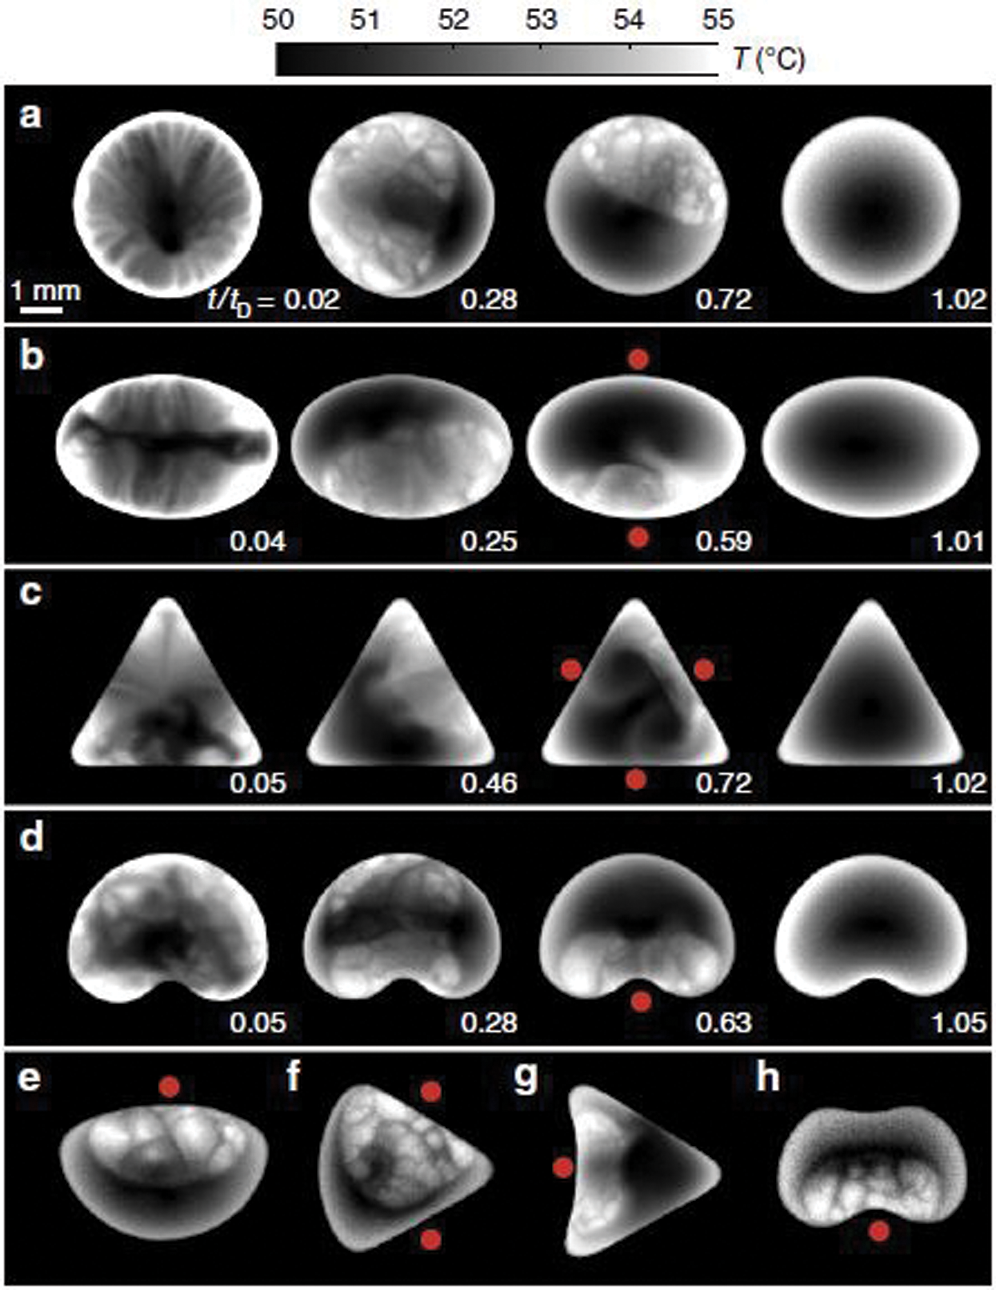
Figure 20: Infrared images (top view) of evaporating binary-mixture drops (25% ethanol and 75% distilled water by volume) with different shapes. Figures show the ethanol depletion occurring and maximum turbulence regions (minimum curvature) indicated by red dots. In all cases, the initial volume is V = 7
Mamalis et al. [24] have studied the thermal patterns for a 5% butanol and 95% water mixture. The thermal patterns showed darker curved bands directed radially towards the droplet center. The intensity of patterns is higher initially due to the higher temperature difference between the droplet surface and substrate. The patterns are radial and concentric in nature. Katre et al. [14] have studied thermal patterns for ethanol 20%-water 80% (E 20% + W 80%) binary droplet on an inclined plate at different temperatures. Fig. 21 shows the thermal pattern of the droplet at different normalized times and different substrate temperatures. It is evident that the intensity of convection due to thermo-solutal effects increases as the substrate temperature increases. It can also be observed that the evaporation is dominant on the receding side of the droplet. This is due to water, being heavy, moves to the advancing side under the influence of gravity, and the thermo-solutal Marangoni force drives ethanol towards the receding side. Ethanol, being more volatile, evaporates faster, causing preferential evaporation on the receding side. For substrate temperatures above 50°C, two unique cold regions are observed, which kept oscillating on the advancing side. The duration of oscillation increases with the increasing value of substrate temperature.
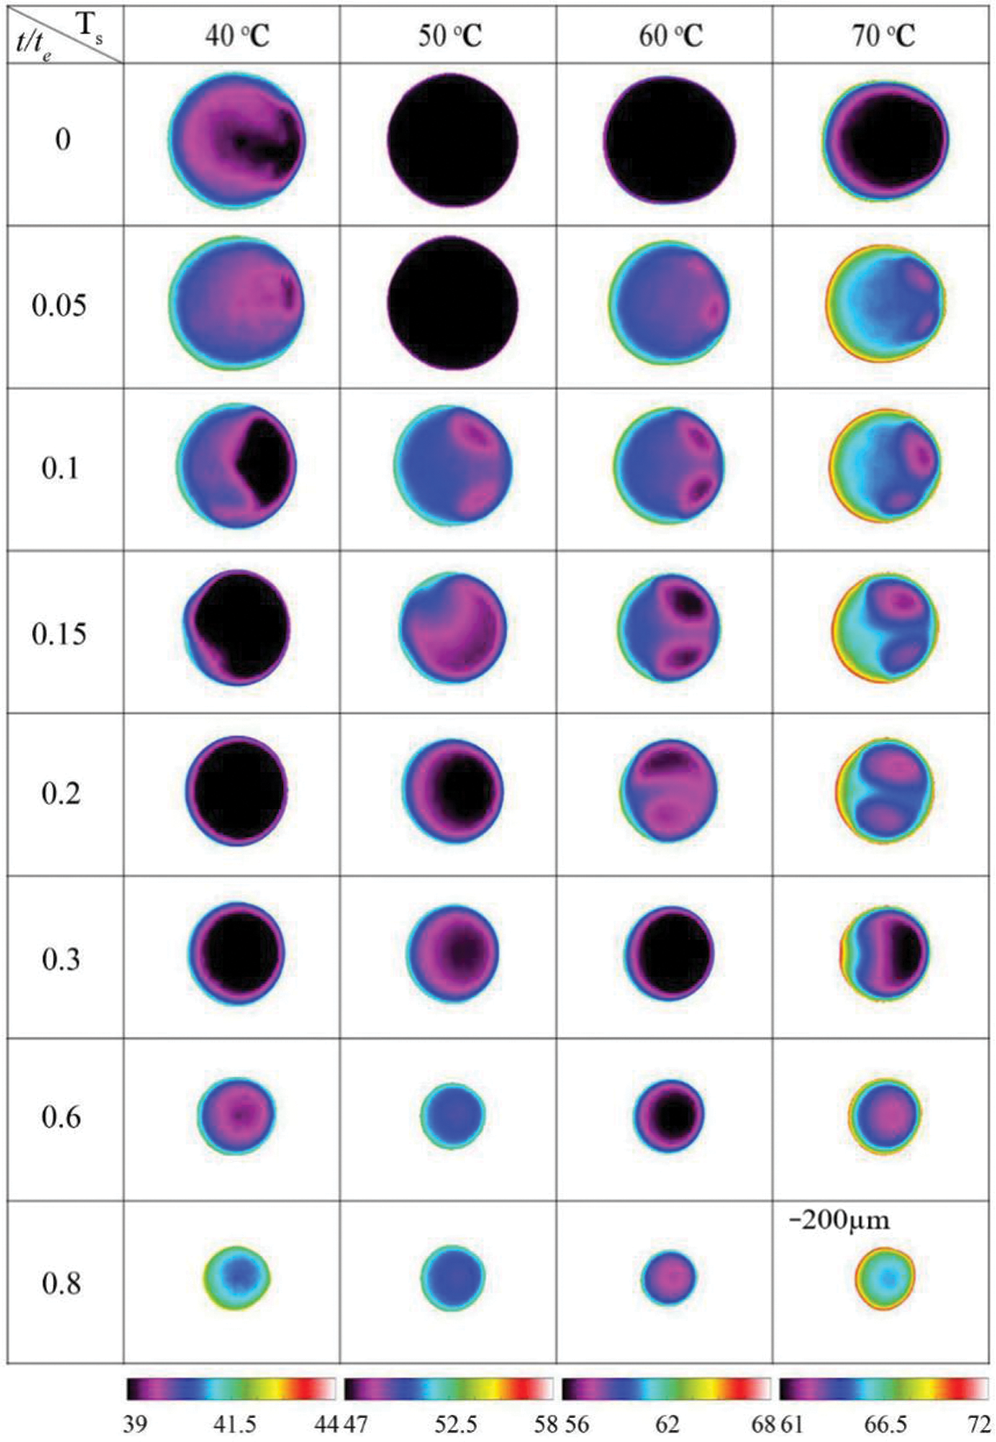
Figure 21: Thermal patterns on a 20% ethanol and 80% water droplet at various substrate temperatures and respective inclination angle
5.3 Effect of Substrate Temperature/Phase Change
Parsa et al. [96] investigated how the substrate temperature affects the evaporation of water and 1-butanol mixture consisting of Copper Oxide nanoparticles on a silicon substrate. Substrate temperatures of 47, 64, 81, and
Parsa et al. [100] reported that at higher evaporation rates, the nanoparticle velocity is enhanced, causing faster movement towards depinned TPCL that resulted in the formation of a larger secondary ring. Accordingly, the temperature of the substrate was noted to be directly proportional to the size of the second ring. At substrate temperatures of 81 and 99°C, which are relatively higher, the flow transitioned from being chaotic initially to regular and slow, characterized by two distinctive counter-rotating vortices. At this temperature, the inverse Marangoni effect of butanol becomes active, thereby increasing the surface tension at the TPCL, which is at a higher temperature than the apex. Thus thermal Marangoni flow is generated along the air-droplet interface starting from apex to the triple point contact line. A Stick-Slip pattern was observed at 81 and 99°C due to the competing inverse Marangoni and capillary convection [101]. At 99°C substrate temperature, the ring-like structure did not deposit on the substrate to form a secondary ring due to the stick-slip pinning and depinning of the triple line.
The study of the wetting and evaporation dynamics of sessile droplets has gained considerable attention because of its relevance in many practical applications ranging from industrial to biological systems. A pure fluid drop in itself exhibits many complicated phenomena that can affect droplet physics, such as wetting dynamics, evaporation, internal flow, thermal patterns, and deposition patterns. The dynamics of a binary fluid drop becomes even richer due to the difference between the fluid properties of the components of the binary mixtures. In many practical applications, binary mixtures are used, such as combustion, ink-jet printing, drug delivery, automatic fluidic system assembly, and nanostructure fabrication. Fuel mixtures have been considered by many researchers as alternative fuels, particularly for space applications, and this has been an evolving subject of current research. Several parameters, such as ambient conditions (temperature, humidity, etc.), substrate properties, compositions of the mixture affect the evaporation and wetting dynamics of a sessile droplet. At elevated temperatures, the resultant Marangoni flow inside the droplet and the competition between the evaporation rates of the binary mixtures lead to a nonlinear effect during the evaporation. Much interesting physics and the associated experimental and numerical techniques used to study the evaporation of binary sessile droplets are discussed in this article. Semi-empirical models that take into account the diffusion, convection, passive transport, and Stefan flow contributions to the total evaporation flux are able to adequately predict the binary droplet evaporation rates and lifetimes. The variations of the physical parameters, such as droplet height, wetting radius, evaporation rates, and lifetimes of the droplets, including the flow and temperature fields, have been investigated. Although many investigations have considered pure (single-component) droplets, the evaporation of binary droplets have received far less attention. Particularly, very few studies have considered PIV and infrared imaging to examine the evaporation of binary fluids due to the difficulties associated with the opacity of binary fluids. It is also difficult to perform numerical simulations for binary droplets. Newer experimental methods to track the concentration of one component [28] using refractive index are being employed, but the process is tedious, providing more scope for alternate methods. For observing the flow field, PIV methods are limited to 2D visualization. New methods like FD-OCT used by Edwards et al. [26] enable the 3D field of view and provides better flow visualization, which may lead to more interesting insights. The theoretical work, on the other hand, is mostly backed by experimental evidence as certain parameters can be controlled (for example, relative humidity), thereby allowing to simplify the models. However, a generalized theoretical model for any binary sessile droplet needs extensive experimental data by studying different types of fluids (for example, self-rewetting fluids) and substrates. Moreover, the evaporation dynamics of a sessile binary droplet on curved substrates can be expected to be very different from that on the horizontal substrates and has not been considered to the best of our knowledge. The impact of binary droplet dynamics on nanoparticle deposition patterns in the case of binary nano-fluid droplets is also an exciting but less studied area of research. This review article is geared towards exploring state-of-the-art techniques and provides a future direction in this area.
Acknowledgement: The authors sincerely thank the anonymous reviewers for their helpful suggestions.
Funding Statement: We thank IIT Hyderabad for providing financial support through Japan International Cooperation Agency (JICA).
Conflicts of Interest: The authors declare that they have no conflicts of interest to report regarding the present study.
1. Jing, J., Reed, J., Huang, J., Hu, X., Clarke, V. et al. (1998). Automated high resolution optical mapping using arrayed, fluid-fixed DNA molecules. Proceedings of the National Academy of Sciences of the United States of America, 95(14), 8046–8051. DOI 10.1073/pnas.95.14.8046. [Google Scholar] [CrossRef]
2. Blossey, R. (2003). Self-cleaning surfaces—virtual realities. Nature Materials, 2(5), 301–306. DOI 10.1038/nmat856. [Google Scholar] [CrossRef]
3. Leenaars, A. F. M., Huethorst, J. A. M., van Oekel, J. J. (1990). Marangoni drying: A new extremely clean drying process. Langmuir, 6(11), 1701–1703. DOI 10.1021/la00101a014. [Google Scholar] [CrossRef]
4. Boneberg, J., Burmeister, F., Schäfle, C., Leiderer, P., Reim, D. et al. (1997). The formation of nano-dot and nano-ring structures in colloidal monolayer lithography. Langmuir, 13(26), 7080–7084. DOI 10.1021/la9704922. [Google Scholar] [CrossRef]
5. Kim, D., Jeong, S., Park, B. K., Moon, J. (2006). Direct writing of silver conductive patterns: Improvement of film morphology and conductance by controlling solvent compositions. Applied Physics Letters, 89(26), 264101. DOI 10.1063/1.2424671. [Google Scholar] [CrossRef]
6. Brutin, D., Starov, V. (2018). Recent advances in droplet wetting and evaporation. Chemical Society Reviews, 47(2), 558–585. DOI 10.1039/C6CS00902F. [Google Scholar] [CrossRef]
7. Diddens, C., Kuerten, J. G., van der Geld, C. W. M., Wijshoff, H. M. A. (2017). Modeling the evaporation of sessile multi-component droplets. Journal of Colloid and Interface Science, 487(6), 426–436. DOI 10.1016/j.jcis.2016.10.030. [Google Scholar] [CrossRef]
8. Cira, N. J., Benusiglio, A., Prakash, M. (2015). Vapour-mediated sensing and motility in two-component droplets. Nature, 519(7544), 446–450. DOI 10.1038/nature14272. [Google Scholar] [CrossRef]
9. Zang, D., Tarafdar, S., Tarasevich, Y. Y., Choudhury, M. D., Dutta, T. (2019). Evaporation of a droplet: From physics to applications. Physics Reports, 804(1), 1–56. DOI 10.1016/j.physrep.2019.01.008. [Google Scholar] [CrossRef]
10. Brutin, D., Sobac, B., Rigollet, F., Le Niliot, C. (2011). Infrared visualization of thermal motion inside a sessile drop deposited onto a heated surface. Experimental Thermal and Fluid Science, 35(3), 521–530. DOI 10.1016/j.expthermflusci.2010.12.004. [Google Scholar] [CrossRef]
11. Carle, F., Sobac, B., Brutin, D. (2012). Hydrothermal waves on ethanol droplets evaporating under terrestrial and reduced gravity levels. Journal of Fluid Mechanics, 712, 614–623. DOI 10.1017/jfm.2012.446. [Google Scholar] [CrossRef]
12. Sefiane, K., Fukatani, Y., Takata, Y., Kim, J. (2013). Thermal patterns and hydrothermal waves (HTWs) in volatile drops. Langmuir, 29(31), 9750–9760. DOI 10.1021/la402247n. [Google Scholar] [CrossRef]
13. Sefiane, K., Moffat, J. R., Matar, O. K., Craster, R. V. (2008). Self-excited hydrothermal waves in evaporating sessile drops. Applied Physics Letters, 93(7), 074103. DOI 10.1063/1.2969072. [Google Scholar] [CrossRef]
14. Katre, P., Gurrala, P., Balusamy, S., Banerjee, S., Sahu, K. C. (2020). Evaporation of sessile ethanol-water droplets on a critically inclined heated surface. International Journal of Multiphase Flow, 131(11), 103368. DOI 10.1016/j.ijmultiphaseflow.2020.103368. [Google Scholar] [CrossRef]
15. Diddens, C., Li, Y., Lohse, D. (2020). Competing Marangoni and Rayleigh convection in evaporating binary droplets. https://arxiv.org/abs/2005.14138. [Google Scholar]
16. Sefiane, K., Tadrist, L., Douglas, M. (2003). Experimental study of evaporating water–ethanol mixture sessile drop: Influence of concentration. International Journal of Heat and Mass Transfer, 46(23), 4527–4534. DOI 10.1016/S0017-9310(03)00267-9. [Google Scholar] [CrossRef]
17. Cheng, A. K., Soolaman, D. M., Yu, H. Z. (2006). Evaporation of microdroplets of ethanol–water mixtures on gold surfaces modified with self-assembled monolayers. Journal of Physical Chemistry B, 110(23), 11267–11271. DOI 10.1021/jp0572885. [Google Scholar] [CrossRef]
18. Sefiane, K., David, S., Shanahan, M. E. (2008). Wetting and evaporation of binary mixture drops. Journal of Physical Chemistry B, 112(36), 11317–11323. DOI 10.1021/jp8030418. [Google Scholar] [CrossRef]
19. Wang, Z., Peng, X. F., Mujumdar, A. S., Su, A., Lee, D. J. (2008). Evaporation of ethanol-water mixture drop on horizontal substrate. Drying Technology, 26(6), 806–810. DOI 10.1080/07373930802046526. [Google Scholar] [CrossRef]
20. Shi, L., Shen, P., Zhang, D., Lin, Q., Jiang, Q. (2009). Wetting and evaporation behaviors of water-ethanol sessile drops on PTFE surfaces. Surface and Interface Analysis. An International Journal Devoted to the Development and Application of Techniques for the Analysis of Surfaces, Interfaces and Thin Films, 41(12–13), 951–955. [Google Scholar]
21. Innocenzi, P., Malfatti, L., Costacurta, S., Kidchob, T., Piccinini, M. et al. (2008). Evaporation of ethanol and ethanol−water mixtures studied by time-resolved infrared spectroscopy. Journal of Physical Chemistry A, 112(29), 6512–6516. DOI 10.1021/jp7111395. [Google Scholar] [CrossRef]
22. Christy, J. R., Hamamoto, Y., Sefiane, K. (2011). Flow transition within an evaporating binary mixture sessile drop. Physical Review Letters, 106(20), 205701. DOI 10.1103/PhysRevLett.106.205701. [Google Scholar] [CrossRef]
23. Bennacer, R., Sefiane, K. (2014). Vortices, dissipation and flow transition in volatile binary drops. Journal of Fluid Mechanics, 749, 649–665. DOI 10.1017/jfm.2014.220. [Google Scholar] [CrossRef]
24. Mamalis, D., Koutsos, V., Sefiane, K. (2016). On the motion of a sessile drop on an incline: Effect of non-monotonic thermocapillary stresses. Applied Physics Letters, 109(23), 231601. DOI 10.1063/1.4971396. [Google Scholar] [CrossRef]
25. Chen, P., Toubal, M., Carlier, J., Harmand, S., Nongaillard, B. et al. (2016). Evaporation of binary sessile drops: Infrared and acoustic methods to track alcohol concentration at the interface and on the surface. Langmuir, 32(38), 9836–9845. DOI 10.1021/acs.langmuir.6b02564. [Google Scholar] [CrossRef]
26. Edwards, A. M. J., Atkinson, P. S., Cheung, C. S., Liang, H., Fairhurst, D. J. et al. (2018). Density-driven flows in evaporating binary liquid droplets. Physical Review Letters, 121(18), 184501. DOI 10.1103/PhysRevLett.121.184501. [Google Scholar] [CrossRef]
27. Gurrala, P., Katre, P., Balusamy, S., Banerjee, S., Sahu, K. C. (2019). Evaporation of ethanol-water sessile droplet of different compositions at an elevated substrate temperature. International Journal of Heat and Mass Transfer, 145(18), 118770. DOI 10.1016/j.ijheatmasstransfer.2019.118770. [Google Scholar] [CrossRef]
28. Ozturk, T., Erbil, H. Y. (2020). Simple model for diffusion-limited drop evaporation of binary liquids from physical properties of the components: Ethanol–Water Example. Langmuir, 36(5), 1357–1371. DOI 10.1021/acs.langmuir.9b03590. [Google Scholar] [CrossRef]
29. Diddens, C., Tan, H., Lv, P., Versluis, M., Kuerten, J. G. M. et al. (2017). Evaporating pure, binary and ternary droplets: Thermal effects and axial symmetry breaking. Journal of Fluid Mechanics, 823, 470–497. DOI 10.1017/jfm.2017.312. [Google Scholar] [CrossRef]
30. Karpitschka, S., Liebig, F., Riegler, H. (2017). Marangoni contraction of evaporating sessile droplets of binary mixtures. Langmuir, 33(19), 4682–4687. DOI 10.1021/acs.langmuir.7b00740. [Google Scholar] [CrossRef]
31. Li, Y., Lv, P., Diddens, C., Tan, H., Wijshoff, H. et al. (2018). Evaporation-triggered segregation of sessile binary droplets. Physical Review Letters, 120(22), 224501. DOI 10.1103/PhysRevLett.120.224501. [Google Scholar] [CrossRef]
32. Li, Y., Diddens, C., Lv, P., Wijshoff, H., Versluis, M. et al. (2019). Gravitational effect in evaporating binary microdroplets. Physical Review Letters, 122(11), 114501. DOI 10.1103/PhysRevLett.122.114501. [Google Scholar] [CrossRef]
33. Diddens, C. (2017). Detailed finite element method modeling of evaporating multi-component droplets. Journal of Computational Physics, 340(4), 670–687. DOI 10.1016/j.jcp.2017.03.049. [Google Scholar] [CrossRef]
34. Zhang, N., Chao, D. F. (2002). A new laser shadowgraphy method for measurements of dynamic contact angle and simultaneous flow visualization in a sessile drop. Optics & Laser Technology, 34(3), 243–248. DOI 10.1016/S0030-3992(02)00002-6. [Google Scholar] [CrossRef]
35. Riley, R. J., Neitzel, G. P. (1998). Instability of thermocapillary-buoyancy convection in shallow layers. Part 1. Characterization of steady and oscillatory instabilities. Journal of Fluid Mechanics, 359, 143–164. [Google Scholar]
36. Sefiane, K., Steinchen, A., Moffat, R. (2010). On hydrothermal waves observed during evaporation of sessile droplets. Colloids and Surfaces A: Physicochemical and Engineering Aspects, 365(1–3), 95–108. DOI 10.1016/j.colsurfa.2010.02.015. [Google Scholar] [CrossRef]
37. Karapetsas, G., Matar, O. K., Valluri, P., Sefiane, K. (2012). Convective rolls and hydrothermal waves in evaporating sessile drops. Langmuir, 28(31), 11433–11439. DOI 10.1021/la3019088. [Google Scholar] [CrossRef]
38. Sobac, B., Brutin, D. (2012). Thermal effects of the substrate on water droplet evaporation. Physical Review E, 86(2), 021602. DOI 10.1103/PhysRevE.86.021602. [Google Scholar] [CrossRef]
39. Sáenz, P. J., Sefiane, K., Kim, J., Matar, O. K., Valluri, P. (2015). Evaporation of sessile drops: A three-dimensional approach. Journal of Fluid Mechanics, 772, 705–739. DOI 10.1017/jfm.2015.224. [Google Scholar] [CrossRef]
40. Hu, H., Larson, R. G. (2002). Evaporation of a sessile droplet on a substrate. Journal of Physical Chemistry B, 106(6), 1334–1344. DOI 10.1021/jp0118322. [Google Scholar] [CrossRef]
41. Popov, Y. O. (2005). Evaporative deposition patterns: Spatial dimensions of the deposit. Physical Review E, 71(3), 036313. DOI 10.1103/PhysRevE.71.036313. [Google Scholar] [CrossRef]
42. Deegan, R. D., Bakajin, O., Dupont, T. F., Huber, G., Nagel, S. R. et al. (2000). Contact line deposits in an evaporating drop. Physical Review E, 62(1), 756–765. DOI 10.1103/PhysRevE.62.756. [Google Scholar] [CrossRef]
43. Brutin, D. (2015). Droplet wetting and evaporation: From pure to complex fluids. London, UK: Academic Press. [Google Scholar]
44. Carle, F., Sobac, B., Brutin, D. (2013). Experimental evidence of the atmospheric convective transport contribution to sessile droplet evaporation. Applied Physics Letters, 102(6), 061603. DOI 10.1063/1.4792058. [Google Scholar] [CrossRef]
45. Carle, F., Semenov, S., Medale, M., Brutin, D. (2016). Contribution of convective transport to evaporation of sessile droplets: Empirical model. International Journal of Thermal Sciences, 101(2), 35–47. DOI 10.1016/j.ijthermalsci.2015.10.012. [Google Scholar] [CrossRef]
46. Kelly-Zion, P. L., Pursell, C. J., Wassom, G. N., Mandelkorn, B. V., Nkinthorn, C. (2018). Correlation for sessile drop evaporation over a wide range of drop volatilities, ambient gases and pressures. International Journal of Heat and Mass Transfer, 118, 355–367. DOI 10.1016/j.ijheatmasstransfer.2017.10.129. [Google Scholar] [CrossRef]
47. Lloyd, J. R., Moran, W. R. (1974). Natural convection adjacent to horizontal surface of various planforms. ASME Journal of Heat Transfer, 96(4), 443–447. DOI 10.1115/1.3450224. [Google Scholar] [CrossRef]
48. Sandler, S. I. (2017). Chemical, biochemical, and engineering thermodynamics. Hoboken, USA: John Wiley & Sons. [Google Scholar]
49. Marsh, K. N., Richards, A. E. (1980). Excess volumes for ethanol + water mixtures at 10-K intervals from 278.15 to 338.15 K. Australian Journal of Chemistry, 33(10), 2121–2132. DOI 10.1071/CH9802121. [Google Scholar] [CrossRef]
50. Erbil, H. Y., McHale, G., Newton, M. I. (2002). Drop evaporation on solid surfaces: Constant contact angle mode. Langmuir, 18(7), 2636–2641. DOI 10.1021/la011470p. [Google Scholar] [CrossRef]
51. Fuller, E. N., Schettler, P. D., Giddings, J. C. (1966). New method for prediction of binary gas-phase diffusion coefficients. Industrial & Engineering Chemistry, 58(5), 18–27. DOI 10.1021/ie50677a007. [Google Scholar] [CrossRef]
52. Ozturk, T., Erbil, H. Y. (2018). Evaporation of water-ethanol binary sessile drop on fluoropolymer surfaces: Influence of relative humidity. Colloids and Surfaces A: Physicochemical and Engineering Aspects, 553, 327–336. DOI 10.1016/j.colsurfa.2018.05.076. [Google Scholar] [CrossRef]
53. Kadhim, M. A., Kapur, N., Summers, J. L., Thompson, H. (2019). Experimental and theoretical investigation of droplet evaporation on heated hydrophilic and hydrophobic surfaces. Langmuir, 35(19), 6256–6266. DOI 10.1021/acs.langmuir.8b03601. [Google Scholar] [CrossRef]
54. Dash, S., Garimella, S. V. (2014). Droplet evaporation on heated hydrophobic and superhydrophobic surfaces. Physical Review E, 89(4), 042402. DOI 10.1103/PhysRevE.89.042402. [Google Scholar] [CrossRef]
55. Semenov, S., Starov, V. M., Rubio, R. G. (2013). Evaporation of pinned sessile microdroplets of water on a highly heat-conductive substrate: Computer simulations. European Physical Journal Special Topics, 219(1), 143–154. DOI 10.1140/epjst/e2013-01789-y. [Google Scholar] [CrossRef]
56. Karapetsas, G., Sahu, K. C., Matar, O. K. (2013). Effect of contact line dynamics on the thermocapillary motion of a droplet on an inclined plate. Langmuir, 29(28), 8892–8906. DOI 10.1021/la4014027. [Google Scholar] [CrossRef]
57. Yang, K., Hong, F., Cheng, P. (2014). A fully coupled numerical simulation of sessile droplet evaporation using Arbitrary Lagrangian–Eulerian formulation. International Journal of Heat and Mass Transfer, 70(20), 409–420. DOI 10.1016/j.ijheatmasstransfer.2013.11.017. [Google Scholar] [CrossRef]
58. Chen, J., Wang, Z., Yang, C., Mao, Z. S. (2015). Numerical simulation of the solute-induced marangoni effect with the semi-lagrangian advection scheme. Chemical Engineering & Technology, 38(1), 155–163. DOI 10.1002/ceat.201400354. [Google Scholar] [CrossRef]
59. Lekhlifi, A., Ouazzani, J., Antoni, M. (2014). Drainage of water droplets in a bounded paraffin oil continuous phase: Role of temperature, size and boundary walls. Colloids and Surfaces A: Physicochemical and Engineering Aspects, 460(1), 342–350. DOI 10.1016/j.colsurfa.2014.05.078. [Google Scholar] [CrossRef]
60. Karapetsas, G., Sahu, K. C., Sefiane, K., Matar, O. K. (2014). Thermocapillary-driven motion of a sessile drop: Effect of non-monotonic dependence of surface tension on temperature. Langmuir, 30(15), 4310–4321. DOI 10.1021/la5002682. [Google Scholar] [CrossRef]
61. Tripathi, M. K., Sahu, K. C., Karapetsas, G., Sefiane, K., Matar, O. K. (2015). Non-isothermal bubble rise: Non-monotonic dependence of surface tension on temperature. Journal of Fluid Mechanics, 763, 82–108. DOI 10.1017/jfm.2014.659. [Google Scholar] [CrossRef]
62. Balla, M., Tripathi, M. K., Sahu, K. C., Karapetsas, G., Matar, O. K. (2019). Non-isothermal bubble rise dynamics in a self-rewetting fluid: Three-dimensional effects. Journal of Fluid Mechanics, 858, 689–713. DOI 10.1017/jfm.2018.774. [Google Scholar] [CrossRef]
63. Karapetsas, G., Sahu, K. C., Matar, O. K. (2016). Evaporation of sessile droplets laden with particles and insoluble surfactants. Langmuir, 32(27), 6871–6881. DOI 10.1021/acs.langmuir.6b01042. [Google Scholar] [CrossRef]
64. Chen, X., Chen, P. G., Ouazzani, J., Liu, Q. (2017). Numerical simulations of sessile droplet evaporating on heated substrate. European Physical Journal Special Topics, 226(6), 1325–1335. DOI 10.1140/epjst/e2016-60203-y. [Google Scholar] [CrossRef]
65. Wang, Z., Dong, K., Zhan, S. (2017). Numerical analysis on unsteady internal flow in an evaporating droplet. Fluid Dynamics & Materials Processing, 13(4), 221–234. [Google Scholar]
66. Sáenz, P. J., Wray, A. W., Che, Z., Matar, O. K., Valluri, P. et al. (2017). Dynamics and universal scaling law in geometrically-controlled sessile drop evaporation. Nature Communications, 8(1), 1–9. DOI 10.1038/s41467-016-0009-6. [Google Scholar] [CrossRef]
67. Tsoumpas, Y., Dehaeck, S., Rednikov, A., Colinet, P. (2015). Effect of Marangoni flows on the shape of thin sessile droplets evaporating into air. Langmuir, 31(49), 13334–13340. DOI 10.1021/acs.langmuir.5b02673. [Google Scholar] [CrossRef]
68. Tan, H., Diddens, C., Lv, P., Kuerten, J. G., Zhang, X. et al. (2016). Evaporation-triggered microdroplet nucleation and the four life phases of an evaporating Ouzo drop. Proceedings of the National Academy of Sciences of the United States of America, 113(31), 8642–8647. DOI 10.1073/pnas.1602260113. [Google Scholar] [CrossRef]
69. Tan, H., Diddens, C., Versluis, M., Butt, H. J., Lohse, D. et al. (2017). Self-wrapping of an ouzo drop induced by evaporation on a superamphiphobic surface. Soft Matter, 13(15), 2749–2759. DOI 10.1039/C6SM02860H. [Google Scholar] [CrossRef]
70. Kim, H., Boulogne, F., Um, E., Jacobi, I., Button, E. et al. (2016). Controlled uniform coating from the interplay of Marangoni flows and surface-adsorbed macromolecules. Physical Review Letters, 116(12), 124501. DOI 10.1103/PhysRevLett.116.124501. [Google Scholar] [CrossRef]
71. Fujita, A., Kurose, R., Komori, S. (2010). Experimental study on effect of relative humidity on heat transfer of an evaporating water droplet in air flow. International Journal of Multiphase Flow, 36(3), 244–247. DOI 10.1016/j.ijmultiphaseflow.2009.10.004. [Google Scholar] [CrossRef]
72. Fukatani, Y., Orejon, D., Kita, Y., Takata, Y., Kim, J. et al. (2016). Effect of ambient temperature and relative humidity on interfacial temperature during early stages of drop evaporation. Physical Review E, 93(4), 043103. DOI 10.1103/PhysRevE.93.043103. [Google Scholar] [CrossRef]
73. Girard, F., Antoni, M., Faure, S., Steinchen, A. (2008). Influence of heating temperature and relative humidity in the evaporation of pinned droplets. Colloids and Surfaces A: Physicochemical and Engineering Aspects, 323(1–3), 36–49. DOI 10.1016/j.colsurfa.2007.12.022. [Google Scholar] [CrossRef]
74. Wu, Y., Zhang, X., Zhang, X. (2016). Simplified analysis of heat and mass transfer model in droplet evaporation process. Applied Thermal Engineering, 99(1–2), 938–943. DOI 10.1016/j.applthermaleng.2016.01.020. [Google Scholar] [CrossRef]
75. Song, H., Lee, Y., Jin, S., Kim, H. Y., Yoo, J. Y. (2011). Prediction of sessile drop evaporation considering surface wettability. Microelectronic Engineering, 88(11), 3249–3255. DOI 10.1016/j.mee.2011.07.015. [Google Scholar] [CrossRef]
76. Hatte, S., Dhar, R., Bansal, L., Chakraborty, S., Basu, S. (2019). On the lifetime of evaporating confined sessile droplets. Colloids and Surfaces A: Physicochemical and Engineering Aspects, 560, 78–83. DOI 10.1016/j.colsurfa.2018.10.008. [Google Scholar] [CrossRef]
77. Chen, Y. H., Hu, W. N., Wang, J., Hong, F. J., Cheng, P. (2017). Transient effects and mass convection in sessile droplet evaporation: The role of liquid and substrate thermophysical properties. International Journal of Heat and Mass Transfer, 108(12), 2072–2087. DOI 10.1016/j.ijheatmasstransfer.2017.01.050. [Google Scholar] [CrossRef]
78. Pan, Z., Dash, S., Weibel, J. A., Garimella, S. V. (2013). Assessment of water droplet evaporation mechanisms on hydrophobic and superhydrophobic substrates. Langmuir, 29(51), 15831–15841. DOI 10.1021/la4045286. [Google Scholar] [CrossRef]
79. Pan, Z., Weibel, J. A., Garimella, S. V. (2014). Influence of surface wettability on transport mechanisms governing water droplet evaporation. Langmuir, 30(32), 9726–9730. DOI 10.1021/la501931x. [Google Scholar] [CrossRef]
80. Zhang, C., Cheng, P., Minkowycz, W. J. (2017). Lattice Boltzmann simulation of forced condensation flow on a horizontal cold surface in the presence of a non-condensable gas. International Journal of Heat and Mass Transfer, 115(10), 500–512. DOI 10.1016/j.ijheatmasstransfer.2017.08.005. [Google Scholar] [CrossRef]
81. Guo, Q., Cheng, P. (2019). Direct numerical simulations of sessile droplet evaporation on a heated horizontal surface surrounded by moist air. International Journal of Heat and Mass Transfer, 134(2), 828–841. DOI 10.1016/j.ijheatmasstransfer.2019.01.049. [Google Scholar] [CrossRef]
82. Picknett, R. G., Bexon, R. (1977). The evaporation of sessile or pendant drops in still air. Journal of Colloid and Interface Science, 61(2), 336–350. DOI 10.1016/0021-9797(77)90396-4. [Google Scholar] [CrossRef]
83. Shaikeea, A. J. D., Basu, S., Tyagi, A., Sharma, S., Hans, R. et al. (2017). Universal representations of evaporation modes in sessile droplets. PLos One, 12(9), e0184997. DOI 10.1371/journal.pone.0184997. [Google Scholar] [CrossRef]
84. Gatapova, E. Y., Semenov, A. A., Zaitsev, D. V., Kabov, O. A. (2014). Evaporation of a sessile water drop on a heated surface with controlled wettability. Colloids and Surfaces A: Physicochemical and Engineering Aspects, 441(420), 776–785. DOI 10.1016/j.colsurfa.2013.05.046. [Google Scholar] [CrossRef]
85. Birdi, K. S., Vu, D. T. (1993). Wettability and the evaporation rates of fluids from solid surfaces. Journal of Adhesion Science and Technology, 7(6), 485–493. DOI 10.1163/156856193X00808. [Google Scholar] [CrossRef]
86. Rowan, S. M., Newton, M. I., McHale, G. (1995). Evaporation of microdroplets and the wetting of solid surfaces. Journal of Physical Chemistry, 99(35), 13268–13271. DOI 10.1021/j100035a034. [Google Scholar] [CrossRef]
87. Meric, R. A., Erbil, H. Y. (1998). Evaporation of sessile drops on solid surfaces: Pseudospherical cap geometry. Langmuir, 14(7), 1915–1920. DOI 10.1021/la970147c. [Google Scholar] [CrossRef]
88. Erbil, H. Y., McHale, G., Newton, M. I. (2002). Drop evaporation on solid surfaces: Constant contact angle mode. Langmuir, 18(7), 2636–2641. DOI 10.1021/la011470p. [Google Scholar] [CrossRef]
89. Tarafdar, S., Tarasevich, Y. Y., Dutta Choudhury, M., Dutta, T., Zang, D. (2018). Droplet drying patterns on solid substrates: From hydrophilic to superhydrophobic contact to levitating drops. Advances in Condensed Matter Physics, 5214924. [Google Scholar]
90. Shanahan, M. E. R., Bourges, C. (1994). Effects of evaporation on contact angles on polymer surfaces. International Journal of Adhesion and Adhesives, 14(3), 201–205. DOI 10.1016/0143-7496(94)90031-0. [Google Scholar] [CrossRef]
91. Lin, T. S., Zeng, Y. H., Tsay, R. Y., Lin, S. Y. (2016). Roughness-induced strong pinning for drops evaporating from polymeric surfaces. Journal of the Taiwan Institute of Chemical Engineers, 62, 54–59. DOI 10.1016/j.jtice.2016.02.015. [Google Scholar] [CrossRef]
92. Amini, A., Homsy, G. M. (2017). Evaporation of liquid droplets on solid substrates. I. Flat substrate with pinned or moving contact line. Physical Review Fluids, 2(4), 043603. DOI 10.1103/PhysRevFluids.2.043603. [Google Scholar] [CrossRef]
93. He, M., Liao, D., Qiu, H. (2017). Multicomponent droplet evaporation on chemical micro-patterned surfaces. Scientific Reports, 7(1), 41897. DOI 10.1038/srep41897. [Google Scholar] [CrossRef]
94. Yu, Y. S., Huang, X., Sun, L., Zhou, J. Z., Zhou, A. (2019). Evaporation of ethanol/water mixture droplets on micro-patterned PDMS surfaces. International Journal of Heat and Mass Transfer, 144(2), 118708. DOI 10.1016/j.ijheatmasstransfer.2019.118708. [Google Scholar] [CrossRef]
95. Hamamoto, Y., Christy, J. R., Sefiane, K. (2011). Order-of-magnitude increase in flow velocity driven by mass conservation during the evaporation of sessile drops. Physical Review E, 83(5), 051602. DOI 10.1103/PhysRevE.83.051602. [Google Scholar] [CrossRef]
96. Parsa, M., Boubaker, R., Harmand, S., Sefiane, K., Bigerelle, M. et al. (2017). Patterns from dried water-butanol binary-based nanofluid drops. Journal of Nanoparticle Research, 19(8), 268. DOI 10.1007/s11051-017-3951-2. [Google Scholar] [CrossRef]
97. Petre, G., Azouni, M. A. (1984). Experimental evidence for the minimum of surface tension with temperature at aqueous alcohol solution/air interfaces. Journal of Colloid and Interface Science, 98(1), 261–263. DOI 10.1016/0021-9797(84)90503-4. [Google Scholar] [CrossRef]
98. Orejon, D., Sefiane, K., Shanahan, M. E. (2011). Stick–slip of evaporating droplets: Substrate hydrophobicity and nanoparticle concentration. Langmuir, 27(21), 12834–12843. DOI 10.1021/la2026736. [Google Scholar] [CrossRef]
99. Askounis, A., Sefiane, K., Koutsos, V., Shanahan, M. E. (2014). The effect of evaporation kinetics on nanoparticle structuring within contact line deposits of volatile drops. Colloids and Surfaces A: Physicochemical and Engineering Aspects, 441, 855–866. DOI 10.1016/j.colsurfa.2012.10.017. [Google Scholar] [CrossRef]
100. Parsa, M., Harmand, S., Sefiane, K., Bigerelle, M., Deltombe, R. (2015). Effect of substrate temperature on pattern formation of nanoparticles from volatile drops. Langmuir, 31(11), 3354–3367. DOI 10.1021/acs.langmuir.5b00362. [Google Scholar] [CrossRef]
101. Sefiane, K. (2005). On the dynamic capillary effects in the wetting and evaporation process of binary droplets. Fluid Dynamics & Materials Processing, 1(3), 267–276. [Google Scholar]
 | This work is licensed under a Creative Commons Attribution 4.0 International License, which permits unrestricted use, distribution, and reproduction in any medium, provided the original work is properly cited. |