| Fluid Dynamics & Materials Processing |
DOI: 10.32604/fdmp.2021.012250
ARTICLE
Effects of Particle Concentration on the Dynamics of a Single-Channel Sewage Pump under Low-Flow-Rate Conditions
1Research Center on Levee Safety Disaster Prevention, Zhengzhou, 450003, China
2College of Metrology and Measurement Engineering, China Jiliang University, Hangzhou, China
3College of Mechanical Engineering, Zhejiang University of Technology, Hangzhou, China
4Power China Huadong Engineering Corporation Limited, Hangzhou, China
*Corresponding Author: Jiegang Mou. Email: mjg1963@126.com
Received: 22 July 2020; Accepted: 11 January 2021
Abstract: Single-channel sewage pumps are generally used to transport solid-liquid two-phase media consisting of a fluid and solid particles due to the good non-clogging property of such devices. However, the non-axisymmetric structure of the impeller of this type of pumps generally induces flow asymmetry, oscillatory outflow during operations, and hydraulic imbalance. In severe cases, these effects can jeopardize the safety and stability of the overall pump. In the present study, such a problem is investigated in the framework of a Mixture multiphase flow method coupled with a RNG turbulence model used to determine the structure of the flow field and the related motion of transported particles. It is shown that under different inlet particle concentrations, the flow field in the pump exhibits periodic variations of the pressure. The volume fraction of solid particles at the trailing edge of the suction surface of the blade is the largest, and solid particles tend to be concentrated at the outer edge of the pump body. With a rise in import particle content, the pressure and volume fraction of particles in the sewage pump also increase; for a fixed inlet particle concentration, the pressure pulsation amplitude increases with an increase in the flow rate. In addition, under small flow conditions, as the inlet particle concentration increases, the flow field leaving the sewage pump diaphragm near the outlet of the volute becomes more turbulent, and even a secondary back-flow vortex appears.
Keywords: Single-channel sewage pump; numerical simulation; solid-liquid two-phase flow; particle distribution; secondary flow
Single-channel sewage pumps are widely used in many industries, such as paper, coal, agriculture, environmental protection, mining and aviation, because of their excellent non-clogging performance, wide high efficiency area, steep lift curve and good non-destructive properties [1–3]. Their wide flow channel can transport sewage containing large particles of long fibre materials, which has great advantages in industrial or municipal applications requiring large flow and low head. However, the impeller has a non-axisymmetric structure, which will inevitably cause flow asymmetry [4–6]. This non-axisymmetric arrangement of the impeller blades, the pulse outflow and the huge radial force caused by hydraulic imbalance during operation affect a wide range of applications [7–10].
As the computational fluid dynamics (CFD) are successfully applied for calculating the flow field inside the pump and optimizing the design of the pump flow passages [11], CFD technology has gradually become a useful tool for the numerical prediction of solid-liquid two-phase flows of the pump. There has been a good deal of investigation into solid-liquid two-phase flow, even regarding nanofluids [12]. Hussain et al. [13] analysed the thermal performance of radiators in normal channel and small channel environments under different volume concentrations of water and TiO2-H2 by using the fluent numerical simulation method. Liu et al. [14] simulated the movement of particles with a particle size of 1–12 mm at different velocities. They found that large particles were more concentrated in the rear cover and the middle flow channel and small particles tended to gather at the back. Zhang et al. [15] studied the movement trajectories of particles with different concentrations, sizes and densities, and found that the pump head and efficiency decreased with the increase of particle size or concentration. However, the effect of particle density on performance is relatively small. The particles are mainly concentrated on the working surface of the impeller. With the decrease of particle size, particles tend to migrate to the back and the segregation phenomenon becomes less obvious. Zhao et al. [16] also simulated the regular flow of solid-liquid two-phase flow in the full flow channel of the dual-channel pump under different particle size and particle volume concentration conditions. They found that the solid phase is mainly concentrated on the working face and back cover plate at the impeller outlet. The larger the particle size, the more the particle impact point was concentrated on the impeller working surface and the more obvious the segregation effect of the solid phase. Shi et al. [17] studied the effects of particle solid phase volume distribution and particle diameter on the solid-liquid two-phase flow in a submersible axial flow pump. They found that solid particles were mainly distributed on the impeller pressure side in the impeller flow channel and were less distribeted on the impeller suction surface. As the particle size increased, there was a tendency for particles to move from the impeller pressure side to the back and to migrate to the outlet on the back. With the particle solid phase volume distribution increase, the particles gradually moved toward the inlet and hub on the blade pressure side, while the particles on the suction surface of the blade continued to migrate toward the outlet and near to the hub. Lu et al. [18] studied a non-constant constant value simulation of the solid-liquid two-phase turbulent flow in the dual-channel pump. They found that the pressure distribution in the channel showed a periodic change with time and that the particles were concentrated at the outlet of the impeller and at the back cover. Cao et al. [19] studied the solid phase volume fraction and velocity distribution at different positions of the impeller blades in a three-blade semi-open sewage pump under different solid phase volume fractions and different flow conditions. They also explored the influence of solid phase and liquid phase on the internal flow field. Wan et al. [20] analysed the influence of different particle concentrations on the unsteady characteristics of a centrifugal pump with five blades. It was found that with the increase of particle concentration, the instantaneous turbulent kinetic energy in the impeller was significantly enhanced, the pulsating amplitude and the radial force acting on the impeller increased, but the pressure in the blade rotation channel, the tongue septum and the radial force acting on the diaphragm decreased. Some other scholars have also conducted related research [21–27].
At present, most of the researches focus on the abrasion characteristics of the sewage pump with multiple blades. So far, few researchers have studied on the relationship among the internal flow field, pressure pulsation and radial force. In this research, a single-blade sewage pump is chosen as the research object, based on the Mixture model and RNG
2 The Investigated Pump and Numerical Simulation Method
A single channel sewage pump was chosen as the research object, which was a model pump produced by Grundfos [28]. The rotational speed is 1470 r/min, and the designed flow is 100.3 m3/h. The inlet and outlet diameters of the pump are 102 mm and 105 mm, and the specific speed is 167. The more detailed geometric parameters for the pump can be found in reference [21]. The experimental head at the designed flow rate is 9.2 m. The shaft power is 3250 W, and the efficiency is 78.0%.
The unstructured grid was used in this simulation. The tetrahedron was adopted in the main part, and a prism layer grid was used near the wall surface to capture the boundary layer flow. As shown in Tab. 1, the final number of grid point was 2858290 after verification of grid independence. The fluid domain and local calculation grid of the centrifugal pump are shown in Fig. 1. Compared with the experimental and calculated head, it can be seen that the trend of the predicted value is basically consistent with the experimental value. Because of simplified the computational domain in the numerical simulation, the gap between the ring and the volute was not considered, so the predicted value is slightly higher than the experimental value.
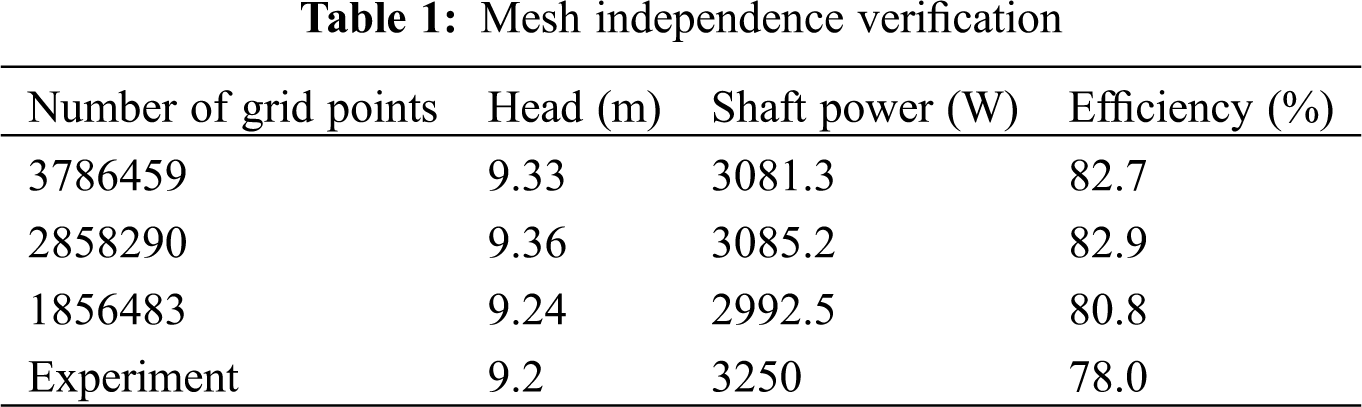
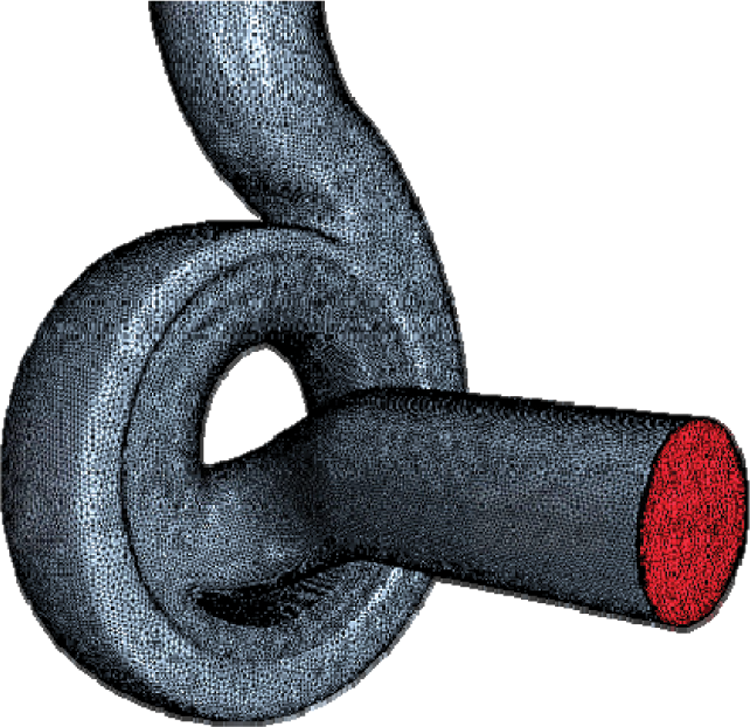
Figure 1: Computational mesh of the pump
The internal flow of the pump can be assumed to be incompressible turbulent viscous flow. The water medium is single-phase flow, while sediment laden flow is typical solid-liquid two-phase flow. The Euler algorithm can satisfy the continuity equation of solid phase, momentum equation of solid phase, continuity equation of liquid phase and momentum equation of liquid phase respectively, Euler model is suitable for solid-liquid two-phase flow. The characteristic of the Euler model is that different phases are treated as interpenetrating continuous media [29]. Since the Euler model fully considers the momentum exchange between different phases when dealing with multi-phase flows, and requires high computing hardware, it can calculate the flow field comprehensively. The mixture model can be used for two-phase flow or multiphase flow, and can usually be regarded as a simplified form of the Euler model when the inertia of the dispersed particles is relatively small. The mixed model solves the momentum equation of solid-liquid two-phase, and the velocity of discrete phase is represented by relative velocity. It is usually used in bubble flow, sedimentation and cyclone separators [30]. The dynamic equation is expressed by Navier Stokes equation, while the particle phase is based on Lagrangian method. The position and displacement of particles affect the influence of fluid on particles through resistance, so as to realize mutual coupling [31].
When the mixed model is used for calculation, the continuity equation can be listed according to the rotating coordinate system method:
Among them:
The momentum conservation equation is written as:
P is local pressure in flow field, τix is the shear stress perpendicular to the i-Axis and pointing to X, fx is mass force of unit body in X direction, V is velocity vector.
The Reynolds time averaged simulation method was used to simulation because of its better comprehensive performance [33]. At present, the most widely used model in Reynolds time averaged simulation method is k–ε model, which includes standard k–ε model, RNG k–ε model and realizable k–ε model. The standard k–ε model will produce certain distortions when calculating strong swirling flow, curved wall flow or curved streamline flow. The RNG k–ε model considers the swirling and swirling flow conditions in the average flow by modifying the turbulent viscosity, it can better simulate the three-dimensional turbulent flow field. The RNG k–ε model not only has faster calculation efficiency and is more stable in the calculation process, but also can describe a large range of turbulent flow quite accurately. Compared with the standard k–ε model, the RNG k–ε model achieves a good simulation of the solid-liquid organization in the pump, and the simulation results are in good agreement with the measured data [34]. The RNG k–ε equation is as follows [35]:
where ρ is the fluid density, μ is the dynamic viscosity, k is the turbulent kinetic energy, ε is the turbulent dissipation rate, Pk is the generation term of the turbulent kinetic energy k due to the average velocity gradient, and C1ε and C2ε are empirical constants.
where Cμ is the empirical constant, and μt is the turbulent viscosity coefficient, the expression is:
In formula (12):
μe is the effective viscosity coefficient, Eij is the time-average strain rate, Pk is the turbulent kinetic energy generation term. Constant: αk = αε = 1.39, C1ε = 1.42, C2ε = 1.68, η0 = 4.377, β = 0.012.
2.4 Boundary Conditions and Solver Settings
RNG k-ε model was used for turbulence calculation of clear water medium and sandy water medium. The velocity-pressure coupled PISO method was used in the simulations. For the space discretization, the pressure standard discretization, momentum, volume fraction, turbulent kinetic energy and turbulent dissipation rate, the second-order upwind difference scheme was used to ensure the accuracy of calculation. The sliding grid was selected for the part of the flow field of the impeller, and the static coordinate system was selected for the rest part. The Wen-Yu model was selected in the interphase resistance model of the two-phase flow. The inlet boundary condition was set as velocity inlet and the outlet boundary condition was set as free outflow. The impeller speed was set to 1470 r/min. The wall roughness was set to 0.04 mm. The non-slip wall boundary condition was adopted for the liquid phase in sediment laden flow. The free sliding wall boundary condition was adopted for solid phase. However, the smooth wall boundary condition was adopted for the water medium.
Since the reference pressure has no effect on the calculation of external characteristics of centrifugal pump, the reference pressure was set to 0. The convergence accuracy was set to 10−5. In order to improve the numerical simulation efficiency, the results of steady numerical simulation were introduced into unsteady calculation as initial boundary conditions. Since each time period in the non-steady-state numerical simulation is similar to the quasi-steady state, to ensure that the quasi-steady state converges within the maximum number of iterations and increase the accuracy of the calculation results, adjust the time step to 2.267574 * 10−4.
In the simulation, it took 180 time steps for one revolution. After 10 revolutions, it showed obvious periodicity. Then another 10 revolutions went on in the simulation, and the results of the last 5 revolutions were analyzed. The RNG k-ε model was used in the simulations, which had a high calculation accuracy for the centrifugal pump internal wall area and separation flow. The flow rate is 0.8 times of the design flow rate. The boundary conditions were the velocity inlet and the pressure outlet, and the wall treatment was no-slip. In the calculation, the position of pressure fluctuation monitoring points on the volute was shown in Fig. 2. During the unsteady calculation, the monitoring points are P1, P2, P3 and P4 along the flow direction. In every time step, the maximum iterations were set as 16.
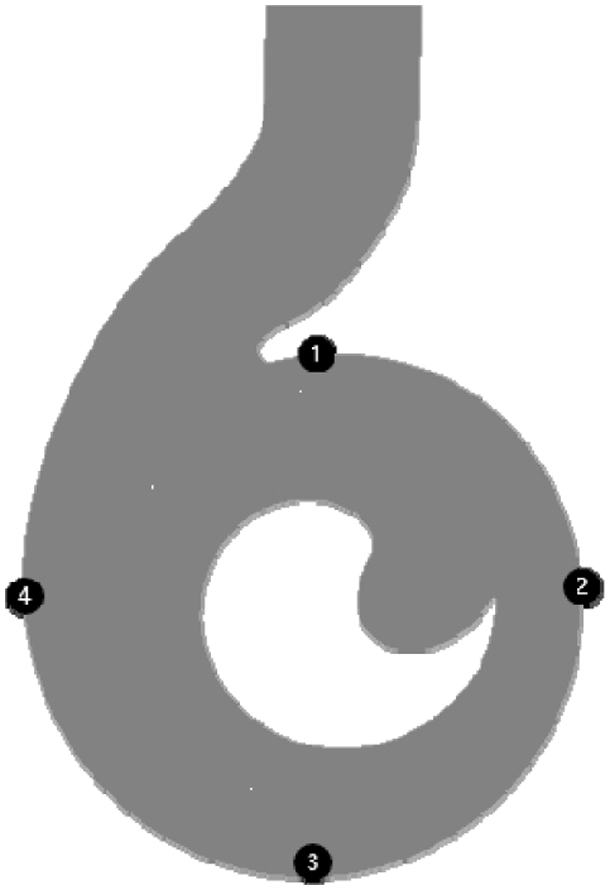
Figure 2: Monitoring points locations
In order to further verify the reliability of the calculation model, the X-direction velocity UX and Y-direction velocity UY obtained from the numerical simulation at the design flow- rate of single-phase fluid were quantitatively compared with the velocity measured by the laser Doppler velocimeter. The test table is shown in Fig. 3. The test position of the laser Doppler velocimeter was on the “V” section of the volute, and a straight line was selected on the section, as shown in Fig. 4. The ordinate Z is the position of the fluid particle, and the abscissa X is the velocity of the fluid particle. The experimental comparison is shown in Fig. 5. It can be seen that the calculated the value of UY is basically consistent with the experimental value, and the error was small. However, the error of UX in the upper part of the section is slightly larger, but the trend is basically consistent with the experimental value.
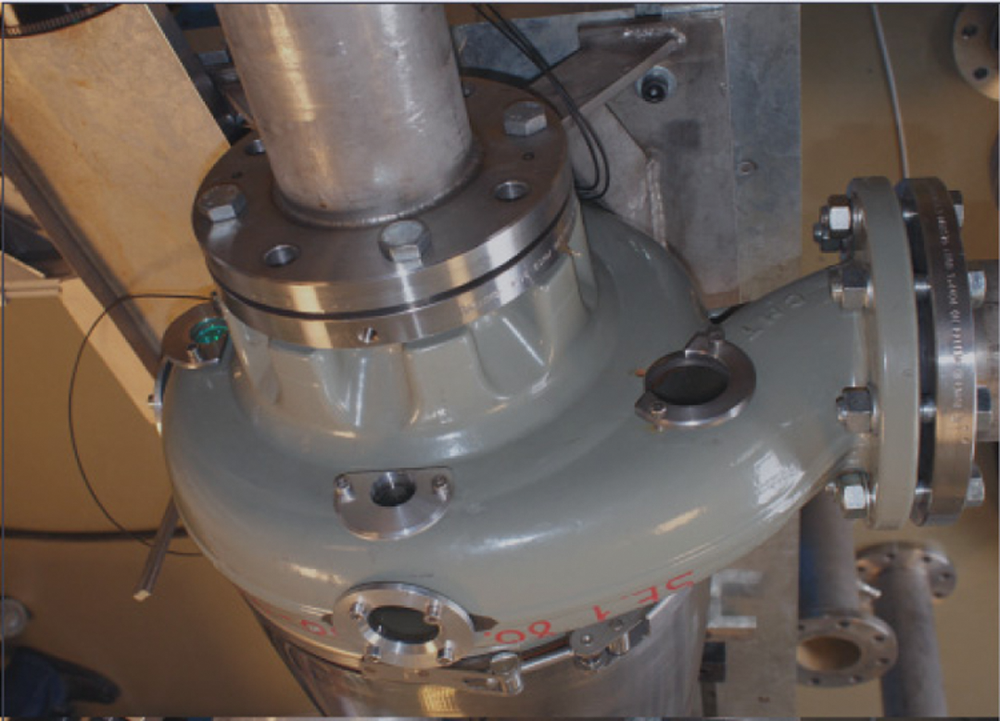
Figure 3: Pump test [35]
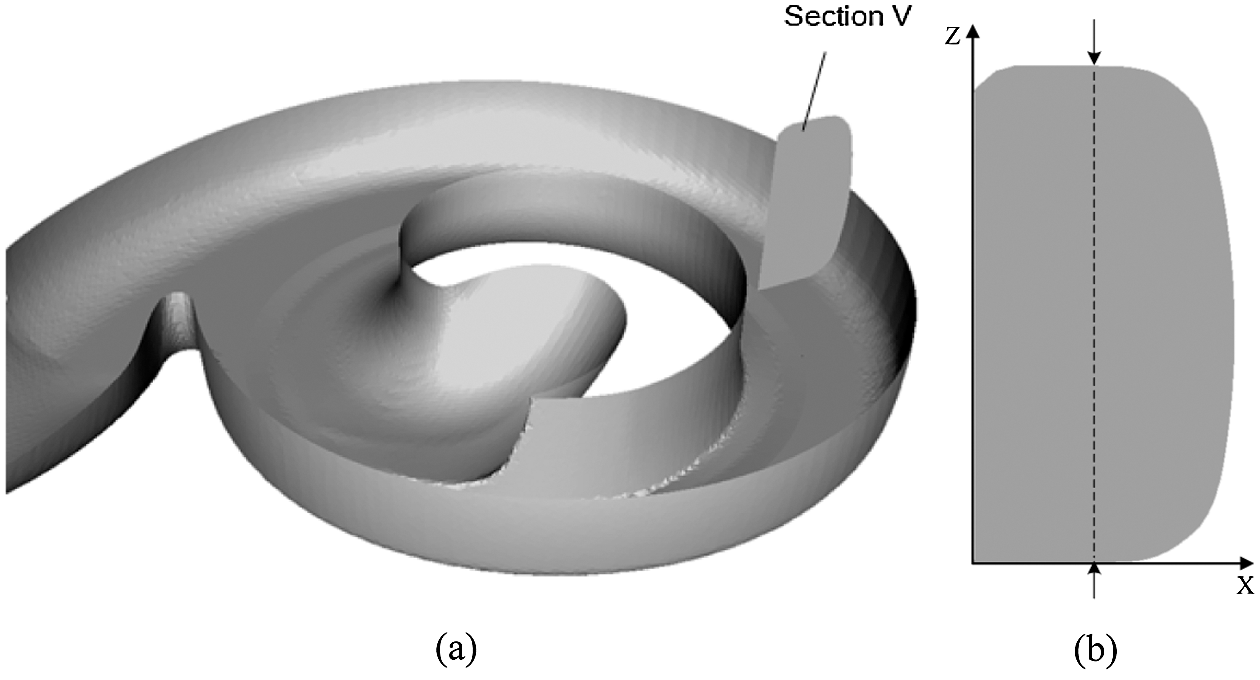
Figure 4: Cross section of volute. (a) Section V, (b) LDV test location
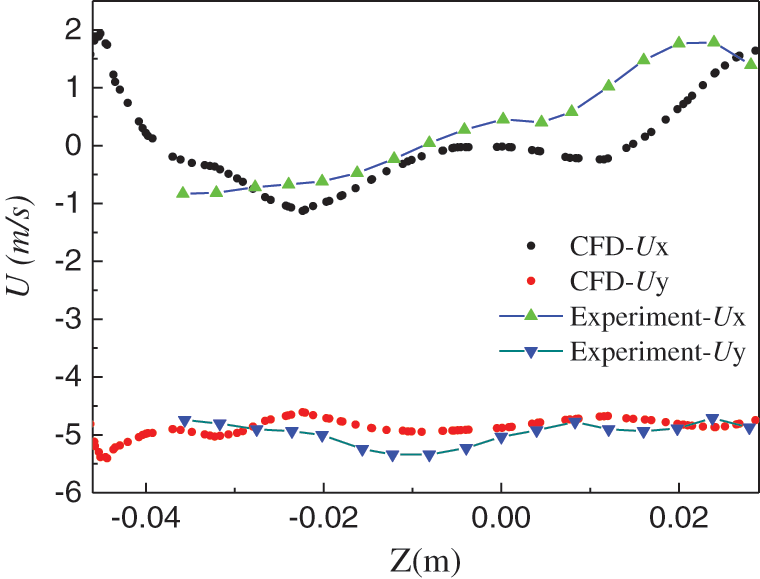
Figure 5: Test comparison [10]
3 Pressure Fluctuation of Volute
The transient pressure value was dimensionless by using pressure coefficient. The calculation formula is:
among them:
Fig. 6 shows the time domain diagram of pressure fluctuation under different particle concentrations at monitoring points P1, P2, P3 and P4, respectively. It can be seen that the pressure fluctuation waveforms of the four monitoring points show obvious periodic changed, and the time interval between the two adjacent peaks was 0.04 s. The maximum value of CP in positive direction was greater than that in negative absolute value. P2 monitoring point has the largest range of pressure fluctuation. The pressure fluctuation of P1 monitoring point near the tongue was small. The peak values of P3 and P4 were in the middle and relatively closed. With the increased of particle concentration, the pressure fluctuation amplitude of the four monitoring points increased.
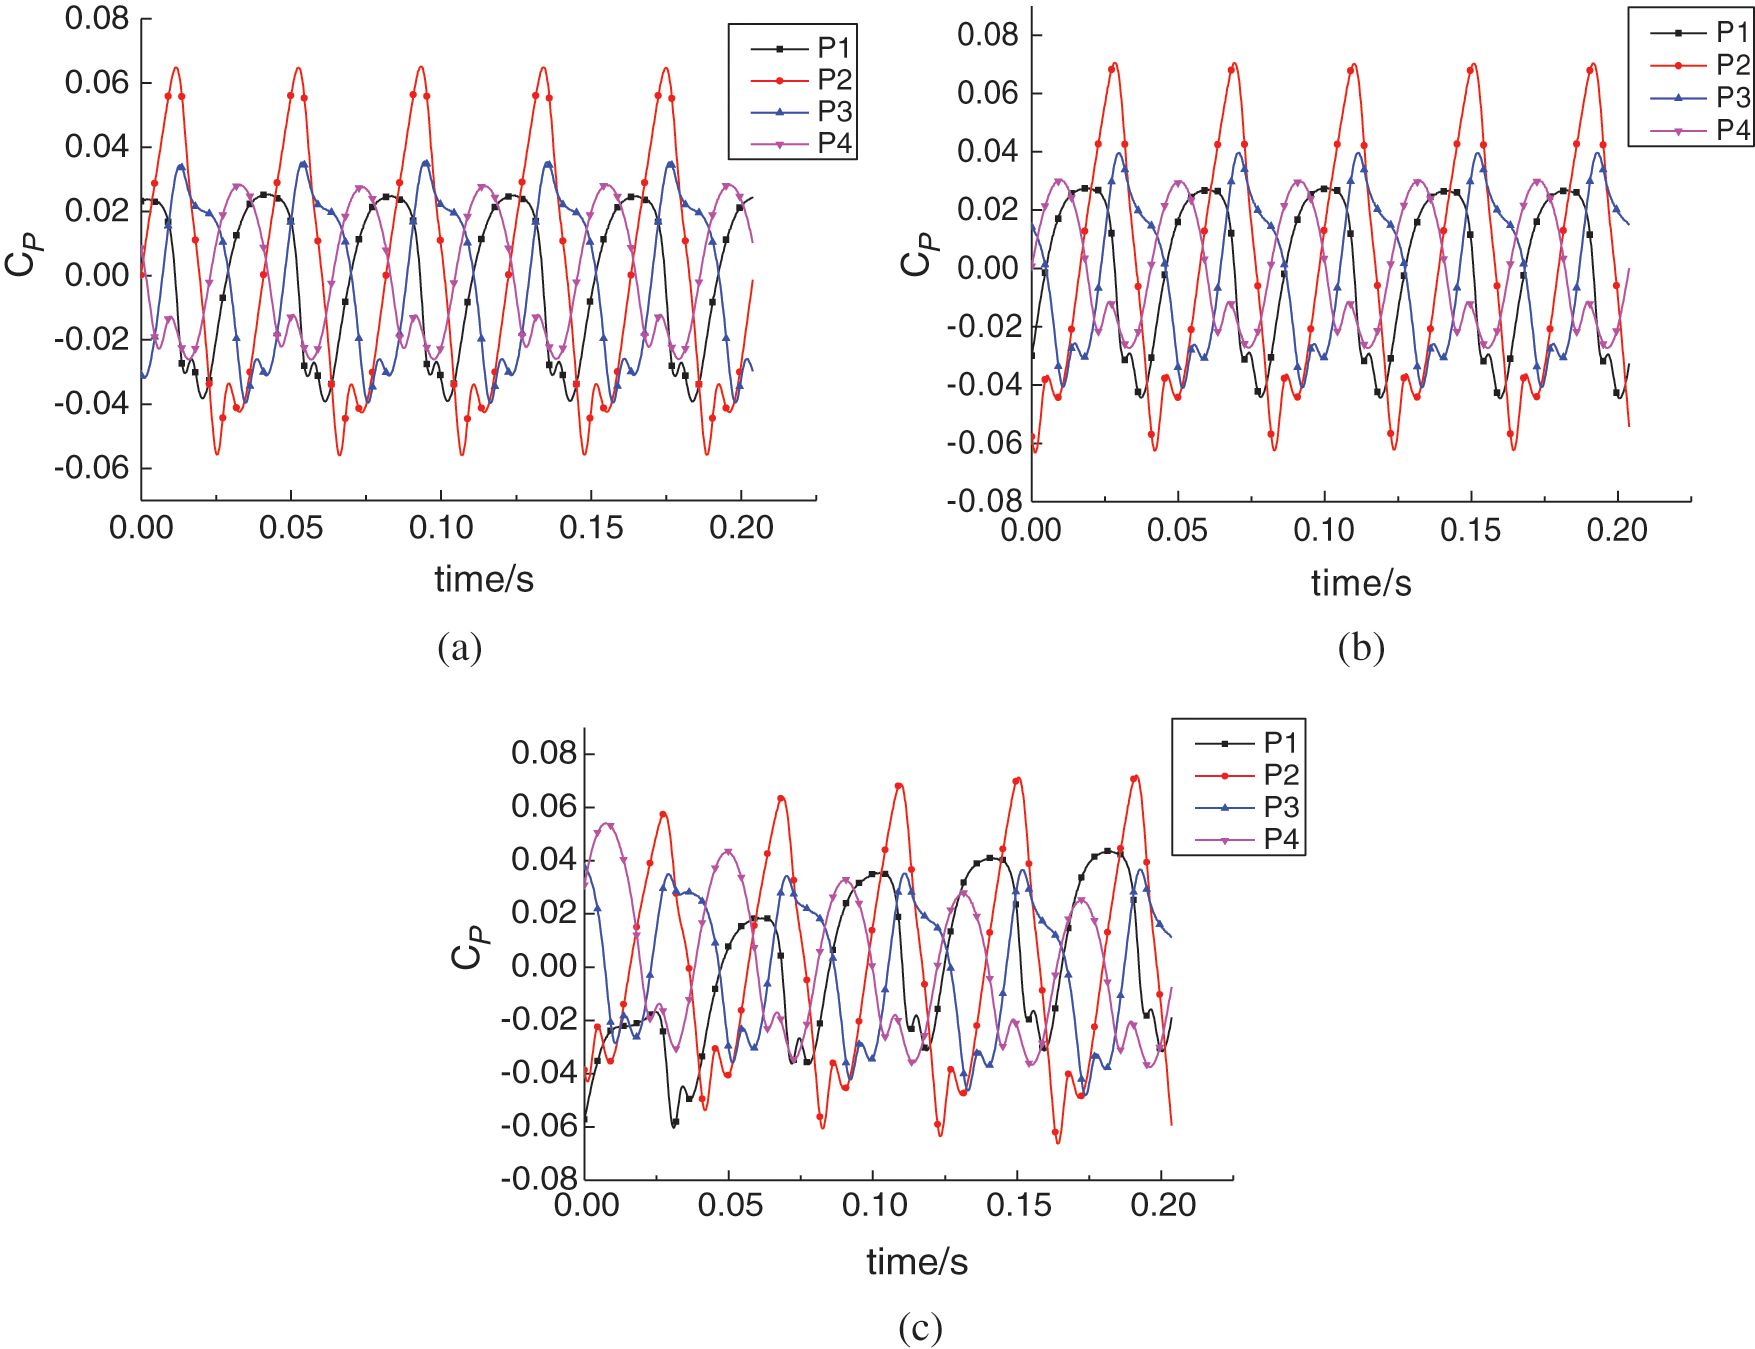
Figure 6: Pressure fluctuations at monitoring locations of volute. (a) 5% particle concentration, (b) 10% particle concentration, (c) 15% particle concentration
Fig. 7 shows the frequency domain diagram of P1–P4 pressure pulsation obtained by FFT. It shows that the four monitoring points all exhibited similar pressure pulse frequency domain characteristics. It can be seen from Figs. 7(a)–7(c) that under low flow conditions, the maximum pressure fluctuation amplitude of each monitoring point appeared at the blade frequency of about 25 Hz. The largest pressure fluctuation amplitude was at the P2 monitoring point, with the smallest at the P4 monitoring point near the outlet. Under low flow rate conditions, with the increase of particle concentration, the pressure fluctuation amplitude of the four monitoring points increased (Figs. 6(a) and 6(b)). When the particle concentration increased from 5% to 15%, the pressure fluctuation amplitudes of P1, P2 and P3 first increased and then decreased, while the pressure fluctuation amplitude of P4 near the outlet increased. The amplitude of pressure fluctuation of the four monitoring points was relatively small. The pressure fluctuation amplitude of P2 was always high, and the pressure fluctuation amplitudes of the other three were relatively close and relatively small compared with P1.
Fig. 8 shows the pressure pulsations of four monitoring points at different inlet particle concentrations under rated conditions. Fig. 9 shows the pressure pulsation diagram of four monitoring points with different inlet particles under high flow rate conditions. The overall change in trend of pressure fluctuation at each monitoring point under rated condition and high flow rate conditions showed little difference to that under low flow conditions. It can be concluded that the pressure fluctuation amplitude of each monitoring point in the volute increased with the increase of flow rate under the same inlet particle concentration.
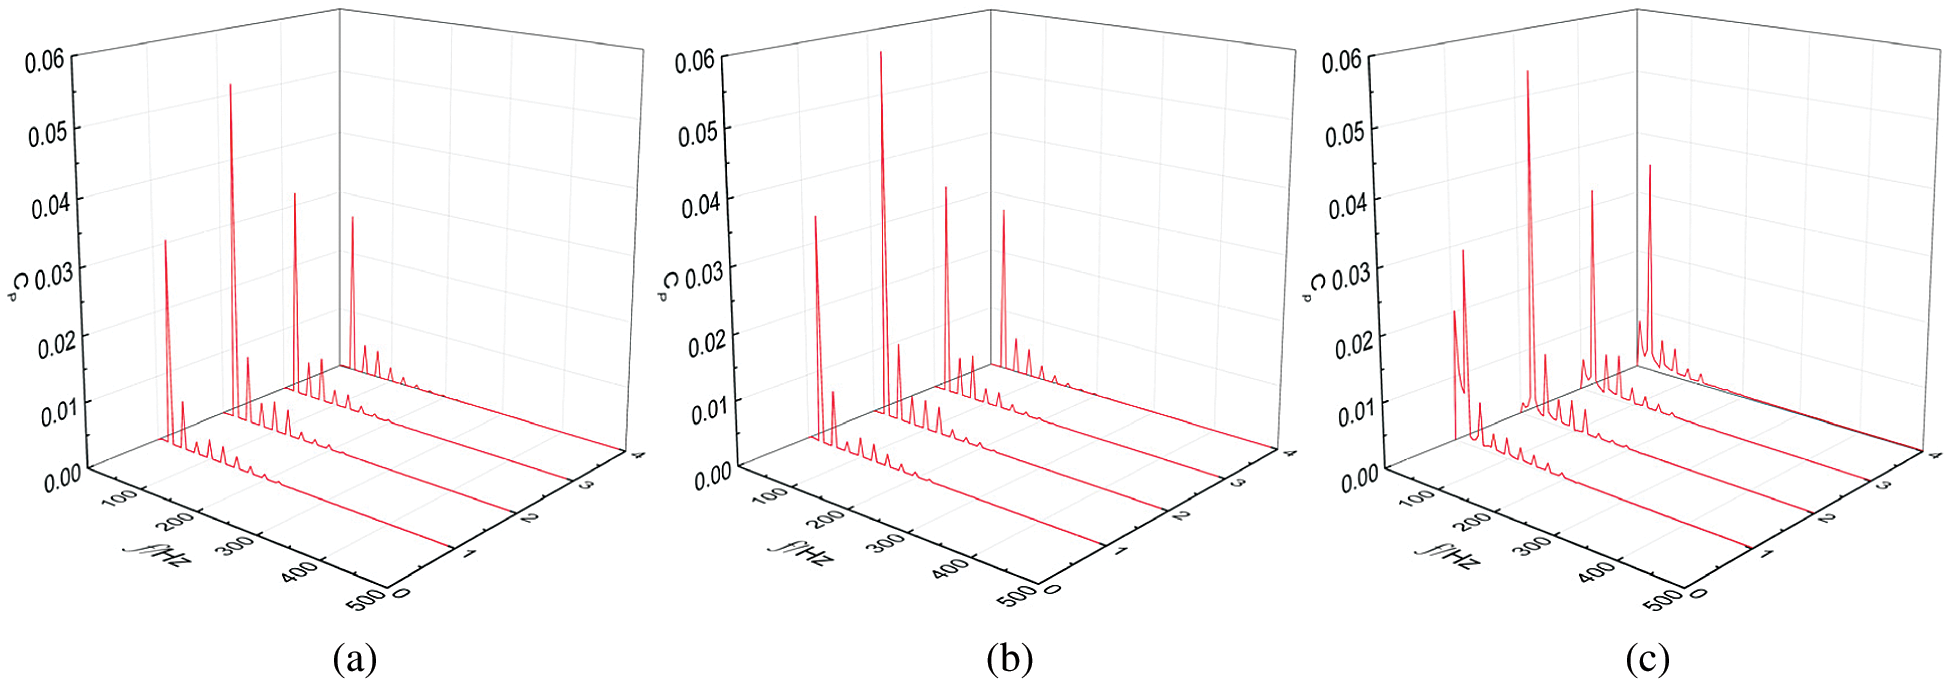
Figure 7: Frequency domain diagram of pressure pulsation at the monitoring point on the volute under low flow conditions. (a) 5% particle concentration, (b) 10% particle concentration, (c) 15% particle concentration
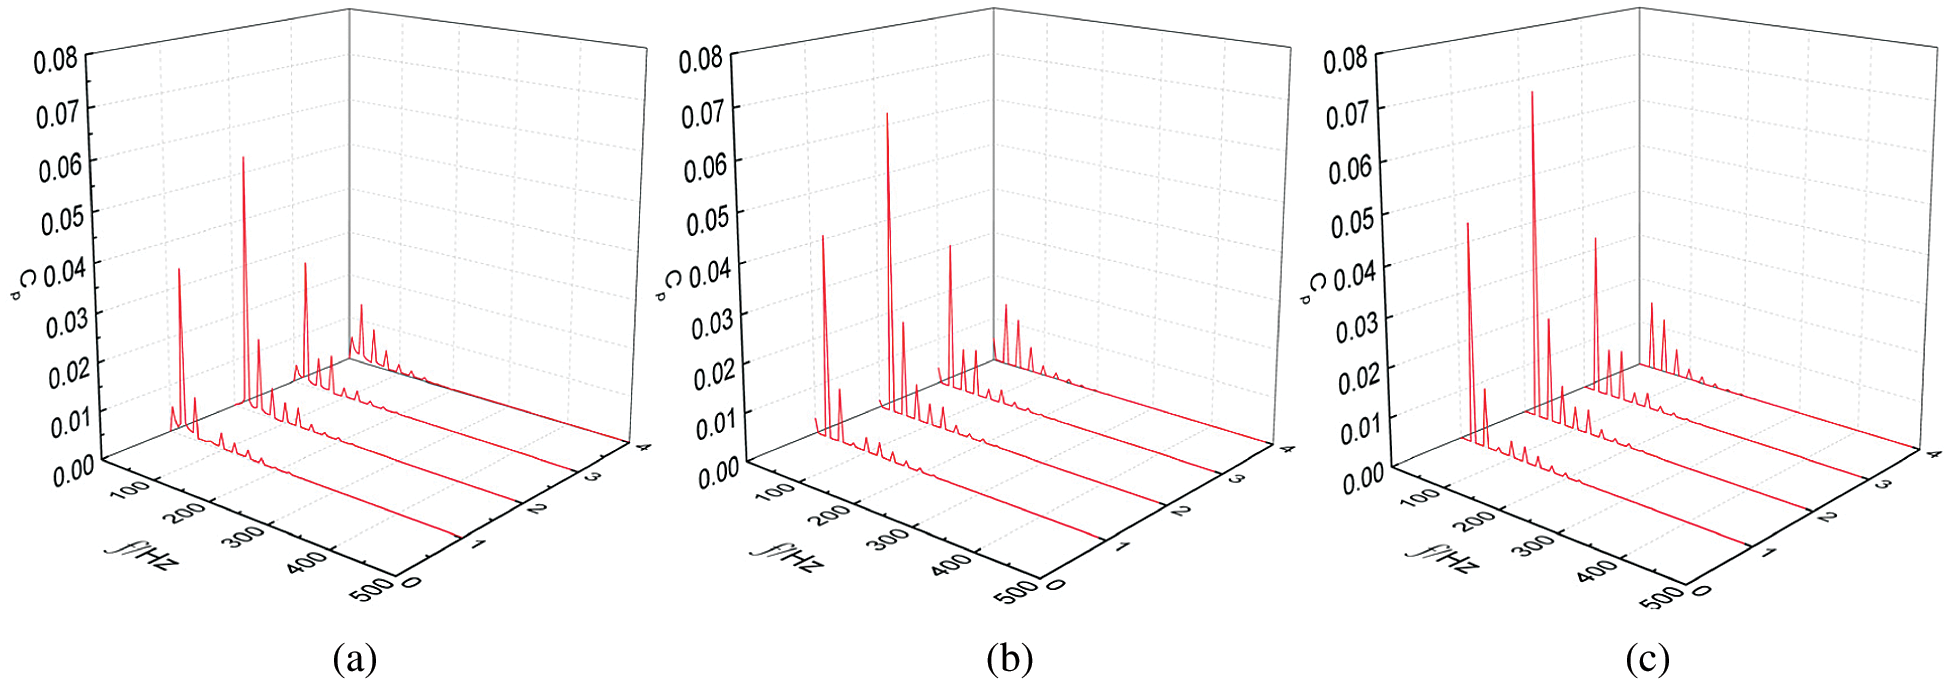
Figure 8: Frequency domain diagram of pressure pulsation at the monitoring point on the volute under rated flow conditions. (a) 5% particle concentration, (b) 10% particle concentration, (c) 15% particle concentration
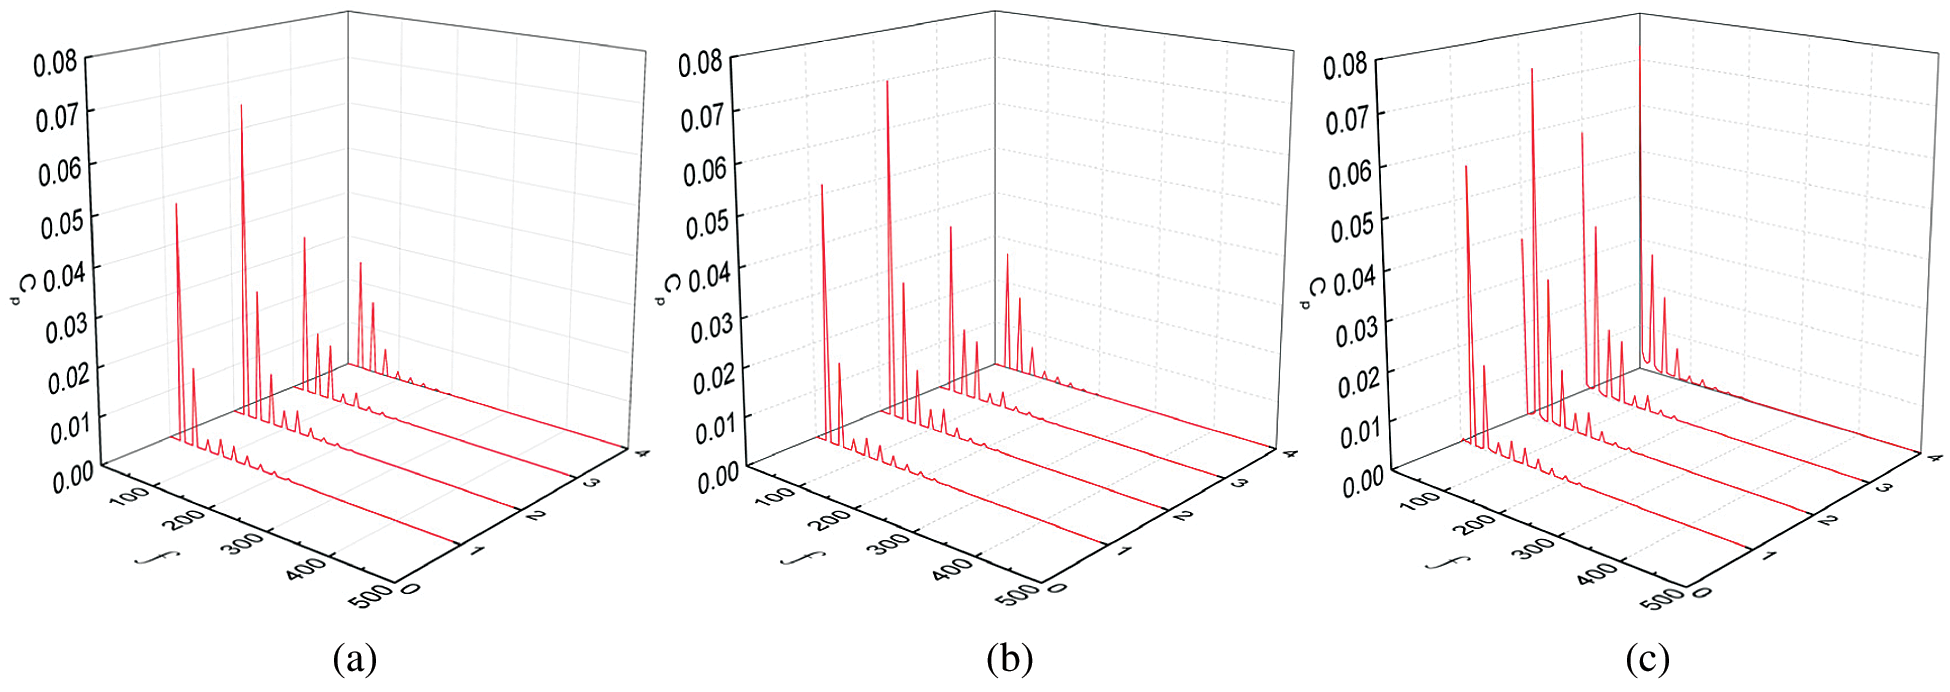
Figure 9: Frequency domain diagram of pressure pulsation at the monitoring point on the volute under high flow conditions. (a) 5% particle concentration, (b) 10% particle concentration, (c) 15% particle concentration
4 Flow Field Analysis in the Volute
Four typical moments of impeller rotation were selected in order to observe the secondary flow changes in the volute, with T a rotation period of the impeller. The distribution of particles in the volute with different particle concentrations was observed in a cycle and the variation characteristics of secondary flow in the volute were analysed based on the cross-section pressure distribution and streamline diagram. Fig. 10 shows that distribution of the volume fraction of particles in the volute changed periodically with the rotation of the impeller at low flow rate. In one cycle, the distribution of particles on the impeller wall showed little changed. The volume fraction of the volute from the tongue to the eighth section along the flow direction was high, with a maximum value of 5.4%. The area with lower particle volume fraction appeared in the tongue. On the blade surface, the particle volume fraction of the leading edge near the blade suction side was lower, while the fraction of pressure side was higher. Fig. 10 shows that the particle content distribution on the blade surface did not change with the rotation of the blade. The particle volume fraction increased gradually from the the minimum value on the suction side to the local maximum value at the trailing edge. It can be seen from the 1/2T and 3/4T diagrams that the volume fraction of particles on the suction surface of the blade increased gradually. The particle volume fraction distribution on the side of the volute is shown at 0 and 1/2T. The volume fraction of particles near the suction side and the leading edge was small, and gradually increased toward the outside. On the pressure side, the volume fraction of particles on the volute side was larger than that on the suction side, especially at the region near the trailing edge.
Comparing Figs. 10(a)–10(c), it can be seen that with the increase of particle concentration, the volume fraction of particles on the volute wall also increased, with an increase range almost directly proportional to the particle concentration at the inlet of centrifugal pump.
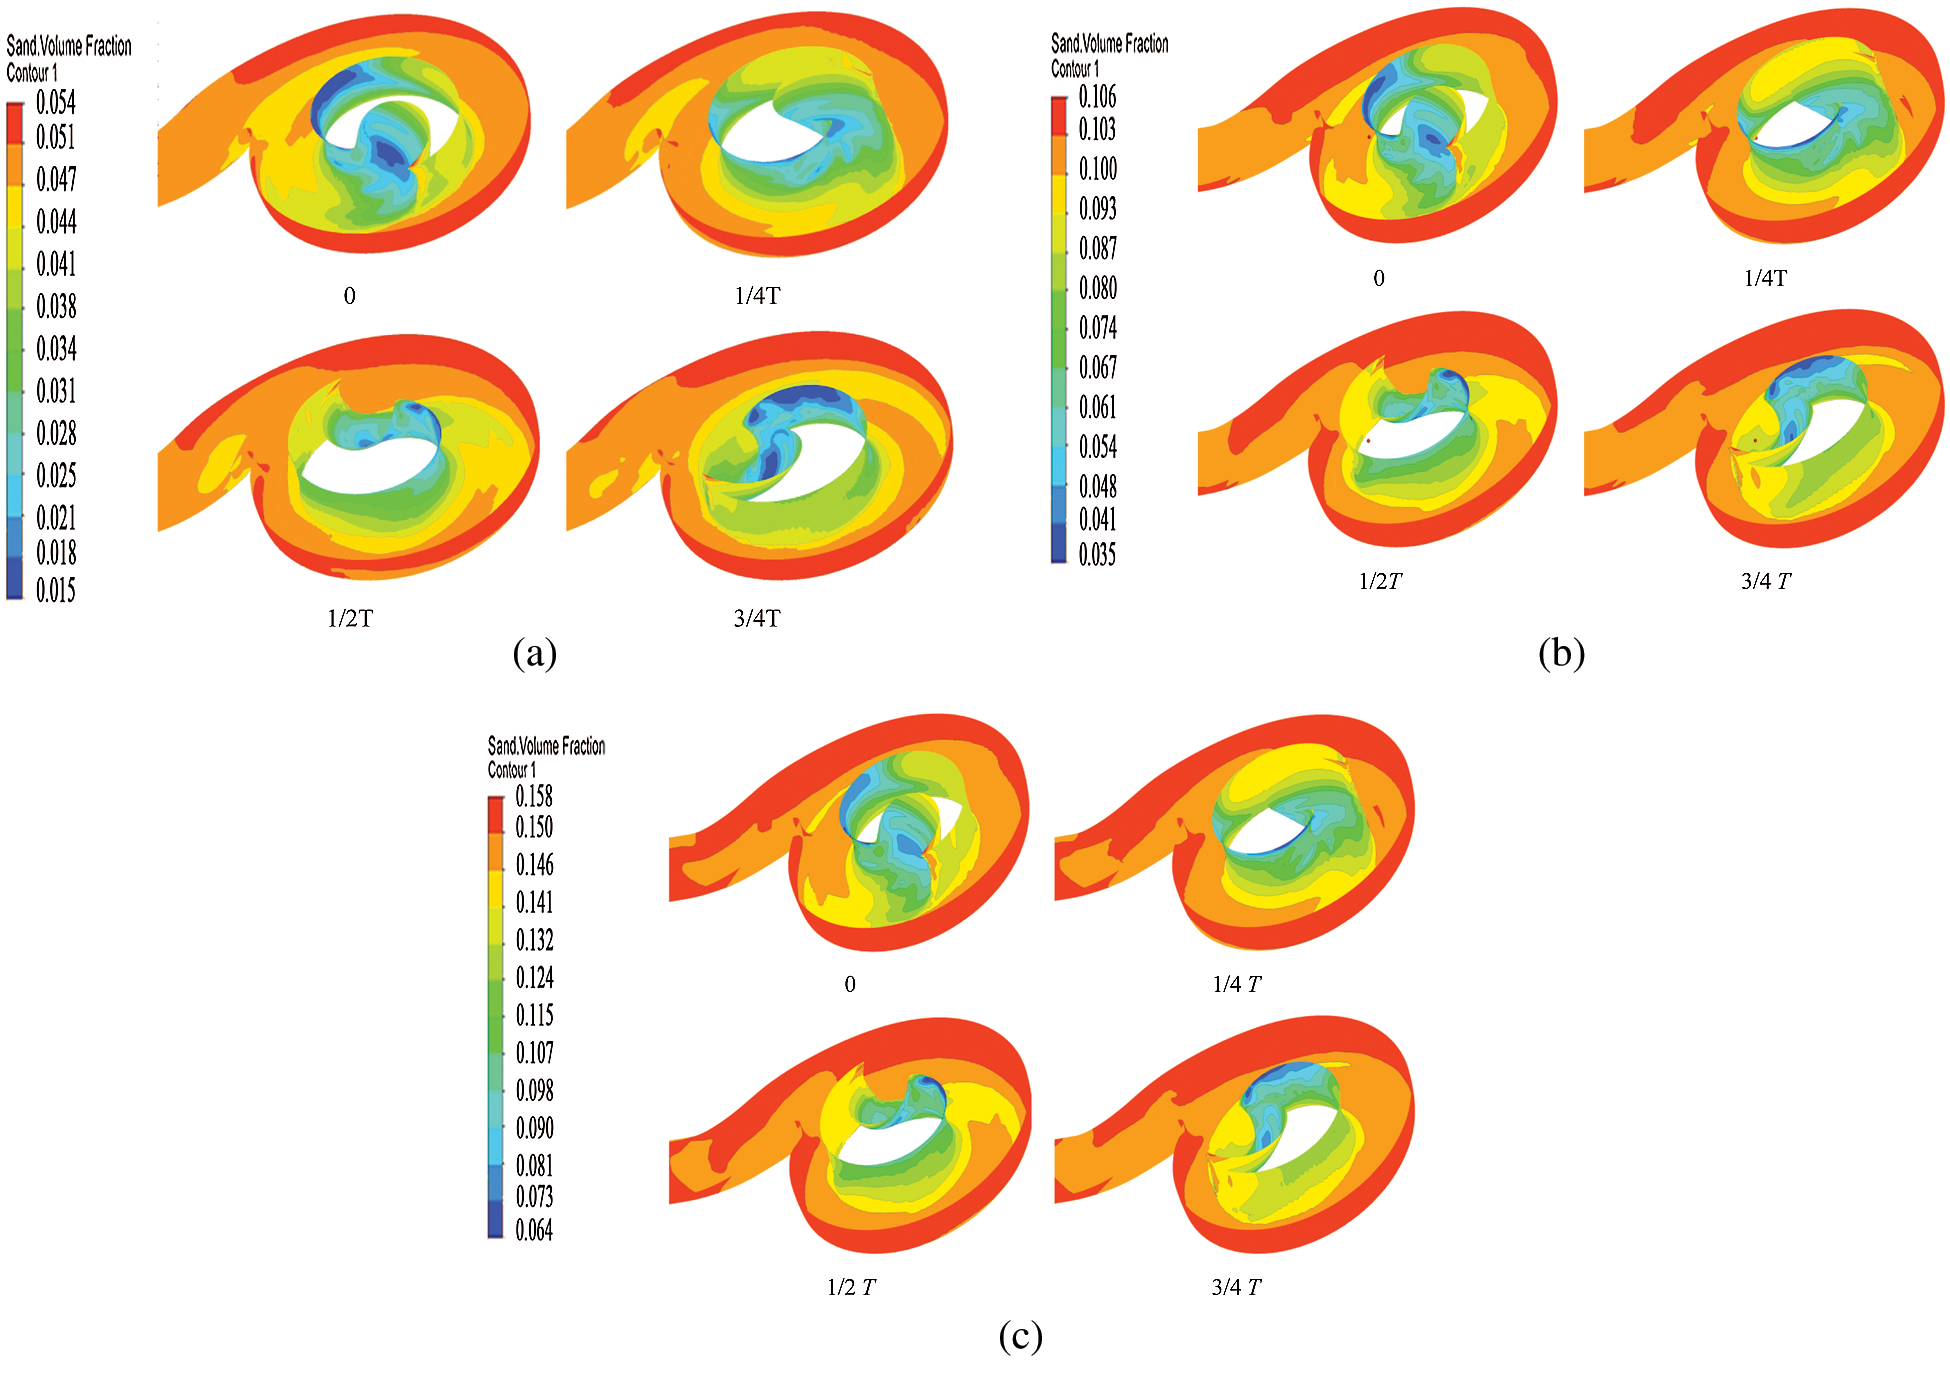
Figure 10: Volume fraction of volute wall particles. (a) 5% particle concentration (b) 10% particle concentration (c) 15% particle concentration
Fig. 11 shows that the radial force vector diagram of the impeller of single blade sewage pump under three flow-rate conditions. The X-axis and Y-axis represent the radial force of spiral case in the X-direction and Y-direction, respectively. The results show that the radial force of the impeller of a single blade centrifugal pump changed periodically, presenting symmetrical distribution at low flow rate and four different particle concentrations. The peak radial force was at its largest at a particle concentration of 15%. When the particle concentration increased from 0% to 10%, the radial force also increased, and when the particle concentration increased from 10% to 15%, the radial force in the Y-direction also increased, while the radial force in the X-direction was largely unchanged. For four different particle concentrations, the radial force in the positive direction of the X-axis was greater than that in the negative direction at two points with the same absolute value on the X-axis. With the particle concentration increases, the magnitude of the radial force gradually increased.
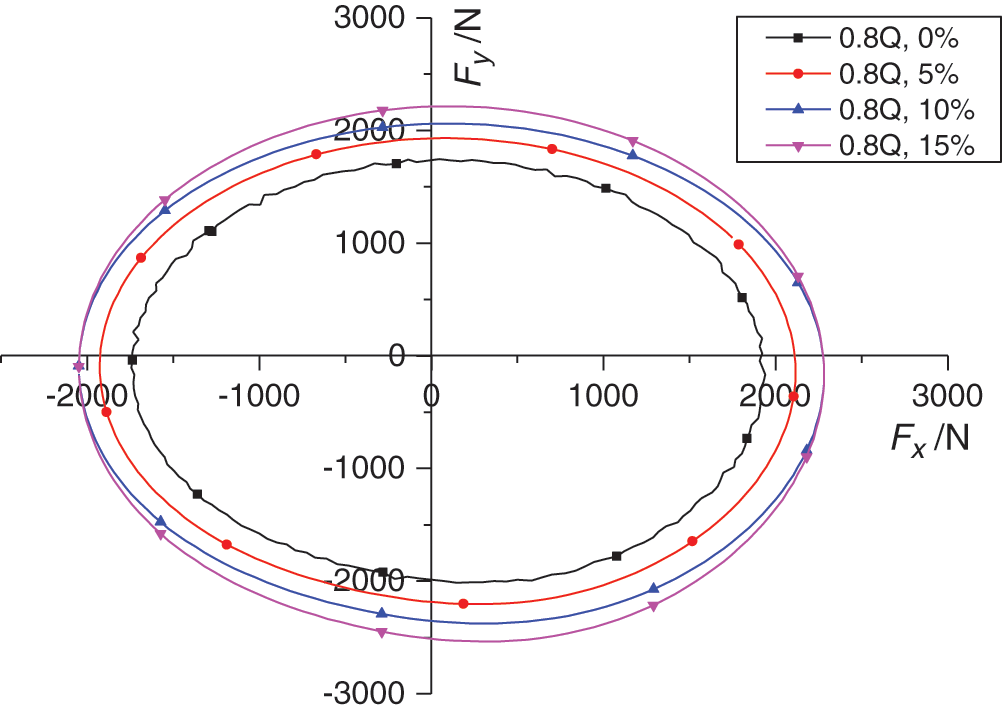
Figure 11: Radial force of impeller
It shows that the pressure distribution of one cycle under low flow condition when the inlet particle concentration is 5% in Fig. 12(a). We can find that the pressure changed periodically. At 0, the maximum pressure distribution was at the bottom of the volute near the wall surface and the volute outlet near the tongue. A small part of the pressure is also higher on the tongue. The minimum pressure was distributed on the suction side of the blade and increases gradually along the leading edge to the trailing edge. At 1/4T, the high pressure region of flow field on the cross-section expanded, mainly concentrated near the volute outlet. When the blade turns to 1/2T, the tail appeared at the blade head, and the pressure on the suction side changed gradually. With the rotating of the blade, the high pressure area of the fluid in the volute decreased gradually. When it turns to 3/4T, the high-pressure area was mainly located at the bottom of the volute, and the low-pressure area was always near the suction side of the blade.
Figs. 12(b) and 12(c) show the pressure distribution in the 1/2T volute when the inlet particle concentration is 10% and 15%, respectively. It can be concluded that the pressure of the whole volute increased with the increase of the inlet particle concentration under low-flow-rate condition.
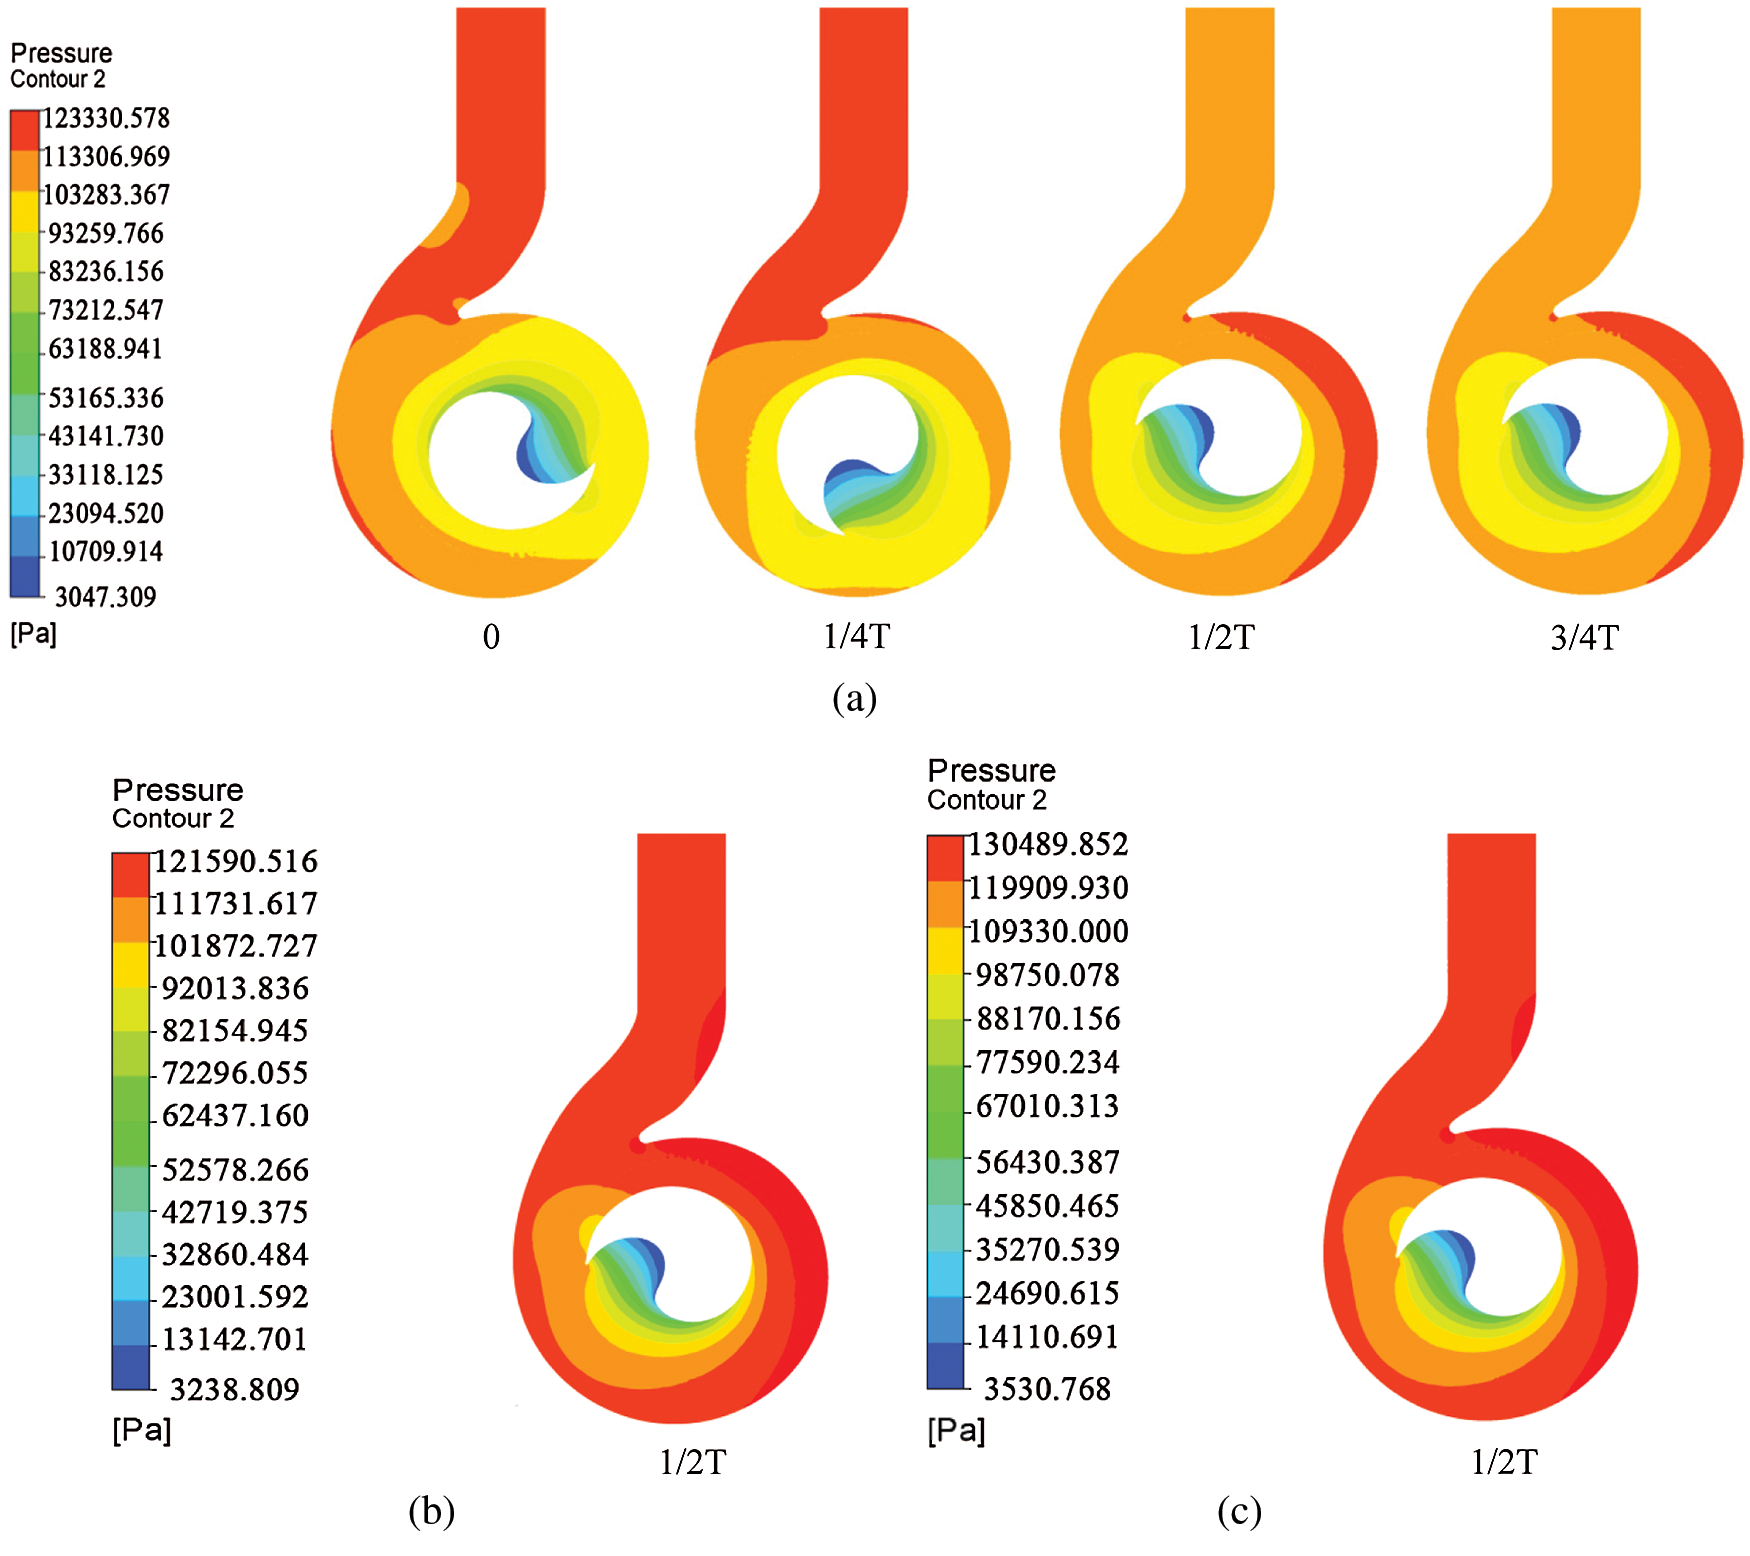
Figure 12: Fluid pressure cloud diagram of the internal cross section of the volute. (a) 5% particle concentration (b) 10% particle concentration (c) 15% particle concentration
It shows that the flow diagram of one cycle of the volute with a low flow rate condition and a particle concentration of 5% at the inlet in Fig. 13(a). It can be found that the flow in the pump is relatively stable, and the back-flow occurred on the suction surface of the blade near the inlet of the impeller. The shape, size and position of the vortex did not change significantly with the rotation of the blade. From the partition tongue along the flow direction to the Section IV, a part of the blank area appeared near the blade direction. With the rotation of the blade, when the pressure side of the blade rotated to the fourth section along the flow direction, the blank area was the largest, because of the sand particles entered the volute. With the rotation of the blade, the sand particles were close to the outer edge due to the impelling of the blade and the centrifugal force, while the area near the middle was blank, so the sand content was less. When the suction surface and blade head were close to the diaphragm, the distribution of sand particles from the baffle plate to Section IV was stable and uniform.
Figs. 13(b) and 13(c) show the flow field diagram in the volute at 1/2T under 10%, 15% of the particle concentration, respectively. It can be obtained that under low flow rate conditions, as the particle concentration increased, the flow field at the outlet of the volute starts to appeared turbulent. When the particle concentration reached to 15%, a backflow vortex appeared at the outlet.
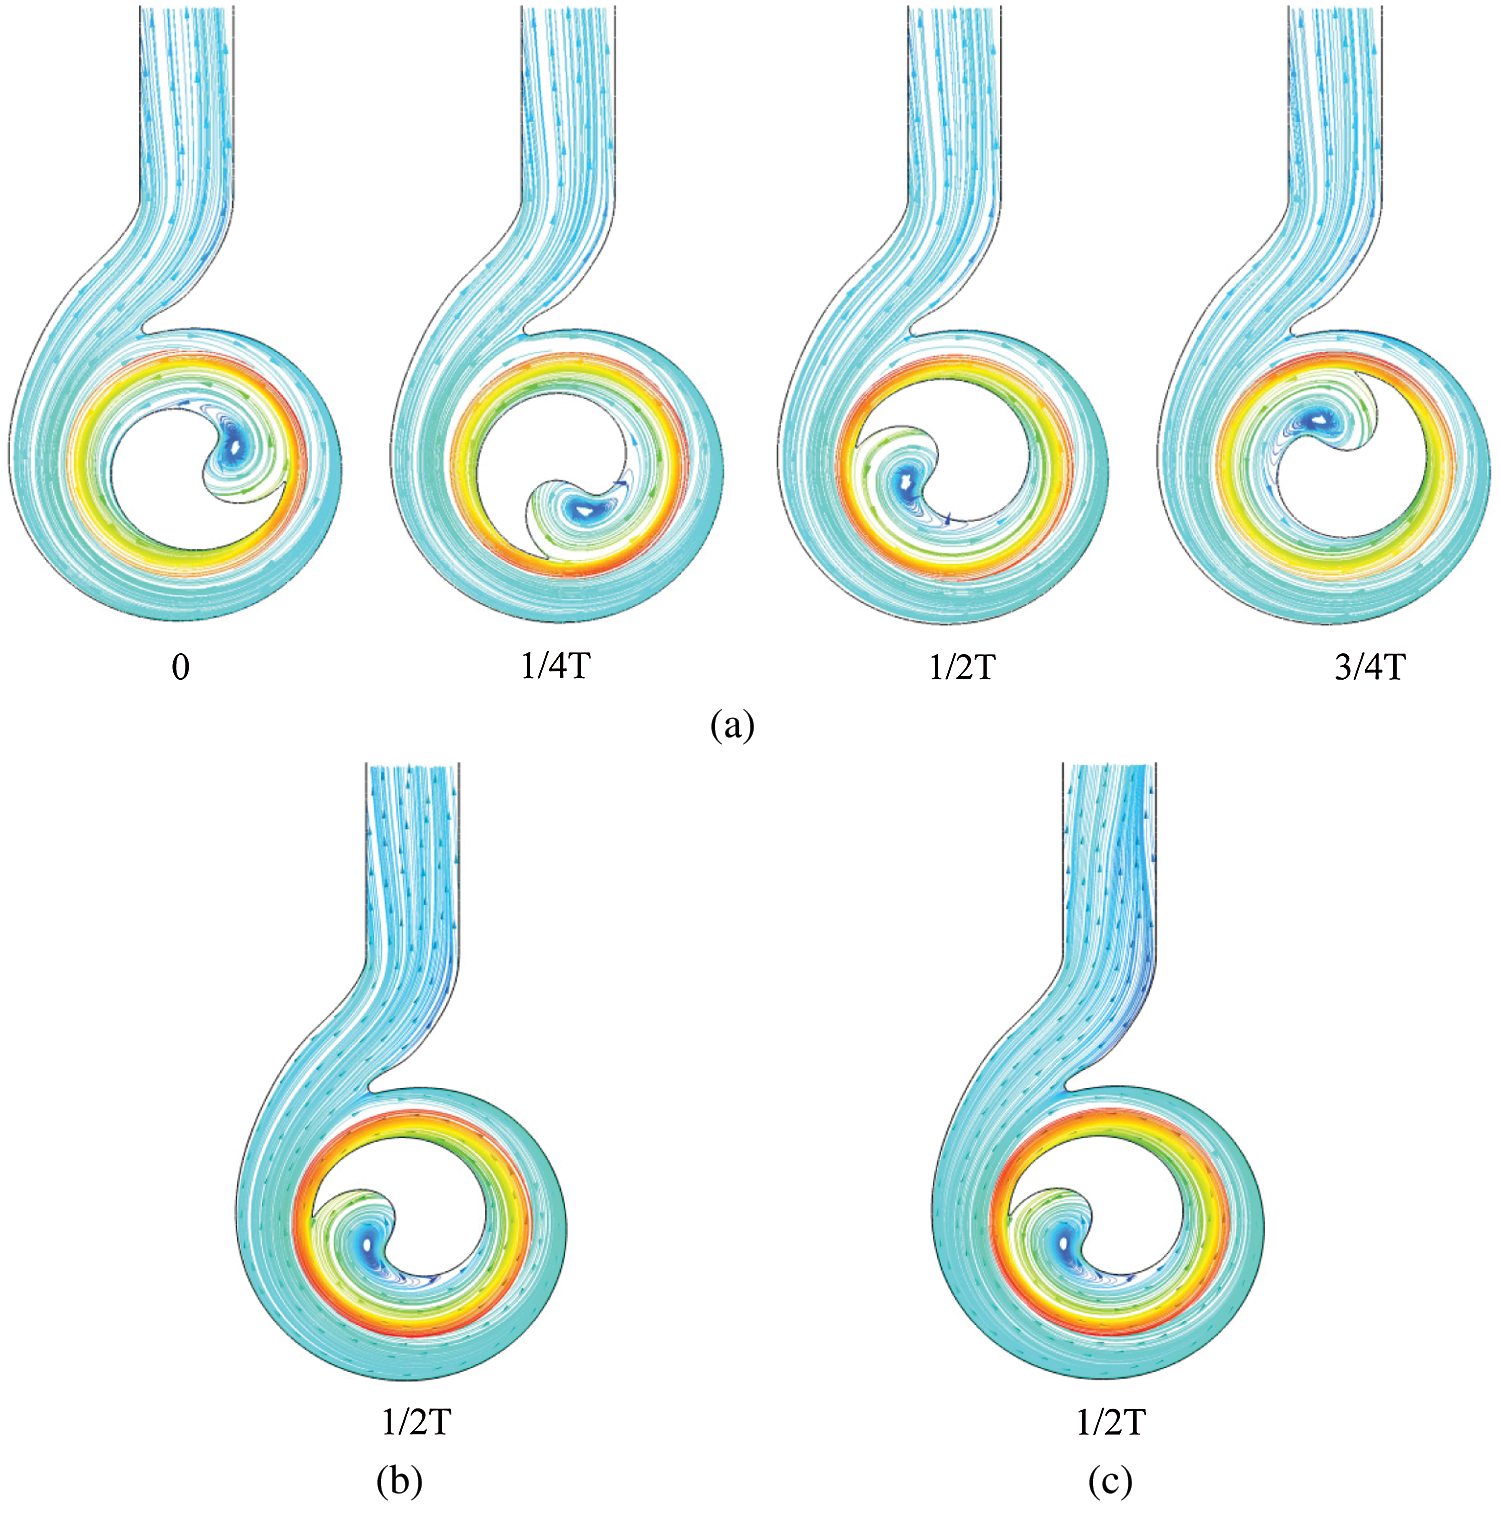
Figure 13: Flow diagram inside the volute. (a) 5% particle concentration (b) 10% particle concentration (c) 15% particle concentration
The RNG k-ε turbulence model was used to numerically simulate the internal flow field of a single-channel sewage pump at three different particle concentrations under low flow rate conditions. The particle volume fraction and volute pressure pulsation characteristics of the sewage pump under different operating conditions were also simulated. The following conclusions can be made:
1. The main frequency of the pressure pulsations on the volute casing is the rotational frequency of the impeller (25 Hz). With frequency increases, the amplitude of the pressure pulsations gradually decreases. At the same time, with increases of particle concentration, the pressure pulsation amplitude at the monitoring point P4 near the outlet also increases; the pressure pulsation amplitude at the others points first increases, then decreases, with a small amplitude. The pressure pulsation amplitude at each monitoring point increases with the flow rate under the same particle concentration conditions.
2. Under low flow rate conditions, the distribution of particle volume fraction in the volute exhibits periodic changes with the rotation of the impeller. In one cycle, the distribution of particles on the wall and the surface of the impeller is largely unchanged. The volume fraction of the volute from the partition tongue along the flow direction to Section VIII of the volute is higher; the maximum value reaches 5.4% and an area with a lower volume fraction of particles occurs at the partition tongue. On the blade surface, the particle volume fraction is lower on the impeller suction surface and blade head, and higher on the blade pressure side and trailing edge. With the rotation of the blade, the particle content distribution on the blade surface does not changed. The particle volume fraction gradually increases from the blade suction surface to the position of the blade trailing edge. The particle volume fraction reaches the minimum value on the blade suction surface and the local maximum value on the blade trailing edge. As the particle concentration increases, the particle volume fraction of the volute wall surface also increases. The increase in amplitude is almost proportional to the particle concentration at the inlet of the centrifugal pump.
3. The pressure distribution in the volute shows a significant periodic change and a small high-pressure region forms at the trailing edge of the blade. The area and pressure of the high-pressure area also changes periodically with the rotating of the impeller. The pressure increases with the increase of particle concentration.
4. The back flow vortex appears on the suction surface of the blade close to the inlet of the impeller. Its shape and size are largely unchanged as the flow rate increases. Under low flow rate conditions, as the particle concentration increase, the flow field at the outlet of the volute starts to appear turbulent. When the particle concentration reaches 15%, a backflow vortex appears at the outlet.
Funding Statement: The authors gratefully acknowledge the financial supports given by the Welfare Technology Applied Research Project of Zhejiang Province (No. LGG21E090003) and Open Research Subject of Research Center on Levee Safety Disaster Prevention, Ministry of Water Resources.
Conflicts of Interest: The authors declare that they have no conflicts of interest to report regarding the present study.
1. Guan, X. F., Zhu, R. S. (1995). Experimental study on single vane centrifugal pump. Journal of Agricultural Engineering, 10(3), 116–120. [Google Scholar]
2. Zhang, H., Chen, B., Shi, W. D., Wang, B. Q., Wang, Z. (2016). Numerical calculation and oil film test research of internal flow field of single-blade screw centrifugal pump. Journal of Drainage and Irrigation Machinery Engineering, 34(5), 381–385. [Google Scholar]
3. Kim, J. H., Cho, B. M., Kim, Y. S., Choi, Y. S., Kim, K. Y. et al. (2016). Optimization of a single-channel pump impeller for wastewater treatment. International Journal of Fluid Machinery and Systems, 9(4), 370–381. [Google Scholar]
4. Ji, P., Yuan, S. Q., Yuan, J. P. (2013). Numerical analysis of periodic flow unsteadiness in a single-blade centrifugal pump. Science China Technological Sciences, 56(1), 212–221. [Google Scholar]
5. Nishi, Y., Fujiwara, R., Fukutomi, J. (2009). Design method for single-blade centrifugal pump impeller. Journal of Fluid Science & Technology, 4(3), 786–800. [Google Scholar]
6. Benra, F. K., Dohmen, H. J., Sommer, M. (2005). Periodically unsteady flow in a single-blade centrifugal pump: Numerical and experimental results. ASME 2005 Fluids Engineering Division Summer Meeting, pp. 1223–1231. Houston, USA. [Google Scholar]
7. Katz, J. (1995). Relationship between unsteady flow, pressure fluctuations, and noise in a centrifugal pump-part B: effects of blade-tongue interactions. Journal of Fluids Engineering, 117(4), 31–36. [Google Scholar]
8. Benra, F. K. (2006). Numerical and experimental investigation on the flow induced oscillations of a single-blade pump impeller. Journal of Fluids Engineering, 128(4), 783–793. [Google Scholar]
9. Brun, K., Kurz, R. (2005). Analysis of secondary flows in centrifugal impellers. International Journal of Rotating Machinery, 2005(1), 45–52. [Google Scholar]
10. Zhou, P. J., Liu, T., Mou, J. G., Gu, Y. Q., Ren, Y. (2018). Study on unsteady characteristics of secondary flow in volute of single-blade centrifugal pump. Journal of Agricultural Machinery, 9(1), 130–136. [Google Scholar]
11. Burgreen, G. W., Antaki, J. F., Griffith, B. P. (1996). A design improvement strategy for axial blood pumps using computational fluid dynamics. Asaio Journal, 42(5), M354–60. [Google Scholar]
12. Ali, H. (2020). Hybrid nanofluids for convection heat transfer. Academic Press, Elsevier. [Google Scholar]
13. Tarip, H. A., Anwar, M., Malik, A., Ali, H. M. (2020). Hydro-thermal performance of normal-channel facile heat sink using TiO2-H2O mixture (Rutile-Anatase) nanofluids for microprocessor cooling. Journal of Thermal Analysis and Calorimetry, 2020(2), 1–16. [Google Scholar]
14. Liu, J. H., Zhu, M. Y. (2011). Numeration simulation of solid-liquid two-phase flow in centrifugal sewerage pump. Applied Mechanics & Materials, 44–37(2), 345–348. [Google Scholar]
15. Zhang, Y., Yi, L. I., Cui, B., Zhu, Z., Dou, H. (2013). Numerical simulation and analysis of solid-liquid two-phase flow in centrifugal pump. Chinese Journal of Mechanical Engineering, 26(1), 53–60. [Google Scholar]
16. Zhao, B. J., Yuan, S. Q., Liu, H. L., Huang, Z. F., Tan, M. G. (2008). Calculation of solid-liquid two-phase turbulent flow in full flow channel of dual-channel pump based on Mixture multi-phase flow model. Journal of Agricultural Engineering, 24(1), 7–12. [Google Scholar]
17. Shi, W. D., Long, F., Zhang, D. S., Leng, H. F., Wang, G. T. (2012). Numerical simulation of solid-liquid two-phase flow inside submersible axial flow pump. Journal of Drainage and Irrigation Machinery Engineering, 30(5), 508–512. [Google Scholar]
18. Lu, B. B., Liu, H. L., Tan, M. G., Liu, K. (2009). Numerical analysis of unsteady solid-liquid two-phase flow in a dual-channel pump. Agricultural Mechanization Research, 31(5), 34–37. [Google Scholar]
19. Cao, W. D., Jiang, X., Zhang, Q., Xu, Y. M. (2019). Solid-liquid two-phase flow and characteristic analysis of semi-open cutting pump. Journal of Jiangsu University (Natural Science Edition), 40(5), 531–537. [Google Scholar]
20. Wang, L. J., Song, W. W., Chang, F. Y., Zhang, M. Z. (2019). Influence of particle concentration on unsteady characteristics of high specific speed centrifugal pump. Thermal Power Engineering, 34(8), 50–56. [Google Scholar]
21. Xiao, Y. X., Fang, B., Zeng, C. J., Yang, L. B., Wang, F. et al. (2013). Erosion predictions of stock pump impellers based on liquid-solid two-phase fluid simulations. IOP Conference Series: Materials Science and Engineering, 52(6), 668–672. [Google Scholar]
22. Khalid, S. U., Babar, H., Ali, H. M., Janjua, M. M., Ali, M. A. (2020). Heat pipes: progress in thermal performance enhancement for microelectronics. Journal of Thermal Analysis and Calorimetry, 143(3), 1–17. [Google Scholar]
23. Cheng, Y., Guo, Y. C., Wei, F., Jin, Y., Lin, W. Y. (1999). Modeling the hydrodynamics of downer reactors based on kinetic theory. Chemical Engineering Science, 54(13), 2019–2027. [Google Scholar]
24. Wei, L., Shi, W. D., Jiang, X. P., Chen, B., Wu, Y. L. (2012). Analysis on internal solid-liquid two-phase flow in the impellers of sewage pump. International Conference on Advances in Computational Modeling and Simulation, Procedia Engineering, 31, 170–175. [Google Scholar]
25. Chen, A., Lin, T. F., Ali, H. M., Yan, W. M. (2020). Experimental study on bubble characteristics of time periodic subcooled flow boiling in annular ducts due to wall heat flux oscillation. International Journal of Heat and Mass Transfer, 157, 119–974. [Google Scholar]
26. Pei, J., Yuan, S. Q., Yuan, J. P. (2013). Fluid-structure effects on periodically transient flow of a single-blade sewage centrifugal pump. Journal of Mechanical Science and Technology, 27(7), 2015–2023. [Google Scholar]
27. Pei, J., Yuan, S. Q., Benra, F. K., Dohmen, H. J. (2012). Numerical prediction of unsteady pressure field within the whole flow passage of a radial single-blade pump. Journal of Fliuds Engineering, 134(10), 101–103. [Google Scholar]
28. Auvinen, M., Ala-Juusela, J., Pedersen, N. (2010). Transient flow simulations and performance analysis of a single-channel pump. 5th OpenFOAM Workshop, Chalmers, Gothenburg, Sweden. [Google Scholar]
29. Liu, Y., Su, Y., Wu, Z., Liao, R. Q. (2020). Effect of the inclination angle on slippage loss in gas-liquid two-phase flow. Fluid Dynamics & Materials Processing, 16(3), 475–488. [Google Scholar]
30. Hu, Q. (2011). Research and numerical simulation of condensation heat transfer in shell and tube heat exchangers. Huazhong University of Science and Technology, Wuhan, China. [Google Scholar]
31. Zhou, H. M., Gao, H. Z., Fang, Z., Yang, J. X., Wu, M. G. (2020). Analysis of gas-solid flow characteristics in a spouted fluidized bed dryer by means of computational particle fluid dynamics. Fluid Dynamics & Materials Processing, 16(4), 813–826. [Google Scholar]
32. Shen, Z. Z. (2007). Analysis and numerical simulation of liquid-solid two-phase flow in radial impeller. Changsha University of Science and Technology, Changsha, Hunan. [Google Scholar]
33. Gelain, T., Rondeau, A., Peillon, S., Gensdarmes, F. (2015). CFD modelling of the wall friction velocity filed in the ITER tokamak resulting from airflow during a loss of vacuum accident-Consequences for particle resuspension. Fusion Engineering & Design, 100, 87–99. [Google Scholar]
34. Cheng, X., Chen, H., Wang, X. (2019). Analysis of the impact of the space guide vane wrap angle on the performance of a submersible well pump. Fluid Dynamics & Materials Processing, 15(3), 271–284. [Google Scholar]
35. Auvinen, M., Ala-Juusela, J., Pedersen, N., Siikonen, T. (2010). Transient flow simulations and performance analysis of a single-channel pump. 5th OpenFOAM Workshop. [Google Scholar]
 | This work is licensed under a Creative Commons Attribution 4.0 International License, which permits unrestricted use, distribution, and reproduction in any medium, provided the original work is properly cited. |