| Fluid Dynamics & Materials Processing |
DOI: 10.32604/fdmp.2021.015967
ARTICLE
Models for Predicting the Jet Trajectory and Intensity Drop Point of Fire Monitors
China Petroleum and Chemical Corporation Research Institute of Safety Engineering, Qingdao, 266000, China
*Corresponding Author: Yongyou Cao. Email: cyy.qday@sinopec.com
Received: 29 January 2021; Accepted: 08 April 2021
Abstract: Two models are defined for predicting the trajectory of a foam jet originating from a fire monitor (hydrant) and the related intensity drop point. An experimental framework is also defined and used accordingly to compare real-time data with the predictions of such models. This mixed theoretical-experimental approach is proven to be effective for the determination of otherwise unknown coefficients which take into account several important factors such as the operation pressure, the elevation angle and the nozzle diameter. It is shown that the mean absolute error is smaller than 20%.
Keywords: Fire monitor; foam extinguishing agent; jet trajectory; intensity of drop point
Nomenclature
| V0: | initial exit velocity of the fire monitor (m/s) |
| d: | diameter of fire monitor base (m) |
| d0: | exit diameter of fire monitor (m) |
| A: | cross-sectional area of fire monitor base (m2) |
| A0: | cross-sectional area of fire monitor exit (m2) |
| v: | velocity of jet unit (m/s) |
| P: | working pressure of fire monitor (Pa) |
| P0, Ps: | atmospheric pressure (Pa) |
| ρ1,ρ: | density of test fluid (kg/m3) |
| Q: | flow rate of fire monitor base (L/s) |
| Q0: | flow rate of fire monitor exit (L/s) |
| ρ: | density of test fluid (kg/m3) |
| mg: | gravity (N) |
| F: | air friction (N) |
| α: | elevation angle of fire monitor (°) |
| vx: | sub-velocities of jet unit in horizontal direction (m/s) |
| vy: | sub-velocities of jet unit in vertical direction (m/s) |
| θ: | movement angle of jet unit with respect to the horizontal (°) |
| k: | air resistance coefficient |
| m: | mass of jet unit |
| Re: | reynolds number |
| μ: | dynamic viscosity of test fluid (Pa · s) |
| r: | intensity of drop point of fire monitor (m3/(m2s)) |
| MAE: | mean absolute error |
With the continuous development of the economy, the demand for petroleum and chemical products has been constantly increasing. The quantities and number of types of flammable liquids produced, transported, stored, and used have been increasing as well. Because the fires caused by these flammable liquids are difficult to extinguish, the booming petrochemical industry has presented major challenges related to fire safety. Severe fires caused by flammable liquids (usually termed “Class B” fires) have occurred frequently, leading to large numbers of casualties and massive property damage [1]. However, the petrochemical industry is the cornerstone of the energy industry and plays a critical role. Therefore, in addition to supervising the day-to-day fire protection in petrochemical companies, it is necessary to formulate targeted fire protection plans. Furthermore, the use of different types of firefighting techniques and rescue facilities and advanced and efficient firefighting technologies is essential to ensure efficient firefighting within petrochemical enterprises.
As the most important firefighting and rescue tools, fire monitors have increasingly become prominent and widespread in related applications. The performance of fire monitors directly affects the efficiency of fire rescue. Therefore, it is necessary to research the jet characteristics of fire monitors, enhance our understanding of the performance of fire monitors, and improve the application level of fire monitors. The jet trajectory and drop point intensity of fire monitors are two important parameters for evaluating the jet performance of fire monitors. As the drop point intensity of a fire monitor increases, its impact force increases, and a large impact force can help extinguish a fire early and rapidly. When the burning area of a fire is larger than the maximum effective fire control area of the jet, the fire may be out of control [2,3]. Therefore, in the face of complex fire scenarios and serious fires caused by combustibles, it is critical to correctly predict the jet trajectory and fall point intensity of fire monitors to accurately control fires in time.
The research on fire monitors can be divided into two branches, namely studies on the flow law of the jet working fluid inside fire monitors [4–14] and studies on the jet trajectory, range, and height of fire monitors, that is, the motion trajectory and flow field distribution of fire monitor jets in air [15–22].
Most of the studies on fire monitors have focused on the flow law of the jet working fluid inside and outside of fire monitors. For example, Zhou et al. [4] used Fluent to numerically simulate the flow of working fluid in a fire monitor and analyzed the influences of cross-sectional shape, channel diameter, and pressure on the jet flow characteristics of the fire monitor to obtain the optimal structural parameters of the flow channel. Hu et al. [5–7] performed numerical simulations to study the influence of fire monitor structure and flow channel parameters on fire monitor jets and conducted related experiments for comparison with the simulation results. They analyzed the fluid stability and velocity change law at the elbow to further optimize the relevant fire monitor parameters.
The existing studies on fire monitor jets are focused on jet movement in air after the fire monitor outlet, which involves liquid movement and breaking of the jet in complex ways. Hatton et al. [15,16] performed a three-dimensional numerical simulation of the jet trajectory of a fire monitor by considering the influence of wind. Moreover, they conducted experiments involving fire monitor jets under different working conditions, and the results of these experiments agreed well with their numerical results. Miyashita et al. [17,18] used the semi-implicit moving-particle method to numerically simulate the jet trajectory of a fire monitor under different working conditions. Their results indicated that the jet trajectory was related to the jet flow rate and pressure. Through simulations and experiments, Sun [19] established a linear-regression-based method to predict the jet trajectory of fire monitors. In addition, Song et al. [3] introduced the term drop point intensity to study the fire control performance of fire monitors and experimentally studied the distribution characteristics of drop point intensity and laws of fire water monitors.
Overall, the studies on the jet characteristics of real fire monitors are limited, and most of these works are numerical simulations and small-scale experiments that were conducted to verify numerical models. Thus, these studies are not practically significant for firefighting because they do not consider the relevant factors, such as operation pressure, nozzle size, and elevation angle. Moreover, water is used as the working fluid in most of the existing experimental studies, and data on foam jets and the associated trajectory prediction models are lacking. In addition, most of the studies on fire monitors have focused on the flow law of the jet working fluid inside and outside a fire monitor [4–22], but there are few studies on the strength parameters of foam jets.
In the present study, photography and pixel analysis are used to develop an experimental system for measuring the trajectory and drop point intensity of the extinguishing agents used in real fire monitors. A mixture of foamite and water is used as the test fluid. Moreover, a semiempirical model is proposed to predict the trajectory and drop point intensity. The coefficients used in the theoretical derivation are obtained through data regression. The major parameters considered include monitor operation pressure, elevation angle, and size of monitor nozzle.
2 Experimental Facilities and Methods
Fig. 1 shows a schematic diagram of the experimental system. The major system components include a fire monitor, a pressure gauge, a flow meter, two cameras, a weather meter, and a PC terminal. An aqueous film-forming foam (6%, AFFF) is used as the fire extinguishing agent. The experimental process is recorded using two high-resolution cameras aligned parallel and perpendicular to the jet. The front-view videos capture the trajectory and width of the drop point, and the side-view videos capture the width of the drop point. Quantitative analyses of the jet trajectory and jet coverage area at the drop point are realized through pixel analyses in the LabView software environment. A benchmark is configured in the experiments as a reference to calculate the pixel size during image processing. A schematic diagram of the image processing scheme is shown in Fig. 2. During the experiment, the jet flow from a fire monitor is greatly affected by local air convection. Therefore, the wind speed and direction during our experiment were measured using a meteorological instrument, and the measured data were recorded on a computer. Due to the large range and height of the fire monitor used herein, the experiment was conducted in an open field.
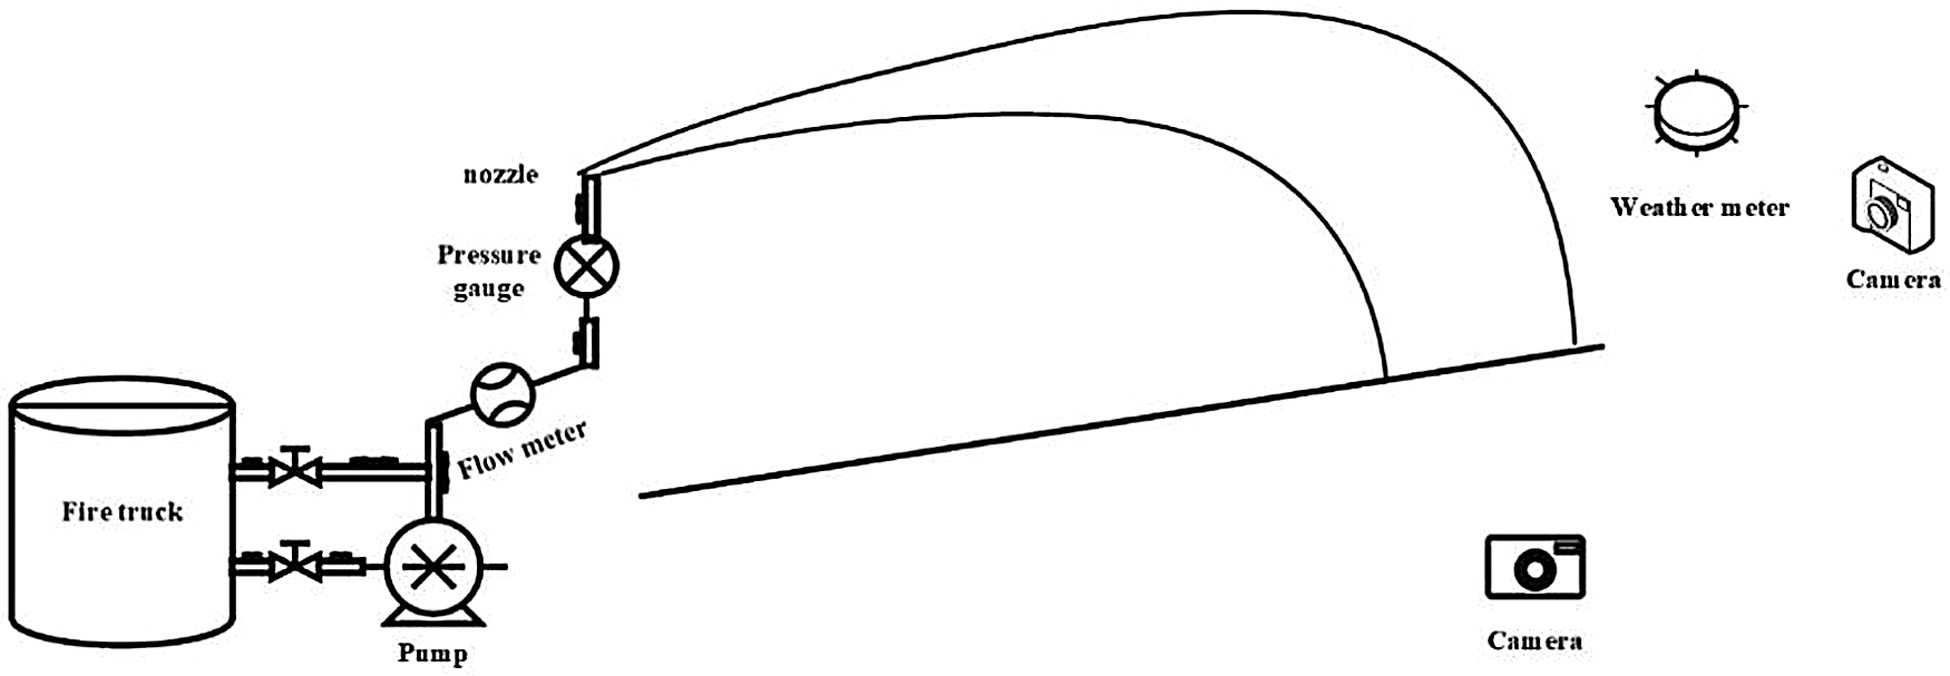
Figure 1: Schematic diagram of experimental system
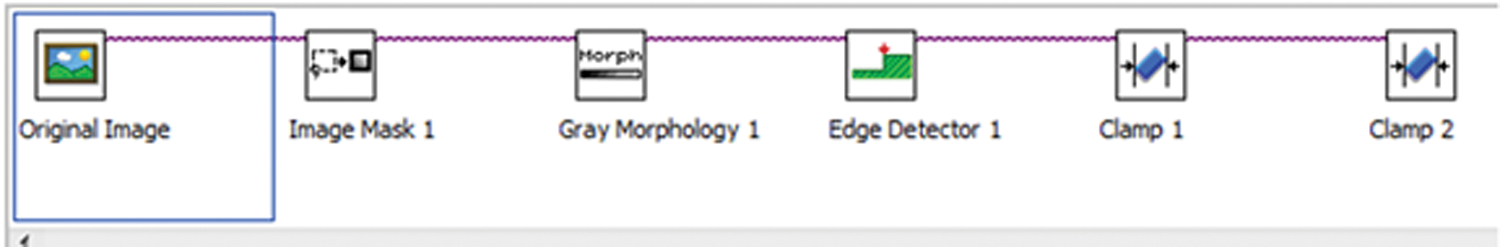
Figure 2: Schematic diagram of image processing scheme
In this experiment, when the jet generated from the fire monitor was sustained for more than 30 s and reached a stable state, the trajectory and jet coverage area on the ground were recorded. The intensity of the jet drop point was defined as the ratio of flow rate to coverage area, L/min·m2. The foam was dyed before it was sprayed to identify the coverage area. The ground was pixelated to calculate the jet coverage area accurately, as shown in Fig. 3.
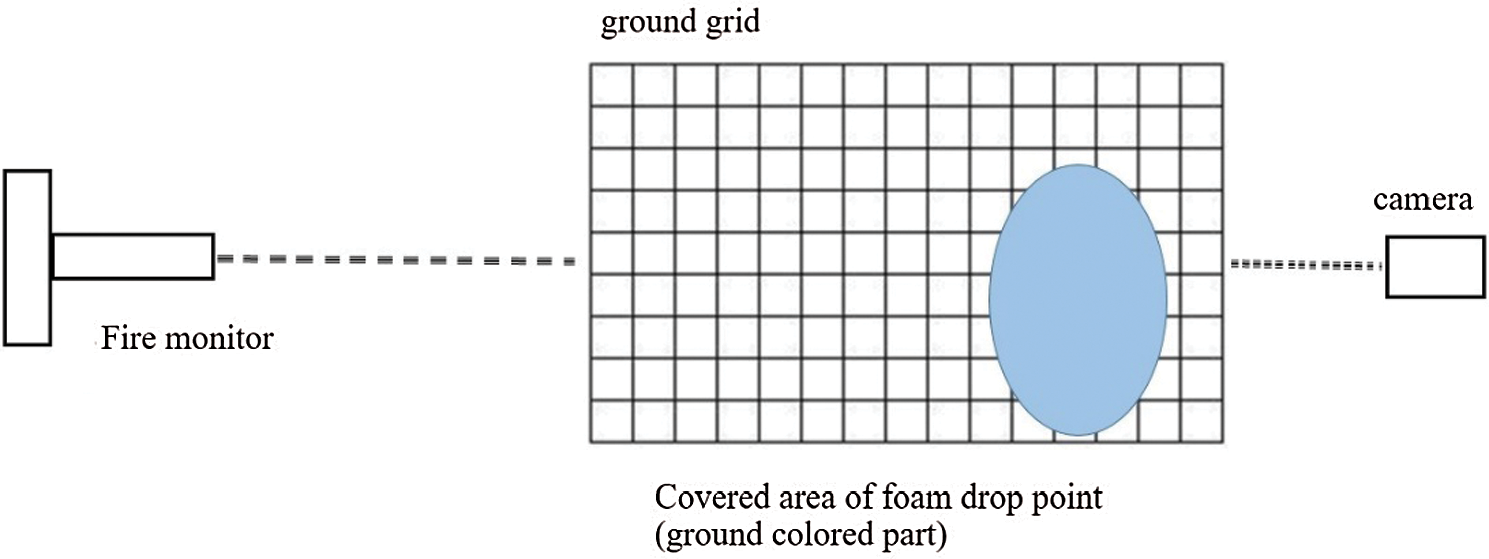
Figure 3: Schematic for measuring jet drop point intensity
Many factors affect the trajectory and drop point intensity, and they can be grouped into the following three categories: working condition parameters, including the pitch angle and operation pressure; equipment structure parameters, including the internal flow channel structure and nozzle design of firefighting equipment, which affect the jet shape and range; and external influence factors, such as wind speed, wind direction, and other environmental factors.
Because environmental factors such as wind speed and wind direction often change according to complex mechanisms, it is difficult to quantitatively analyze the influences of these factors on foam jets. Because a reasonable experimental site and time were selected in this study, the experimental environmental conditions were well controllable. Therefore, the environmental influence factors were not analyzed in this study. Only the working condition parameters and equipment structure parameters influencing the foam jet were studied. The working condition parameters included the pitch angle and operation pressure, and equipment structure parameters included the nozzle size.
In this study, three common fire monitors were used in the actual foam injection experiments. The operation pressure was varied from 0.4 MPa to 1.0 MPa in steps of 0.1 MPa. The pitch angle was varied from 30° to 60° in steps of 5°. The experiment was a complete experiment with three variables, namely the operation pressure, pitching angle, and type of fire monitor. Each time the operating conditions cause one of the variables to change, the other variables remain unchanged. By multiplying the number of levels of each variable (namely, the operation pressure, pitching angle, and type of fire monitor), in total, 147 sets of operating conditions were designed for use in the experiment. Each set of operating conditions was used thrice in the experiment, resulting in the generation of 441 datasets.
3.1 Initial Jet Velocity and Flow Rate
The initial exit velocity of a fire monitor v0 (m/s) mainly depends on its structural parameters, working pressure, and flow rate. The main structural parameters of a fire monitor are the diameter of its base d (m) and its exit diameter d0 (m). The corresponding cross-sectional areas A (m2) and A0 (m2) are calculated as follows:
The jet working fluid is ejected from the fire monitor and enters air, and the solid wall no longer restricts the movement of the jet working fluid. At this time, the potential energy due to pressure is converted into kinetic energy. According to Bernoulli’s equation [23],
By substituting the relationship between the jet flow rate and jet velocity, that is, v = Q/A, into Eq. (2), we can obtain the relationship between the working pressure (Pa) and the flow rate of a fire monitor (L/s).
where ρ (kg/m3) denotes the density of the jet working fluid , and p denotes the monitor operation pressure. After determination of the cross-sectional area of the fire monitor outlet, there exists a fixed conversion relationship between the operation pressure and flow rate of the fire monitor. Thus, the initial jet velocity(m/s) can be computed as follows:
3.2 Model for Predicting Jet Trajectory
For fire monitors, the jet trajectory can be regarded as constrained parabolic motion. To analyze the jet trajectory characteristics of a fire monitor, its jet is divided into a mass of liquid units, which are used as the objects in theoretical analysis. These liquid units move in air as plane projectiles, and the force analysis of these units is presented in Fig. 3. Since the density of air is considerably lower than that of the working fluid, the buoyancy of air is neglected. Moreover, because the shooting range of the fire monitor is less than 100 m, the jet is mainly affected by gravity mg and air friction F(N). In Fig. 4, v0 (m/s) is the initial jet velocity at the exit of the fire monitor; α (°) the elevation angle of the fire monitor; vx (m/s) and vy (m/s) the sub-velocities of the jet unit in the horizontal and vertical directions, respectively; and θ (°) the movement angle of the jet unit with respect to the horizontal.
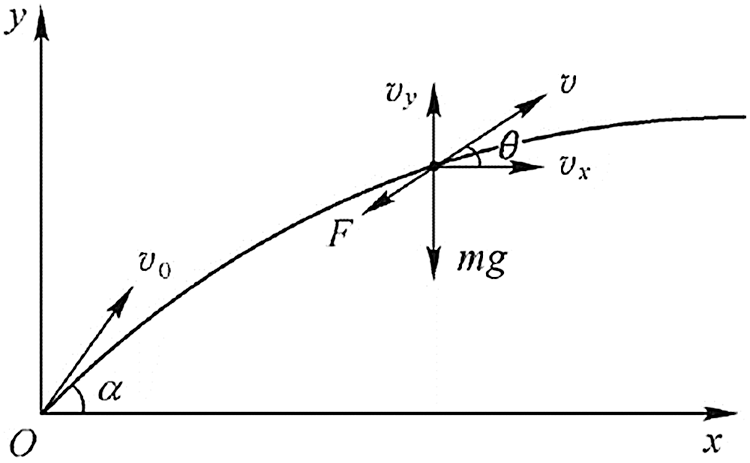
Figure 4: Force analysis of the liquid jet unit
It is generally accepted that the air resistance of the jet unit is proportional to the square of the jet velocity, but its direction is opposite to that of the jet velocity.
where k is the air resistance coefficient, and v is the velocity of a jet unit.
Based on the above force analysis and Newton’s law of motion, the force of a jet unit is disintegrated, and the dynamic equations of the projectile along the x and y directions are established.
By eliminating vx and vy from Eqs. (7)–(11), we obtain the following differential equations of the trajectory of fire monitor units:
Based on the given initial conditions, the mass of a jet unit is m; initial velocity is v0; elevation angle is α;
By substituting Eq. (14) into Eq. (15), we can obtain the motion trajectory equation of the fire monitor jet as follows:
where
By substituting Eq. (17) into Eq. (16), we can obtain the following theoretical expression of jet trajectory:
According to Eq. (18), the jet trajectory of a fire monitor is related to the mass, initial velocity, air resistance coefficient, and elevation angle of the jet.
The extracted experimental data are the position coordinates in the jetting process, which are used to calculate the undetermined coefficients in the prediction model. The jet trajectory curve is divided into the outer trajectory curve and the inner trajectory curve, as illustrated in Fig. 1. Because the inner trajectory is relatively blurred compared to the outer trajectory, the trajectory of a fire monitor jet is based on the outer trajectory. Eq. (18) presents a theoretical formula for predicting the jet trajectory of a fire monitor in the absence of wind. To increase the practicality of this formula, four undetermined coefficients A, B, C, and D are introduced for correction, and the formula is modified as follows:
These undetermined coefficients are acquired through the fitting of experimental results.
The equation for computing the outer jet trajectory when using foam as the working fluid is
3.3 Model for Predicting Drop Point Intensity
Due to the significance of drop point intensity in actual firefighting, it is imperative to develop a practical model or correlation to predict this parameter. Before regression of the experimental data, several dimensionless parameters should be defined.
The jet Reynolds number [24] is defined as
where d denotes the exit diameter of a fire monitor. The elevation angle of the fire monitor α is normalized by the constant π
The operation pressure of a fire monitor P is normalized as follows:
where Ps denotes atmospheric pressure. The drop point intensity of a fire monitor r is normalized as follows:
where v, which denotes the average exit velocity under all working conditions, is set to 40 m/s.
The intensity of the drop point in units of m3/(m2s) is calculated using Eq. (25)
When the working fluid is foam, the flow rate must be multiplied with the foaming multiple of the aqueous film-forming foam agent, which is 6.6 in this study. The landing shape of the fire monitor jet is extremely irregular, and it is difficult to measure its actual area. Therefore, in this experiment, we assume that the jet landing area is elliptical, meaning that its area can be calculated as A = πab, where a and b are lengths of the ellipse axes.
For different fire scenarios, the drop point intensity requirements are different. In other words, only when the jet intensity of a fire monitor exceeds a certain value, a fire can be effectively extinguished. From the practical perspective, the drop point intensity is related to the operation pressure, jet exit velocity, and elevation angle of a fire monitor. Thus, we assume that these parameters satisfy the following relationship:
The multiple linear regression method is used to analyze the relationship between the coefficients in Eq. (26) and solve the values of a3, b3, c3, and d3. Eq. (26) is transformed into the following linear regression equation
To accurately obtain the regression coefficients in the above equations, many data points for drop point intensity are generated. When the working fluid is foam, the coefficients are lna3 = −23.969, b3 = 1.221, c3 = −0.382, and d3 = −0.969.
To evaluate the accuracy of the prediction model, we use the concept of mean absolute error (MAE), which is defined as follows:
where N represents the number of data points, and the subscripts pred and exp represent the predicted and measured values, respectively. Comparisons between the experimental measurements and the model predictions of the outer trajectory of the jet under various conditions are shown in Figs. 5–7. The model can accurately predict the jet trajectory. The calculated MAE of the jet trajectory predicted using this model was 10.3%, while that of the jet trajectory predicted using the model of jet drop point intensity was 15.1%. Fig. 8 presents a comparison between the experimental results and model prediction of the intensity of the drop point. Although the MAEs are slightly high, they are less than 20% and are, therefore, acceptable for fulfilling the requirements of this engineering application.
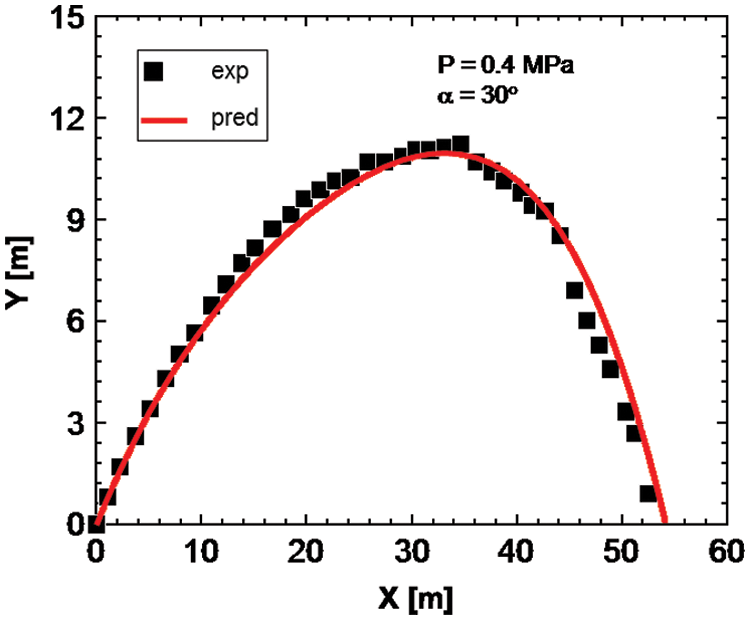
Figure 5: Comparison between experimental and model-predicted jet trajectory with pressure of 0.4 MPa and elevation angle of 30°
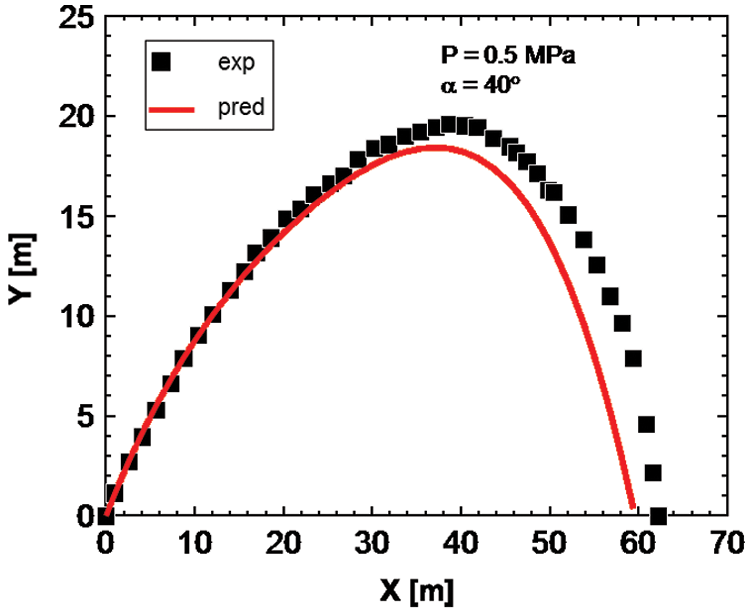
Figure 6: Comparison between experimental and model-predicted jet trajectory with pressure of 0.5 MPa and elevation angle of 40°
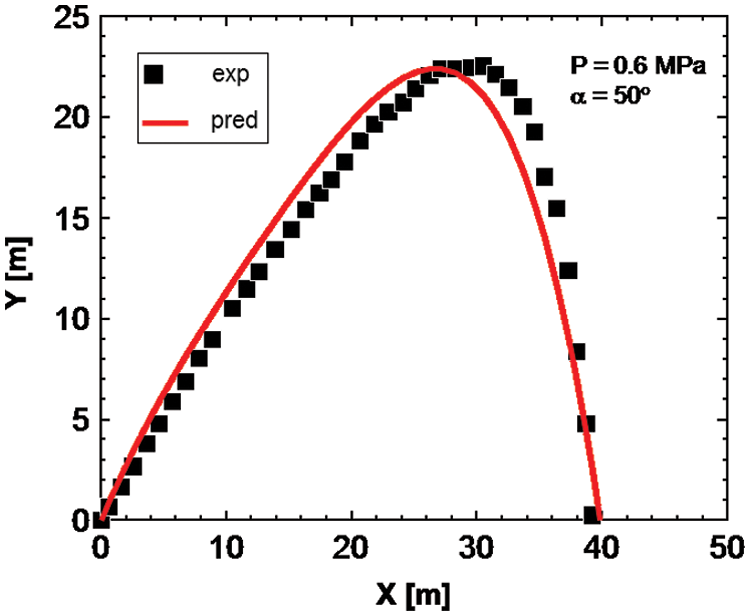
Figure 7: Comparison between experimental and model-predicted jet trajectory with pressure of 0.6 MPa and elevation angle of 50°
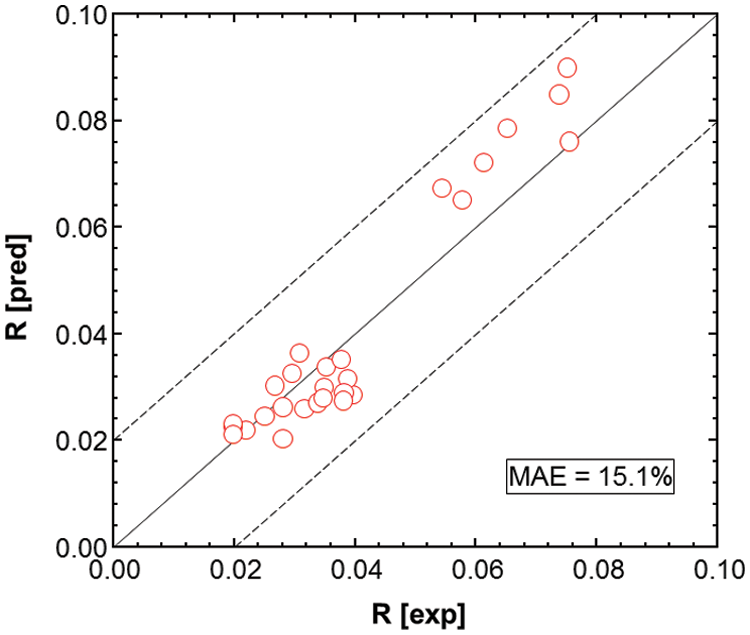
Figure 8: Comparison between experimental and model-predicted jet drop point intensity
A theoretical model for predicting the jet trajectory of fire monitors was developed based on the results of a unit force analysis. Based on this model, a semiempirical model was established from the practical perspective by considering the effects of the operation pressure, elevation angle, and nozzle diameter of a fire monitor. This model accurately predicted the jet trajectory with an MAE of 10.3%. Given the importance of jet drop point intensity in firefighting, an empirical model based on multiple linear regression was proposed to predict the jet drop point intensity. This model was fitted using an adequate number of experimental data points obtained under various conditions by considering the above three practical operation parameters, and the MAE of this model was 15.1%. The accuracies of both models are adequate for engineering applications, and both models are suitable for acquiring the key parameters of firefighting foam field operations, such as trajectory and jet drop point intensity. This study provides the basic ideas and data, as well as prediction methods, that can be used to enhance fire extinguishing operations.
Funding Statement: This work was supported by the National Key Research and Development Plan (Grant No. 2016YFC0801300).
Conflicts of Interest: The authors declare that they have no conflicts of interest to report regarding the present study.
1. Yang, Q. (2005). Study of the performance-based fire-protection design for large-space exhibition buildings (Master Thesis), pp. 35–60. Chongqing University. [Google Scholar]
2. Shu, Y., Yao, B., Huang, B., Liu, B. H. (2014). Influence of stacking in a huge warehouse on the fire control performance of vaporific spray from a water cannon. Fire Safety Science, (2), 63–74. [Google Scholar]
3. Song, Q. L., Liu, B. H., Wu, L. B., Yao, B. (2007). Water density distribution and fire control capability of auto-regulative water gun. Fire Safety Science, 16(4), 220–225. [Google Scholar]
4. Zhou, J., Li, G. R. (2012). Study and simulation for optimization plan of the liquamatic fire water cannon with self-swinging device. Advanced Materials Research, 468, 944–948. [Google Scholar]
5. Hu, G. L., Long, M., Liang, J. X., Li, W. H. (2012). Analysis of jet characteristics and structural optimization of a liquamatic fire water monitor with self-swinging mechanism. International Journal of Advanced Manufacturing Technology, 59(5–8), 805–813. [Google Scholar]
6. Hu, G. L., Chen, W. G. (2010). Hydraulic performance research of PS100 type fixed fire water monitor. Machinery Design & Manufacture, (11), 87–89. [Google Scholar]
7. Hu, G. L., Ming, L., Gao, Z. G. (2012). Dynamic characteristics analysis and simulation evaluation of a portable fire water monitor with valve-controlled cylinder system. Hydromechatronics Engineering, 40(6), 80–91. [Google Scholar]
8. Aghajani, H., Dembele, S., Wen, J. X. (2014). Analysis of a semi-empirical sprinkler spray model. Fire Safety Journal, 64(1), 1–11. [Google Scholar]
9. Sikanen, T., Vaari, J., Hostikka, S., Paajanen, A. (2014). Modeling and simulation of high pressure water mist systems. Fire Technology, 50(3), 483–504. [Google Scholar]
10. Jung, I. S., Park, T. G., Chung, H. T. (2010). Parametric study on water mist nozzles for fire suppression system based on cfd methods. Journal of Ilass-Korea, 15, 124–130. [Google Scholar]
11. Yoon, S. H., Kim, D. Y., Dong, K. K., Kim, B. H. (2011). Effect of nozzle geometry for swirl type twin-fluid water mist nozzle on the spray characteristic. Journal of Mechanical Science & Technology, 25(7), 1761. [Google Scholar]
12. Hu, G. L., Ming, L. (2013). Structure design and analysis of water jet performances of a new type of fixed fire water monitor. Hydromechatronics Engineering, 41(12), 15–22. [Google Scholar]
13. Leu, M., Meng, P., Geskin, E., Tismeneskiy, L. (1998). Mathematical modeling and experimental verification of stationary water jet cleaning process. Journal of Manufacturing Science and Engineering, 120(3), 571–579. [Google Scholar]
14. Lin, S. P., Reitz, R. D. (1998). Drop and spray formation from a liquid jet. Annurevfluid Mech, 30(1), 85–105. [Google Scholar]
15. Hatton, A. P., Leech, C. M., Osborne, M. J. (1985). Computer simulation of the trajectories of large water jets. International Journal of Heat & Fluid Flow, 6(2), 137–141. [Google Scholar]
16. Hatton, A. P., Osborne, M. J. (1979). The trajectories of large fire fighting jets. International Journal of Heat & Fluid Flow, 1(1), 37–41. [Google Scholar]
17. Miyashita, T., Sugawa, O., Imamura, T., Kamiya, K., Kawaguchi, Y. (2014). Modeling and analysis of water discharge trajectory with large capacity monitor. Fire Safety Journal, 63, 1–8. [Google Scholar]
18. Miyashita, T., Sugawa, O., Wada, Y., Ishikawa, R., Kawaguchi, Y. (2012). Development of two-dimensional simple simulation model and evaluation of discharge ability for water discharge of firefighting. Bulletin of Japan Association for Fire Science and Engineering, 62(1), 13–19. [Google Scholar]
19. Sun, J. (2008). Research of the trajectory of fire-fighting monitor’s jet (Master Thesis). Shanghai Jiaotong University. [Google Scholar]
20. Xie, Z. C. (2012). Hydraulic properties research based on the CFD of fire water cannon (Master Thesis). Harbin Engineering University. [Google Scholar]
21. Menchini, C. P. (2015). Experimental flow characterization and computational model development of aqueous film-forming foam (ARFF) firefighting jets (Ph.D. Thesis). Statler College of Engineering and Mineral Resources. [Google Scholar]
22. Iyogun, C. O. (2006). Trajectory of liquid jets exposed to a low subsonic cross airflow. Atomization & Sprays, 16(8), 963–980. [Google Scholar]
23. Xu, T., Zhang, L. (2020). Analysis of water transport inside a plant xylem vessel with pitted thickening. Fluid Dynamics & Materials Processing, 16(3), 525–536. [Google Scholar]
24. Han, Y., Chen, D., Liu, S., Xu, G. (2020). An investigation into the effects of the Reynolds number on high-speed trains using a low temperature wind tunnel test facility. Fluid Dynamics & Materials Processing, 16(1), 1–19. [Google Scholar]
 | This work is licensed under a Creative Commons Attribution 4.0 International License, which permits unrestricted use, distribution, and reproduction in any medium, provided the original work is properly cited. |