| Fluid Dynamics & Materials Processing |
DOI: 10.32604/fdmp.2021.016602
ARTICLE
Influence of Electrical Field Distortions Induced by Water Droplets on the Contamination Characteristics of an Insulator
Department of Energy, Power and Mechanical Engineering, North China Electrical Power University, Baoding, 071003, China
*Corresponding Author: Yuechi Wang. Email: 15573191184@163.com
Received: 10 March 2021; Accepted: 11 May 2021
Abstract: When separated water droplets condense on the surface of a composite insulator, the electrical field on the insulator surface is distorted. In turn, such distortions change the trajectories of pollution particles. In this study, the COMSOL software is used to simulate such a process for the FXBW4-10/100 composite insulator with or without water droplets condensation under a 10 kV DC voltage. The influence of the wind speed and particles concentration on the contamination characteristics of the considered 110 kV insulator is analyzed. The results show that: 1) in the presence of water droplets on the insulator surface, the ratio of electrical field force and gravity acting on the particles is large; 2) the contamination on the insulator surface increases with the wind speed; 3) when the wind speed is small, the relationship between the contamination amount and the pollution concentration is essentially linear.
Keywords: Water droplets; composite insulator; numerical simulation; electrical field distortion; contamination characteristic
With the continuous development of the economy, the demand for electricality is increasing [1]. However, in humid environment, fog, dew and drizzle may condense on the insulator surface in the form of separated water droplets, which will dissolve the pollution particles on the insulator surface and ionize. Then, deterioration of insulation performance and pollution flashover in severe cases will occur, causing huge losses to the power system [2–5]. When the water droplets condense on the insulator surface, it will not only distort the electrical field distribution, but also change the movement track of pollution particles, and finally affect the contamination characteristics. Therefore, it is of great practical significance to study influence of electrical field distortions induced by water droplets on the contamination characteristics of insulators, which can effectively reduce the occurrence of pollution flashover accidents and ensure the safe operation of power system.
In the research of electrical field, Yu et al. [6] found that the non-uniform hydrophobic loss may lead to the further reduction of flashover voltage, which is 26.5% lower than that of uniform hydrophilicity. Sarang et al. [7] simulated the influence of single water droplet and multiple water droplets on the surface electrical field of silicon rubber insulators, and the results showed that the existence of water droplets increased the probability of wet flashover. Through experiments, Lopes et al. [8–10] found that the pollution flashover voltage of the composite insulators depends not only on the degree of contamination of the surface, but also on the hydrophobicity.
In the study of the contamination characteristics, Su et al. [11,12] carried out the natural contamination test of insulators, and summarized the main measures to prevent pollution flashover of UHV transmission lines. The effects of climatic conditions, umbrella structures and pollution compositions on the insulator surface contamination are analyzed, which provides a basis for the selection and design of insulators. Jiang et al. [13] studied the influence of the wind speed on the contamination characteristics of high voltage insulators through wind tunnel tests, and pointed out that contamination rate on the insulator surface area is closely related to the wind speed. Lv et al. [14] proposed the energy-based deposition criterion, and compared the numerical simulation results with the wind tunnel test results, which verified the rationality of the deposition criterion.
In recent years, with the development of computer technology, numerical simulation technology has gradually matured [15–19]. Compared with the experiments, numerical simulations of the insulator are mainly based on hydrodynamics, low-frequency electromagnetic field and particle two-phase flow to study the deposition process and adhesion mechanism of contaminated particles. Advantages of numerical simulations lie in [20–22]: low cost; a large number of data can be obtained in a short time; it is convenient and accurate to extract the influence of a single factor when the other factors remain the same. At present, scholars at home and abroad are mostly devoted to the unilateral study of electrical field distortion and contamination characteristics of insulators, but the coupling effects of both aspects are less.
Therefore, in this study, the COMSOL software is used to simulate such a process for the FXBW4-10/100 composite insulator with or without water droplets condensation under a 10 kV DC voltage. By using the deposition criterion [23], the influence of the wind speed and particles concentration on the contamination characteristics of the considered 110 kV insulator is analyzed.
2 Mathematical Model and Control Equation
COMSOL Multiphysics is a finite element analysis tool for solving multi-physical coupling processes based on partial differential equations in a man-machine interactive environment. It uses the finite element method to solve the problem, presets a large number of physical field application modes, and the biggest feature is the direct strong coupling analysis. The simulation processes of COMSOL in the study are as follows:
(a) Putting forward to the problem. The actual problem to be solved is transformed into a mathematical problem, and then the mathematical problem is expressed by a mathematical model.
(b) Building physical field. Turbulence module, the AC/DC electrostatic field module and fluid flow particle tracking module are selected in the study.
(c) Establishing the simulation model. The geometric model of equal scale can be established directly in the COMSOL Multiphysics software, or you can choose to draw the model in the software with high precision, and then import it into COMSOL Multiphysics for secondary processing.
(d) Setting material properties and boundary conditions. Select the corresponding parameters from the material library of the software to import it, and then set the boundary conditions to meet its requirements in line with different problems.
(e) Generating mesh. The function of mesh generation in COMSOL Multiphysics is that you can set the parameters directly through the interior of the simulation tool or set the parameters by yourself.
(f) Solving and calculating. Select iterative solver to solve the model, and use COMSOL to deal with the solution, then import the processed results into various analysis tools for analysis and research.
(g) Comparative analysis. The results obtained are compared and analyzed, if the results are acceptable, the final simulation results are obtained; if the results are un acceptable, the above steps are repeated.
The deposition of pollution particles on the insulator surface is the result of the comprehensive action of multi-physical fields such as flow field, electrical field and particle field. In this study, the Lagrangian model is used to simulate the gas-solid two-phase flow; the air is regarded as a continuous phase; the turbulence model is used to simulate the flow field around the insulator; the contaminated particles are regarded as discrete phases; the particle tracking model is used to simulate the particle trajectory.
2.1 Mathematical Model and Control Equation of Flow Field
The insulator structure is complex, which can easily lead to a large degree of bending of the streamline when the air flow passes through. Moreover, it will make turbulent anisotropic. Compared with the standard k-ε model, the RNG k-ε model comes from the rigorous statistical technique and is improved from the standard k-ε model with higher accuracy. The RNG k-ε model can take into account the rotational flow in the average flow and can better deal with the flow with high strain rate and large bending degree. Therefore, the RNG k-ε model is chosen in the simulation [24].
In the respect of the non-uniformity of turbulence fluctuation, the time-averaged method is used in the flow field. The Lagrangian discrete phase model in COMSOL follows the Euler-Lagrangian method. The fluid phase is treated as a continuous phase and the time-averaged Navier-Stokes equation is solved directly under the Euler frame. Representing the principle of viscous hydrodynamics, the velocity and pressure of the air around the insulator change little, so it can be regarded as an incompressible viscous fluid. For the incompressible flow field, the continuity equation is:
In the formula: U is the flow field velocity, m/s.
The momentum equation is:
In the formula: I is the main stress tensor, Pa; μ and μT are the aerodynamic viscosity and turbulent force viscosity respectively, Pas; ρ is the air density, kg/m3; F is the volume force, N/m3; k is the turbulent kinetic energy, m2/s2.
The k-ε equation of the RNG k-ε model [25] is:
In the formula: ε is the turbulent dissipation rate, m2/s3; Cμ is the viscosity coefficient; σk, σε, Cε1, Cε2 are the turbulence model parameters; Pk is the turbulent energy term, W/m3.
2.2 The Electrical Field Mathematical Model and Its Control Equation
In order to realistically reflect the distribution of the spatial electrical field near the insulator, an “infinite element domain” with a thickness of 100 mm is constructed outside the box as the absorbing boundary of the electromagnetic wave, so as to accurately simulate the electrical field distribution characteristics. In the numerical simulation, the DC electrical field is calculated and analyzed in steady state, and the governing equation is [26]:
In the formula: E is the spatial electrical field strength, V/m; D is the electrical displacement strength, C/m2; V is the electrical potential, V; ε0 is the vacuum dielectrical constant, 8.8541878 × 10⁻¹² F/m; ε´0 is the relative dielectrical of the material electrical constant; ρv is the bulk charge density, C/m3.
2.3 Mathematical Model of Particle Field and Its Control Equation
The pollution particles explored in this study are fly ash particles in the atmosphere, whose shape is approximately spherical and the particle size is in the order of micron. They has almost no effect on the change of the flow field. In this study, the following settings are made in the numerical simulation: 1) the pollution particles are equivalent to spherical particles; 2) the initial velocity of the particles is the same as the velocity of the flow field; 3) only the gravity, electrical field force and fluid drag force of the particles are considered in the electrical field and flow field [27]. Other secondary forces are not considered.
The particle tracking module solves the problem in Lagrangian form and uses Newton’s law of motion to solve differential equations under the Lagrangian framework. The module uses an adaptive time stepping scheme to solve the problem. This means that the software automatically adjusts the time step to maintain the required relative tolerance, which is set to physical field control by default.
In the fluid flow particle tracking module, the motion trajectory of pollution particles in the flow field can be simulated. For spherical particles, the motion process can be described as:
In the formula: mp is the mass of the dirty particles, kg; v is the speed of the dirty particles, m/s; t is the movement time of the dirty particles, s; fe, fg, fd are the electrical field force, gravity, and fluid drag on the dirty particles respectively, N.
3 Influence of Water Droplets on Electrical Field Distortion of the Insulator
3.1 Physical Model Implementation and Meshing
3.1.1 Physical Model and Mesh Division of the Insulator Surface without Condensation
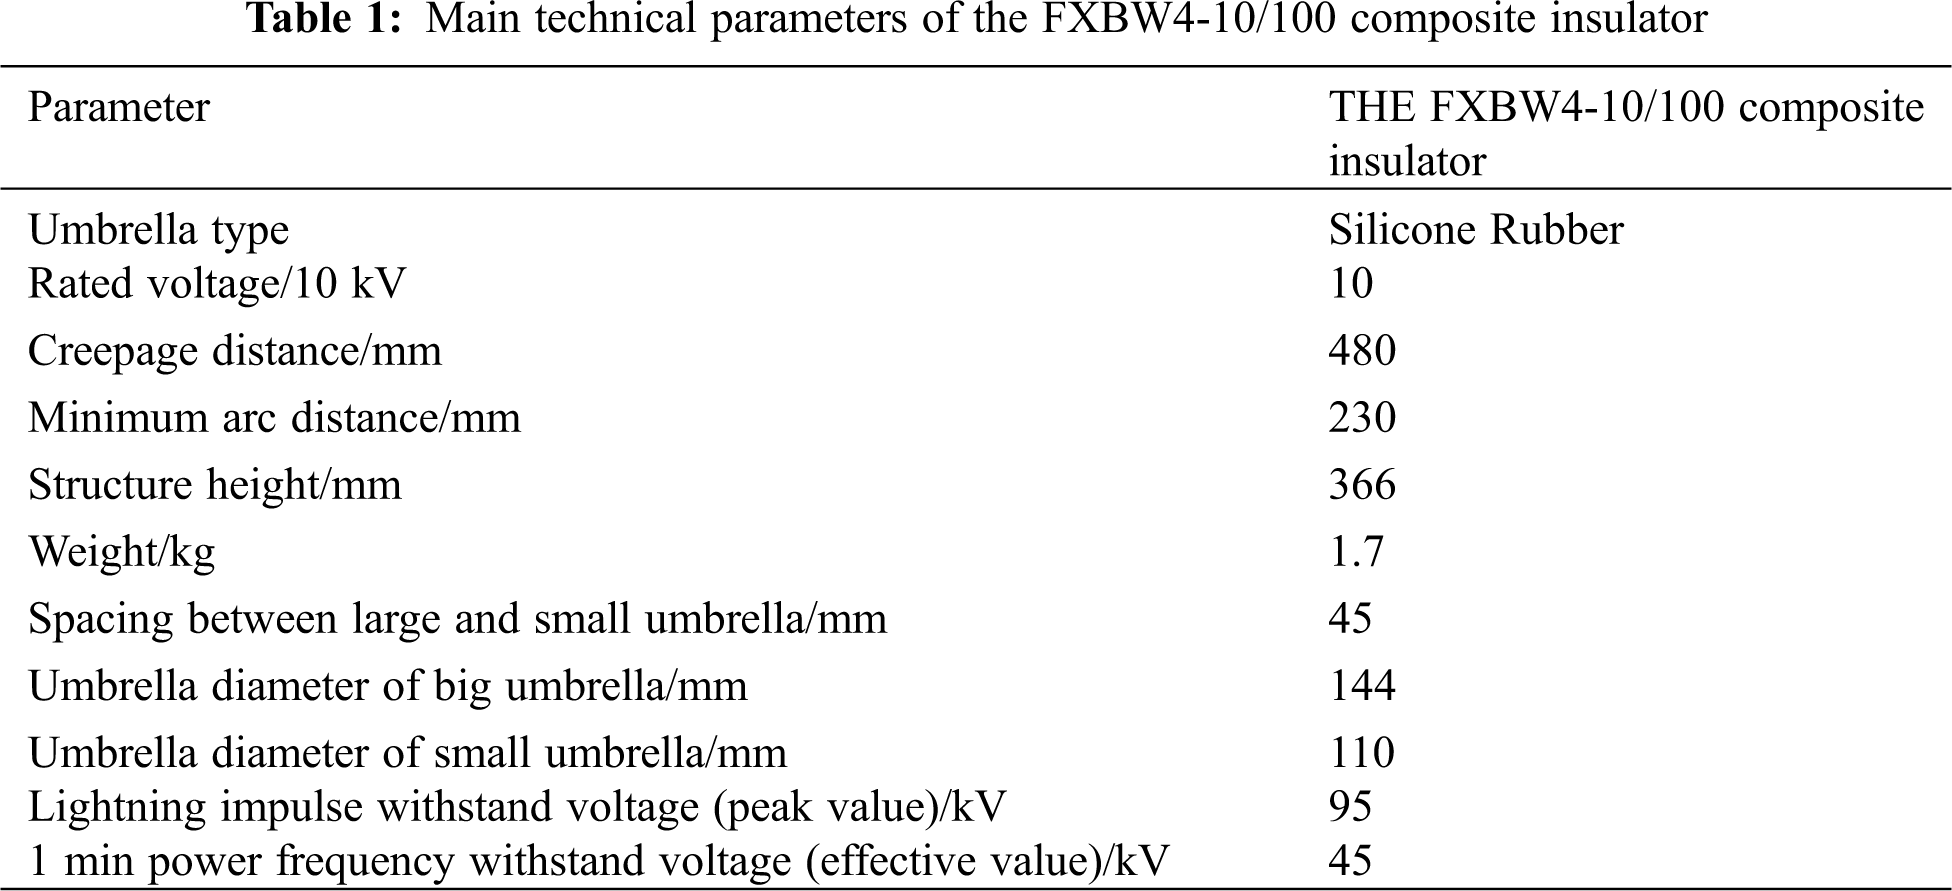
In the light of the main parameters of the FXBW4-10/100 composite insulator provided in Tab. 1, the three-dimensional geometric model is constructed by SolidWorks and imported into COMSOL software for mesh generation, as shown in Fig. 1. It should be noted that in order to reduce the difficulty of three-dimensional modeling, the insulator structure is simplified, quasi-ignoring the internal structure of the hardware at end-fittings and some small ancillary structures.
In order to achieve full development of the fluid in the flow field studied, a square calculation region of 1 m × 1 m × 1 m is established in COMSOL software, and an “infinite element domain” with a thickness of 100 mm is constructed outside the region as the absorbing boundary of electromagnetic waves, so as to accurately simulate the distribution characteristics of the composite insulator electrical field. The meshing of the calculation area is shown in Fig. 2.
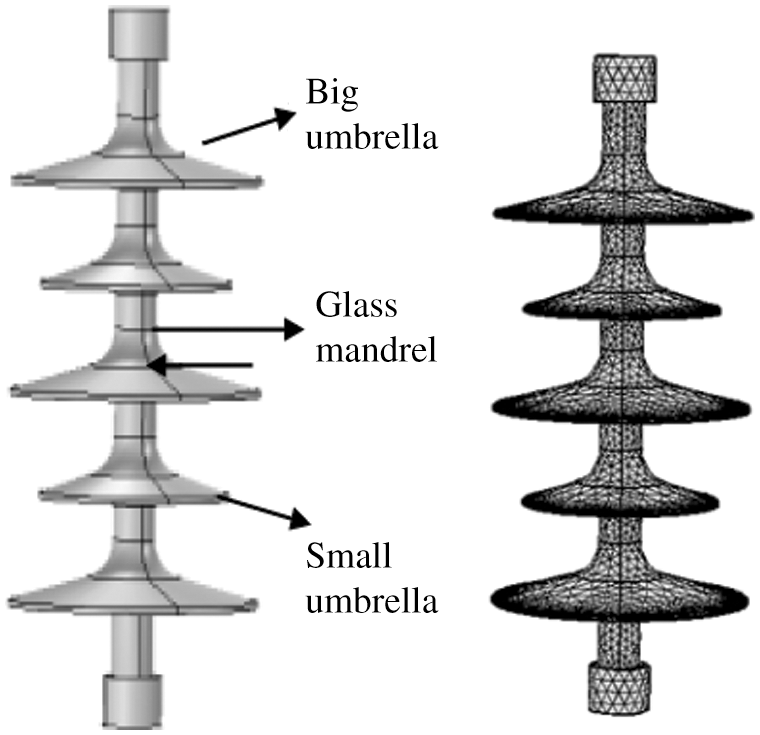
Figure 1: Physical model and mesh division of the FXBW4-10/100 composite insulator
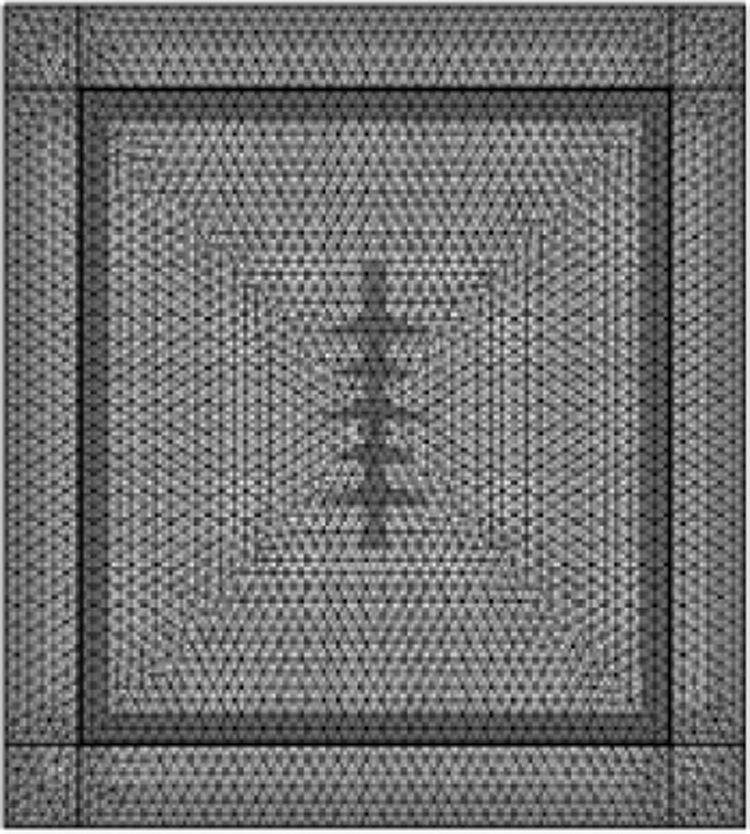
Figure 2: Mesh division diagram of the calculation area
3.1.2 Physical Model and Mesh Division When Water Droplets Condense on the Insulator Surface
When the adhesion between the insulator molecule and the water molecule is greater than the cohesion between the water molecule, the water molecule can wet the insulator surface. At this moment, at the intersection of the material, water and air, the angle (static contact angle) θ ≤ 90° between the tangent of the water droplets surface and the material surface, and the material is hydrophilic. If θ > 90°, the material is hydrophobic (abominable).
In wet weather, due to the good hydrophobicity of the composite insulator surface, the static contact angle between the water droplets and the insulator surface is generally greater than 90°, with fog, dew and drizzle condensing on the insulator surface in a separate form to generate water droplets. With the running time increasing, the composite material gradually degrades, hydrophobicity decreases, and the static contact angle decreases. The static contact angle between the water droplets and the insulator surface is 90° [28], and the water droplets is hemispherical [29].
In the humid environment, the water droplets mainly condensed on the upper insulator surface umbrella skirt. Representing the complexity of establishing the physical model of the insulator with water droplets and the limitation by computer resources, the water droplets along the insulator climbing distance are uniformly set on the upper surface of the large umbrella group. The radius of water droplets condensed on the surface of the insulator is generally less than 3 mm [29]. In order to facilitate the implementation of three-dimensional model when there are water droplets on the insulator surface, the radius of water droplets is 2 mm, and its size is much smaller than that of the insulator. Therefore, when dividing the mesh, it is necessary to divide the extremely fine mesh of the water droplets separately for meeting the calculation requirements. The insulator surface is divided by free triangular mesh to refine the part with large local curvature, while the insulator and “infinite element domain” are divided by free tetrahedral mesh. Fig. 3 shows the meshing diagram and the local magnification of the water droplets on the insulator surface when there are water droplets on it.
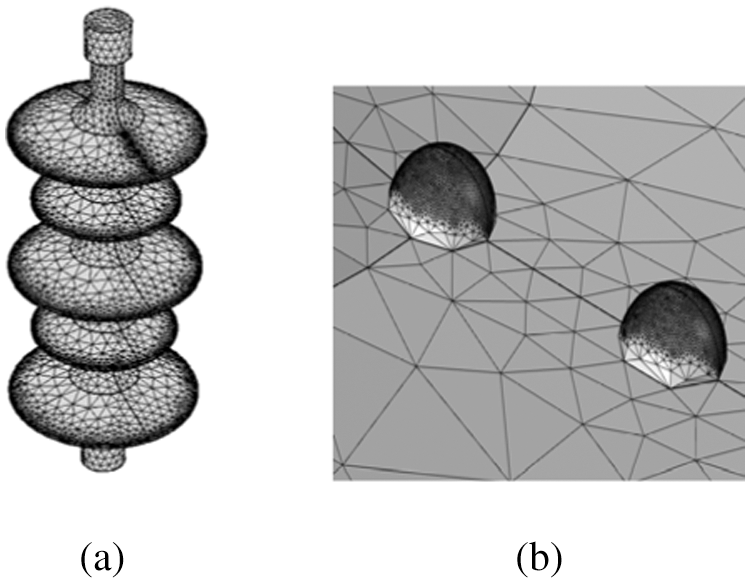
Figure 3: Grid division diagram with water droplets on the composite insulator surface (a) Grid division (b) A partial enlarged view
3.2 Single Value Condition Setting
3.2.1 Setting of Physical Property Conditions
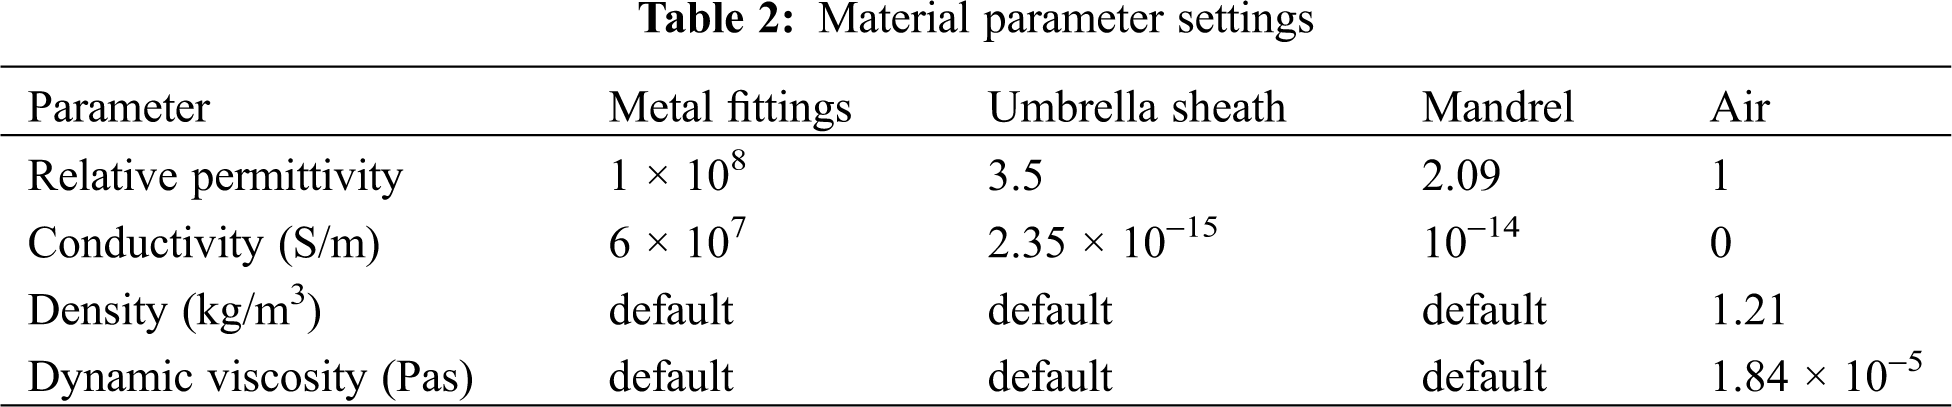
THE FXBW4-10/100 composite insulator is mainly composed of hardware, mandrel and umbrella skirt cover. Under the real situation, the material in the calculation area around the insulator is set to air. From the wind tunnel test results of North China Electrical Power University [30], it can be seen that during the test, ESDD is always maintained at approximately 287 g/cm2, which has little effect on the amount of pollution. Therefore, the influence of ESDD is ignored in this study. The water droplets adopt the built-in material (water) in COMSOL, with an electrical conductivity of 2000 μS/cm. The electrical and physical parameters of other materials are shown in Tab. 2 (the relative dielectrical constant of the fittings is infinite, but it is set to 108 in order to facilitate calculation).
3.2.2 Boundary Condition Setting
In the simulation, the “infinite element domain” is selected as the default electrical insulation boundary condition as same as the actual transmission line. The upper hardware is set as the ground terminal, and the lower hardware is set as the high-voltage terminal. The boundary condition setting of the insulator with water droplets on the surface is basically the same as that when the water droplets are not condensed [28].
3.3 Analysis of Electrical Field Simulation Results
Fig. 4 shows the field intensity cloud diagram and the spatial electrical field line distribution diagram under the action of the DC voltage when there is no condensation on the insulator surface.
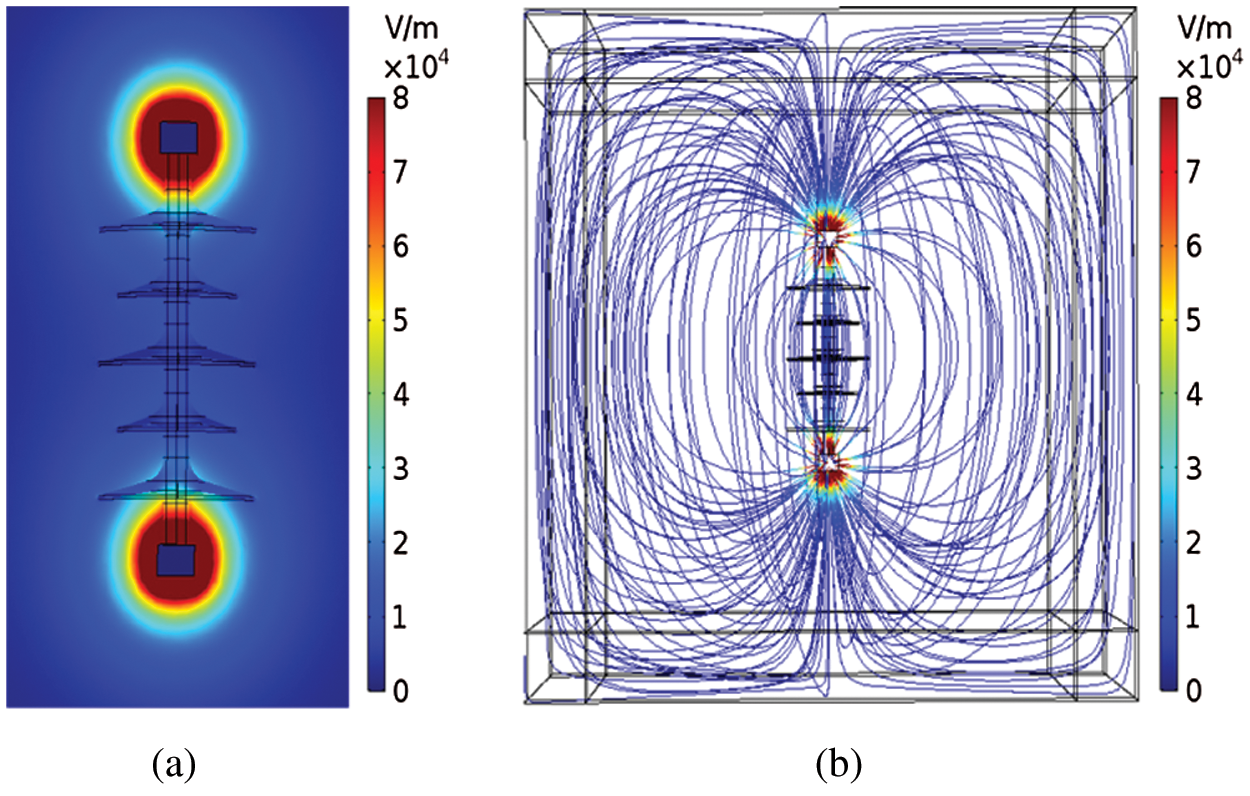
Figure 4: Distribution diagram of field strength and spatial electrical field lines of the insulator surface without water droplets condensation (a) Cloud image of field strength (b) Distribution map of electrical field lines
As can be seen from Fig. 4a, the electrical field strength at the insulator end-fittings is much greater than that at the middle umbrella skirt. As shown in Fig. 4b, the electrical field lines of the insulator are dense at end-fittings and sparse in the middle, which also shows that the electrical field strength at the insulator end-fittings is higher and the electrical field line near the insulator is weaker. Moreover, the closer the insulator is, the denser the electrical field line is, indicating that the field strength near the insulator is larger. This accords with the relevant theory of electromagnetic field, which shows that the distribution characteristic of electrical field around insulator obtained by numerical simulation method is acceptable.
Fig. 5 shows the field intensity cloud diagram and the spatial electrical field line distribution diagram under the action of the DC voltage when water droplets are condensed on the insulator surface.
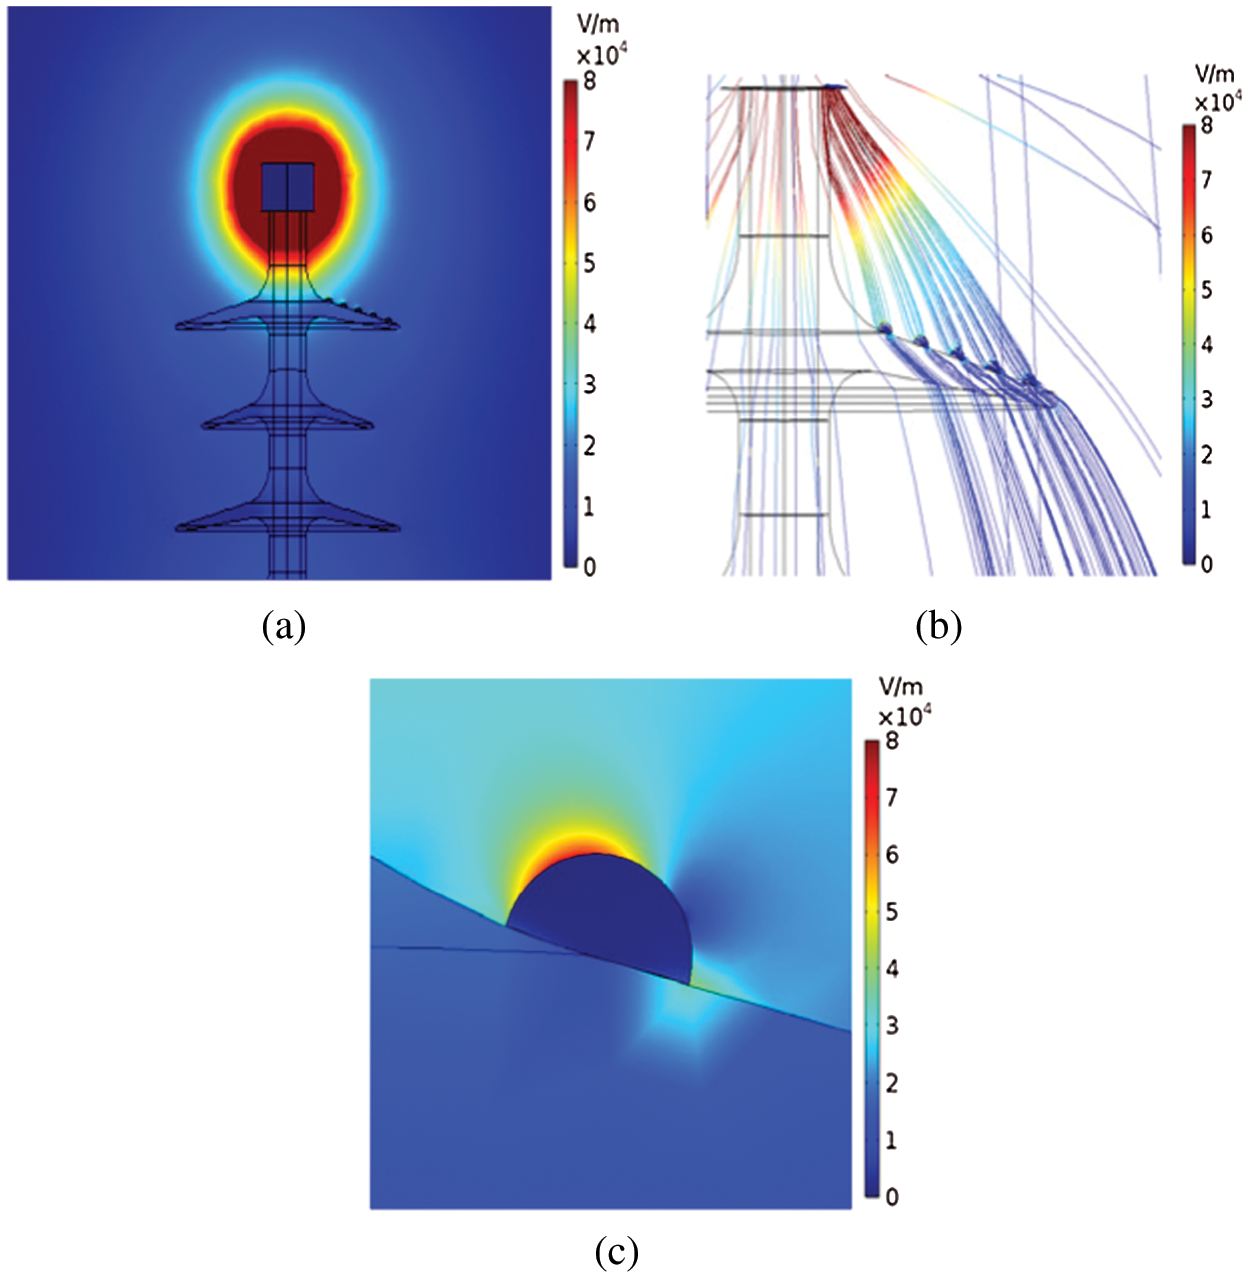
Figure 5: Field strength and spatial electrical field line distribution diagram of the insulator surface with water droplets condensation (a) Cloud image of field strength (b) Distribution map of local electrical field lines (c) A partial enlarged view of the electrical field distribution near a single drop
It can be seen from Fig. 5a that the closer to the insulator central axis, the greater the electrical field intensity on the water droplets surface is, which is in line with the actual distribution of the electrical field. From the Fig. 5b, it can be seen that the electrical field line near the water droplets surface are denser, so the electrical field strength is higher than that of the surrounding parts, which further shows that the electrical field along the insulator surface is distorted obviously by the water droplets. It can be seen from Fig. 5c that the electrical field strength on the water droplets surface is much higher than that of the surrounding electrical field, while the internal electrical field strength is on the contrary due to the surface shielding effect. This phenomenon may be related to the discharge of the water droplets quasi-its dielectrical constant, size and conductivity [31]. The electrical field strength at the intersection of the water droplets with the insulator surface and the air increases obviously, which may be due to the fact that the dielectrical constant of water droplets is much larger than that of the silicone rubber and the air [32].
3.4 Validation of the Numerical Simulation Method
The simulation method in this study refers to the reference [33], which is similar to it. Both of them have studied the composite insulator, and they are consistent in the setting of single-value conditions. In the reference [33], the potential near the insulator umbrella skirt at the ground terminal is the lowest, and the potential at the high-voltage terminal is the highest; the spatial potential distribution is approximately spherical from end-fittings to all sides; the closer to the insulator wall, the denser the electrical field line is, the greater the corresponding field strength is; the electrical field strength near the umbrella skirt at the ground terminal is also concentrated to a certain extent, but lower than that at the high-voltage terminal. The electrical field strength near the middle umbrella skirt is low and the distribution is uniform, which accords with the principle of electromagnetic field correlation. Based on the above analysis, the conclusions from Fig. 4 are basically consistent with that in the reference [33]. The simulation method has been verified in the reference [33], and it is proved that the research method is acceptable.
Due to the limitations of the numerical simulation, it is difficult to obtain the specific values of the insulator electrical field strength and potential in the simulation. Therefore, we make a qualitative analysis of it in the study, and the results show that it accords with the relevant theory of electromagnetic field. In view of the simulation process, we have published a paper entitled “Effect of Water Drop on Electric Field Distortion of Composite Insulator” [28] in Power System Technology.
4 The Influence of Water Droplet-Induced Insulator Electrical Field Distortion on Its Contamination Characteristics
It can be seen from the above that when the water droplets condense on the insulator surface, the insulator surface electrical field will be distorted. Then, the electrical field force of the contaminated particles will be affected, and finally the contamination on the insulator surface will be affected. Therefore, selecting FXBW4-110/100 composite insulator as the research object, the influence of the wind speed and particles concentration on the contamination characteristics of the considered 110 kV insulator are analyzed.
4.1 Physical Model Implementation and Meshing
Representing the 110 kV DC voltage level of the actual transmission line, 11 pieces of the insulator are selected as the research object, and the insulator umbrella skirts are numbered in sequence from the ground terminal to the high-voltage terminal. Fig. 6 shows the three-dimensional model of the FXBW4-110/100 composite insulator when water droplets condense on it. The structure height is 1268 mm, and the other parameters are shown in Tab. 1. Based on the structural size of the 110 kV insulator, a rectangular parallelepiped calculation area of 1 m × 2 m × 2.1 m is established.
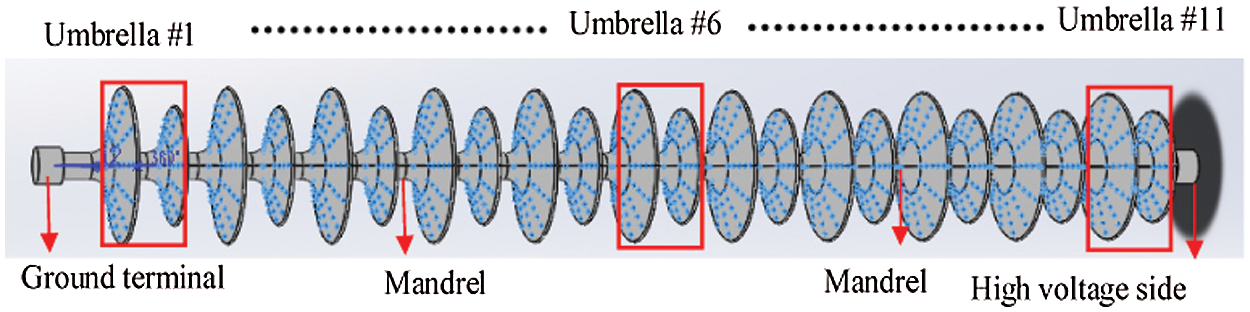
Figure 6: The three-dimensional model of the FXBW4-110/100 composite insulator with water droplets condensation
The grid division method is similar to that of Chapter 3, and the grid division of the natural pollution model is shown in Fig. 7.
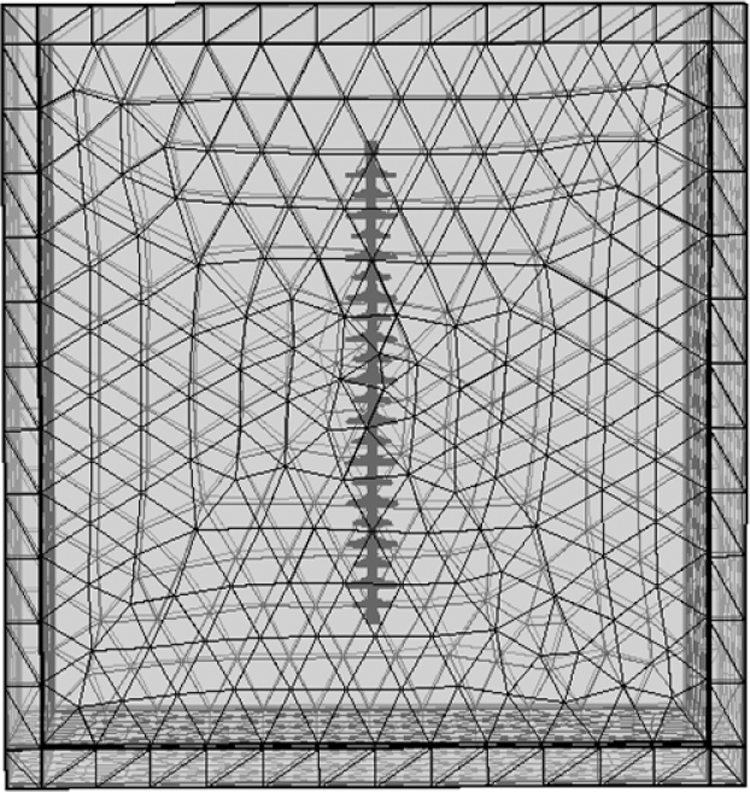
Figure 7: Grid division of natural pollution model
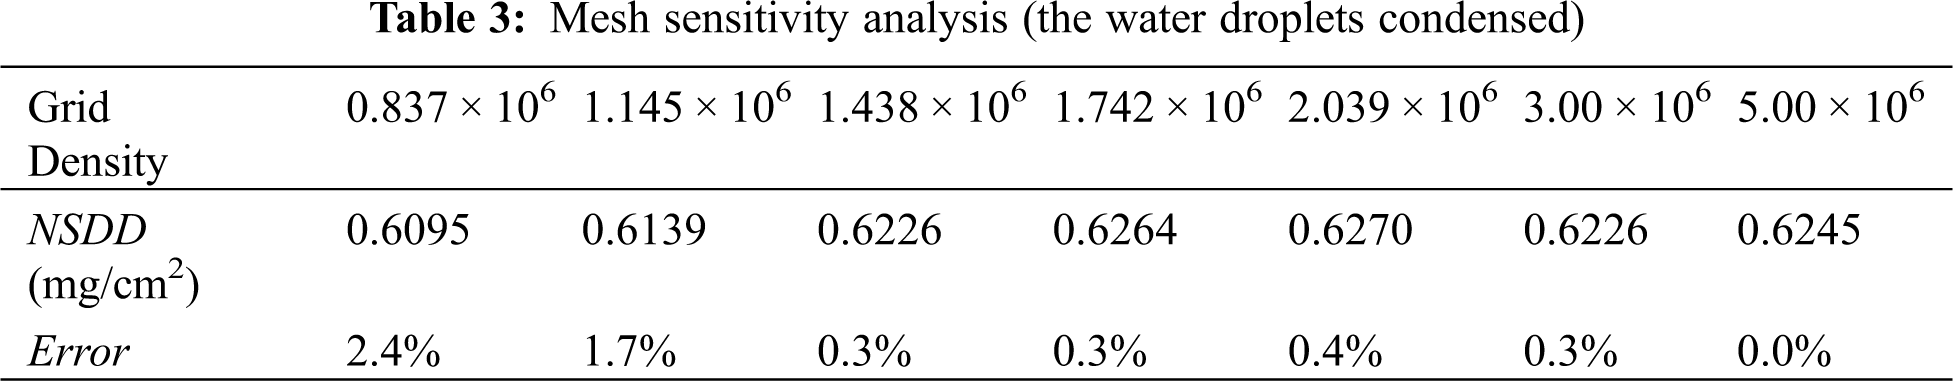
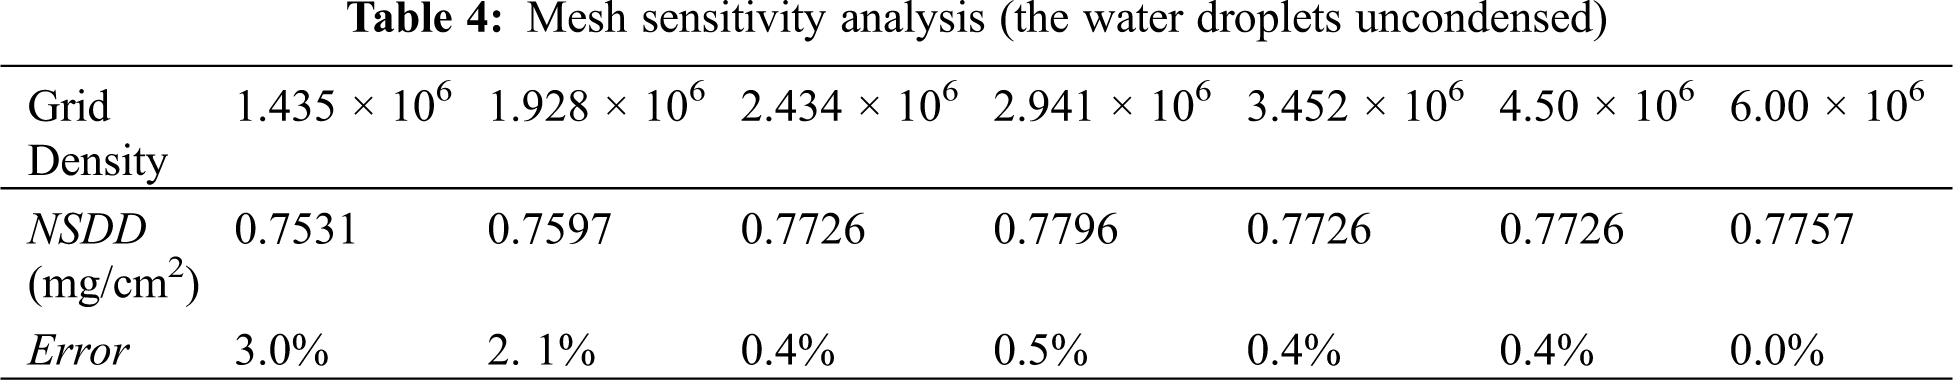
In this study, in the model of the FXBW4-10/100 composite insulator with or without water droplets condensation, by encrypting the number of grids, the accumulated pollution of the insulator with seven different grid numbers is calculated. Moreover, the errors of accumulated pollution are compared to explore the grid independence. The details are shown in Tabs. 3 and 4.
It can be seen from Tab. 3 that the errors from the first grid to the second grid are larger, which is approximately 2.1% to 3%. However, the errors from the third grid to the seventh grid are reduced by nearly one order of magnitude, reaching up to approximately 0.4% to 0.5%. From the above analysis, we can see that the difference of accumulated pollution from the third grid to the seventh grid is small. At the same time, it can be seen from Tab. 4 that the errors from the first grid to the second grid are approximately 1.7% to 2.4%, while the errors from the third grid to the seventh grid are reduced by nearly one order of magnitude, reaching up to approximately 0.3% to 0.4%. Therefore, there is little difference between the accumulated pollution from the third grid to the seventh grid. To sum up, no matter whether water droplets condense on the insulator surface, the contamination curve has stabilized from the third grid, and there is little difference between the third grid and the seventh grid. It can be considered that the grid independence has been achieved. In order to quickly carry out large-scale calculation, it is unnecessary to continue encryption processing. Therefore, 2.434 million grids and 1.438 million grids are selected for calculation in the numerical calculation.
4.2 Single Value Condition Setting
When studying the contamination characteristics of the insulator surface area, the flow field, electrical field and particle field in COMSOL are mainly used [33]. The boundary condition settings of each physics field are introduced, and the specific settings are shown in Fig. 8. The setting of physical parameters is the same as the physical model of the 10 kV insulator, and the specific settings are shown in Tab. 2.
4.2.1 Setting of Flow Field Boundary Conditions
In the flow field area, the inlet end is set as the velocity inlet, the outlet side as the pressure outlet, and the other four sides are set as the “symmetric” boundary conditions. Those settings conform to the free flow of actual air in the infinite space, and make the contamination characteristics on the insulator surface more close to the actual situation. Moreover, the wall function is used to solve the velocity and pressure distribution. The particles enter with the wind from the entrance, and the wind speed is set to (1, 3, 5, 7) m/s.
4.2.2 Setting of Electrical Field Boundary Conditions
Corresponding to the characteristics of the DC voltage in the actual transmission line, in the numerical simulation of the electrical field, the average value of 90 kV is applied under the DC voltage, and the steady-state calculation and analysis are adopted.
4.2.3 Setting of Boundary Conditions of Particle Field
In the simulation of natural contamination accumulation, the pollution particles are released from the entrance and enter with the wind, and their particle sizes are set as 10 μm and 15 μm, respectively. The pollution particles used are atmospheric flying ash particles with a density of 2200 kg/m3. The charge situation of flying ash particles in the atmosphere is complicated [34], and the magnitude and polarity of its charge will affect its electrical field force in the electrical field. Under natural conditions, the proportion of positive charge, negative charge and uncharged charge of flying ash particles in the atmosphere are approximately 31%, 26% and 43%, respectively. Moreover, the average charge of positive and negative charges are 6.3 × 10⁻⁶ C/g and 7 × 10⁻⁶ C/g, respectively. In the particle field, when the pollution particles collides with the insulator surface, it will be deposited on the insulator surface if it meets the deposition criterion, otherwise it will rebound. The deposition criterion is still set corresponding to the reference [23].
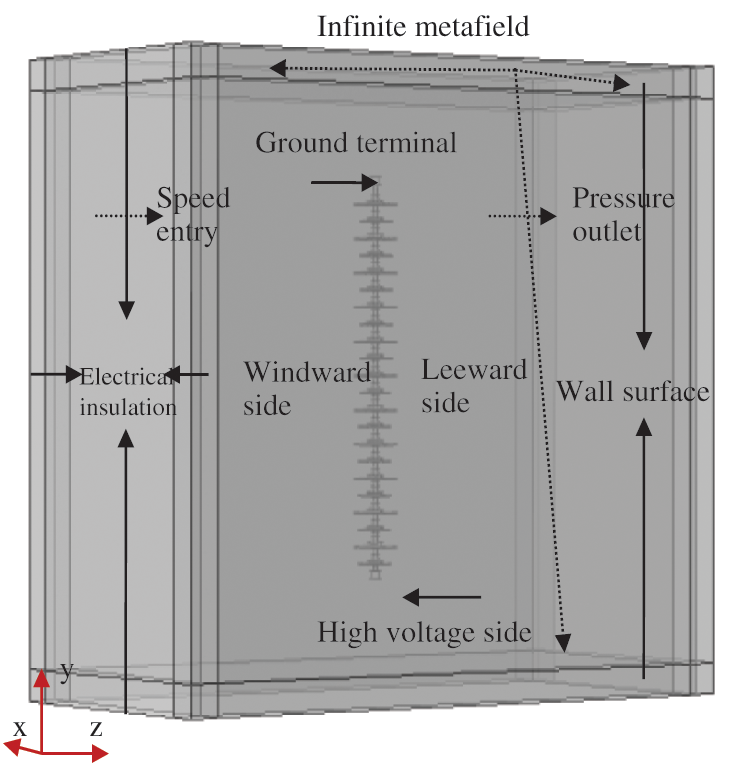
Figure 8: The FXBW4-110/100 composite insulator physical field boundary condition settings
4.3 Analysis of Field Force Simulation Results
The movement of pollution particles in the air in the flow field and deposition on the insulator surface can be divided into two processes: the movement process of pollution particles near the insulator and the collision adhesion process on the insulator surface. Before the pollution particles move to the insulator surface, they are mainly affected by gravity Fg, electrical field force Fe, and fluid drag force Fd, while other forces can be ignored. The calculation formulas of these three forces are as follows:
In the formula: mp is the mass of the particle, kg; u is the instantaneous velocity of the particle, m/s; g is the acceleration of gravity, m/s2; Fg, Fd, and Fe are the gravity, fluid drag force and electrical field force on the particle, respectively, N; τp is the response time of the particle in the flow field, s; ρp is the particle density, kg/m3; dp is the particle diameter, m; v is the velocity of the flow field, m/s; μ is the aerodynamic viscosity, Pas; e is the amount of elementary charge, 1.60 × 10⁻¹⁹ C; Z is the number of particles charged; E is the space electrical field strength, V/m.
In order to explore the influence of various forces on the insulator contamination characteristics when water droplets condense on the insulator surface, this study discusses the relative relationship between the electrical field force, fluid drag force and gravity when the pollution particles move in the flow field. Selecting the wind speed of 7 m/s, the particle size of 15 μm and the pollution concentration of 0.3 mg/cm3 as an example, Fig. 9 shows the numerical values of Fd/Fg and Fe/Fg in all directions on the insulator surface with or without water droplets condensation. The orientation settings for x, y, z are shown in Fig. 8.
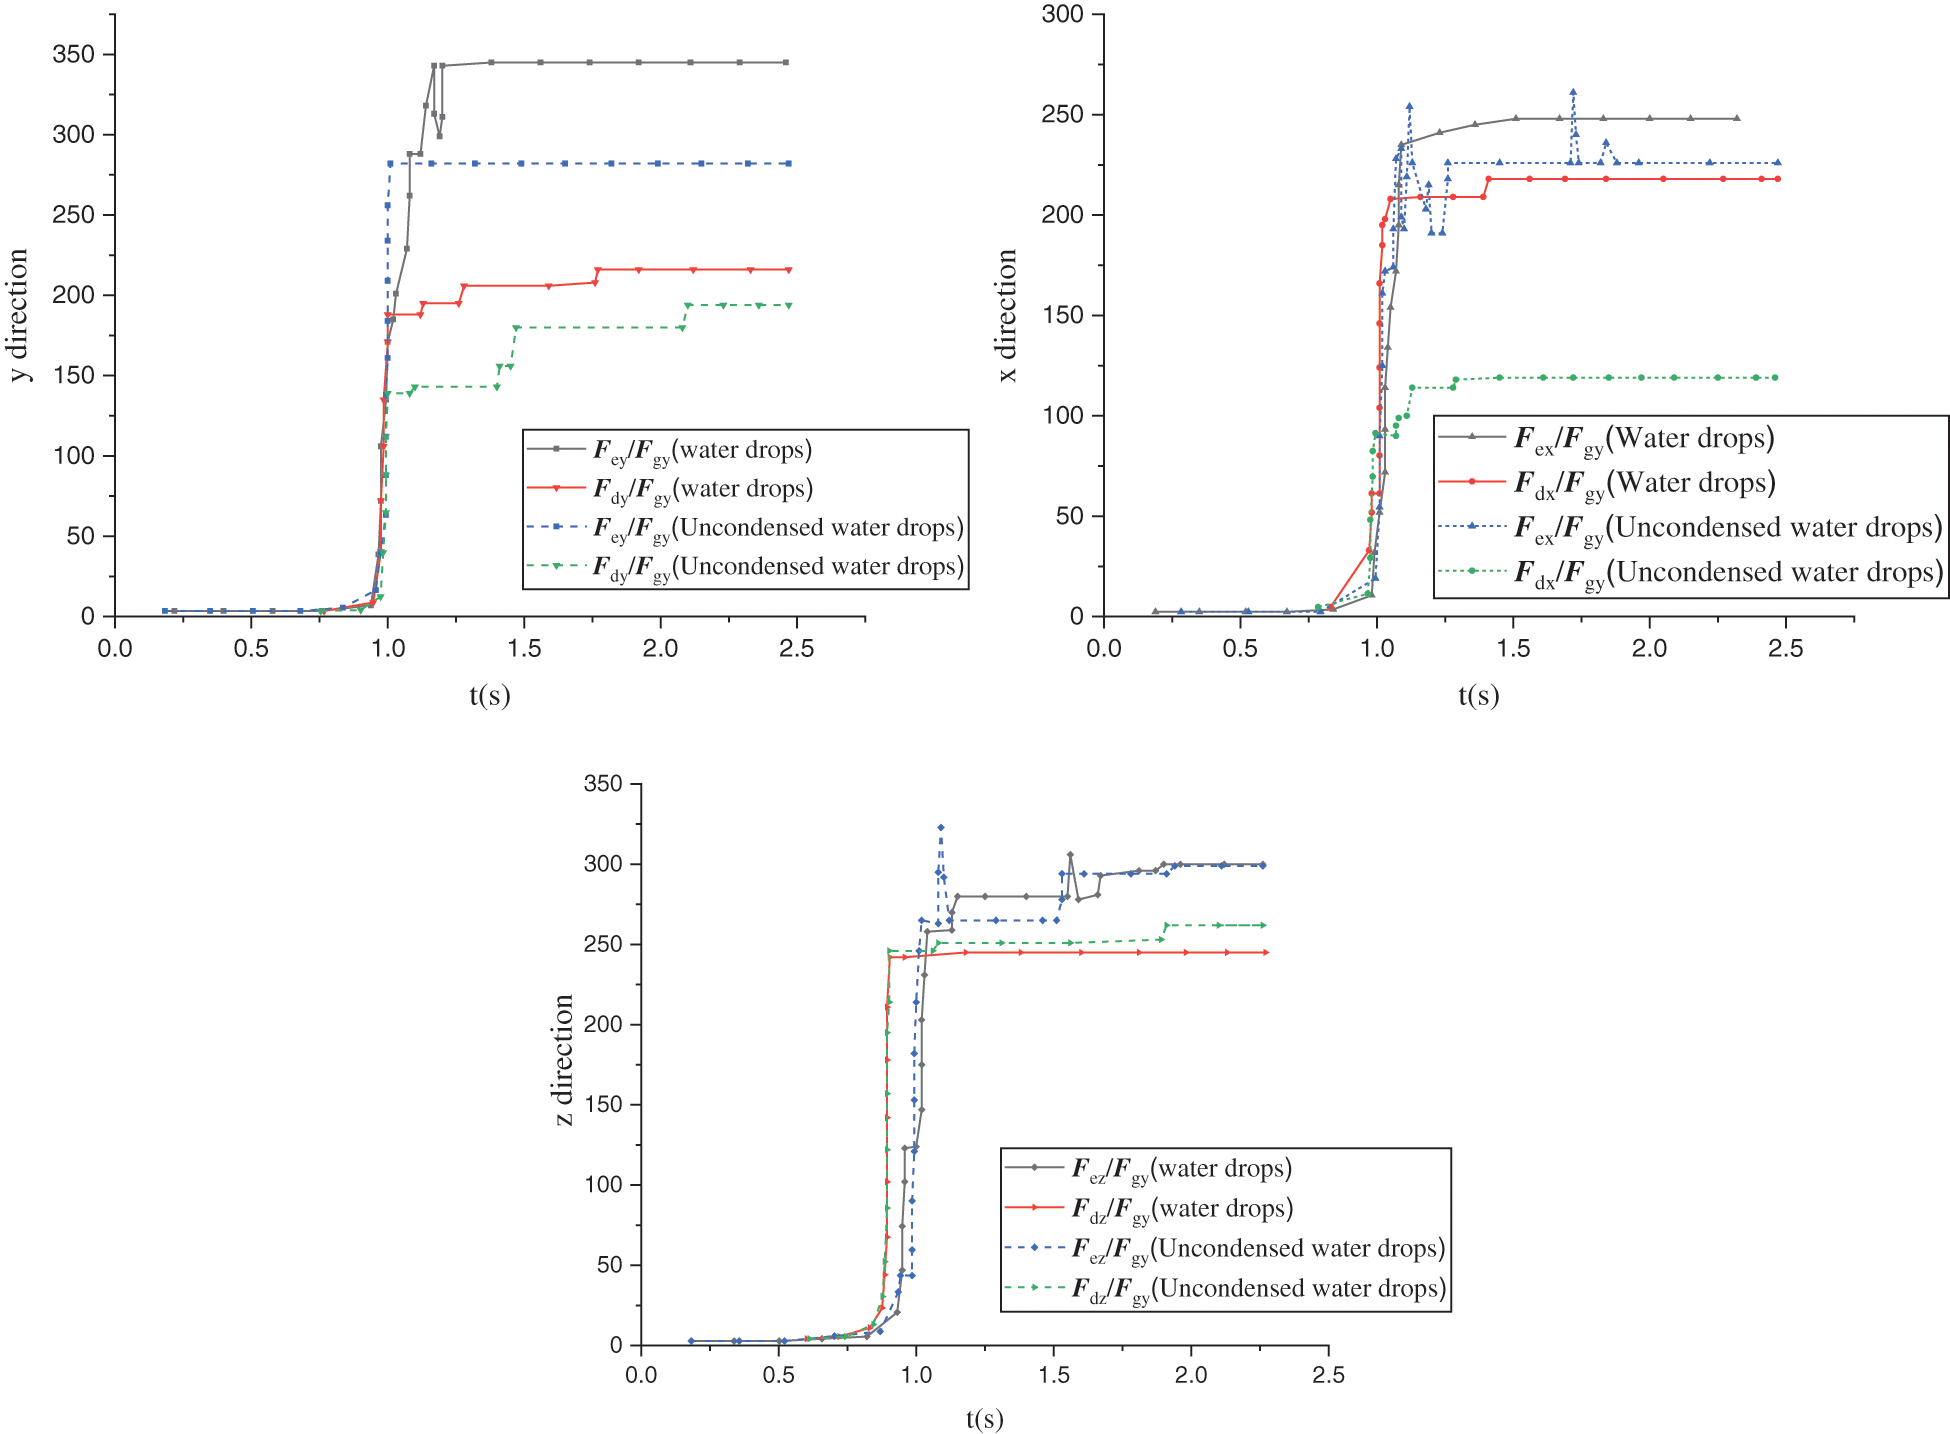
Figure 9: The ratio of fluid drag force and electrical field force to gravity in all directions with or without water droplets condensation
As can be seen from Fig. 9, in the z direction (quasi-the horizontal flow direction), the order of magnitude of Fd/Fg and Fe/Fg on the particles in all directions is 102, whether water droplets condense on the insulator surface. When the pollution particles move for 1 s to reach the insulator leeward side, the electrical field force begins to be greater than the fluid drag force. In the y direction (quasi-the gravity direction perpendicular to the incoming flow direction), when water droplets condense on the insulator surface, the ratio of electrical field force to gravity is still in the order of 102. However, it is approximately 60 times higher than that when there are no water droplets condensation on the insulator surface. It shows that the existence of water droplets has a great influence on the electrical field. On the other hand, the condensation of water droplets on the insulator surface has little effect on the ratio of fluid drag to gravity. In the x direction (quasi-perpendicular to the flow direction), when water droplets condense on the insulator surface, both Fdx/Fgx and Fex/Fgx increase in varying degrees. Fdx/Fgx increases by approximately 100 times, and Fex/Fgx increases by approximately 30 times, indicating that the existence of water droplets has an impact on fluid drag and electrical field force in this direction.
Compared with the figures in Fig. 9, it can be seen that when there are no water droplets condensation on the insulator surface, the ratio of fluid drag and electrical field force to gravity increases in turn along the x, y and z directions. When there are water droplets condensation on the insulator surface, the ratio of fluid drag to gravity has little difference in these three directions. However, the ratio of electrical field force to gravity reaches up to the maximum in the y direction, which increases by approximately 60 times. To sum up, the existence of water droplets has a certain influence on the flow field and electrical field.
4.4 Analysis of the Influence of the Wind Speed on Contamination Characteristics
The wind speed has double effects on the contamination accumulation on the insulator surface. On the one hand, with the increase of the wind speed, the particle follows well, which increases the collision probability between it and the insulator surface, and aggravates the contamination accumulation. On the other hand, when the wind speed increases to a certain extent, the pollution particles deposited on the insulator surface may be blown away by the wind again. Fig. 10 shows the variation of the contamination with wind speed at different particle sizes (10 μm and 15 μm) and pollution concentrations (0.15 mg/m3 and 0.30 mg/m3).
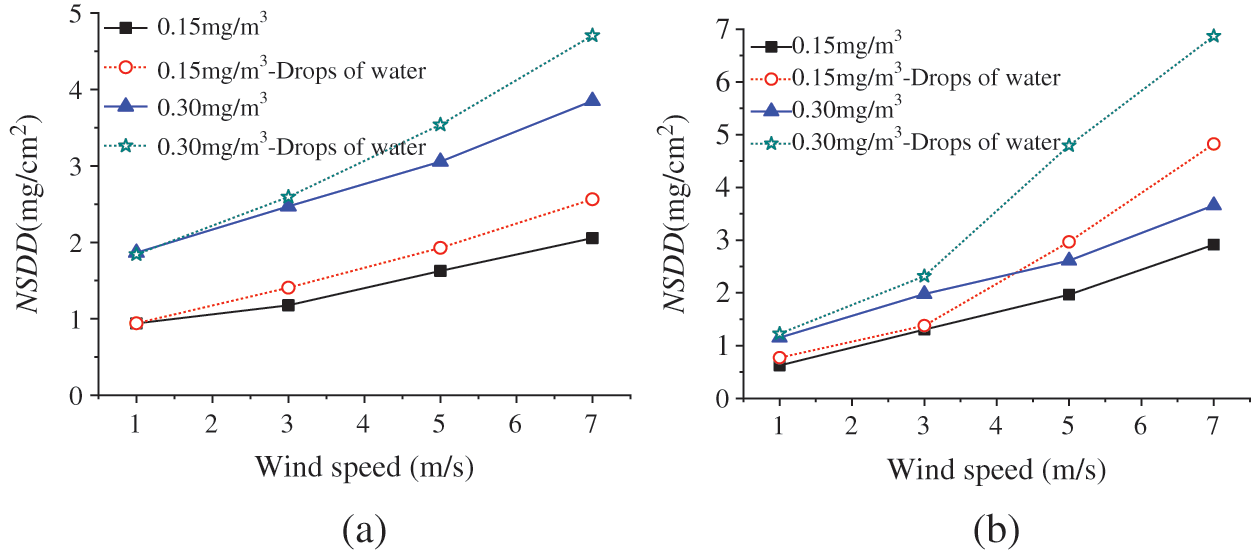
Figure 10: Variation of insulator surface area contamination with the wind speed (a) 10 μm (b) 15 μm
Fig. 10 shows that the overall amount of pollution on the insulator surface increases with the increment of the wind speed, regardless of whether there are water droplets condensation on the insulator surface or not. The particles follow well with the increment of the wind speed, which increases the collision probability with the insulator surface. Therefore, there is a positive correlation between the amount of pollution and the wind speed.
Comparing the two graphs in Fig. 10, it can be seen that at the same pollution concentration, compared with uncondensed water droplets, the accumulated pollution amount increases to a certain extent on the insulator surface with water droplets condensation, and the gap gradually increases with the increment of the wind speed. The reason may be: the existence of water droplets distorts the insulator surface electrical field, which makes the electrical field intensity increase. Moreover, the electrical field force on the pollution particles also increases, which aggravates the contamination on the insulator surface. The existence of water droplets will also aggravate the turbulence effect on the insulator leeward side. Therefore, with the increment of the wind speed, under the joint action of flow field and electrical field, the gap between the amount of accumulated pollution and that of uncondensed water droplets is getting wider and wider.
4.5 Analysis of the Influence of Pollution Concentration on Contamination Characteristics
In order to explore the pollution accumulation on the insulator surface with different pollution concentrations, the pollution concentration is classified according to 1–3 times of the PM 10-day average standard (0.15 mg/m3) [27] quasi-mild pollution (0.15 mg/m3), moderate pollution (0.3 mg/m3) and severe pollution (0.45 mg/m3). Fig. 11 shows the variation of pollution concentration on the insulator surface with water droplets condensation under different particle sizes (10 μm and 15 μm) and wind speeds (1 m/s, 3 m/s, 5 m/s, 7 m/s).
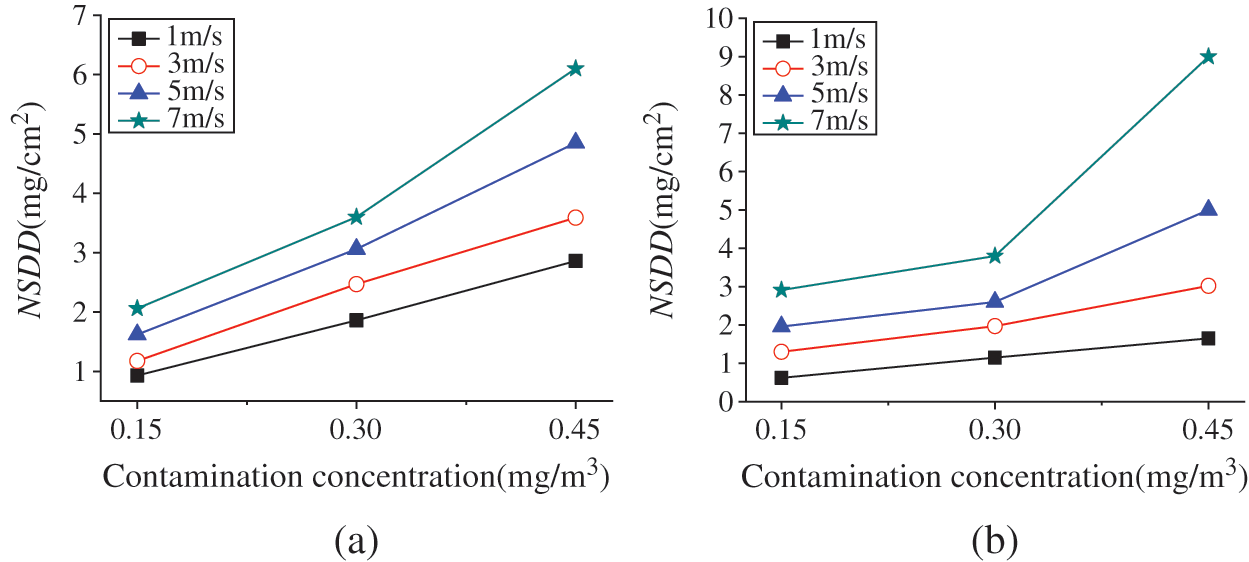
Figure 11: The change of insulator surface area contamination with contamination concentration (a) 10 μm (b) 15 μm
It can be seen from Fig. 11 that under two kinds of particle size, the amount of accumulated pollution increases with the increment of pollution concentration. At low wind speeds, the amount of accumulated pollution and the concentration of pollution basically increase linearly, and with the increment of the wind speed, the amount of accumulated pollution increases rapidly with the increment of pollution concentration. The reason may be that the pollution particles are affected by the continuous electrical field force, and the number of pollution particles per unit volume increases exponentially with the increment of pollution concentration, which directly leads to a great increment in the collision probability between pollution particles and the insulator surface so that the amount of contamination increases. At low wind speeds, the kinetic energy of pollution particles is small, the follow-up property is poor, and the reflux and eddy current formed on the insulator leeward side are weak, so that the increase of pollution amount is small.
In this study, the COMSOL software is used to simulate such a process for the FXBW4-10/100 composite insulator with or without water condensation under a 10 kV DC voltage. The influence of the wind speed and particles concentration on the contamination characteristics of the considered 110 kV insulator is analyzed. The results show that:
1) the electrical field along the insulator surface is obviously distorted by water droplets, and the field strength at the intersection among the water droplet, the insulator surface and air increases obviously.
2) the effect of electrical field force on the pollution particles increases obviously on the insulator surface with water droplets condensation. The ratio of electrical field force to gravity reaches up to the maximum in the y direction, and the increment is approximately 60 times. In the x direction, the ratio of electrical field force to gravity increases by 30 times.
3) regardless of whether water droplets condense on the insulator surface or not, the overall amount of pollution on the insulator surface increases with the increment of the wind speed. At the same pollution concentration, the amount of pollution increases to a certain extent on the insulator surface with water droplets condensation, and the gap increases gradually with the increment of the wind speed.
4) at low wind speeds, the amount of accumulated pollution and the concentration of pollution basically increase linearly, and with the increment of the wind speed, the amount of accumulated pollution increases rapidly with the increment of pollution concentration.
Funding Statement: Science and Technology Project of State Grid Corporation (GY7111053) [www.sgcc.com.cn].
Conflicts of Interest: The authors declare that they have no conflicts of interest to report regarding the present study.
1. Lv, Y. K., Yang, J. X., Wang, J. W. (2020). CFD simulation of a bag filter for a 200MW power plant. Fluid Dynamics & Materials Processing, 16(6), 1191–1202. [Google Scholar]
2. Amini, M. A., Sedighi, A. R. (2014). A new procedure for determination of insulators contamination in electrical distribution networks. International Journal of Electrical Power and Energy Systems, 61, 380–385. [Google Scholar]
3. Salem, A. A., Abd-Rahman, R., Al-Gailani, S. A., Kamarudin, M. S., Ahmad, H. et al. (2020). The leakage current components as a diagnostic tool to estimate contamination level on high voltage insulators. IEEE Access, 8, 92514–92528. [Google Scholar]
4. Deb, S., Choudhury, N. R., Ghosh, R., Chatterjee, B., Dalai, S. (2018). Short time modified Hilbert Transform-Aided sparse representation for sensing of overhead line insulator contamination. IEEE Sensors Journal, 18, 8125–8132. [Google Scholar]
5. Salem, A. A., Abd-Rahman, R., Rahiman, W., Al-Gailani, S. A., Al-Ameri, S. M. et al. (2021). Pollution flashover under different contamination profiles on high voltage insulator: Numerical and experiment investigation. IEEE Access, 9, 37800–37812. [Google Scholar]
6. Yu, X. Z., Zhang, Q. G., Yang, X. L., Yang, H., Liu, B. et al. (2018). Influence of non-uniform hydrophobicity distribution on pollution flashover characteristics of composite insulators. IET Science, Measurement & Technology, 12(8), 1009–1014. [Google Scholar]
7. Sarang, B., Lakdawala, V., Basappa, P. (2009). Electrical field calculations on a high voltage insulator under wet conditions. IEEE Electrical Insulation Conference, pp. 86–90. [Google Scholar]
8. Lopes, I. J. S., Jayaram, S. H., Cherney, E. A. (2001). A study of partial discharges from water droplets on a silicone rubber insulating surface. IEEE Transactions on Dielectricals and Electrical Insulation, 8(2), 262–268. [Google Scholar]
9. Mavrikakis, N., Siderakis, K., Kourasani, D., Pechynaki, M., Koudoumas, E. (2015). Hydrophobicity transfer mechanism evaluation of field aged composite insulators. IEEE 5th International Conference on Power Engineering, Energy and Electrical Drives, pp. 215–219. [Google Scholar]
10. Barsch, R., Lambrecht, J., Jahn, H. (1996). On the evaluation of the hydrophobicity of composite insulator surfaces. Proceedings of Conference on Electrical Insulation and Dielectric Phenomena, 2, 468–471. [Google Scholar]
11. Su, Z. Y., Liu, Y. S. (2004). Comparison of natural contaminants accumulated on surfaces of suspension and post insulators with dc and ac stress in Northern China’s inland areas. Power System Technology, 28(10), 13–17. [Google Scholar]
12. Fan, J. B., Su, Z. Y., Li, W. F., Li, P., Zhou, J. (2007). Research on profiles of HVDC post insulator and bushing. Proceedings of the Chinese Society of Electrical Engineering, 27(21), 1–6. [Google Scholar]
13. Jiang, X. L., Han, X. B., Hu, Y. Y., Yang, Z. Y. (2018). Model for ice wet growth on composite insulator and its experimental validation. IET Generation, Transmission & Distribution, 12(3), 556–563. [Google Scholar]
14. Lv, Y. K., Zhao, W. P., Li, J. G., Zhang, Y. Z. (2017). Simulation of contamination deposition on typical shed porcelain insulators. Energies, 10(7), 1045–1057. [Google Scholar]
15. Al-Hassani, K. A., Alam, M. S., Rahman, M. M. (2021). Numerical simulations of hydromagnetic mixed convection flow of nanofluids inside a triangular cavity on the basis of a two-component nonhomogeneous mathematical model. Fluid Dynamics & Materials Processing, 17(1), 1–20. [Google Scholar]
16. Ryad, C., Djamel, S., Adel, S., Smail, M. (2019). Numerical simulation of double diffusive mixed convection in a horizontal annulus with finned inner cylinder. Fluid Dynamics & Materials Processing, 15(2), 153–169. [Google Scholar]
17. Hamimid, S., Guellal, M. (2014). Numerical study of combined natural convection-surface radiation in a square cavity. Fluid Dynamics & Materials Processing, 10(3), 377–393. [Google Scholar]
18. Homma, S., Yokotsuka, M., Tanaka, T., Moriguchi, K., Koga, J. et al. (2011). Numerical simulation of an axisymmetric compound droplet by three-fluid front-tracking method. Fluid Dynamics & Materials Processing, 7(3), 231–240. [Google Scholar]
19. Lv, Y. K., Yang, J. X., Wang, J. W., Zhang, R. C., Yang, S. et al. (2020). Numerical simulation of retrofit scheme of a boiler tail flue. Fluid Dynamics & Materials Processing, 16(6), 1203–1217, 1203. [Google Scholar]
20. Redchyts, D. O., Shkvar, E. A., Moiseienko, S. V. (2019). Control of karman vortex street by using plasma actuators. Fluid Dynamics & Materials Processing, 15(5), 509–525. [Google Scholar]
21. Benziada, M. A., Boubakeur, A., Mekhaldi, A. (2019). Investigations of non-uniform pollution impact on electrical field distribution in a point-barrier-plane arrangement under AC voltage. International Conference on Advanced Electrical Engineering, pp. 1–4, 2019. [Google Scholar]
22. Jabbari, M., Volat, C., Fofana, I. (2014). Application of a new dynamic numerical model to predict polluted insulator flashover voltage. IEEE Electrical Insulation Conference, pp. 102–106, 2014. [Google Scholar]
23. Lv, Y. K., Li, J. G., Zhao, W. P. (2017). Model optimization of pollution deposition criterion of insulators based on energy. IEEE Transactions on Dielectricals and Electrical Insulation, 24(5), 2920–2929. [Google Scholar]
24. Khaldi, N., Mhiri, H., Bournot, P. (2014). A comparative study of turbulence models performance for a 300 MWe tangentially fired pulverized-coal furnace. 5th International Renewable Energy Congress, pp. 1–6. [Google Scholar]
25. Zhang, X. M. (2017). Simulation study on the effect of particle charge on pollution accumulation characteristics of insulator. North China Electrical Power University. [Google Scholar]
26. Yao, J. F., Jiang, Z. P., Zhao, T., Wang, H., Chen, B. et al. (2019). Analysis of cell dielectrophoretic motion with microfluidic device embedding multi-electrodes. Chinese Journal of Analytical Chemistry, 47(2), 221–228. [Google Scholar]
27. Elimelech, M., Gregory, J., Jia, X., Williams, R. A. (2013). Particle deposition and aggregation: Measurement, modelling and simulation, pp. 263–289. Butterworth-Heinemann. [Google Scholar]
28. Lv, Y. K., Wang, J. W., Song, Q. Z., Liu, Y. P. (2021). Effect of water drop on electrical field distortion of composite insulator. Power System Technology, 45(3), 1201–1207. [Google Scholar]
29. Wu, G. N., Shao, M. C., Peng, S., Yang, K. S., Zhang, X. Q. (2017). Distribution of surface electric field of water and water droplets landing and its influence on the insulator flashover characteristics. High Voltage Engineering, 43(2), 557–566. [Google Scholar]
30. Lv, Y. K., Song, Q. Z., Wang, Z. P., Liu, Y. P. (2020). Simulation of fouling characteristics of xsp-160 porcelain three umbrella insulators under low wind speed. Transactions of China Electrotechnical Society, 35(10), 2257–2265. [Google Scholar]
31. Xu, Z. N., Lu, F. C., Li, H. M. (2010). Influence of separated globules on post insulator electric field distribution. High Voltage Engineering, 36(9), 2278–2284. [Google Scholar]
32. Wang, Z. Y., Wang, Q., Chen, Q. (2009). Electric field analysis of water droplet on hydrophobic surface of polymer insulator. High Voltage Apparatus, 45(6), 5–11. [Google Scholar]
33. Lv, Y. K., Zhang, X. M., Li, J. G., Wei, S. K., Lv, Z. W. (2017). Numerical simulation of the contamination characteristics of composite insulators. High Voltage Apparatus, 53(8), 73–80. [Google Scholar]
34. White, H. J., Wang, C. H. (1984). Industrial electrical dust collection. China: Metallurgical Industry Press. [Google Scholar]
 | This work is licensed under a Creative Commons Attribution 4.0 International License, which permits unrestricted use, distribution, and reproduction in any medium, provided the original work is properly cited. |