| Fluid Dynamics & Materials Processing |
DOI: 10.32604/fdmp.2021.016710
ARTICLE
Numerical Simulation and Experimental Analysis of the Influence of Asymmetric Pressure Conditions on the Splitting of a Gas-Liquid Two-Phase Flow at a T-Junction
1College of Pipeline and Civil Engineering, China University of Petroleum, Qingdao, 266580, China
2Shandong Provincial Key Laboratory of Oil & Gas Storage and Transportation Safety, China University of Petroleum, Qingdao, 266580, China
3China National Oil and Gas Exploration and Development Corporation, Beijing, 100034, China
*Corresponding Author: Limin He. Email: upcmpfs@163.com
Received: 19 March 2021; Accepted: 21 April 2021
Abstract: Dedicated experiments and numerical simulations have been conducted to investigate the splitting characteristics of a gas-liquid two phase flow at a T junction. The experiments were carried out for different gas-liquid velocities. The flow rates in the two branches were measured accurately to determine how the two considered phases distribute in the two outlets. The experimental results have shown that when the two outlet pressures are asymmetric, the two-phase flow always tends to flow into the outlet which has a lower pressure. As the inlet liquid velocity increases, however, the two-phase flow gradually tends to split evenly. Compared with the experiment results, the pressure difference between the two outlets can be determined more accurately by means of numerical simulation. The trends of experimental results and simulations are in very good agreement.
Keywords: Two-phase flow; pressure; flow loop; gas-liquid split characteristics; simulation
Two-phase gas–liquid flows are usually observed in many systems, including oil recovery production, chemical industry, refrigeration systems and nuclear plants [1]. In these fields, it is common to split a stream of gas–liquid two-phase flow into two or more branches. When two-phase flow passes a distributor, such as a Tee junction, unequal split of the phases may occur. The word “mal-distribution” has been generally used for two meanings, one of which indicates unequal flow rates [2] and the other implies uneven liquid-gas ratios [3]. Therefore, the relevant studies have two different focuses. Some studies aim to eliminate flow rate mal-distribution and achieve both even flow rate and gas liquid ratio, others focus on equal-gas-liquid-ratio split with unequal flow rates. Of all the studies in literature, the number of the latter is dominant. On the one hand, severe mal-distribution has a significant effect on the safety and the efficiency of downstream equipment. For example, in the evaporator of the heat exchanger, dry-out phenomenon may happen unexpectedly in the parallel channels due to the phase uneven split. In a series of gravitational separators, uneven oil and gas phase distributions may lead to poor separation efficiency and liquid level control problems. On the other hand, the phase separation at tee junctions makes it possible to use tee junction as partial phase separators [4], which could separate gas and liquid to some extent. Therefore, the performance of phase splitting of gas–liquid two-phase flow in the distributor has been a hot and important topic in multiphase flow researches.
Up to now, scholars have carried out a lot of research work on the gas-liquid two-phase flow split at the T-junction. El-Shaboury et al. [5] investigated the flow patterns of stratified, wavy and annular flow splitting at the impacting tee and Alvarez et al. [6] conducted experiment with slug flow. Mi et al. [7] studied the shunt characteristics of slug flow from a single pipe into a parallel separator. These three studies reveal that keeping downstream equipment at the same operating conditions will lead to even split with equal flow rates and gas liquid ratios, independent of the inlet flow regime. Mohamed et al. [8] investigated the individual effects of pipe diameter and system pressure on the phase spilt at the horizontal impacting tees. Liu et al. [9] showed that the inlet and outlet pressure had a great influence on the gas-liquid two-phase mass flow rate. Hong and Griston [10] investigated the effect of insert devices within the impacting tees. They concluded that these devices have a significant influence on the phase split. El-Shaboury et al. [11,12] summarized the literature on the gas-liquid two-phase flow split characteristics at the impacting T-junction, and discussed in detail the effects of gas velocity, liquid velocity, mass and pressure at the inlet. A new parameter, momentum flux ratio, was proposed to explain the splitting behavior of gas-liquid two-phase flow. Chien et al. [13] used steam-water experimental data to establish an empirical model to predict the phase distribution of a horizontal impacting T-junction. Hwang et al. [14] established the streamline method to divide the gas-liquid two-phase flow at the T-shaped tube. Issa et al. [15] and Ellison et al. [16] used computational fluid dynamics (CFD) approach to model two-phase through branching tees. Hatziavramidis et al. [17] used the two-fluid model for CFD modeling two-phase through impacting tees. Lahey [18] developed a 3-D CFD model for two-phase through branching tees and the ‘Zone of Influence’ in the junction was predicted appropriately. Adechy et al. [19] proposed a 3-D CFD model to simulate annular flow through a horizontal branching tee. It is found that the predictions for phase split agree quite well with measurements from an independent experiment for a range of phase split ratios. To study the splitting of gas-liquid flow from a horizontal flow line to two vertical risers, Henkes et al. [20] and Peeters [21] carried out 3-D CFD simulations and the simulations results of Henkes are quite different from the experiments results. During the simulation, both gas and liquid phases flow into one pipeline. The simulation results of Peeters show that when there is no pressure difference between the two outlets, the two-phase flow is always distributed evenly.
Previous studies showed that lots of experimental studies and CFD simulations have been done. However, there are relatively few studies on the influence of the outlet pressure of the branch pipeline on the split of two-phase flow at the T-junction. Therefore, both numerical simulation and experimental research was carried out to study the influence of the branch outlet pressure on the gas-liquid two-phase flow split at the impacting T-junction.
The experiment flow loop was established in the laboratory. Fig. 1 is the schematic diagram of the flow loop. Fig. 2 shows the photographs of the experimental pipelines. All the parts of the test loop were horizontal. Water was fed from the water tank 1 by a centrifugal pump, then was metered by a Micro Motion mass flow meter CMF100 before flowing into the two-phase mixing tee, where it was mixed with the gas phase. Three orifice meters were used to meter the air flow. Control valves were installed for control of water and air flow-rates. The inner diameter of the test loop was 40 mm. For the parallel horizontal pipelines, a developing length of about 11 m was allowed before the splitting section, which consists of an impacting tee. For this structure, the distance between the two branch pipes is 2.4 m. The mixture (air-water) splits into two parallel lines, which were directed to their respective separators. All the piping used for the construction of the test section was made from acrylic for visualization. In the separators, the individual flows of air and water were separated and then measured by Micro Motion mass flow meter CMF050. Water were pumped back to the water tank 1. A National Instruments’ Labview data acquisition system was utilized to acquire and process signals from flow the meters and pressure transmitters.
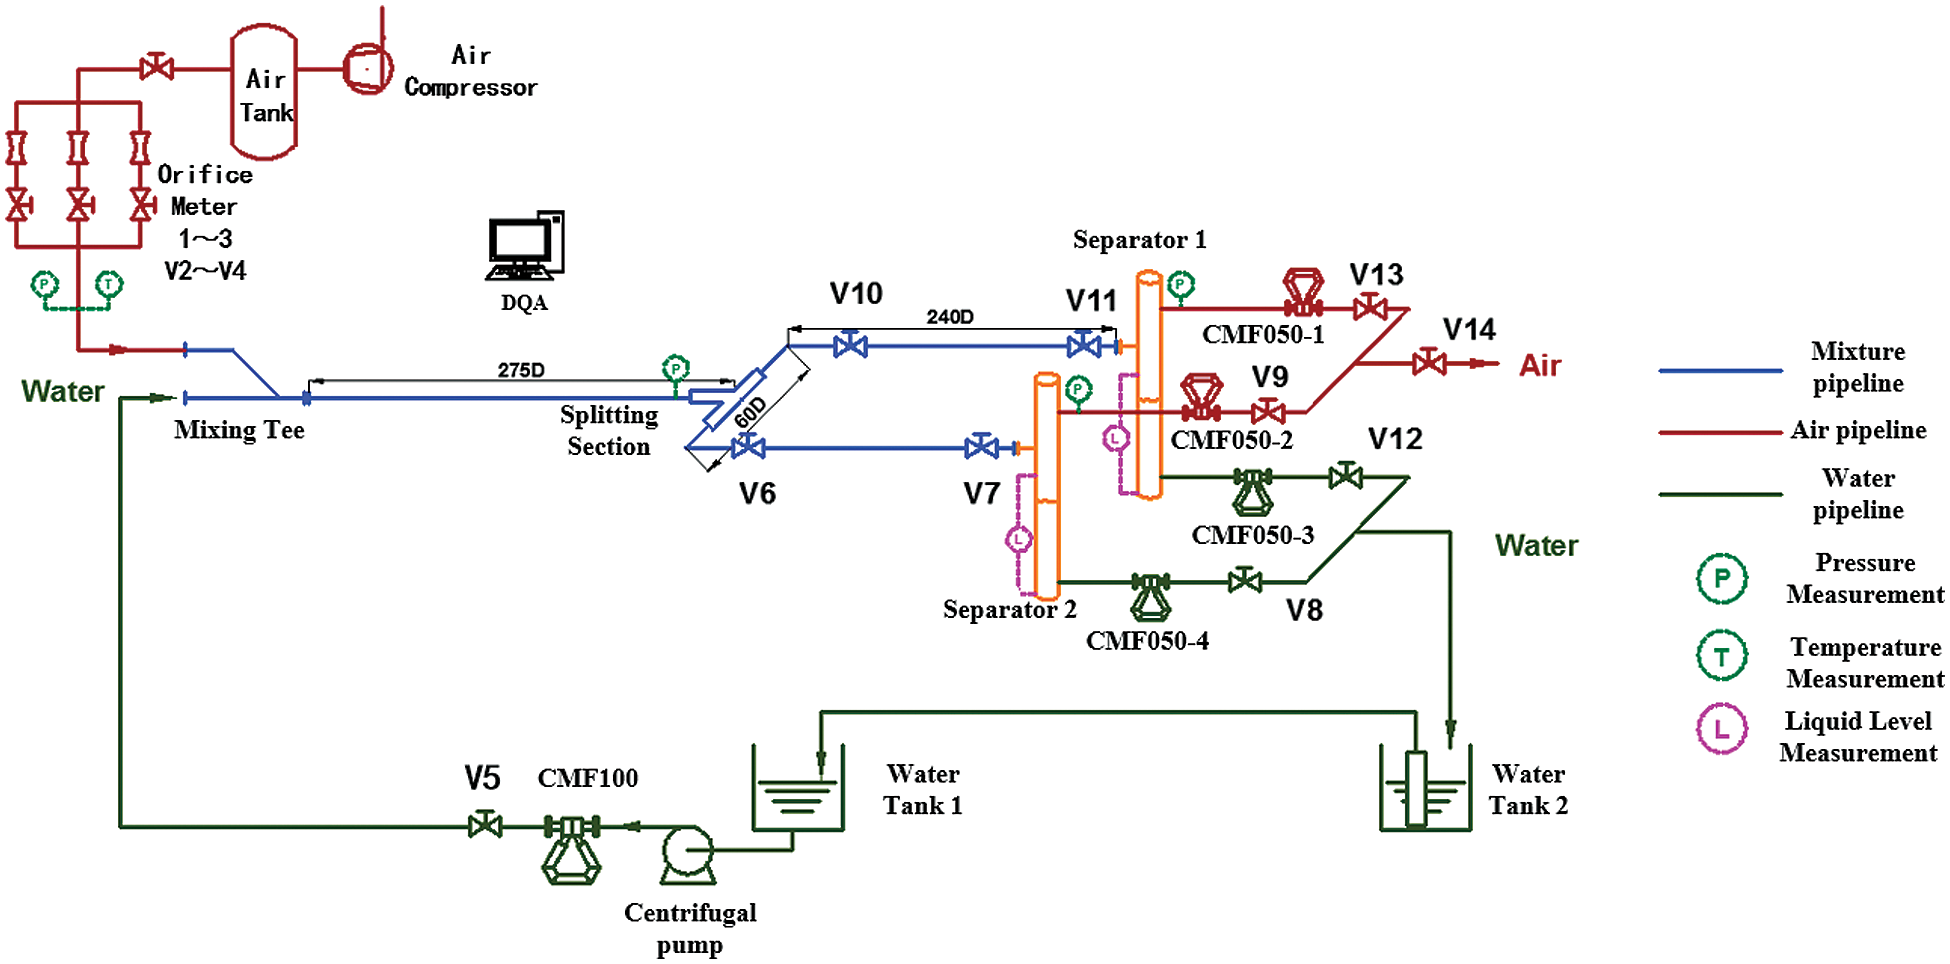
Figure 1: Schematic diagram of the flow loop
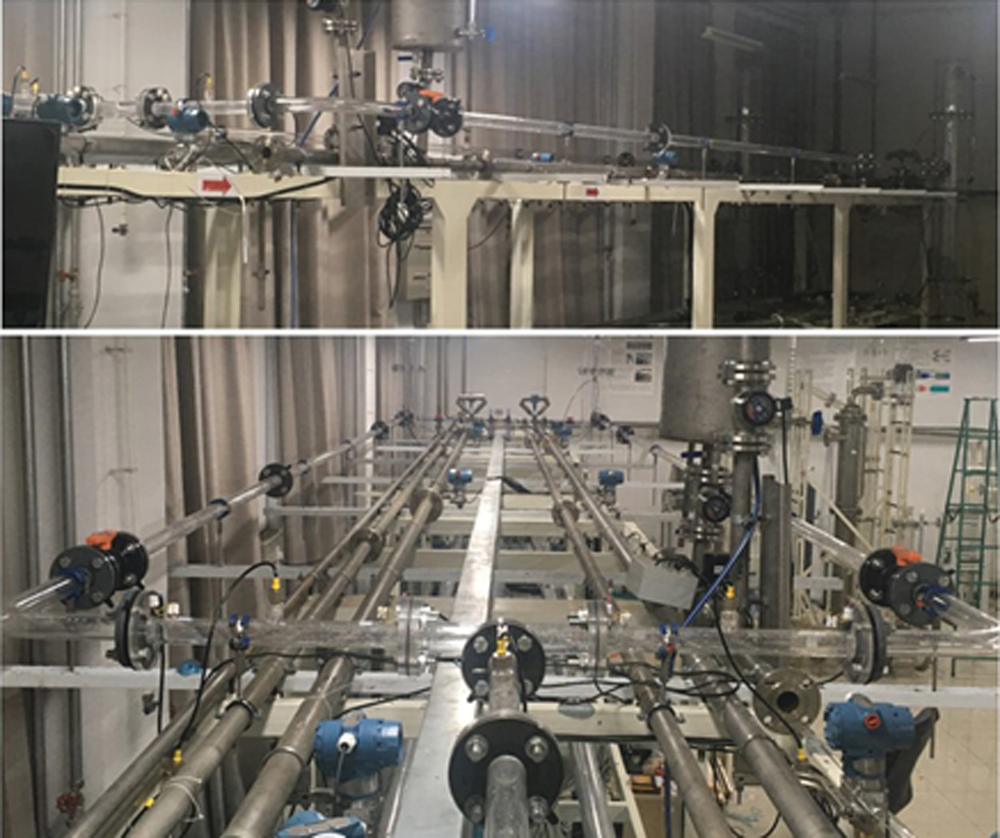
Figure 2: Photograph of experimental pipeline
During the experiment, superficial liquid velocity was 0.1 to 0.5 m/s, and the air was 0.1 to 5 m/s. For gas-liquid flow splitting at the test loop, ML0 is the liquid total mass flow rates, MG0 is gas total mass flow rates. The flow rates in two branch pipelines (ML1, MG1, ML2, MG2) are measured respectively. The mass flow relationship is as follows:
Two parameters, FG1 and FL1 are defined to describe the split results. Here FG1 is the fraction of the total gas mass flow that passes through one outlet of the tee junction. Similarly, FL1 is the fraction of the total liquid mass flow that passes through one outlet of the tee junction. That is:
For an absolutely even split (symmetrical split), FG1 = FL1 = 50%. For uneven split, the flow rates in the two branch is >10% discrepancy from even splitting.
Before the experiment, we tested the symmetry of the pipeline use the single-phase. Keep all valves V6-V9 fully open during the test. The results are shown in Fig. 3. The FG1 and FG2 respectively represent the percentage of gas flow in the two branches of the total gas flow. FL1 and FL2 respectively indicate the percentage of the liquid flow in the two branches of the total liquid phase. From the test of single-phase flow, we can get that the test loop is basically symmetrical.
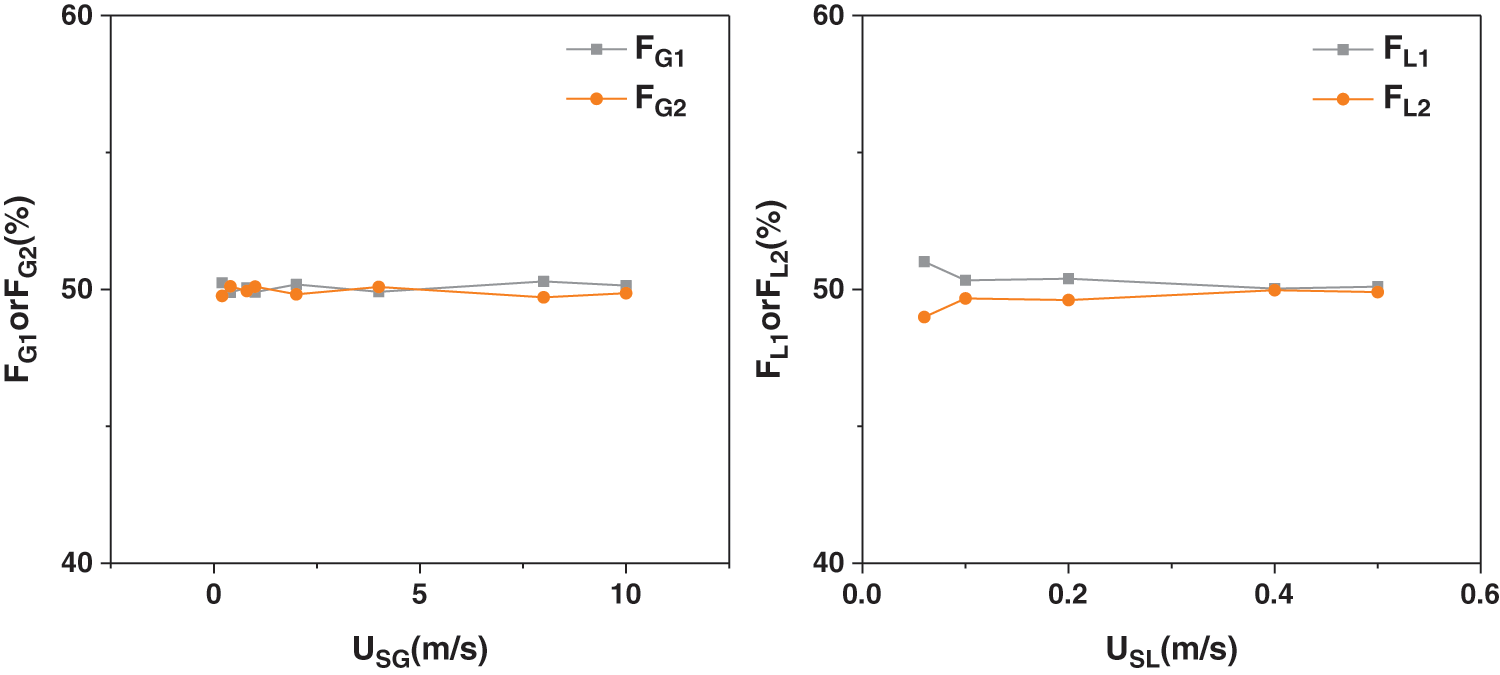
Figure 3: Symmetry test results for single phase
3.2 Two-Phase Splitting Results
During the experiment, keep the valves on the test loop completely open to make the pressure at the outlet of the two pipes remains the same, which ensure the two branch pipelines symmetrically. In the experiment, at low gas and liquid velocity, the stratified flow was observed. The splitting result is shown in Fig. 4a, and the liquid accumulated mass in the two branches is almost the same. Therefore, gas velocity and liquid velocity are low, the two-phase flow splits evenly in two pipelines.
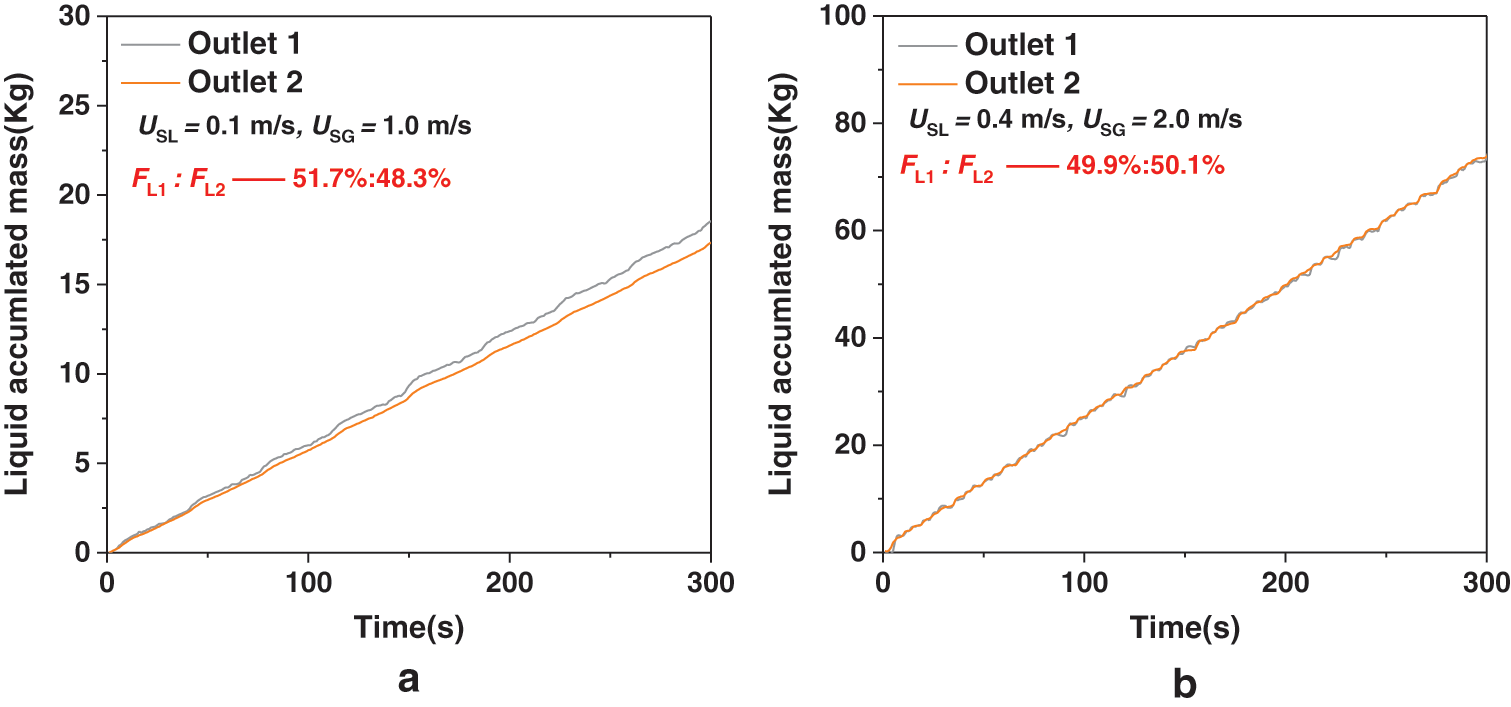
Figure 4: The splitting results of stratified and intermittent flow
As the gas and liquid velocity increases, intermittent flow was observed in the inlet pipeline. The liquid accumulated mass curve is shown in the Fig. 4b. It can be seen from the figure that the two curves basically overlap. It shows that the liquid phase has achieved even flow distribution. It can be seen from the experimental results above that as long as the pressure in the downstream pipeline kept the same, the gas-liquid two-phase flow will be always splitting evenly.
Adjust the opening degree of the separator valve V9 and V13 to make the pressure different in each separator. The splitting results of the single gas was shown in Fig. 5. The opening of valve V9 is smaller than the opening of valve V13 and the gas phase tends to flow into the side with lower pressure. The experimental results in Fig. 6 shows FL2 in the outlet which has the higher pressure. From the results we can see that when the liquid velocity is low, the gas velocity has a greater impact on the splitting results of the two-phase flow. As the gas velocity decreases, the liquid phase tends to be evenly distributed in the two pipelines. At different gas velocities, the uneven distribution of the liquid phase gradually decreases with the increase of the liquid velocity, and finally tends to be evenly distributed. From the above results, we can conclude that the gas phase plays a leading role in the split of the two-phase flow at a lower liquid velocity. Because the outlet pressures of the two branch pipes are different, the gas phase carries more liquid phase into the side with a lower pressure. As the liquid velocity increases, the momentum of the liquid phase increases, and the carrying effect of the gas phase gradually weakens. Therefore, the pressure at the outlet of the two branch pipelines has a greater impact on the split of the two-phase flow if the liquid velocity is low. As the liquid velocity increases, the outlet pressure of the branch pipeline has little effect, and the liquid flow rates tends to be evenly distributed.
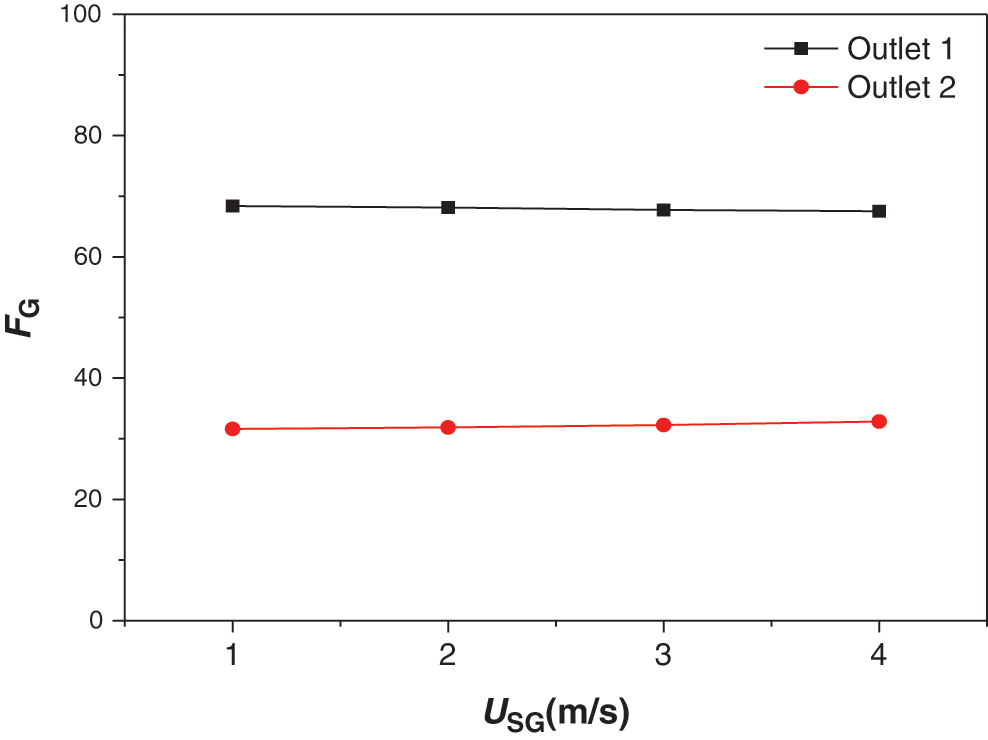
Figure 5: The gas phase split results of the two outlet
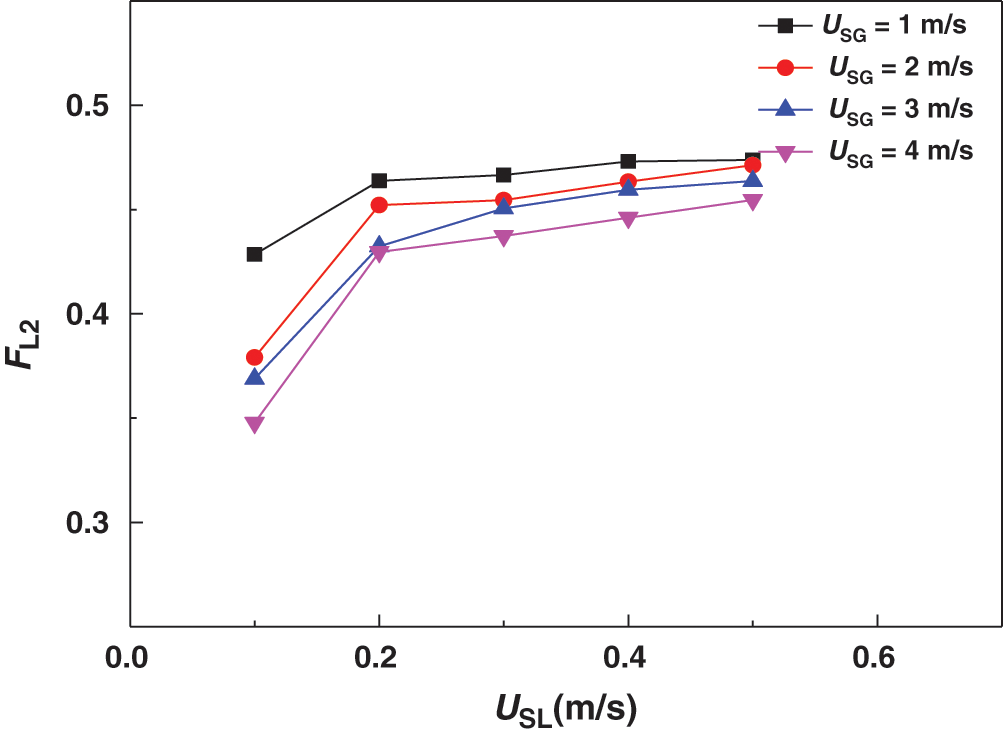
Figure 6: Effect of asymmetry of pressure on splitting of gas-liquid two phase
Due to the flow state in the horizontal pipeline is stratified flow or slug flow in the experiment, therefor the multiphase flow was modelled using the Volume of Fluid interface-tracking method. The equation solved by the VOF method is as follows:
Here
The flow of the gas in the control body is continuous and regarded as incompressible fluid. The velocity of the fluid in the control body is independent of time, and the fluid is steady flow. The convection term of the governing equation was discretized by second-order upwind scheme, and the turbulence model was treated by RNG k-ε Model [22]. The various flow quantities were solved using Fluent’s segregated solver with the SIMPLE scheme for the pressure-velocity coupling and the PRESTO! scheme for the pressure interpolation. The convergence criterion is that the residual values of each physical quantity are all less than 10−5.
The 3D model is filled with regular hexahedral meshes. Five different grid blacks were created for the model. The partial map of the grid is shown in Fig. 7. The independence of the grid is verified by five different grids. Select the pressure at the elbow as the characteristic parameter for grid independence verification. The results was shown in the Fig. 8. From the figure, we can see that the last two grid calculation results are relatively similar, taking into account the accuracy requirements and computational efficiency of numerical calculations, we chose the fourth type of grid (which have 81200 grids) for numerical simulation for the two-phase flow splitting at the T-junction.
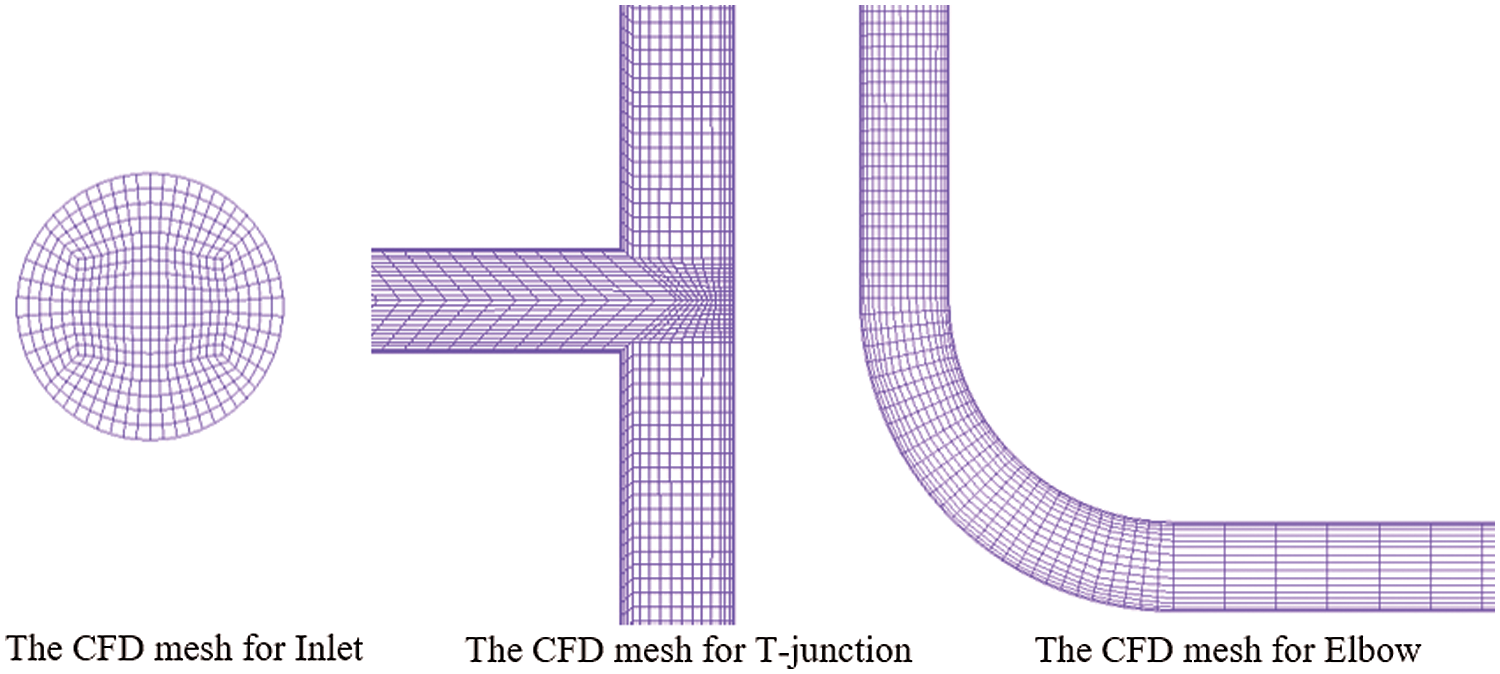
Figure 7: Local mesh on the pipeline with the total number of grid of 81200
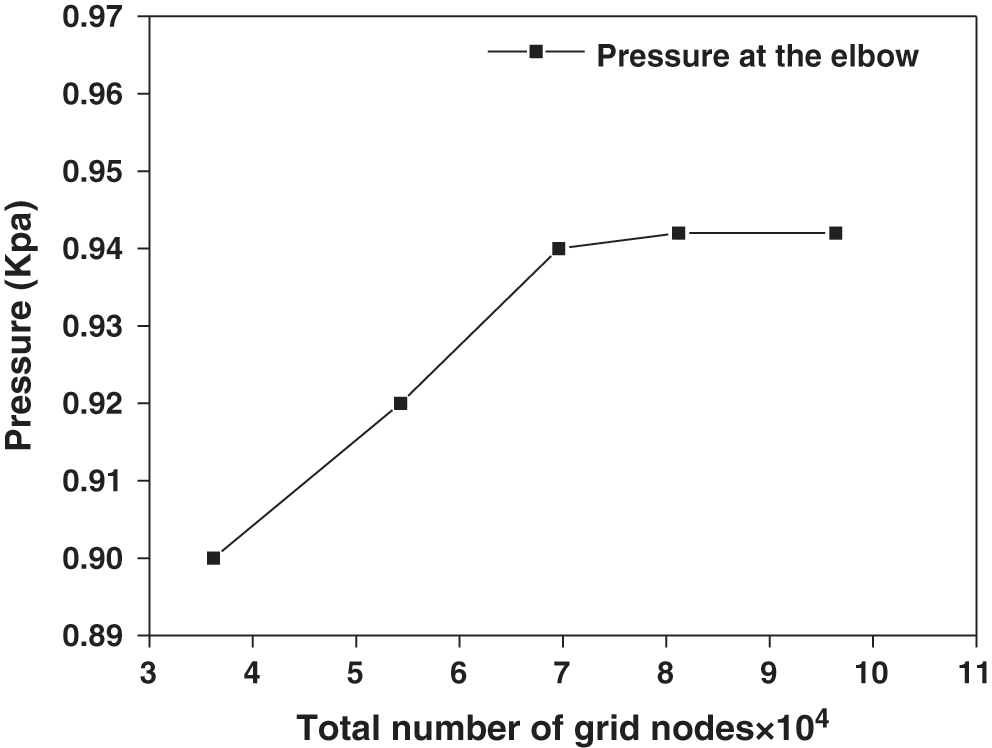
Figure 8: Effect of the grid refinement on the pressure at the elbow
In order to verify the accuracy of the numerical calculation method, it was compared with the gas-liquid two-phase flow splitting experiment carried out above. The experimental conditions: the range of the superficial liquid velocity was 0.1 to 0.5 m/s, and the air was 0.1 to 5 m/s, the pressures of the two outlet are the same. The experimentally measured fraction of liquid phase from outlet 1 was shown in the Fig. 9. It can be seen from the figure, the experimental results are in good agreement with the numerical calculation results, it shows that the numerical calculation method of gas-liquid two-phase flow split established in this research has certain accuracy and reliability.
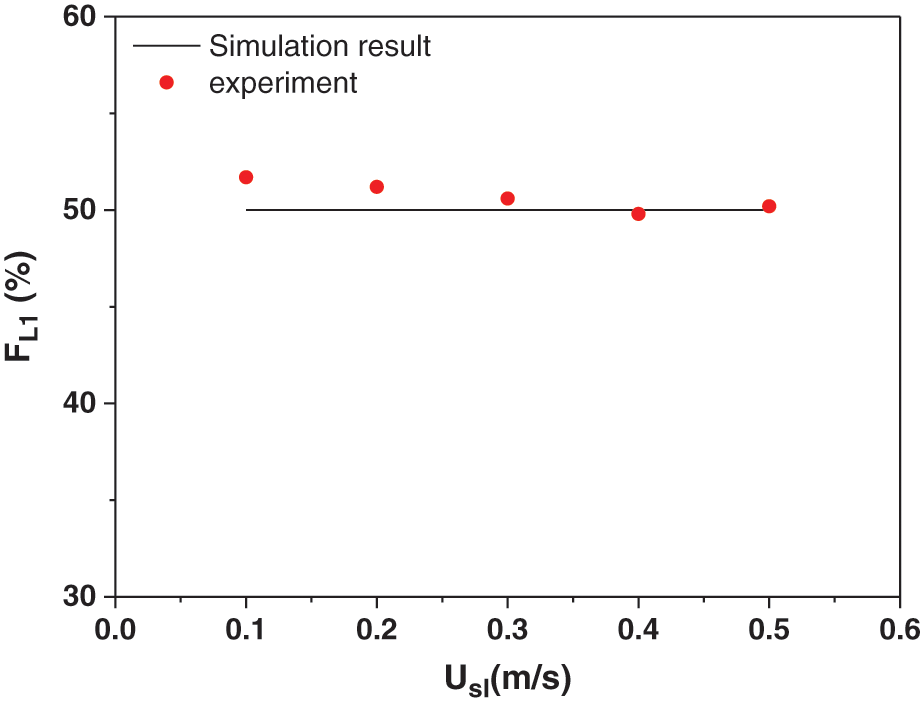
Figure 9: Comparison of the fraction of liquid phase from outlet 1
In the initial state, the gas volume in the pipeline is set to 0, that is, the pipeline is filled with liquid at the initial time. The inlet condition of the model is velocity inlet, gas velocity is 1 m/s, liquid velocity is 0.1 m/s. The outlets of the two pipelines are set as pressure outlets and the pressure at the outlets of the two pipelines is kept the same. The pressure of the two outlets is maintained at 1 Kpa. As shown in the Fig. 10, the gas-liquid two-phase flows to the T-junction in a stratified flow state, and is evenly distributed at the T-junction. Fig. 11 shows the cumulative mass flow of the liquid phase in the two branch pipelines, as can be seen in the figure, the two curves completely overlap. From the above numerical simulation process, it can be seen that when the outlet pressure of the two pipelines remains the same, the two-phase flow is always evenly distributed when flowing through the T-junction.
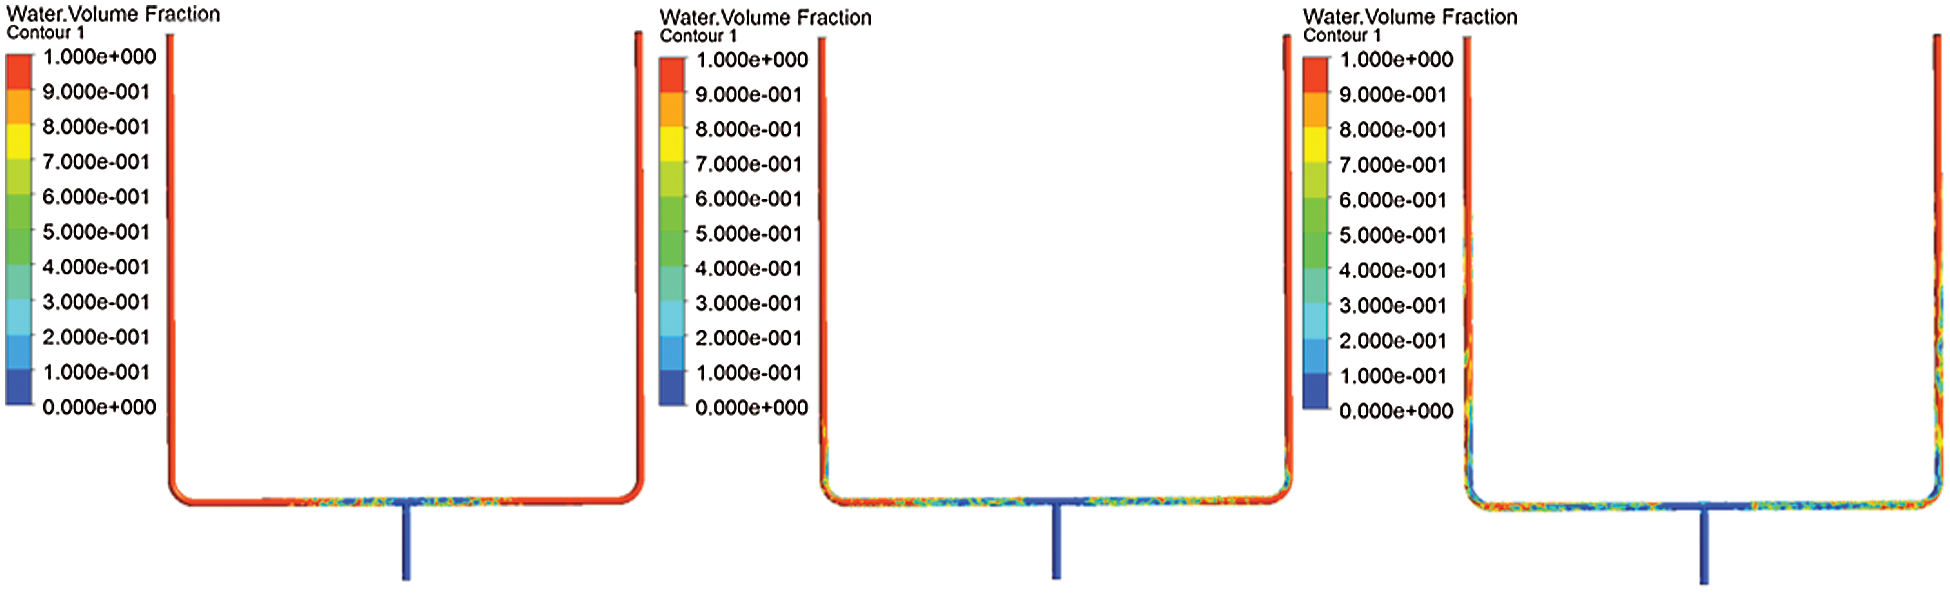
Figure 10: Two-phase distribution cloud diagram
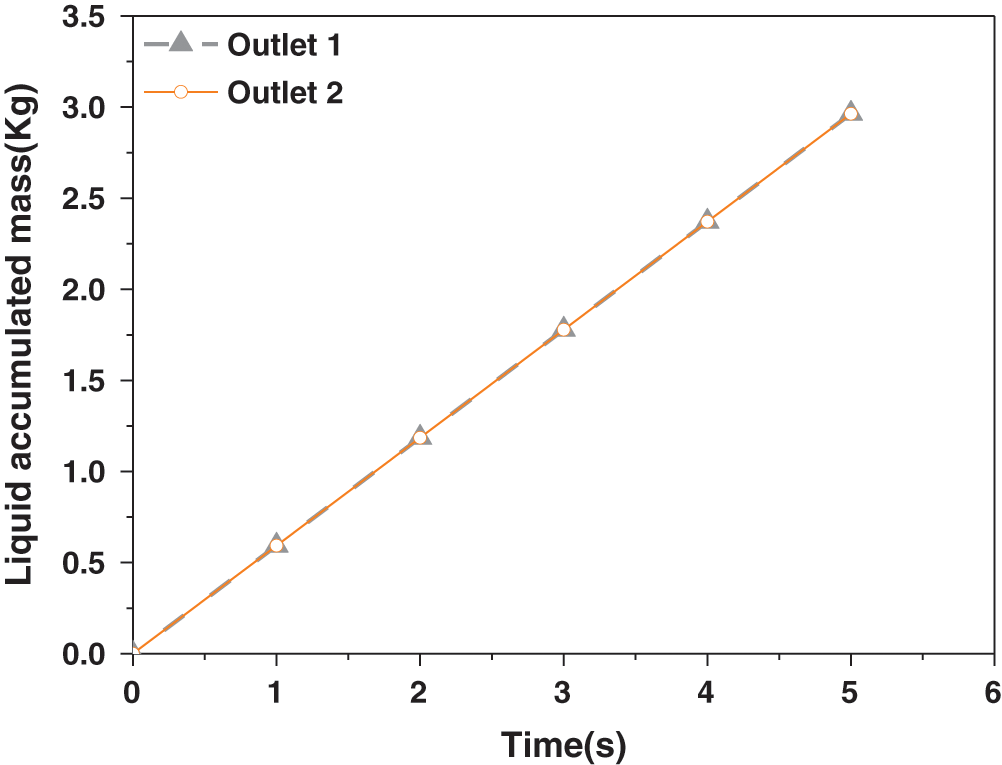
Figure 11: The splitting results for two outlets
Keep the inlet conditions unchanged and change the outlet pressure of the two pipes. Make the pressure of outlet 2 (the right is pipeline 2) greater than the pressure of outlet 1. The pressure of the outlet 1 is maintained at 1 Kpa and the pressure of outlet 2 is maintained at 2 Kpa. During the beginning of the simulation, the two-phase flow did not produce obvious uneven distribution at the T-junction. But as time progresses, the gas-liquid two phases tend to flow into the side with lower pressure. Two-phase distribution cloud diagram was shown in Fig. 12. It can be seen from Fig. 13 that the slopes of the two curves are quite different, and almost all of the liquid phase flows into outlet 1. When the outlet pressure of the two pipelines is changed, it will have a greater impact on the split of the two-phase flow. The diversion trend of the two-phase flow is the same as the experimental phenomenon, but the uneven distribution range is greater than the experimental phenomenon. The reason for this phenomenon may be that the outlet pressure difference of the two pipes during the experiment is smaller than the pressure difference during the numerical simulation.
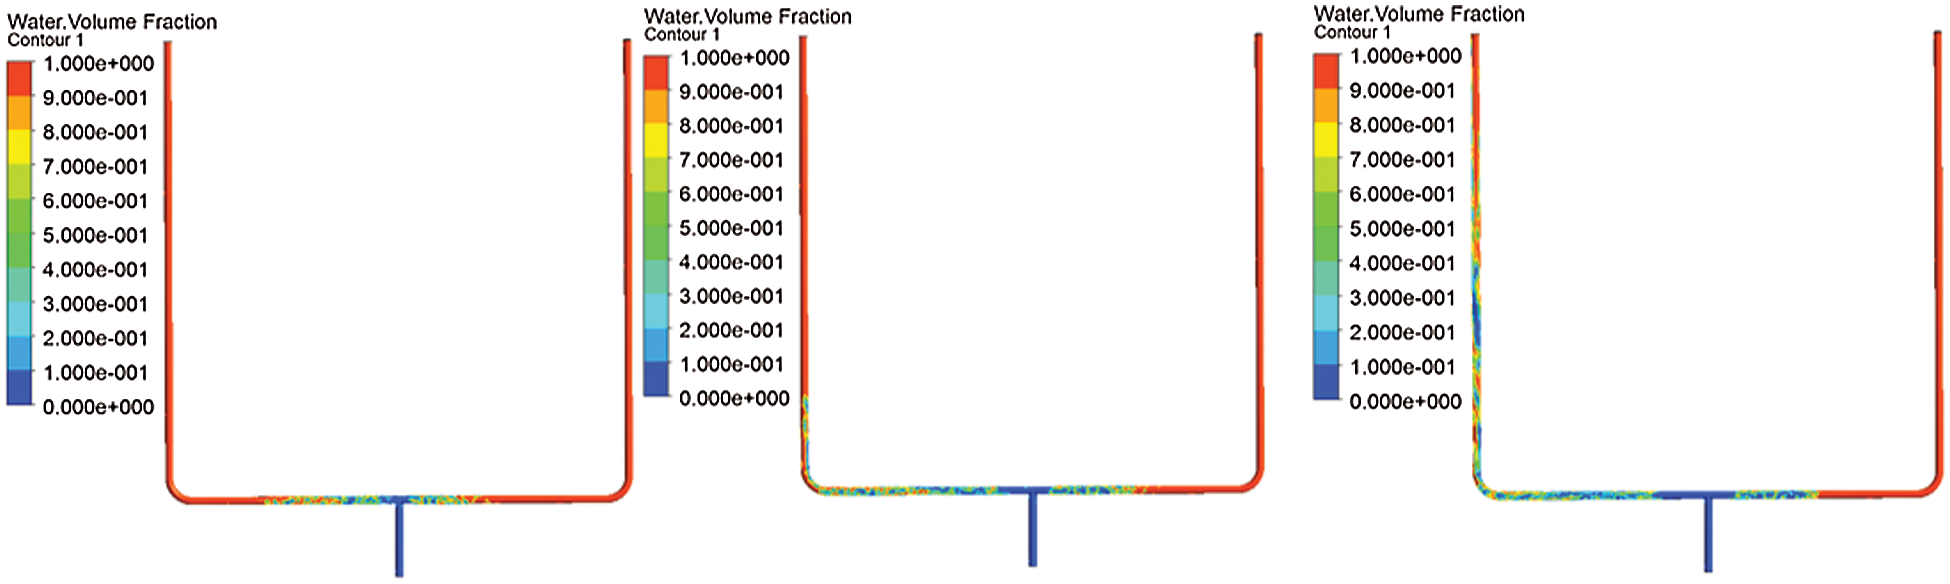
Figure 12: Two-phase distribution cloud diagram
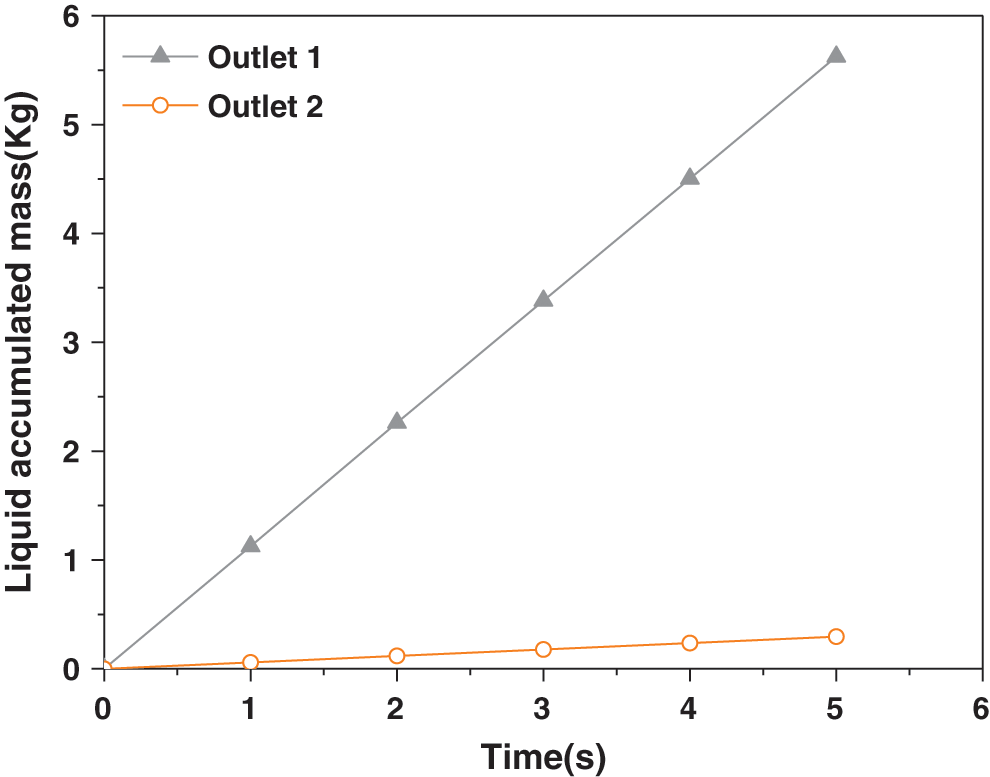
Figure 13: The splitting results for two outlets
The outlet conditions of the two pipelines remain unchanged, the original pressure difference is maintained, and the inlet liquid velocity is changed to change from 0.1 m/s to 0.5 m/s. As shown in the Fig. 14, the uneven distribution of gas and liquid phases gradually decreases.
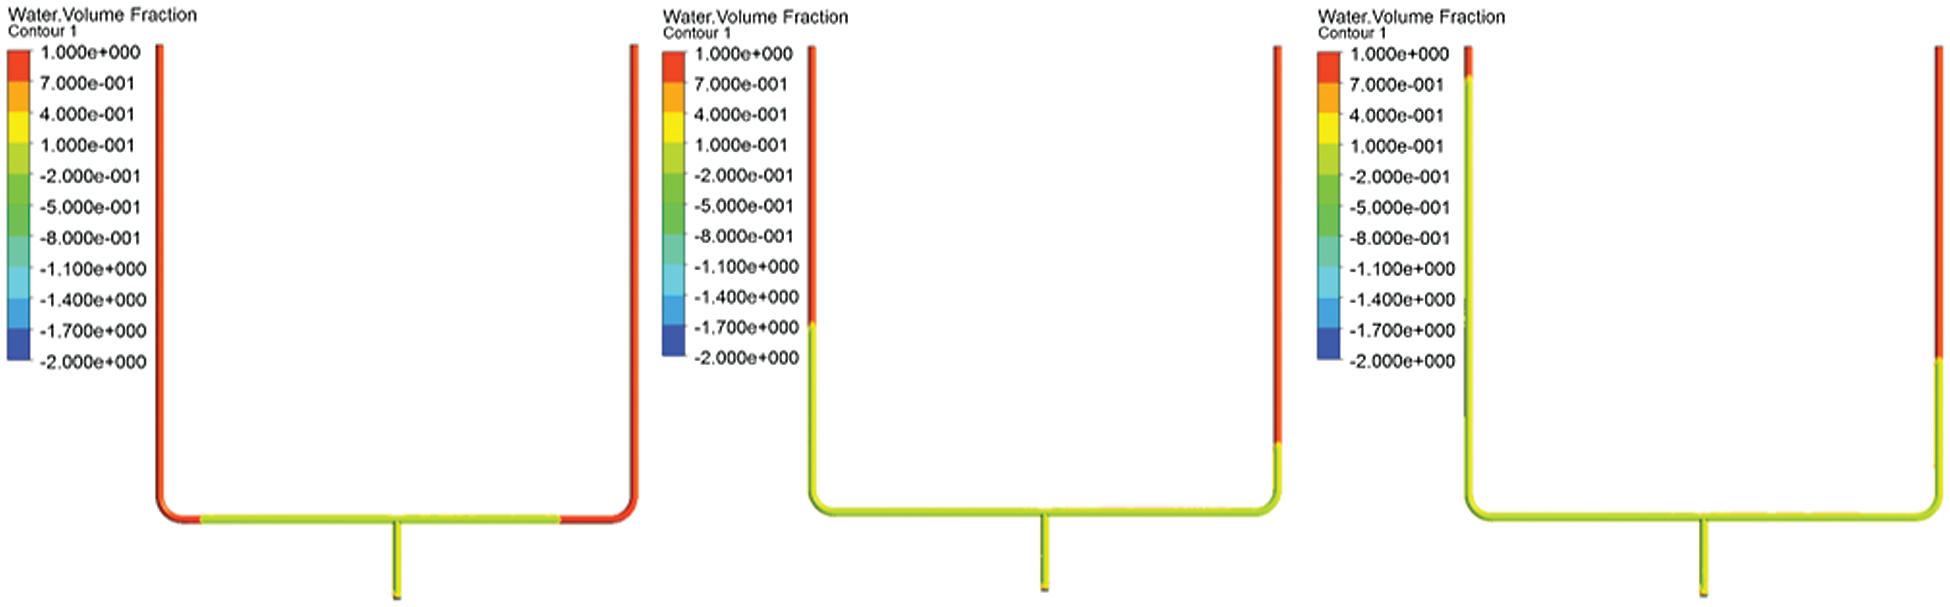
Figure 14: Two-phase distribution cloud diagram
Fig. 15 shows the results of liquid phase flow splitting at different liquid velocities. Under the same outlet pressure conditions, different liquid speeds have a greater impact on the split of the two-phase flow. It can be seen from the figure that as the liquid velocity increases, the angle of the cumulative curve of the liquid phase flow of the two branch pipelines keeps getting smaller. This shows that with the continuous increase of the inlet liquid velocity, the two-phase flow tends to be evenly distributed at the T-junction. The increase of the liquid velocity causes the gas-liquid ratio to decrease, the momentum ratio of the gas-liquid two phases is relatively reduced, and the driving effect of the gas to the liquid phase is gradually weakened. However, due to the increase of the liquid phase momentum, the gas-liquid two phases have structural symmetry. The distribution at the T-shaped tube tends to be more uniform.
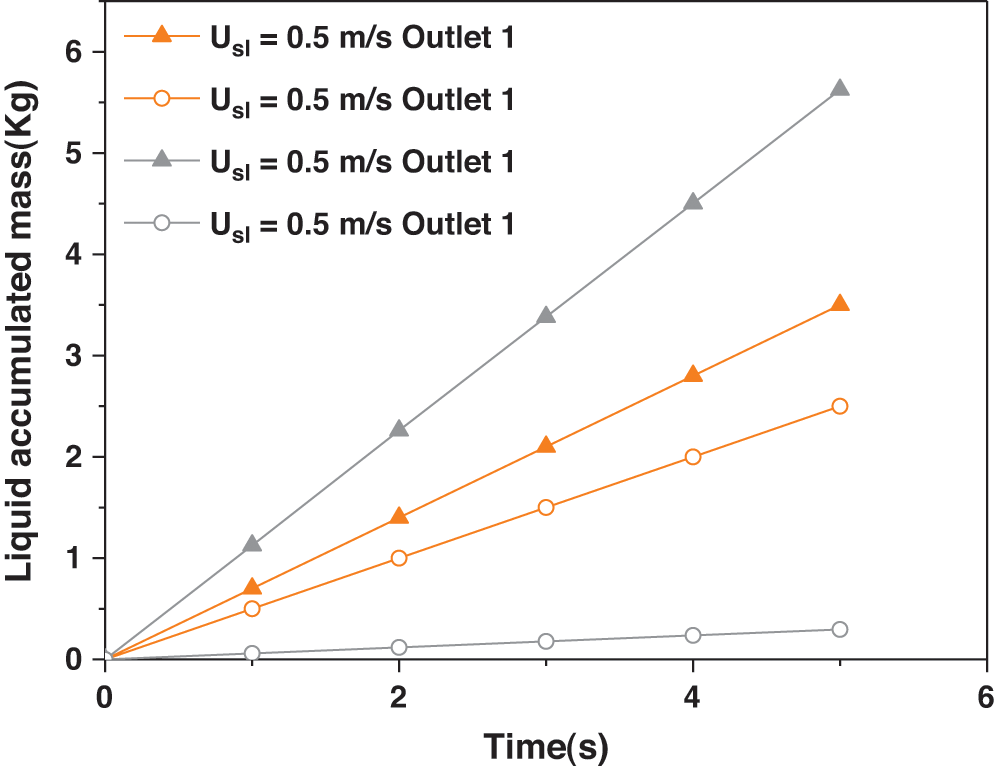
Figure 15: The splitting results for different superficial liquid velocity
The aim of this research in this paper is to analyze two-phase flow splitting at the T-junction with different pressure at the two outlets. In this paper, both experimental research and numerical simulation are conducted. The results of the two methods are basically the same. It shows that the established numerical calculation method has high accuracy, and compared with the experiments, the simulation can more accurately control the pressure difference between the two outlets. When the pressure of the two outlets are same, regardless of the gas and liquid velocity, the two-phase flow splitting at the T-junction is always evenly. When the outlet pressure of the two outlets is different, the two-phase flow through the T-junction usually split unevenly, and the liquid phase tends to the branch with lower pressure, but with the increase of liquid velocity, this trend gradually decreases. Due to the increase of the momentum of the liquid phase, it occupies a dominant position in the splitting of the gas-liquid two-phase flow, and finally the two-phase flow is uniformly distributed at the T-junction.
In summary, if the pressure at the two outlets is symmetrical, the two-phase flow will be always splitting evenly at the T-junction. When the outlet pressure of the pipeline is asymmetrical, the increase of the inlet liquid velocity makes the two-phase flow tends to be evenly distributed.
Acknowledgement: The authors gratefully expressed their thanks for the financial support for these researches from the National Science and Technology Major Project of China (No. 2016ZX05028-004-003).
Funding Statement: This work was supported by the National Science and Technology Major Project of China (No. 2016ZX05028-004-003).
Conflicts of Interest: The authors declare that they have no conflicts of interest to report regarding the present study.
1. Shen, D., Gui, C., Xia, J., Xue, S. (2020). Experimental analysis of the performances of unit refrigeration systems based on parallel compressors with consideration of the volumetric and isentropic efficiency. Fluid Dynamics and Materials Processing, 16(3), 489–500. [Google Scholar]
2. Tshuva, M., Barnea, D., Taitel, Y. (1999). Two-phase flow in inclined parallel pipes. International Journal of Multiphase Flow, 25(6–7), 1491–1503. [Google Scholar]
3. Azzopardi, B. J. (1999). Phase separation at T junctions. Multiphase Ence & Technology, 11(4), 223–329. [Google Scholar]
4. Azzopardi, B. J., Colman, D. A., Nicholson, D. (2002). Plant application of a T-Junction as a partial phase separator. Chemical Engineering Research and Design, 80(1), 87–96. [Google Scholar]
5. El-Shaboury, A. M. F., Soliman, H. M., Sims, G. E. (2007). Two-phase flow in a horizontal equal-sided impacting tee junction. International Journal of Multiphase Flow, 33(4), 411–431. [Google Scholar]
6. Alvarez, L. P., Mohan, R. S., Shoham, O., Avila, C. (2010). Multiphase flow splitting in parallel/looped pipelines. SPE Annual Technical Conference and Exhibition, pp. 1–10. Florence, Italy. [Google Scholar]
7. Mi, X. R., He, L. M., Luo, X. M., Ma, L. H., Xu, Y. Q. et al. (2020). Experimental investigation on gas-liquid slug flow from single pipeline to parallel separators. Journal of Petrochemical Universities, 33(5), 59–66. [Google Scholar]
8. Mohamed, M. A., Soliman, H. M., Sims, G. E. (2014). Effects of pipe size and system pressure on the phase redistribution in horizontal impacting tee junctions. Experimental Thermal and Fluid Science, 54, 219–224. [Google Scholar]
9. Liu, M., Zhang, X., Wang, D. (2021). Experimental study on the flow characteristics of a plate with a mechanically choked orifice. Fluid Dynamics and Materials Processing, 17(1), 97–107. [Google Scholar]
10. Hong, K. C., Griston, S. (1995). Two-phase flow splitting at an impacting tee. SPE Production & Facilities, 10(3), 184–190. [Google Scholar]
11. El-Shaboury, A. M. F. (2005). Phase distribution and pressure drop of two-phase flows in a horizontal impacting tee Junction (Ph.D. Thesis). University of Manitoba, Canada. [Google Scholar]
12. El-Shaboury, A. M. F., Soliman, H. M., Sims, G. E. (2001). Current state of knowledge on two-phase flow in horizontal impacting TEE junctions. Multiphase Science and Technology, 13(1&2), 40. [Google Scholar]
13. Chien, S. F., Rubel, M. T. (1992). Phase splitting of wet steam in annular flow through a horizontal impacting tee junction. SPE Production Engineering, 7(4), 368–374. [Google Scholar]
14. Hwang, S. T. (1986). A study on phase separation phenomenon in branching conduits (Ph.D. Thesis). Rensselaer Polytechnic Institute, NY, USA. [Google Scholar]
15. Issa, R. I., Oliveira, P. J. (1994). Numerical prediction of phase separation in two-phase flow through T-junctions. Computers & Fluids, 23(2), 347–372. [Google Scholar]
16. Ellison, T. K., Hatziavramidis, D. T., Sun, B., Gidaspow, D. (1997). Computational fluid dynamics (CFD) model for phase separation at branching tee junctions. SPE Western Regional Meeting, pp. 211–225. California, USA. [Google Scholar]
17. Hatziavramidis, D., Sun, B., Gidaspow, D. (1997). Gas-liquid flow through horizontal tees of branching and impacting type. Aiche Journal, 43, 1675–1683. [Google Scholar]
18. Lahey, R. T. (1990). The analysis of phase separation and phase distribution phenomena using two-fluid models. Nuclear Engineering and Design, 122(1), 17–40. [Google Scholar]
19. Adechy, D., Issa, R. I. (2004). Modelling of annular flow through pipes and T-junctions. Computers & Fluids, 33(2), 289–313. [Google Scholar]
20. Henkes, R. A. W. M., Worthen, R. A., Ellepola, J. H. (2015). Lab experiments and simulations for multiphase flow splitting from a single flowline into a dual riser. Abu Dhabi International Petroleum Exhibition and Conference, pp. 1–10. Abu Dhabi, UAE. [Google Scholar]
21. Peeters, P. T. (2016). CFD of multiphase pipe flow: a comparison of solvers (Ph.D. Thesis). Delft University of Technology, Netherlands. [Google Scholar]
22. Wang, Z., Luo, W., Liao, R., Wang, H. (2019). Slug flow characteristics in inclined and vertical channels. Fluid Dynamics and Materials Processing, 15(4), 583–595. [Google Scholar]
 | This work is licensed under a Creative Commons Attribution 4.0 International License, which permits unrestricted use, distribution, and reproduction in any medium, provided the original work is properly cited. |