| Fluid Dynamics & Materials Processing |
DOI: 10.32604/fdmp.2021.016925
ARTICLE
A Study on the Unsteady Flow Characteristics and Energy Conversion in the Volute of a Pump-as-Turbine Device
1School of Energy and Power Engineering, Lanzhou University of Technology, Lanzhou, 730050, China
2Jiangsu Shuangda Pump Valve Group Co., Ltd., Jingjiang, 214537, China
*Corresponding Author: Senchun Miao. Email: miaosc88@126.com
Received: 10 April 2021; Accepted: 11 June 2021
Abstract: To study the unsteady flow and related energy conversion process in the volute of a pump-as-turbine (PAT) device, six different working conditions have been considered. Through numerical calculation, the spatio-temporal variation of static pressure, dynamic pressure, total pressure and turbulent energy dissipation have been determined in each section of the volute. It is concluded that the reduction of the total power of two adjacent sections of the PAT volute is equal to the sum of the power lost by the fluid while moving from one section to the other and the power output from the two adjacent sections. For a fixed flow rate, the percentage of static pressure energy at the outlet of the PAT is roughly similar to that of the corresponding volute section, and both show a gradually increasing trend. The turbulent dissipation rate on each section of the PAT volute displays a similar a spatio-temporal behavior for different flow rates.
Keywords: Pump as turbine; volute; energy conversion; unsteady; numerical simulation
In recent years, as most countries, especially developing countries, have begun to face serious energy and environmental problems, attention has shifted towards clean and renewable energy [1]. As a priority recognized by countries all over the world, renewable energy technologies have been developed for the purpose of reducing greenhouse gas emissions [2]. Thus, countries around the world have been exploring clean energy devices, such as wind turbines [3–5], hydraulic turbines, PAT and others. The PAT is an energy recovery device that can convert the energy of high-pressure liquid into the rotating mechanical energy of the turbine impeller and other forms of energy, so as to achieve the purpose of energy recovery and reuse [6]. Meanwhile, the centrifugal PAT accommodates the significant advantages of simple structure, convenient maintenance, and low-cost performance [7–9], being extensively adopted in irrigation systems [10,11], urban water supply and drainage systems [12,13], and numerous other areas.
Based on the advantages and wide application of PAT, many scholars have also conducted research on various aspects of PAT. By illustration, there have been investigations into the PAT internal flow field [14,15], force characteristics [16,17], noise [18,19], pressure pulsation [20–23], and flow component optimization [24–26]. Numerical calculation methods were used to study the axial force of PAT, with the results revealing that the axial force is composed of cover plate force, blade force, and inner surface force, and the laws of the three forces in the flow being summarized [16]. A method of active control of the counter-rotating inclined blades and tongues was proposed to reduce noise [18]. Using numerical calculation methods, a conclusion was drawn that, under the combined action of counter-rotating inclined blades and tongues, the total sound pressure level of the turbine was reduced by 4.45%–7.19%, and the total sound power level was reduced by 1.08%–12.15%. One factor that causes PAT noise is pressure pulsation, thus, studying PAT pressure pulsation is essential. For this reason, the pressure pulsation of PAT under different working conditions was explored through numerical calculation and experimental verification methods [20]. Findings were made that the instability of the internal flow field was the main factor of pressure pulsation, which led to the uneven change of pressure pulsation in time. The pressure pulsation of a double-suction centrifugal pump in PAT mode was analyzed [21]. Through the calculation of the unsteady constant value, a conclusion was drawn that the interaction between the impeller and the tongue caused the unsteady characteristics near the tongue to be obvious, and the pressure in the double-suction pump the pulsation was mainly affected by low-frequency waves. In studying the stability of PAT, attention to the improvement of PAT performance is necessary. A combination of neural networks and genetic algorithms was adopted to optimize PAT blades [25]. After optimization, the efficiency of the PAT was increased by more than 3% under three specified working conditions, revealing the effectiveness of the optimization design method. A multi-objective function was used to optimize PAT, and through numerical calculations, the model efficiency was improved by more than 10% under three different working conditions, demonstrating the feasibility of the optimization method [26]. For PAT, the fluid first passes through the volute before flowing through the impeller. Hence, research on the influence of the volute on the performance of PAT has been a particular focus of study. The influence of different inlet cross-sections on the pressure fluctuation in the PAT was investigated [27], with the numerical calculation and experimental verification of a single-stage PAT indicating that the pressure at each monitoring point increased with the increase of the inlet diameter of the volute. Meanwhile the pressure at each monitoring point decreased with the increase of the inlet diameter of the volute. In reducing the pressure pulsation amplitude of the PAT volute, the numerical calculation of a single-stage PAT revealed that the addition of guide vanes before the impeller inlet could effectively reduce the maximum pressure pulsation amplitude in the circumferential and radial directions of the volute [28]. A new PAT volute design method was proposed [29]. Through numerical calculation, a conclusion was drawn that the design method significantly improved the efficiency of PAT, and at the same time, the radial force of PAT was significantly reduced. However, there is a scarcity of reports on the unsteady research on the energy conversion characteristics of PAT volutes.
As is well known, the internal flow of hydraulic machinery is unsteady, and PATs are no exception. The present study is an in-depth study based on previous research [30]. Numerical calculation methods were used to investigate the energy conversion characteristics of a PAT under unsteady flow. The time-domain changes of static pressure power, pressure power, and total pressure power on each section of PAT volute, the proportion of static pressure energy to total pressure energy, and the time-domain variation of turbulent flow energy dissipation in different sections of PAT volute under 6 different working conditions were analyzed. The present research results could provide theoretical guidance for the subsequent optimization design of the PAT.
2 Model Description and Numerical Calculation
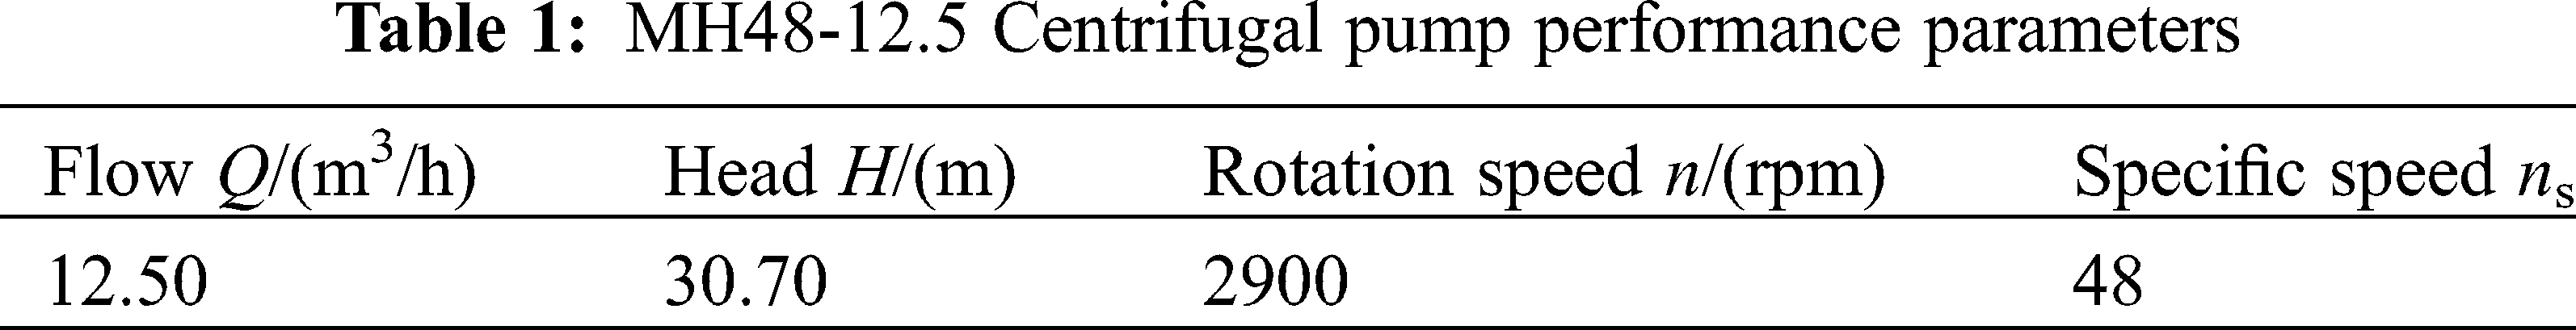
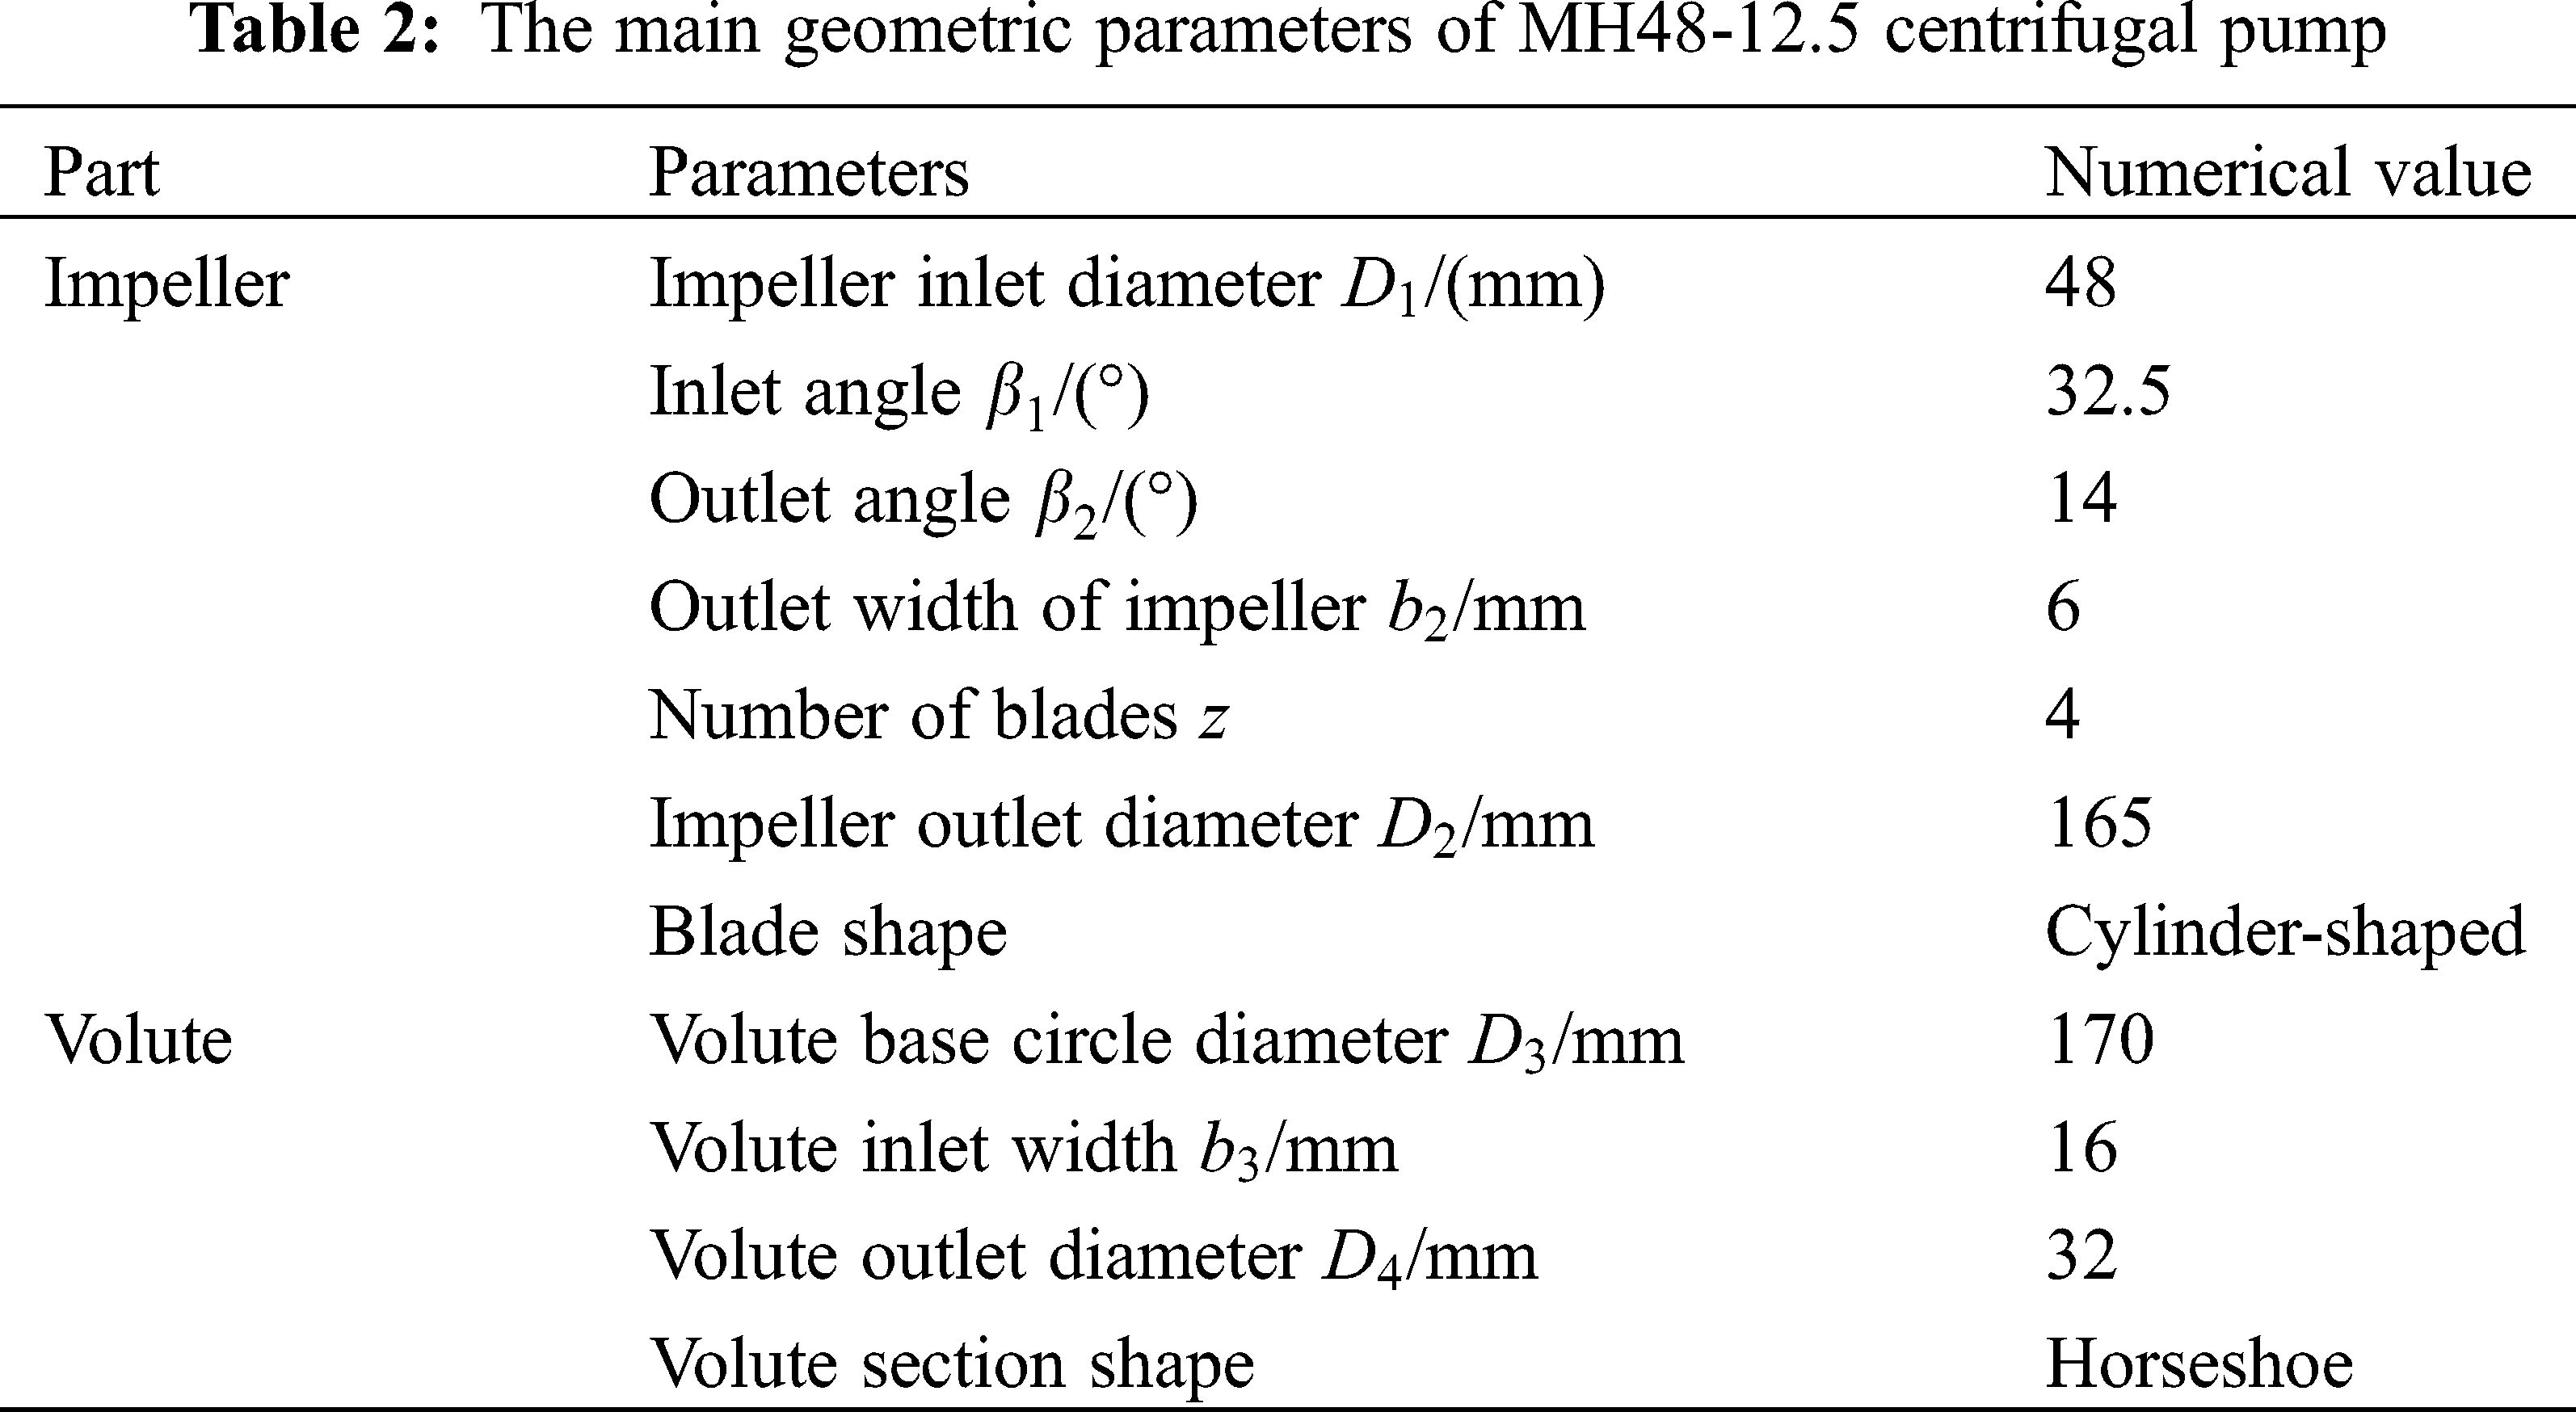
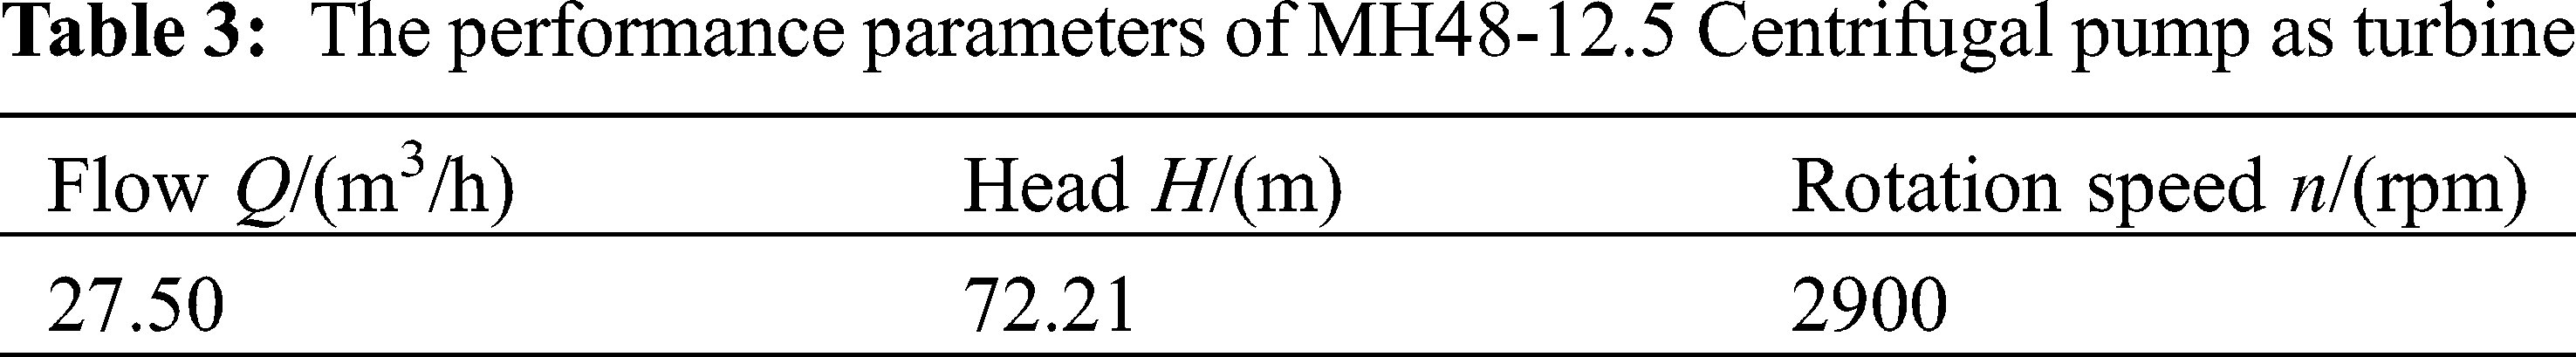
In the present study, the MH48-12.5 centrifugal pump was taken as the research object. The performance parameters of the centrifugal pump under pump conditions are shown in Tab. 1, the main geometric parameters are shown in Tab. 2, and the performance parameters of MH48-12.5 centrifugal pump as turbine are shown in Tab. 3. When the centrifugal pump is reversed as turbine, the pump inlet is referred to as the outlet of the PAT, and the pump outlet is referred to as the inlet of the PAT.
2.2 Computational Domain Selection and Meshing
Fig. 1 is a schematic diagram of a three-dimensional calculation domain model of a PAT, which specifically includes five parts: the inlet section, the volute, the impeller, the leakage channel (front and rear cavities and the gap between the mouth rings), and the draft tube. After establishing the calculation model by using Pro/Engineer, the meshing software ICEM 14.5 [31] was used to divide the mesh of the flow parts, so as to assemble the mesh of the entire calculation domain. Fig. 2 is a schematic diagram of calculation domain mesh.
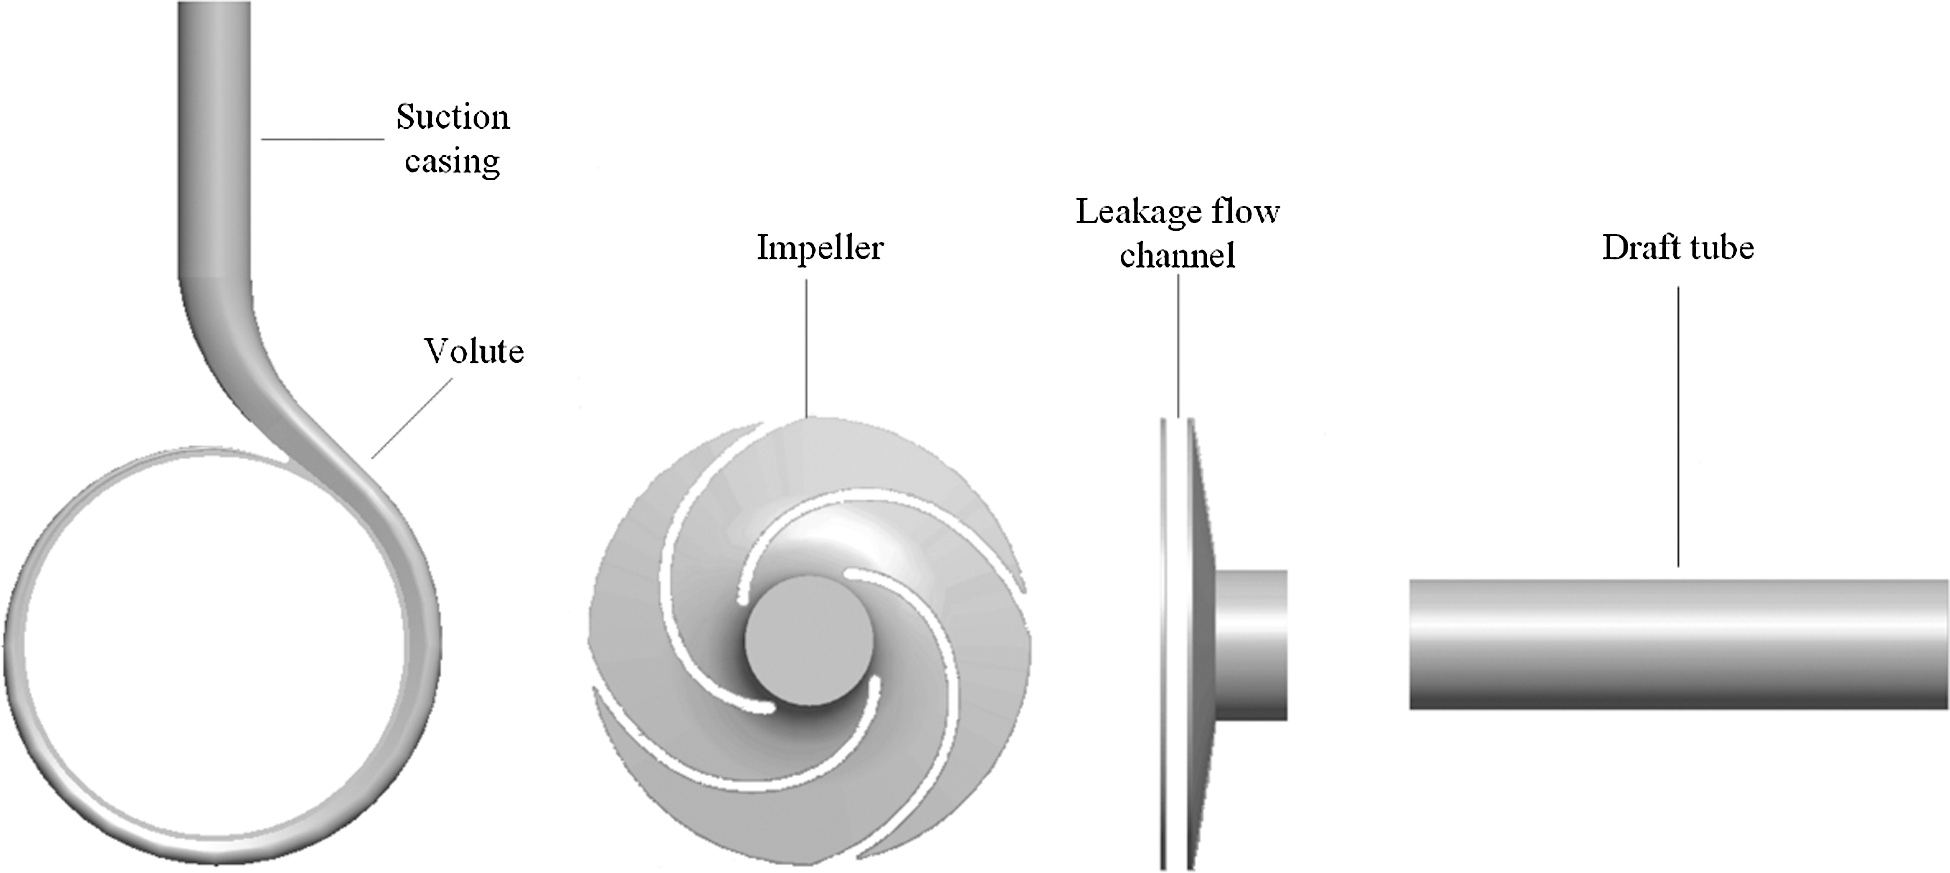
Figure 1: Three-dimensional schematic diagram of the calculation domain model of PAT
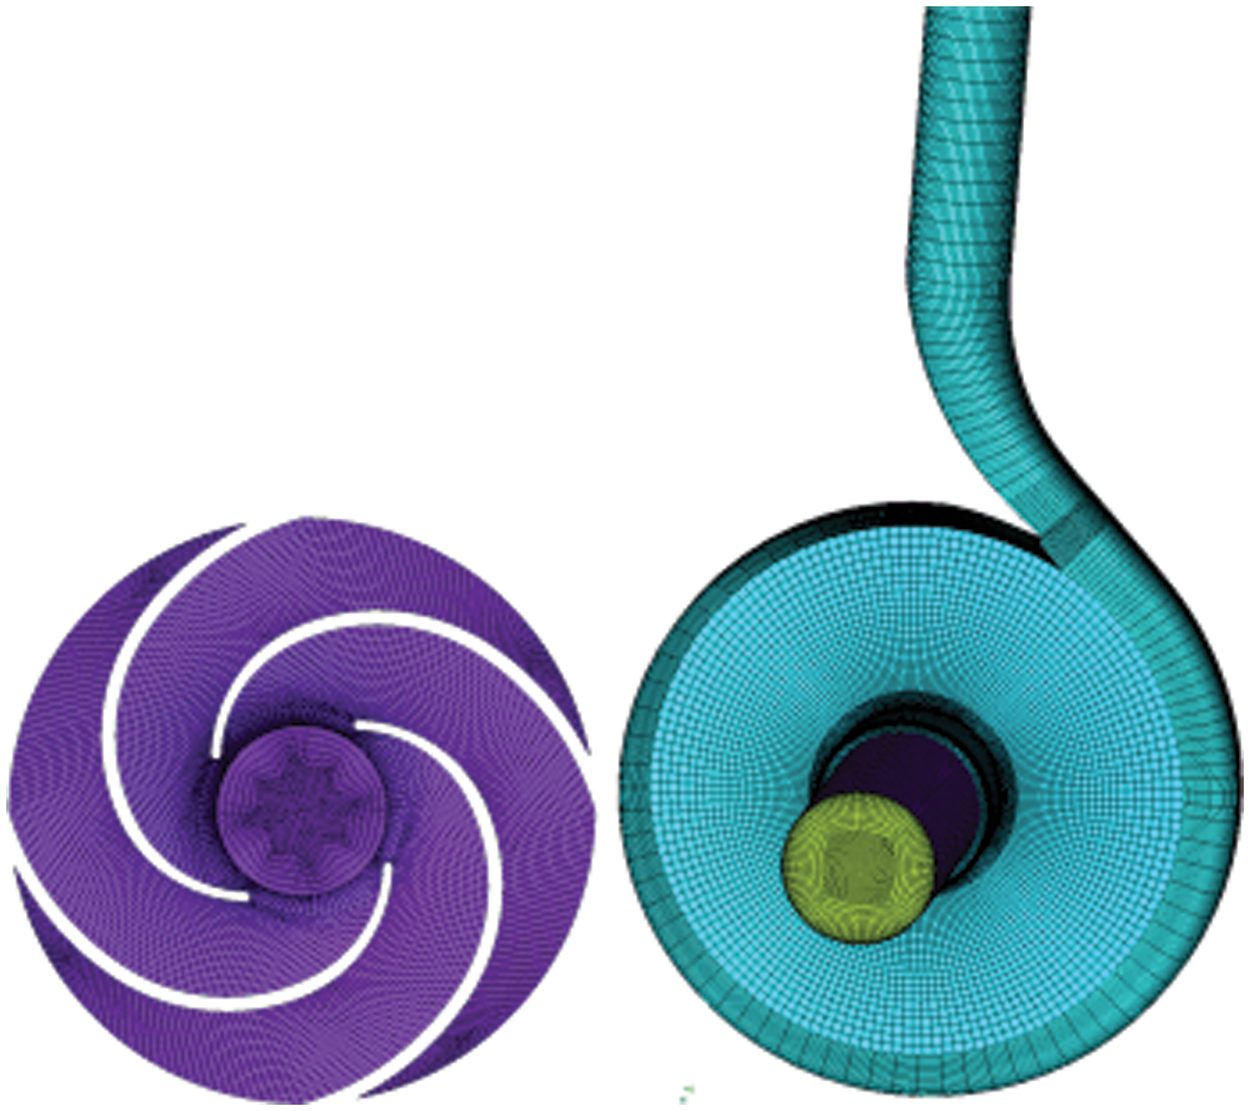
Figure 2: Impeller grid and full flow field grid assembly diagram
2.3 Mesh Independence Verification
Based on the different mesh sizes, 6 sets of mesh schemes were generated for the model, and then numerical calculations were performed, respectively. The results of the relationship between the number of meshes and the hydraulic efficiency of the PAT are presented in Fig. 3. According to the result, the fourth set mesh with a mesh number 1178560 was finally selected, as the efficiency change range was within 0.5% at that time.
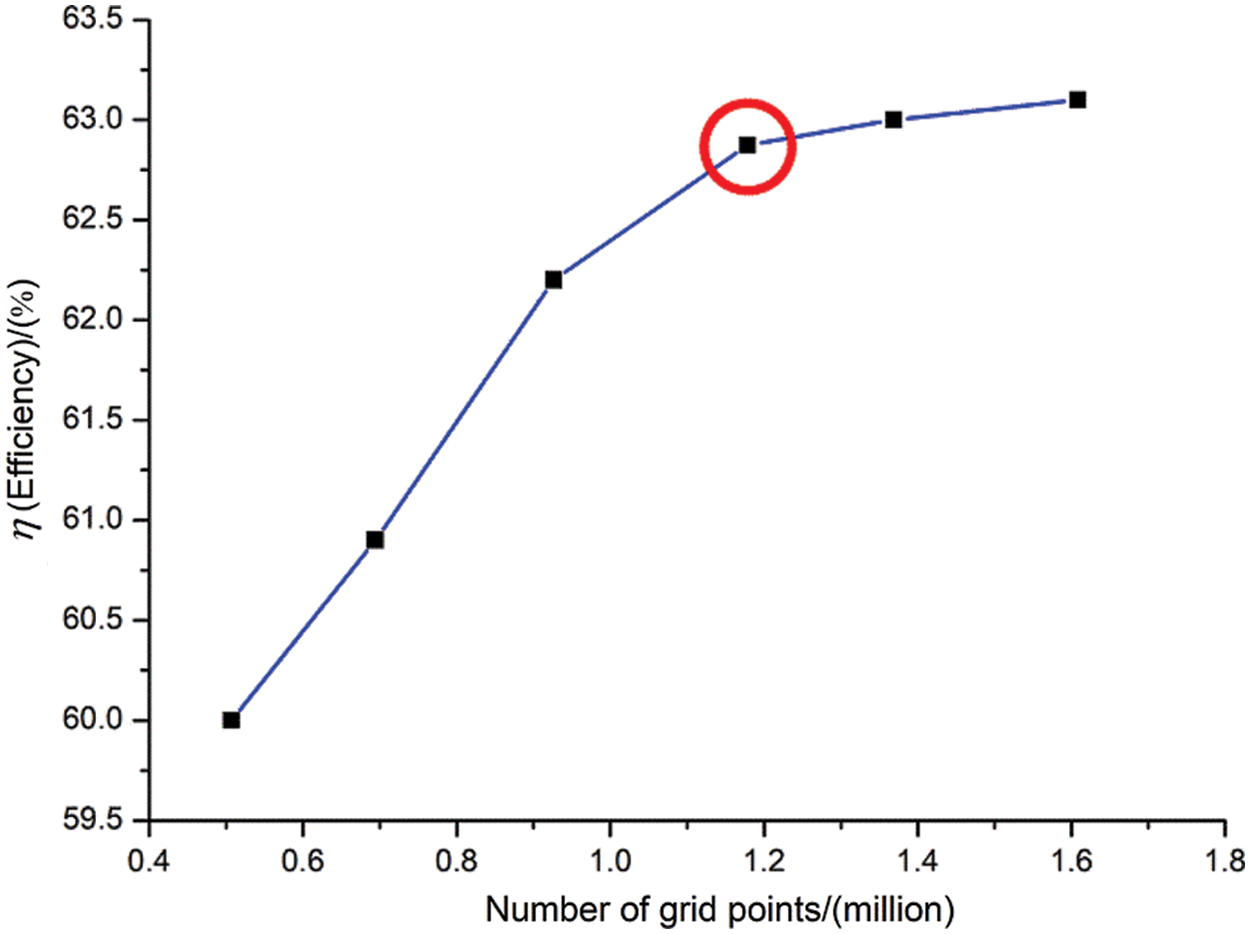
Figure 3: Relationship between PAT efficiency and mesh number
2.4 Turbulence Model and Boundary Condition Setting
Based on the applicability of the turbulence model used in the numerical calculation of PAT in the relevant literature [32–34], the turbulence model selected in this paper is the standard
where
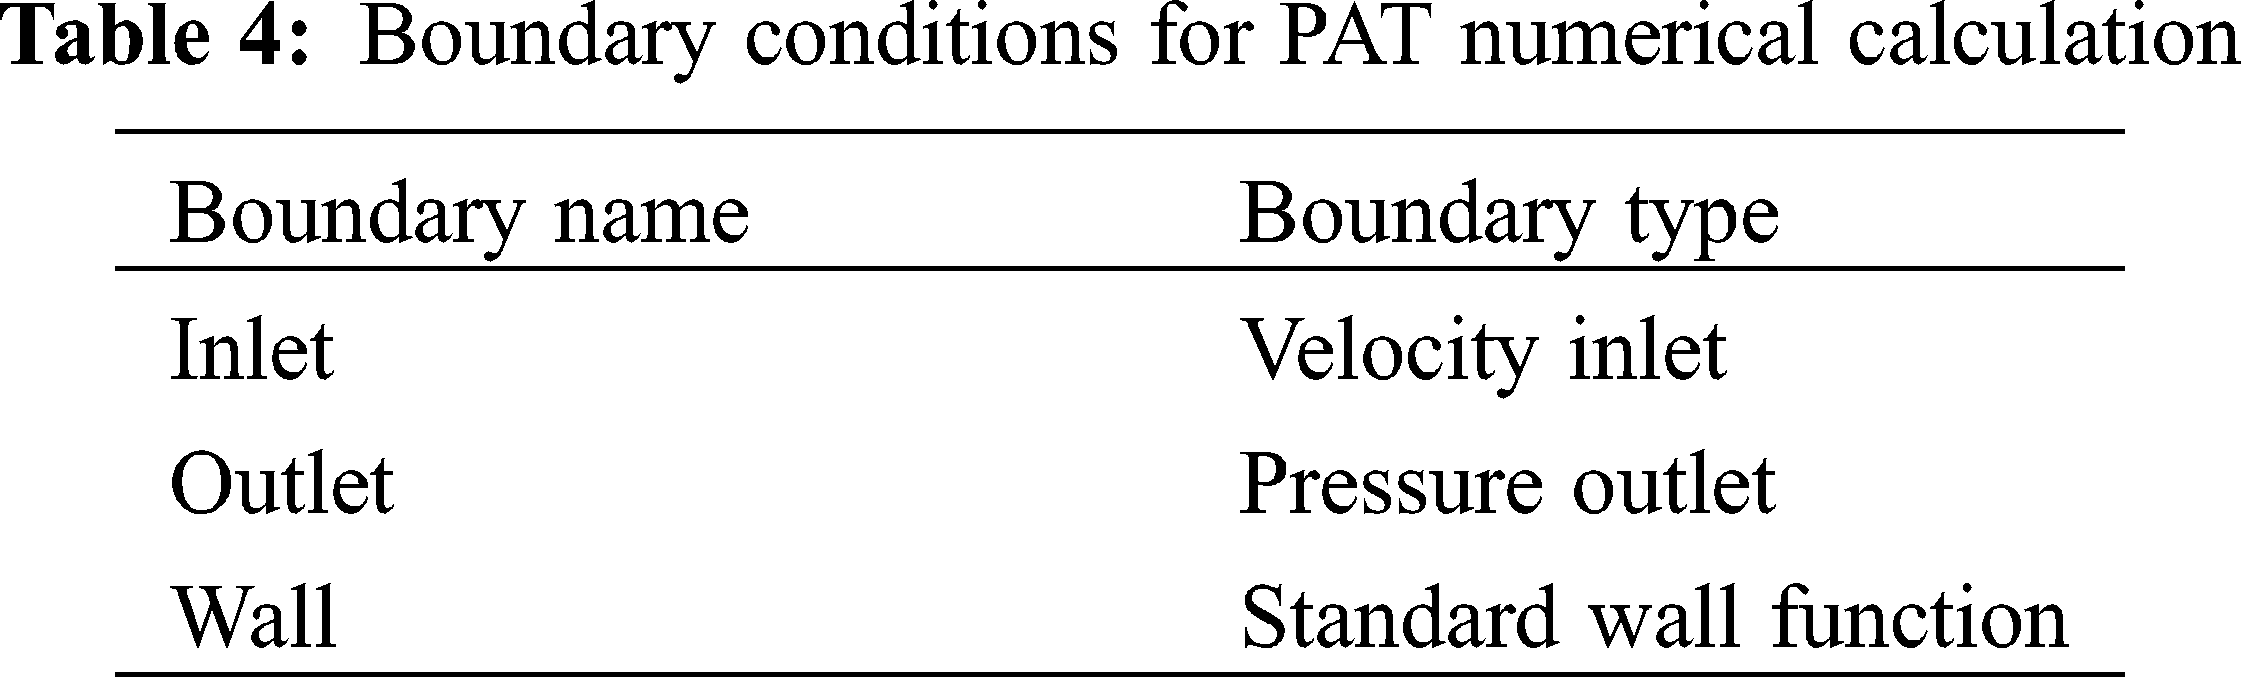
The relatively steady initial flow field is conducive to unsteady numerical calculation, so this paper uses the steady calculation result as the initial flow field for unsteady numerical calculation. The three-dimensional unsteady numerical simulation of PAT using ANSYS FLUENT 14.5 software [35]. The boundary conditions for PAT numerical calculation in Tab. 4. Pressure-based is used as the coupling scheme of pressure-velocity, and pressure-velocity coupling adopt the SIMPLE algorithm [36]. The second order upwind scheme is used for discrete calculation. Considering the numerical calculation accuracy and time cost, the calculation takes every 4° of the impeller as a time step [37], that is, one revolution of the impeller is 90 steps, the impeller rotates 6 times in total, and the total time is about 0.1241 s. The residual convergence is set to 10−5.
3 Energy Conversion Characteristics of Fluid in the Volute of PAT
For in-depth analysis of the unsteady process of energy conversion in the volute of PAT, the volute inlet extension and the volute were divided into 15 sections. The specific positions are shown in Fig. 4, and Section 1 is the inlet of the turbine. By dividing the sections in the analysis of the PAT volute, the unsteady characteristics of the energy conversion in each section of the volute could be more clearly understood, such as where the energy loss was large in the volute channel, which position was small, and the energy loss being a possible reason for the size. The conclusion can provide further reference for the optimal design of the volute.
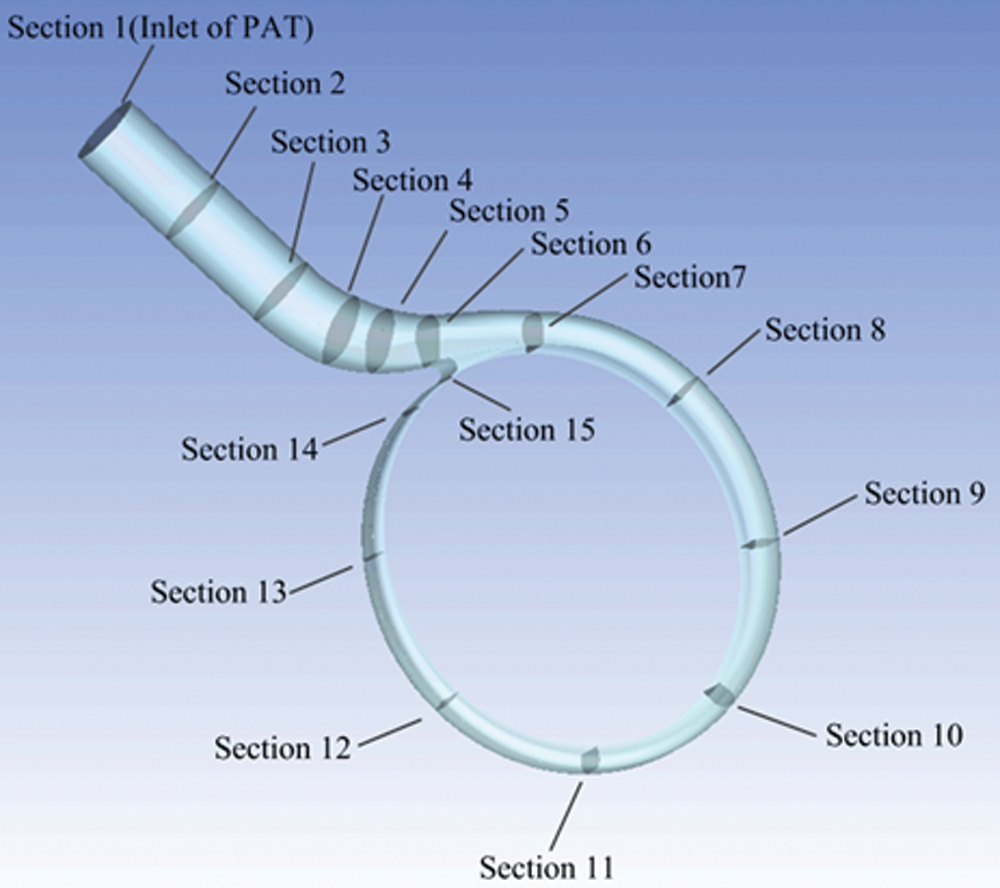
Figure 4: Schematic diagram of each section of the volute
3.1 Time Domain Characteristics of Total Pressure Power, Static Pressure Power, and Dynamic Pressure Power on Different Sections of the Volute
Figs. 5 and 6 respectively show variation rules of static pressure power, dynamic pressure power and total pressure power at each section of the volute under six working conditions (0.6Qt, 0.8Qt, 1.0Qt, 1.2Qt, 1.4Qt, 1.6Qt), within one cycle of the impeller rotation.
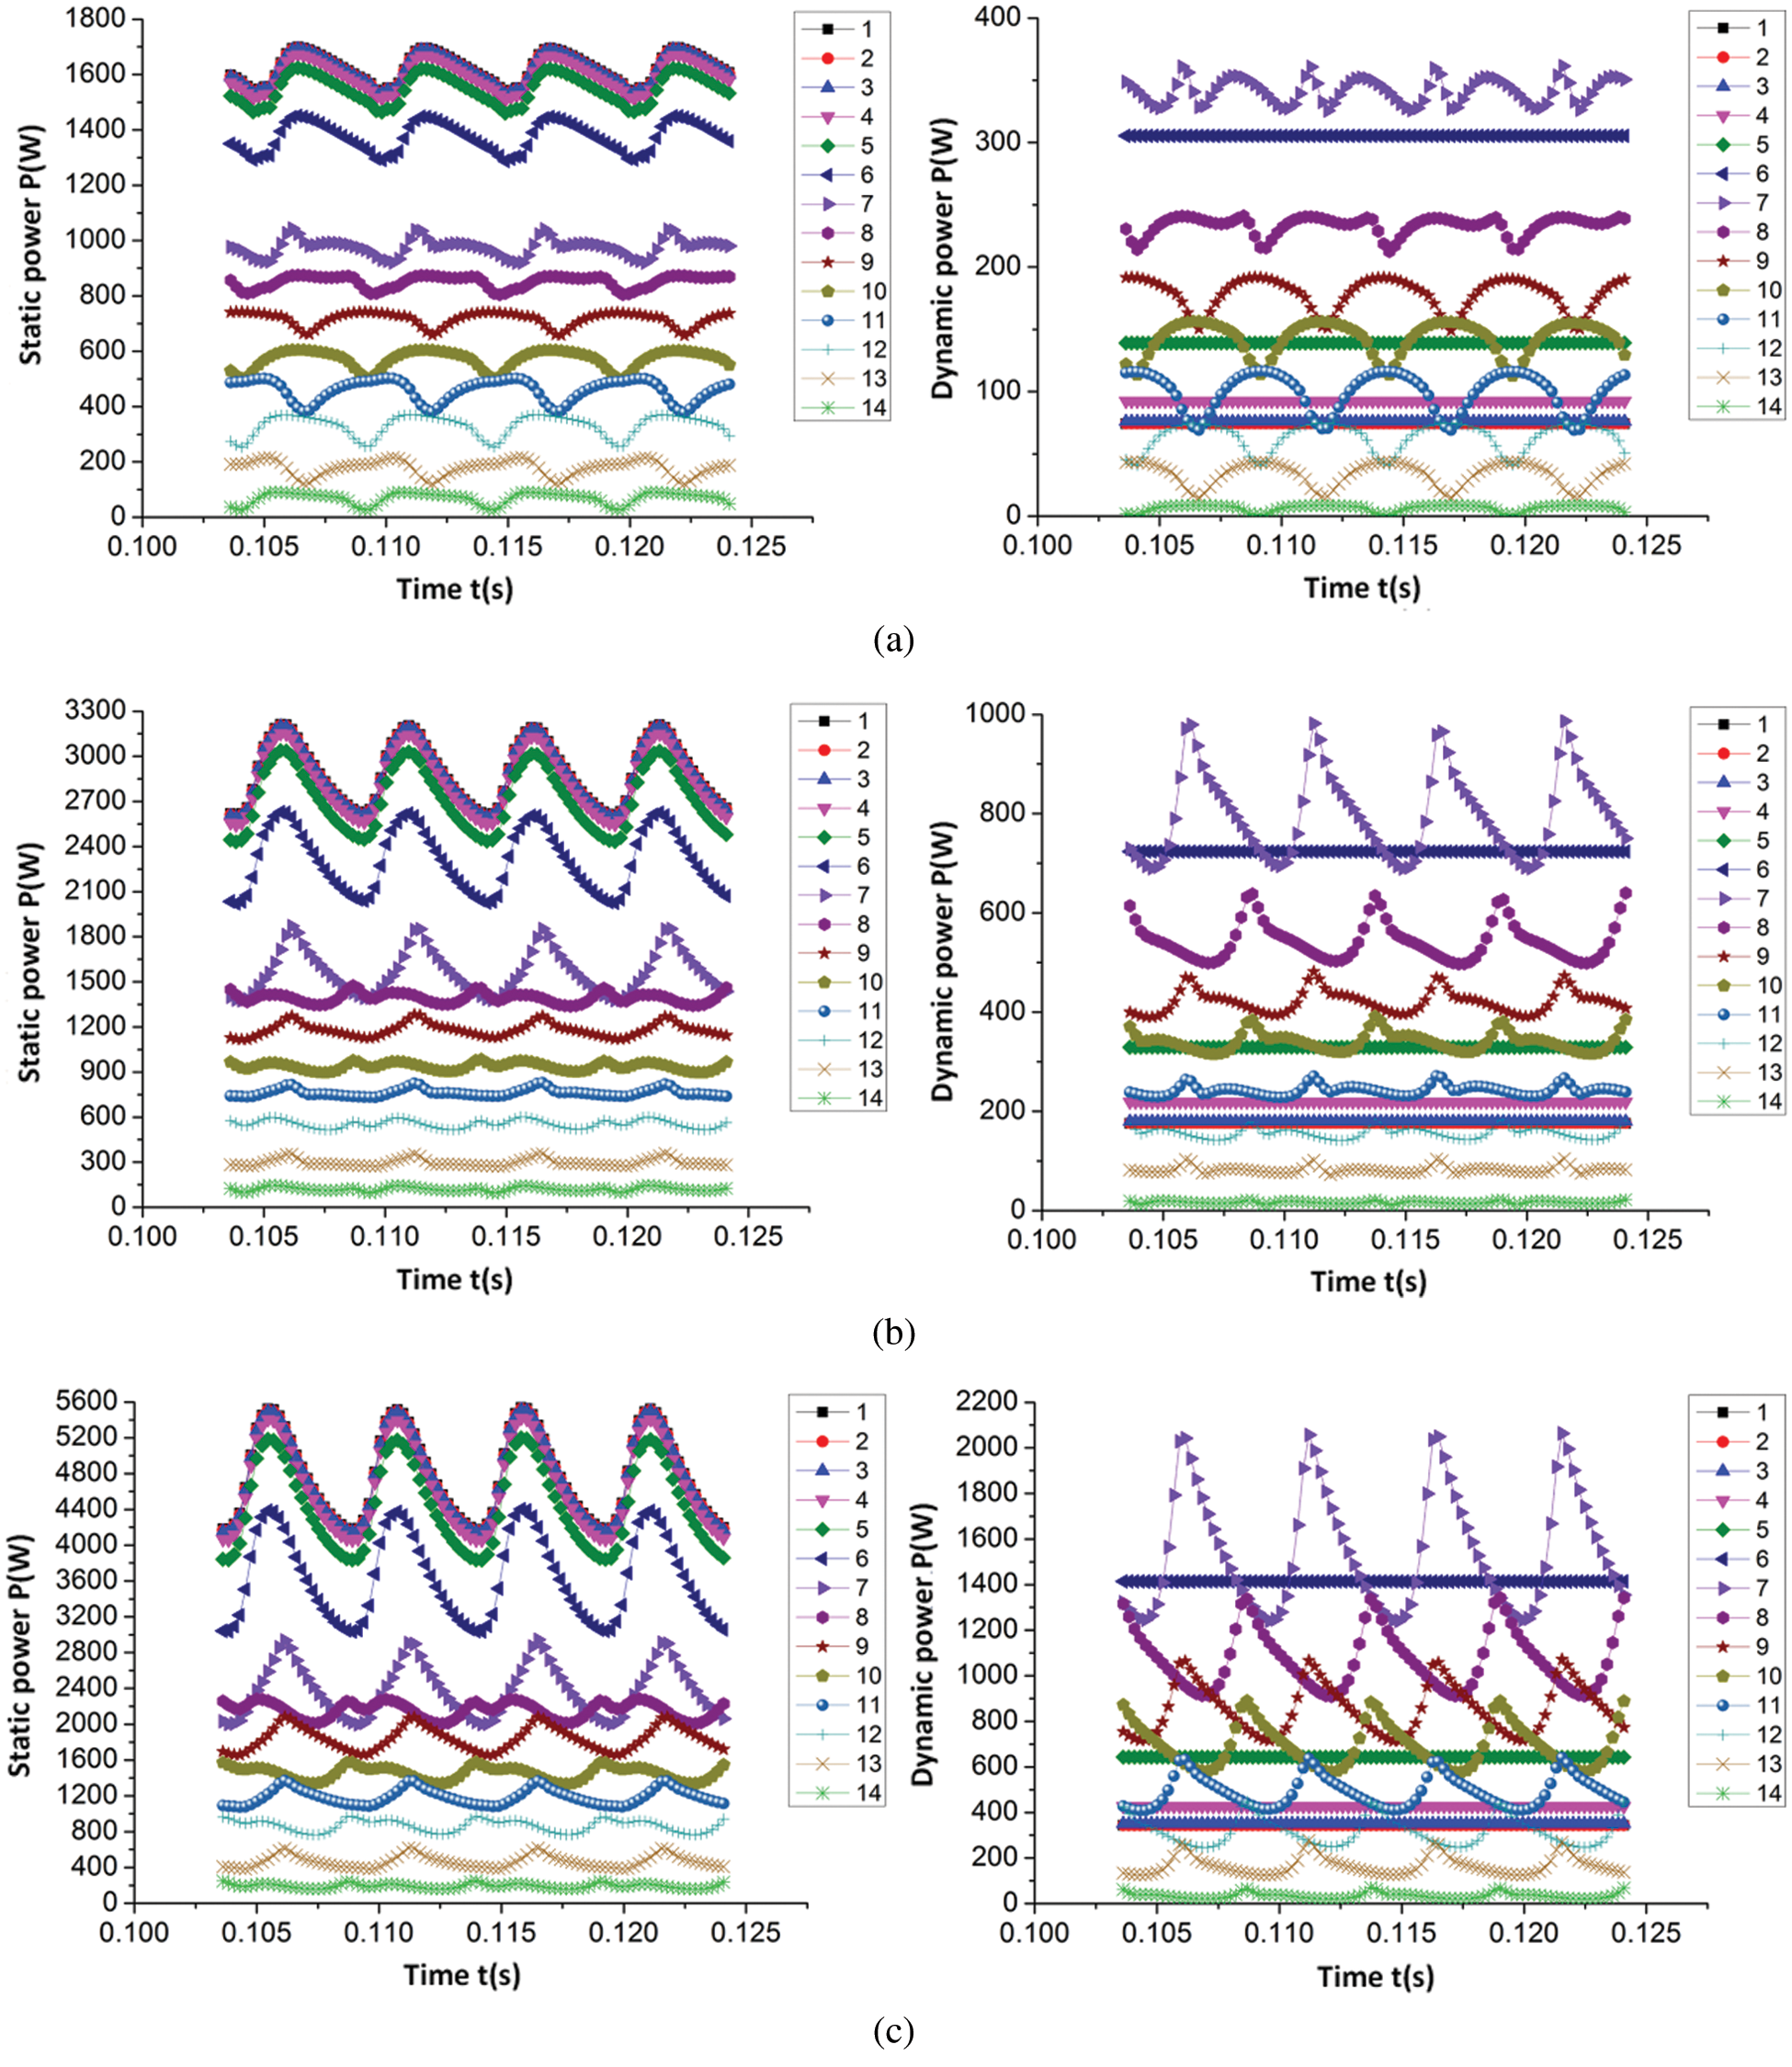
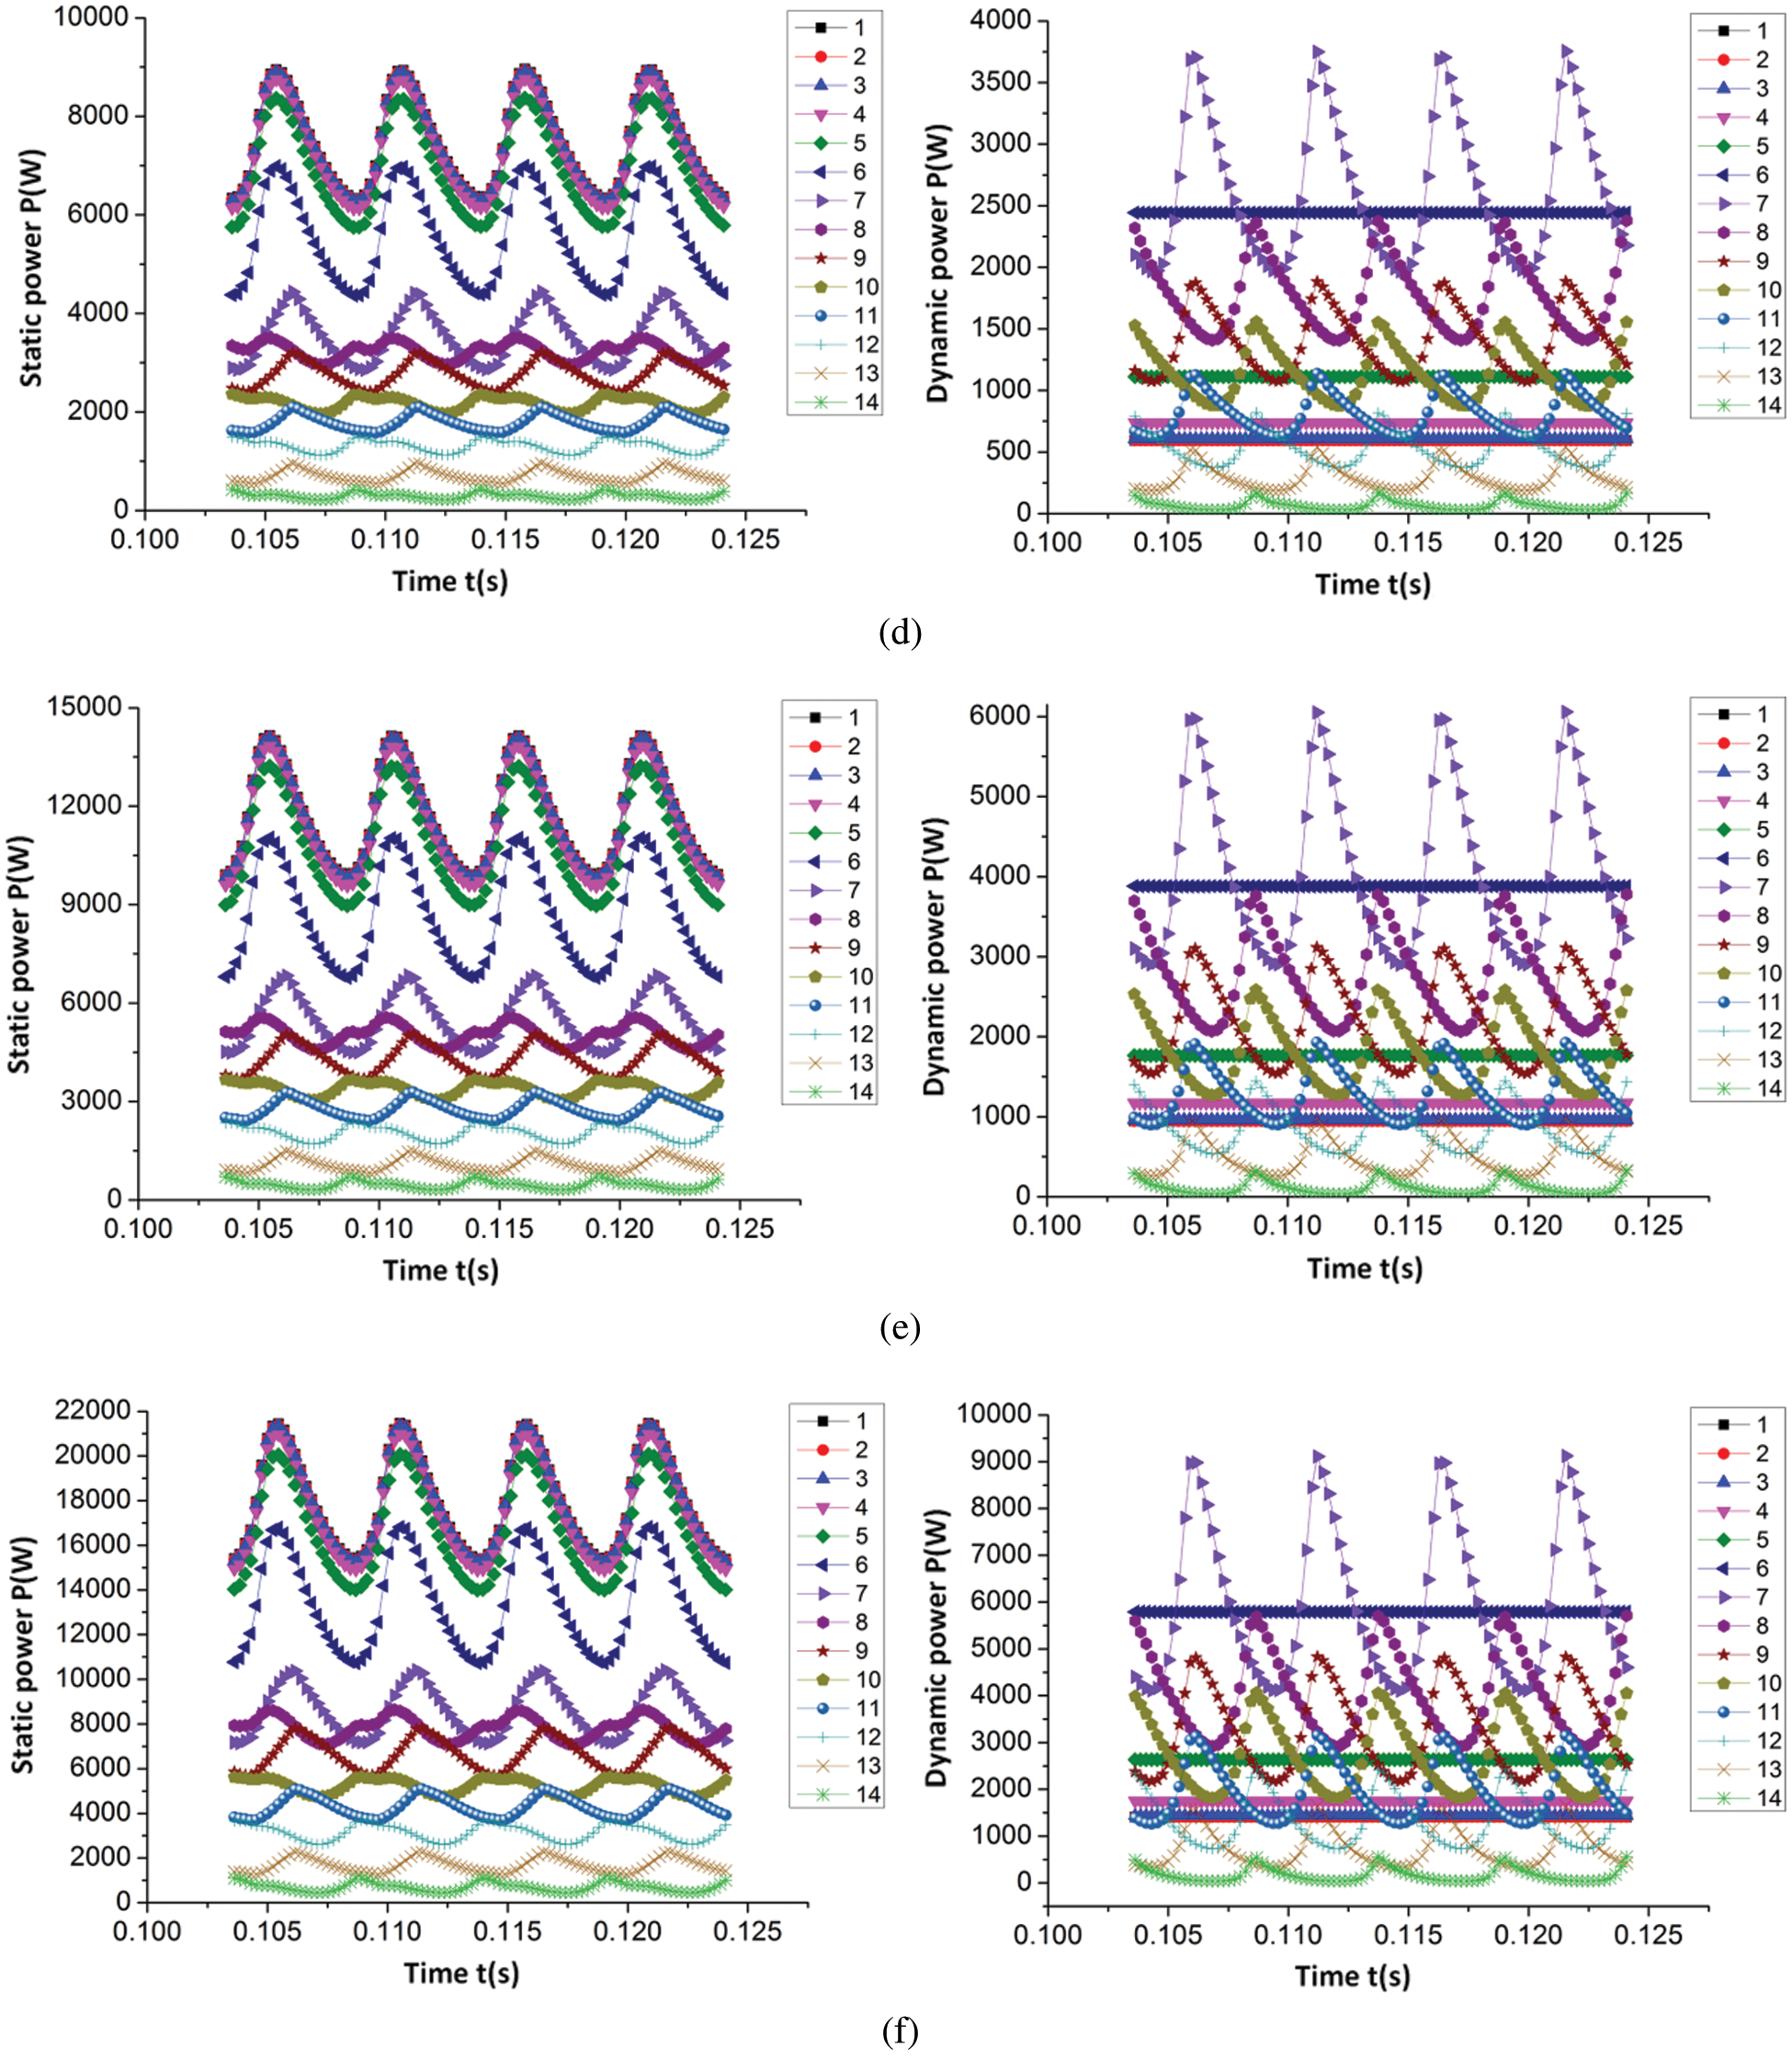
Figure 5: Time domain variation law of static pressure power and dynamic pressure power on each section of volute (a) 0.6Qt (b) 0.8Qt (c) 1.0Qt (d) 1.2Qt (e) 1.4Qt (f) 1.6Qt
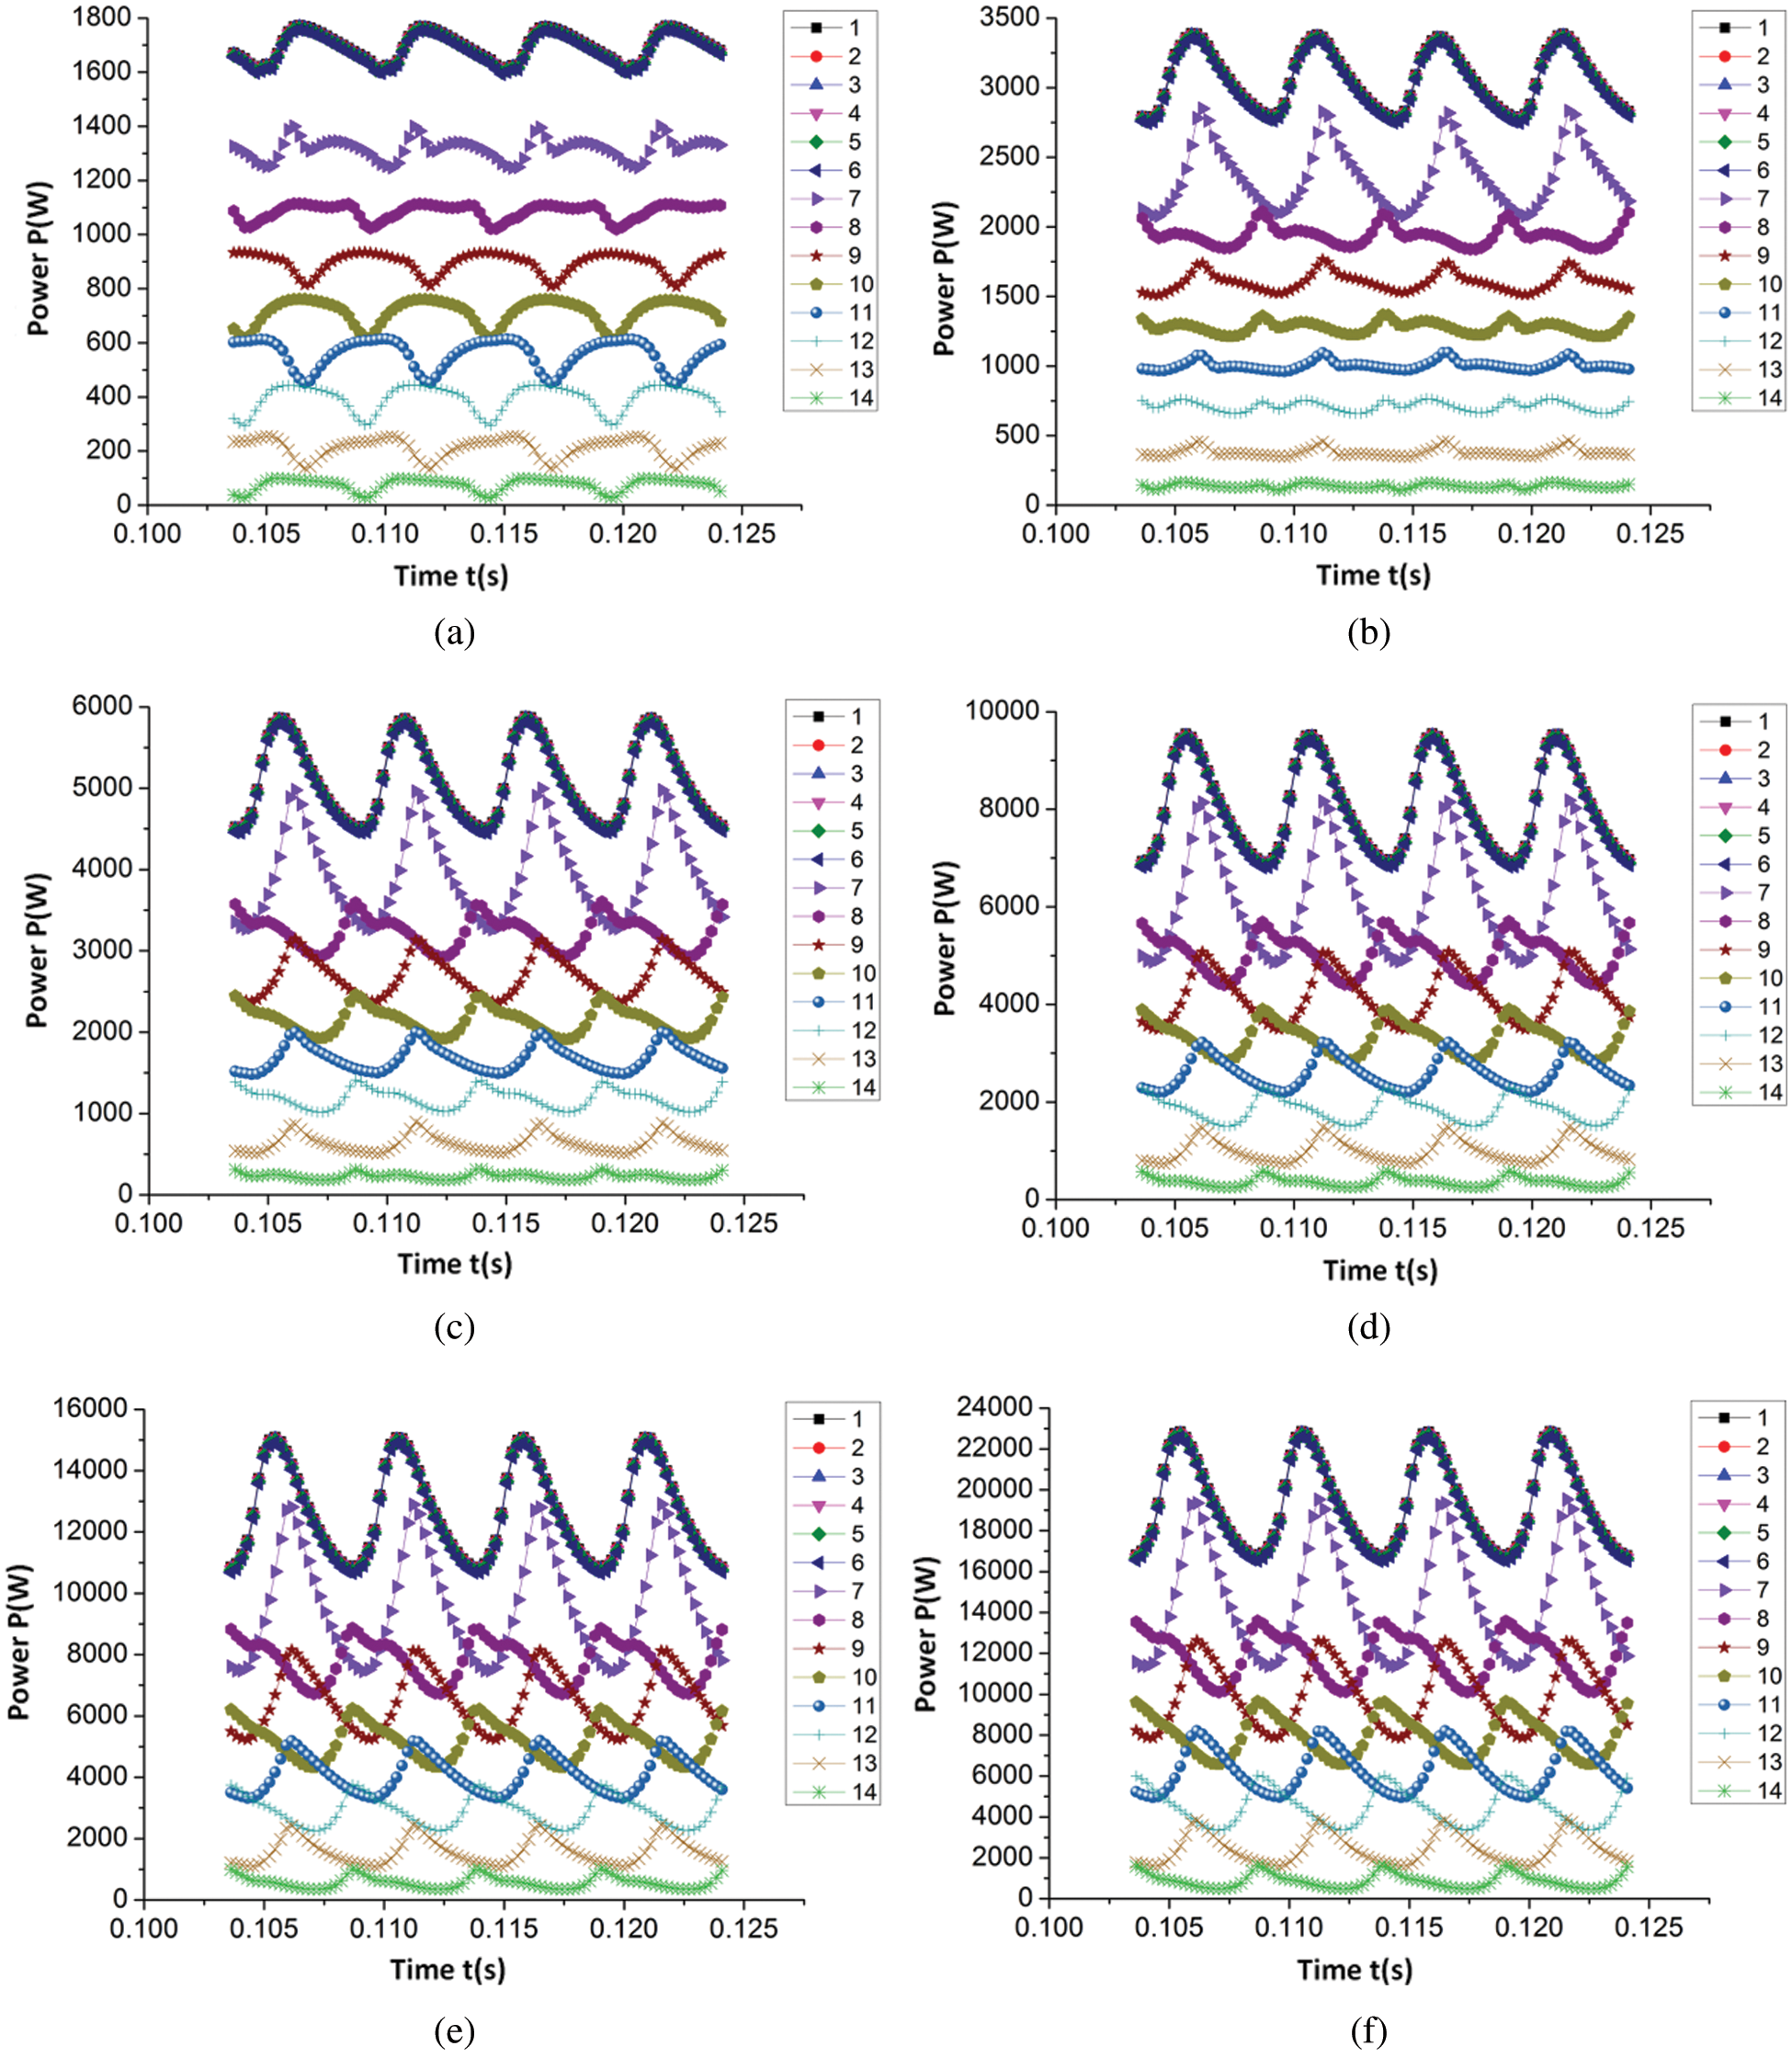
Figure 6: Time domain variation law of total pressure power of each section of volute (a) 0.6Qt (b) 0.8Qt (c) 1.0Qt (d) 1.2Qt (e) 1.4Qt (f) 1.6Qt
As detailed in Figs. 5 and 6, the average values of static pressure power, dynamic pressure power, and total pressure power in each section of the volute gradually increased as the flow rate increased. Simultaneously, the static pressure power, dynamic pressure power, and total pressure power of each section under different flow rates exhibited similar change rules in one cycle of impeller rotation. From the first section of the volute to the seventh section (extension and contraction), the static pressure power in these seven sections displayed a periodic pulsation law as the number of pulsations equaled the quantity of blades within one cycle of the impeller rotation and the static pressure power decreased successively along each section. However, the dynamic pressure power was essentially unchanged in the first three sections, and gradually increased from the fourth section. This phenomenon occurred because, due to the gradual decrease of the area of each cross section, the velocity increased with the constant flow rate. As a result, from Section 4 to Section 7, the dynamic pressure power gradually increased. Additionally, there was no fluctuation of dynamic power in the first six sections, so it began to fluctuate from Section 7; the periodic pulsation law of the total pressure power during one cycle of the impeller rotation was similar to the pulsation law of the static pressure power, and the total pressure power also decreased sequentially along each section. Among them, the reduction in energy was due to energy being lost during the flow of the fluid from one section to another.
From Section 7 to the Section 14 (volute region) of the volute, the static pressure power, dynamic pressure power, and total pressure power in these 8 sections also exhibited a period in which the quantity of pulsations was equal to the number of blades within one cycle of the impeller rotation. Furthermore, the average value of static power, dynamic power, and total power decreased along each section, with the reduction of the total power of the two adjacent sections equaling the sum of the power lost by the fluid flowing from one section to the next and the output power from the two adjacent sections. Moreover, as observed in the figure, the pulsation of static pressure power, dynamic pressure power, and total pressure power on the two adjacent sections are not synchronized as the power pulsations on these 8 sections are related to the time required for the blades to pass through each section. In the present paper, the quantity of blades in the PAT geometric model is 4, meaning the included angle between the two adjacent blades is 90°. Additionally, from the Section 7 to the Section 14 of the volute, the angle between the two adjacent sections was 45°, and the angle between the interphase sections was 90°. As detailed in the figure, the interphase section with the simulation law was synchronous as they reach the peak or trough at the same time.
Fig. 7 displays the unsteady change process of dynamic and static pressure energy of the volute from the proportion of static pressure energy to total pressure energy in each section of the volute.
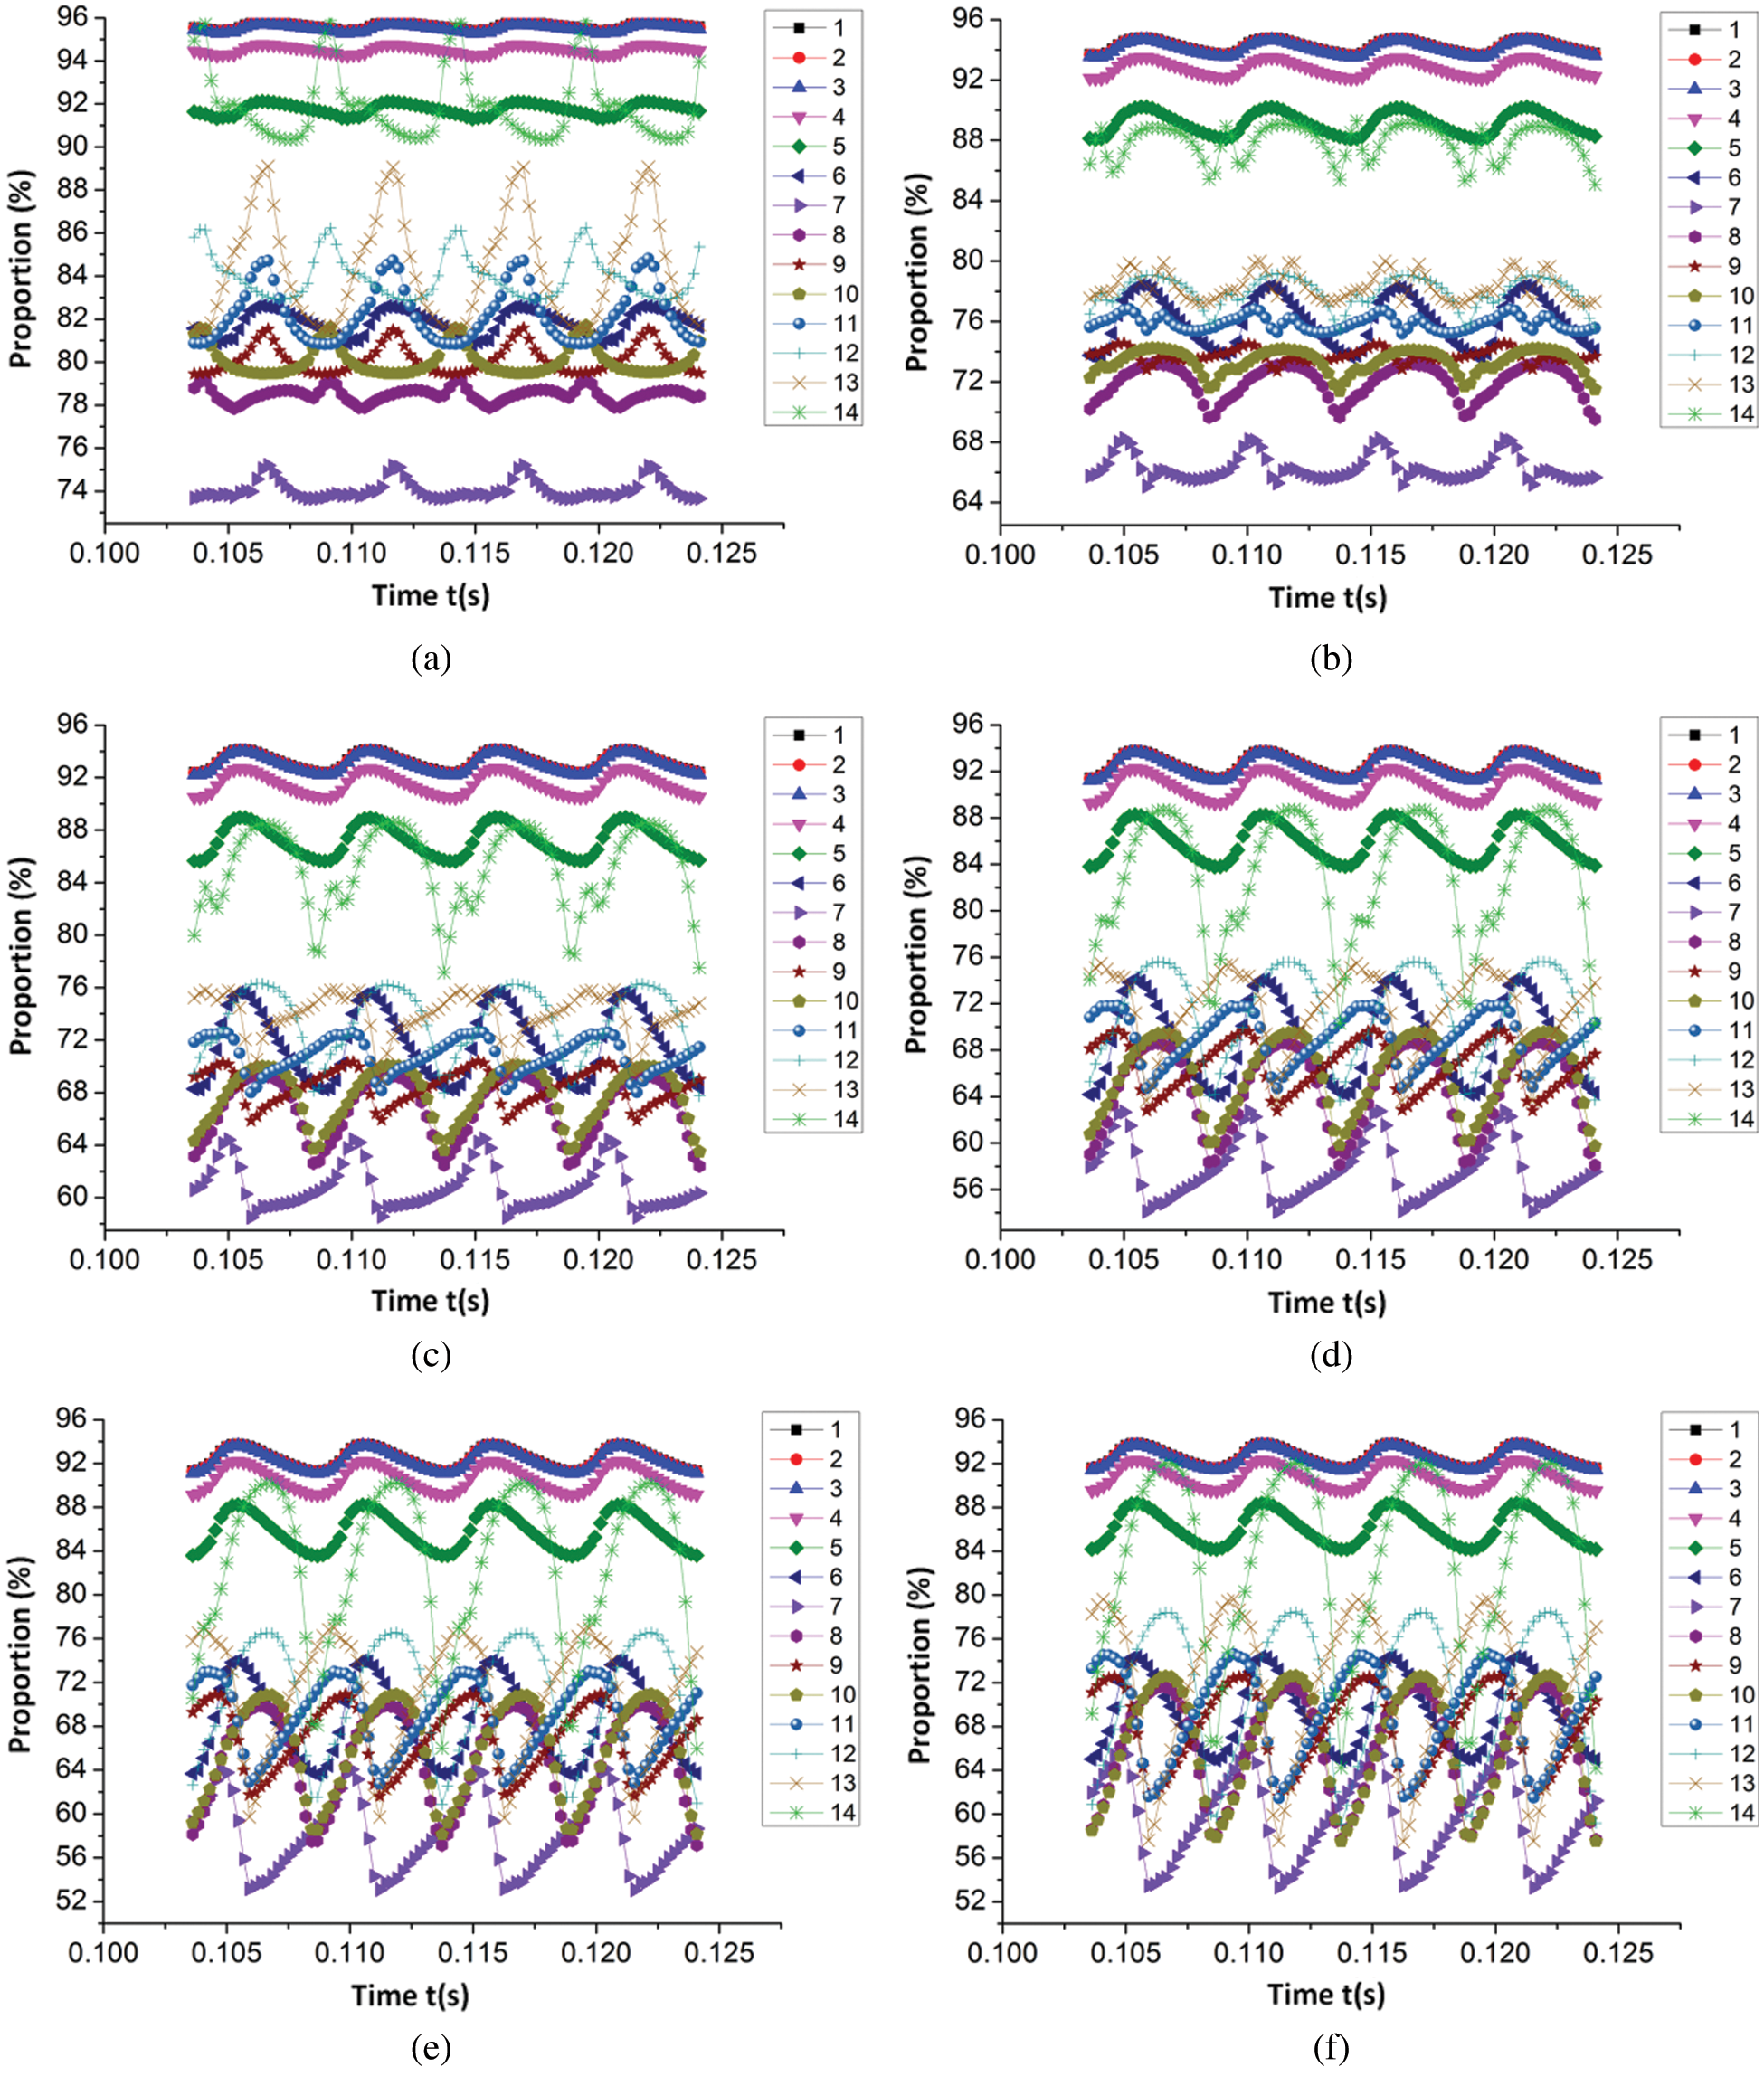
Figure 7: The proportion of the static pressure energy of the volute section to the total pressure energy (a) 0.6Qt (b) 0.8Qt (c) 1.0Qt (d) 1.2Qt (e) 1.4Qt (f) 1.6Qt
As observed in Fig. 7, except for the 0.6Qt working conditions, a similar pulsating rule could be seen in the proportion of static pressure energy to the total pressure energy on each corresponding section of the volute, however, the amplitude of pulsation increased in conjunction with the increase of the flow rate. Additionally, the quantity of pulsations in the proportion of static pressure energy to the total pressure energy in each section was equal to the number of impeller blades. For the 0.6Qt working conditions, due to the differing flow conditions in the volute and the large flow conditions, the flow characteristics in each section under 0.8Qt working conditions could also, to some extent, be observed in the large flow conditions and the transition process of the flow difference from the 0.6Qt working conditions. Furthermore, the figure also illustrates that the fluctuation degree of the proportion of static pressure energy to total pressure energy in each of the volute sections was more severe than that on the inner section of the inlet extension section (Sections 1–3) and the contraction section. The largest fluctuation was accommodated in Section 14 of the volute under a large flow rate and the maximum relative fluctuation amplitude was approximately 23%. Regardless of the small, large, or optimal flow conditions, along the liquid flow direction, the static pressure energy notably accounted for a large proportion of the total pressure energy change law. From Section 1 to Section 3, the proportion of static pressure energy underwent almost no change; from Section 3 to Section 7, the proportion of static pressure energy gradually decreased, and the proportion of static pressure energy in Section 7 decreased to the lowest point, with specific values of 74.07%, 66.28%, 60.77%, 57.65%, 58.02%, and 59.61%, respectively. These data articulate that from the (0.6–1.2)Qt working conditions, the proportion of static pressure energy in Section 7 gradually decreased, and after the 1.2Qt working conditions, the proportion of static pressure energy gradually increased, evidencing that there were different energy conversion processes under small flow and large flow conditions. Additionally, within the 5 sections (Sections 3–7), the largest drop in the proportion of pressure energy could be found from Section 5 to Section 7, from 0.6Qt to 1.6Qt, respectively, with a decrease of 17.68% (91.75%–81.81%–74.07%, from Sections 5–7, the same below), 22.86% (89.14%–76.03%–66.28%), 26.45% (87.22%–71.77%–60.77%), 28.32% (85.97%–68.98%–57.65%), 27.77% (85.79%–68.59%–58.02%), 26.54% (86.15%–69.39%–59.61%). Ranging from Section 7 to Section 14, the proportion of static pressure energy was generally on the rise, of which the largest rising gradient occurred from Section 13 to Section 14, and from 0.6Qt to 1.6Qt, it respectively increased by 7.56% (84.36%–91.92%), 9.58% (78.31%–87.89%), 11.21% (73.91%–85.12%), 11.62% (71.44%–83.06%), 12.03% (70.76%–82.79%), and 11.96% (71.52%–83.48%).
Regarding the extension section of the volute inlet, since the flow area was equal, the proportion of static pressure energy to the total pressure energy was almost equal too. Meanwhile, in the contraction section, the flow area gradually decreased, meaning the proportion of static pressure energy to the total pressure energy also gradually decreased. After entering the volute section from the volute contraction section, because the volute was connected to the impeller, a part of the fluid entered the impeller from the volute exit, indicating that the change in the proportion of static pressure energy on each section can be narrowed down to the effect of these two parts. There are two common results: one is the ratio of energy at the outlet of the volute, that is, the proportion of the static pressure energy at the outlet of the volute to the total pressure energy; another is that there is a certain energy conversion in the volute section.
In order to clarify whether energy conversion was the primary cause of the change in the proportion of static pressure energy to the total pressure energy in the volute section, Fig. 8 illustrates the average value of the proportion of static pressure energy to the total pressure energy from Section 8 to Section 14 of the volute and the average value of the proportion of static pressure energy on the exit surface of the volute to the total pressure energy, with the volute exit area between Section 7 and Section 8 in Fig. 8 defined as Exit 1, and the volute exit area between Section 8 and Section 9 defined as Exit 2, and so on.
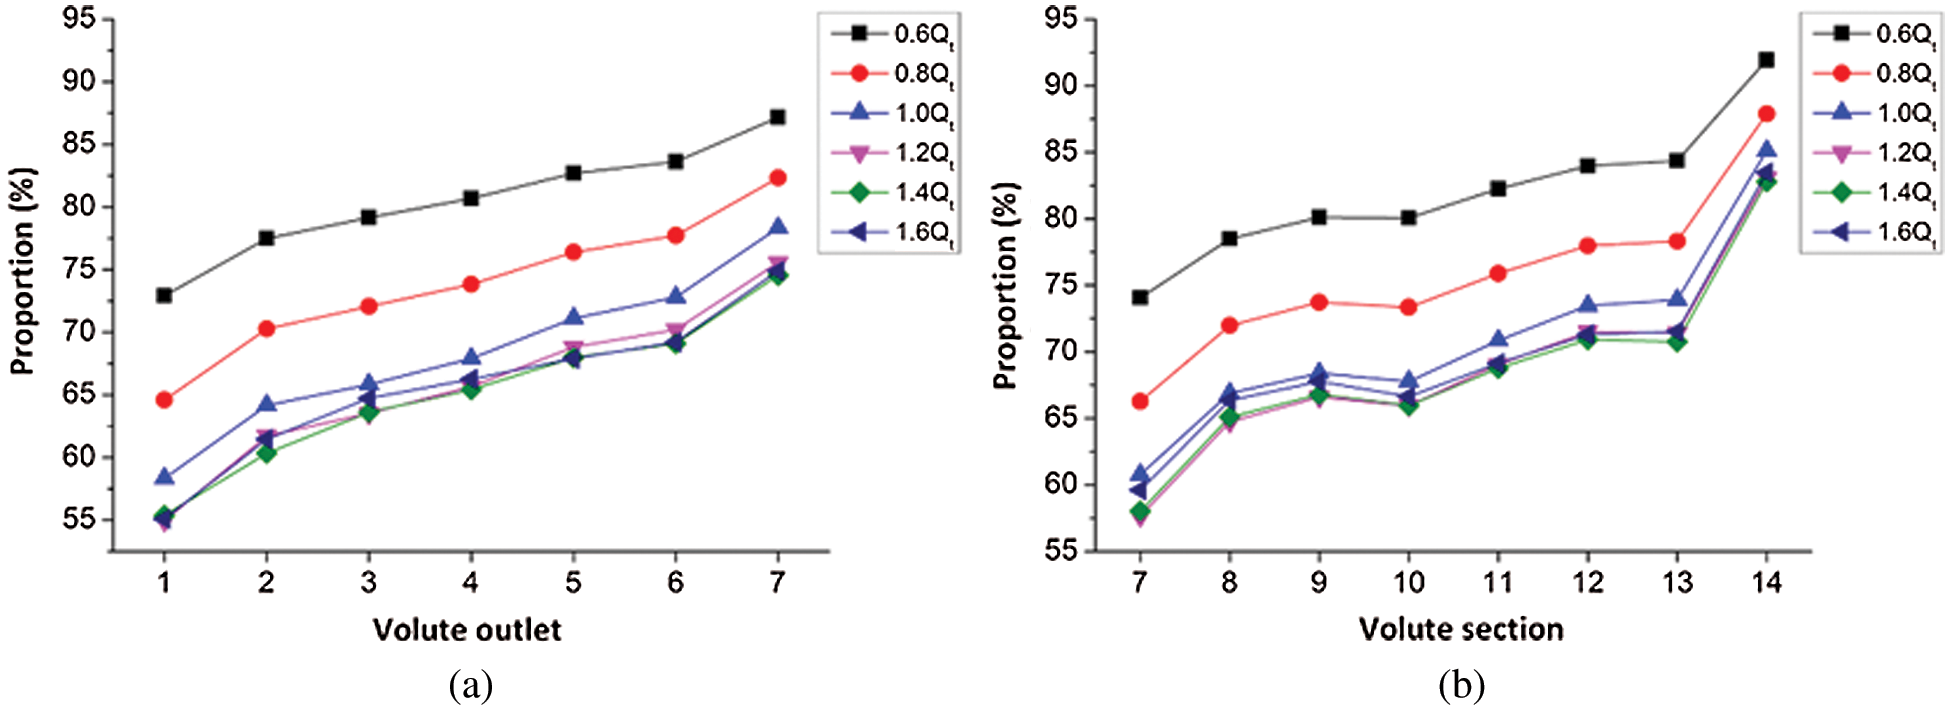
Figure 8: Ratio of static pressure energy to total pressure energy (a) Volute outlet (b) Volute section
According to Fig. 8, under the same flow rate, the change rule of the proportion of static pressure energy on the volute outlet and the corresponding volute section was roughly similar, exhibiting a gradual increase trend. However, differences in the range of change between the two can be observed, evidencing that there was a mutual conversion of dynamic and static pressure energy in the volute of a PAT. Under the working conditions of 0.6Qt, when the ratio of the static pressure energy is compared to the total pressure energy in each section of the volute and the exit section of the volute, an observation could be made that from Section 7 to Section 10 of the volute, the conversion of dynamic and static pressure energy was not particularly apparent. Moreover, from Section 10 to Section 14 of the volute, the proportion of static pressure energy in the total pressure energy rose from 80.06% to 91.92%, and the corresponding static pressure energy on the exit section of the volute and the proportion of total pressure energy elevated from 81.10% to 87.14%. Therefore, the conclusion that a certain amount of dynamic pressure energy was converted into static pressure energy from the Section 10 to the Section 14 of the volute can be formulated. The figure also exhibits that the most substantial transformation occurred in the area between Section 13 and Section 14. In the range of (0.8–1.0)Qt, the energy conversion law in the volute was the same as that under the 0.6Qt working conditions; in the range of the (1.2–1.6)Qt working conditions, from Section 7 to Section 13 of the volute, the conversion of dynamic and static pressure energy was relatively minute, while there was a strong energy conversion between Section 13 and Section 14.
3.2 Time Domain Characteristics of Turbulent Dissipation Rate on Different Sections of the Volute
Fig. 9 illustrates the time-domain change characteristics of the turbulent energy dissipation rate in each section of the PAT volute under different flow rates within a cycle. The position of the section are detailed in Fig. 4.
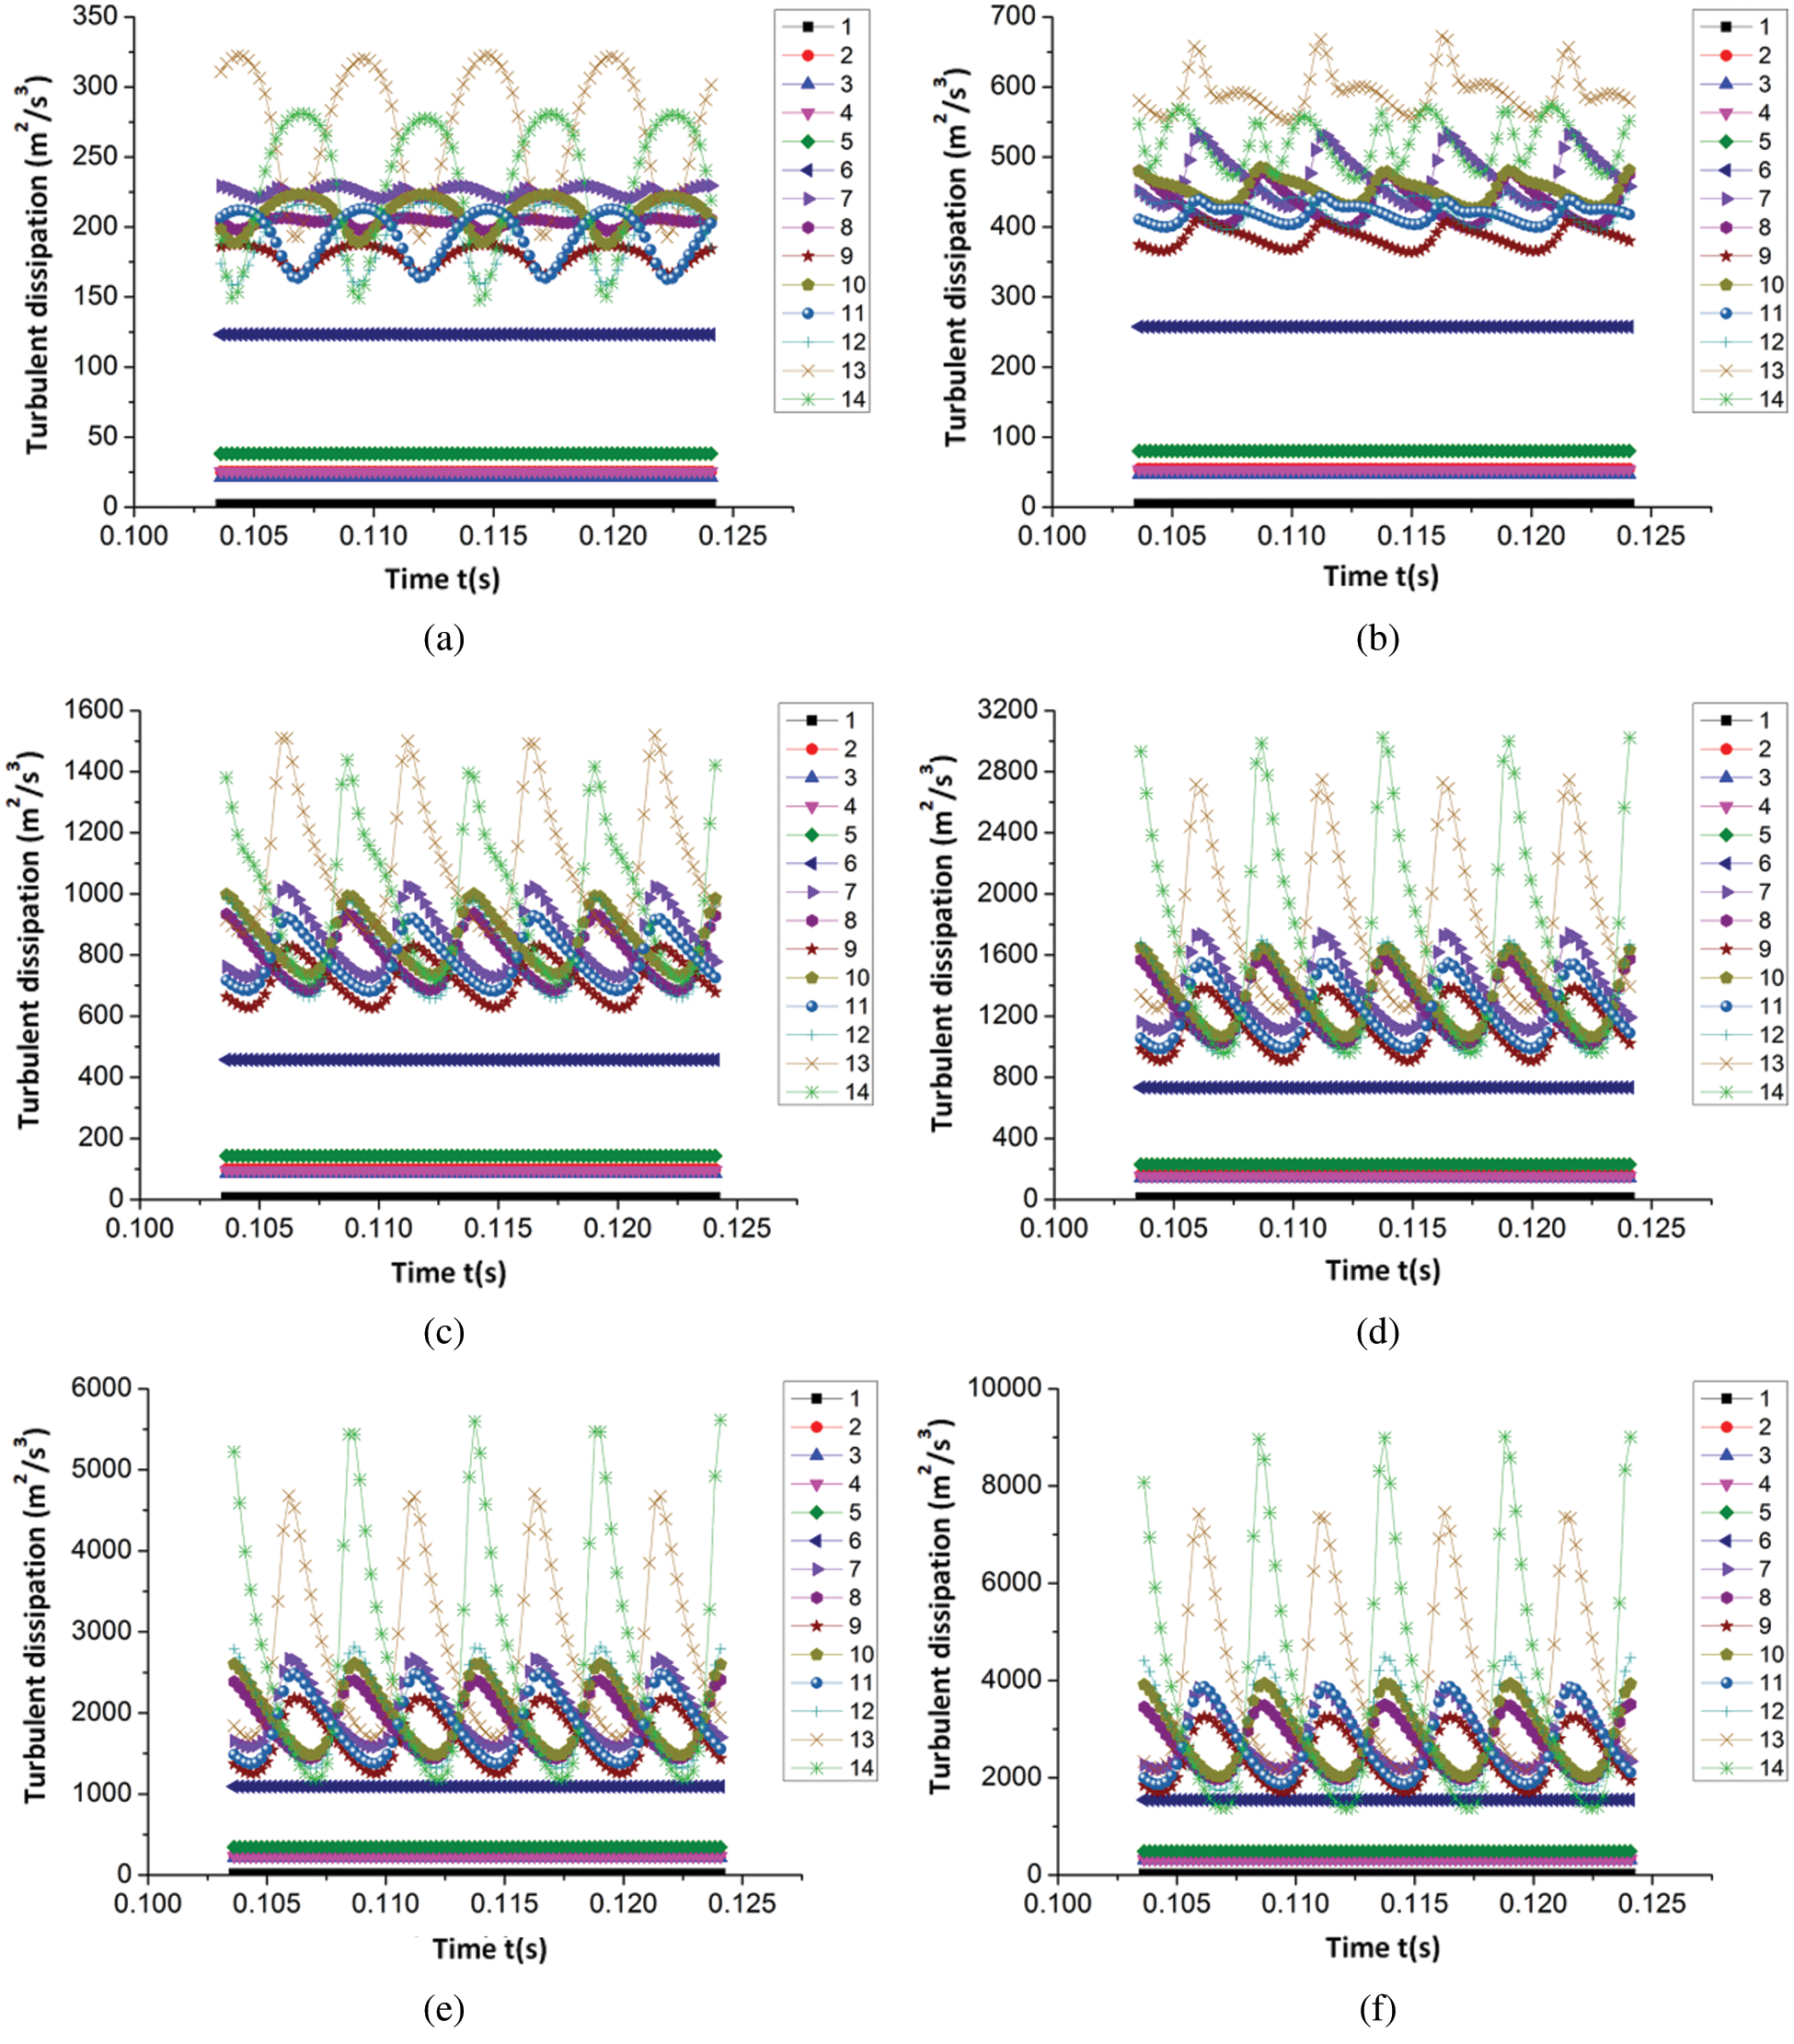
Figure 9: Time-domain variation of turbulent energy dissipation in different sections of the volute (a) 0.6Qt (b) 0.8Qt (c) 1.0Qt (d) 1.2Qt (e) 1.4Qt (f) 1.6Qt
From Fig. 9, despite the pulsation amplitude being different, the turbulent dissipation rate in each section of the volute notably possessed a similar time-domain variation law under different flow rates. The turbulent dissipation rate on each section before the volute tongue had no fluctuations with time, and on all sections after the tongue, the number of fluctuations equaled the quantity of blades. With the continuous increase of a large flow rate, the turbulent energy dissipation rate on each section of the volute gradually increased regardless of the average value or the fluctuation amplitude. Additionally, an observation can be made from the figure that the turbulent dissipation in the volute section was larger than that in the extension and contraction sections of the volute, with the turbulent dissipation of volute section being relatively large in the Sections 7, 13 and 14. Within the small flow conditions and optimal conditions, the turbulent dissipation rate in Section 13 was the largest, followed by the Section 14. Under large flow conditions, the turbulent dissipation rate in the Section 14 reached the maximum value, and relatively large fluctuations in the volute are also found in the Section 13 and Section 14, meaning the section between these two sections of the volute loss was relatively large. Through the analysis of the time-domain characteristics of turbulent energy dissipation on each section of the volute, a certain reference for the reasonable design of the section of the PAT volute and the tongue can be formulated.
(1) In the extension and contraction sections of the PAT volute, the static pressure power and the total pressure power exhibited a periodic pulsation law within one cycle of the impeller rotation, and the dynamic pressure increased as the flow cross-sectional area gradually decreased; in the volute section of PAT, the static pressure power, dynamic pressure power and total pressure power also obeyed a periodic pulsation law, with the number of pulsations equaling the number of blades within one cycle of the impeller, and the static pressure power, dynamic pressure power and total pressure power average value being reduced along each section successively.
(2) When the impeller rotated for one cycle, the ratio of static pressure energy to the total pressure energy in each section of the PAT volute under different flow rates yielded a similar pulsation law, displaying periodic changes. In addition, the amplitude of the pulsation increased with the increase in flow rate, and there were different energy conversion processes under small flow and large flow conditions.
(3) The turbulent dissipation rate on each section of the volute possessed a similar time-domain change rule under different flow rates, and the number of fluctuations equaled the quantity of blades on all sections preceding the tongue; as the constant flow rate increased, the average value and fluctuation amplitude of the turbulent energy dissipation rate on each section of the volute gradually increased.
Funding Statement: This work was supported by Gansu Province Science and Technology Fund of China [Grant Nos. 20JR10RA174, 20JR5RA447, 20JR10RA203]; Higher Education Industry Support Plan Project of Gansu Province of China [Grant No. 2020C-20]; Research Subject of Key Laboratory of Fluid and Power Machinery (Xihua University), Ministry of Education [Grant Nos. LTDL2020-007, szjj2019-016]; and Lanzhou University of Technology Hongliu Outstanding Young Teachers’ Program.
Conflicts of Interest: The authors declare that they have no conflicts of interest to report regarding the present study.
1. Waqas, M., Ahmad, N. (2020). Computation of stress distribution in hydraulic horizontal propeller turbine runner based on fluid-structure interaction analysis. Arabian Journal for science and Engineering, 45(11), 9325–9337, 2020. [Google Scholar]
2. David, Š., Mosè, R., Martin, H., Pavel, R., Alessandra, N. et al. (2020). Study of the internal flow field in a pump-as-turbine (PaTNumerical investigation, overall performance prediction model and velocity vector analysis. Renewable Energy, 156, 158–172. [Google Scholar]
3. Cheng, H., Du, G. S., Zhang, M., Wang, K., Bai, W. B. (2020). Determination of the circulation for a large-scale wind turbine blade using computational fluid dynamics. Fluid Dynamics & Materials Processing, 16(4), 685–698. [Google Scholar]
4. Wu, W. M., Zhou, C. D. (2020). A numerical study of the tip wake of a wind turbine impeller using extended proper orthogonal decomposition. Fluid Dynamics & Materials Processing, 16(5), 883–901. [Google Scholar]
5. Wang, L., An, C. G., Wang, N. N., Ping, Y. M., Wang, K. et al. (2020). Numerical simulation of axial inflow characteristics and aerodynamic noise in a large-scale adjustable-blade fan. Fluid Dynamics & Materials Processing, 16(3), 585–600. [Google Scholar]
6. Bi, Z. G., Yang, J. H., Zhao, W. Y. (2014). Status of research of hydraulic turbines for energy recovery. Fluid Machinery, 42(8), 41–45. [Google Scholar]
7. Yang, J. H., Li, H. L., Gong, Z. H., Xia, S. Q., Luo, K. K. (2014). Radial thrust behavior in centrifugal pump as hydro-turbine. Journal of Drainage and Irrigation Machinery Engineering, 32(1), 12–16. [Google Scholar]
8. Shi, F. X., Yang, J. H., Wang, X. H. (2017). Numerical analysis on transient characteristics of hydraulic turbine under variable working conditions. Journal of Drainage and Irrigation Machinery Engineering, 35(3), 200–206. [Google Scholar]
9. Bansal, P., Marshall, N. (2010). Feasibility of hydraulic power recovery from waste energy in bio-gas scrubbing processes. Applied Energy, 87(3), 1048–1053. [Google Scholar]
10. Algieri, A., Zema, D. A., Nicotra, A., Zimbone, S. M. (2020). Potential energy exploitation in collective irrigation systems using pumps as turbines: A case study in Calabria (Southern Italy). Journal of Cleaner Production, 257, 120538. [Google Scholar]
11. Chacon, M. C., Diaz, J. A. R., Morillo, J. G., McNabola, A. (2019). Pump-as-turbine selection methodology for energy recovery in irrigation networks: Minimising the payback period. Water, 11(1), 1–20. [Google Scholar]
12. Du, J. Y., Yang, H. X., Shen, Z. C. (2018). Study on the impact of blades wrap angle on the performance of pumps as turbines used in water supply system of high-rise buildings. International Journal of Low-Carbon Technologies, 13(1), 102–108. [Google Scholar]
13. Coelho, B., Andrade-Campos, A. (2018). Energy recovery in water networks: Numerical decision support tool for optimal site and selection of micro turbines. Journal of Water Resources Planning and Management, 144(3), 1–12. [Google Scholar]
14. Stefan, D., Rossi, M., Hudec, M., Rudolf, P., Nigro, A. et al. (2020). Study of the internal flow field in a pump-as-turbine (PATNumerical investigation, overall performance prediction model and velocity vector analysis. Renewable Energy, 156, 158–172. [Google Scholar]
15. Su, X. H., Huang, S., Zhang, X. J., Yang, S. S. (2016). Numerical research on unsteady flow rate characteristics of pump as turbine. Renewable Energy, 94, 188–495. [Google Scholar]
16. Yang, J. H., Luo, K. K., Xia, S. Q., Li, H. L. (2014). Numerical calculation of axial force based on centrifugal pump reversing hydraulic turbine. Journal of Lanzhou University of Technology, 40(1), 41–45. [Google Scholar]
17. Yang, J. H., Li, H. L., Gong, C. H., Xia, S. Q., Luo, K. K. (2014). Mechanical characteristics of centrifugal pump reversing as hydraulic turbine. Journal of Drainage and Irrigation Machinery Engineering, 32(1), 12–16. [Google Scholar]
18. Dai, C., Kong, F. Y., Dong, L., Xia, B., Bai, Y. X. (2016). Noise reduction by counter-leaning blade and tongue for centrifugal pump as turbine. Journal of Vibration Engineering, 29(4), 623–630. [Google Scholar]
19. Dong, L., Dai, C., Liu, H. L., Kong, F. Y. (2016). Experimental and numerical investigation of interior flow-induced noise in pump as turbine. Journal of Vibroengineering, 18(5), 3383–3396. [Google Scholar]
20. Zhang, J. F., Appiah, D., Zhang, F., Yuan, S. Q., Gu, Y. D. et al. (2019). Experimental and numerical investigations on pressure pulsation in a pump mode operation of a pump as turbine. Energy Science and Engineering, 4(7), 1264–1279. [Google Scholar]
21. Luo, B., Wang, C. L., Xia, Y., Ye, J., Yang, X. Y. (2019). Numerical simulation of flow-induced vibration of double-suction centrifugal pump as turbine. Journal of Drainage and Irrigation Machinery Engineering, 37(4), 313–318. [Google Scholar]
22. Shi, F. X., Yang, J. H., Wang, X. H. (2018). Performance analysis of gas-liquid two-phase hydraulic turbine under variable operating conditions. Fluid machinery, 46(1), 40–45. [Google Scholar]
23. Yang, S. S., Liu, H. L., Kong, F. Y., Xia, B., Tan, L. W. (2014). Effects of the radial gap between impeller tips and volute tongue influencing the performance and pressure pulsations of pump as turbine. Journal of Fluids Engineering, 136(5), 054501. [Google Scholar]
24. Tian, P., Huang, J., Shi, W. D., Zhou, L. (2019). Optimization of a centrifugal pump used as a turbine impeller by means of an orthogonal test approach. Fluid Dynamics and Materials Processing, 15(2), 139–151. [Google Scholar]
25. Miao, S. C., Yang, J. H., Wang, X. H., Li, J. C., Li, T. L. (2015). Blade pattern optimization of the hydraulic turbine based on neural network and genetic algorithm. Journal of Aeronautical Power, 30(8), 1918–1925. [Google Scholar]
26. Asomani, S. N., Yuan, J. P., Wang, L. Y., Appiah, D., Adu-Poku, K. A. (2020). The impact of surrogate models on the multi-objective optimization of pump-as-turbine (PAT). Energies, 13(9), 2271. [Google Scholar]
27. Shi, G. T., Yang, J. H., Miao, S. C., Wang, X. H. (2016). Unsteady calculation of pressure pulsation within hydraulic under different entrance sections. Journal of Aeronautical Dynamics, 31(3), 659–668. [Google Scholar]
28. Shi, G. T., Yang, J. H., Wang, J. S., Miao, S. C. (2016). A method for reduction of pressure fluctuation within volute of single-stage hydraulic turbine. Journal of Lanzhou University of Technology, 42(2), 52–56. [Google Scholar]
29. Arani, H. A., Fathi, M., Raisee, M., Nourbakhsh, S. A. (2019). A novel volute design for reducing radial force in pump and PAT. IOP Conference Series Earth and Environmental Science, 240, 042004. [Google Scholar]
30. Miao, S. C., Zhang, H. B., Shi, F. X., Wang, X. H., Ma, X. J. (2021). Study on energy conversion characteristics in volute of pump as turbine. Fluid Dynamics & Materials Processing, 17(1), 201–214. [Google Scholar]
31. ANSYS Inc. (2011). ANSYS CFX-solver modeling guide (release12.0). Canonsburg, PA: ANSYS Inc. [Google Scholar]
32. Yang, S. S., Li, Q., Huang, Z. P., Kong, F. Y., Shi, H. X. (2013). Research on different specific speed pumps used as turbine. Transactions of the Chinese Society for Agricultural Machinery, 44(3), 69–72. [Google Scholar]
33. Shi, G. T., Yang, J. H., Miao, S. C., Li, T. L. (2015). Calculation of pressure fluctuation in hydraulic turbine volute with different guide vane numbers. Journal of Aerospace Power, 30(5), 1228–1235. [Google Scholar]
34. Dai, C., Dong, L., Kong, F. Y., Fu, L., Bai, Y. X. (2016). Hydrodynamic noise characteristics research in centrifugal pump as turbine. Journal of Basic Science and Engineering, 24(5), 1034–1045. [Google Scholar]
35. ANSYS Inc. (2009). ANSYS fluent 12.0 user’s guide. Lebanon, NH: ANSYS Inc. [Google Scholar]
36. John, D. A. (1995). Computational fluid dynamics: the basic with application. McGraw Hill: USA. [Google Scholar]
37. Lu, J. L., Guo, L., Wang, L. K., Wang, W., Guo, P. C. et al. (2019). Unsteady flow characteristics of tip clearance in semi-open impeller centrifugal pump. Transactions of the Chinese Society for Agricultural Machinery, 50(6), 163–172. [Google Scholar]
 | This work is licensed under a Creative Commons Attribution 4.0 International License, which permits unrestricted use, distribution, and reproduction in any medium, provided the original work is properly cited. |