| Fluid Dynamics & Materials Processing |
DOI: 10.32604/fdmp.2021.017202
ARTICLE
A Study on the Pyrolytic Characteristics of Xanthoceras Sorbifolia Husk and Its Crude Cellulose Extract
1Zibo Fiber and Textile Products Supervision & Inspection Institute, Zibo, 255000, China
2School of Agricultural Engineering and Food Science, Shandong University of Technology, Zibo, 255049, China
*Corresponding Author: Hongmei Zhang. Email: zbzhanghongmei@163.com
Received: 22 April 2021; Accepted: 05 July 2021
Abstract: Huge amounts of Xanthoceras sorbifolia husks (XSH) are typically discarded after oil extraction. Since pyrolysis represents a promising solution to harness the bio-energy of XSH, in the present work the pyrolytic and kinetic characteristics of XSH and related crude cellulose extract (CCE) were studied considering different rates of heating (10, 30 and 50°C min−1). The pyrolysis activation energy, pre-exponential factors and mechanism function were computed using different models namely Popescu, FWO (Flynn-Wall-Ozawa) and KAS (Kissinger-Akahira-Sunose). The pyrolysis process was articulated into three stages: dehydration (Stage I), primary devolatilization (Stage II), residual decomposition (Stage III). Marked variations in the average activation energy, thermal stability, final residuals and rate of reaction were noted. Stage II of XSH and CCE could be described by the Avramic-Erofeev equations. The average activation energies of XSH and CCE were found to be 269 and 296 kJ mol−1, respectively.
Keywords: Xanthoceras sorbifolia husk; crude cellulose extract; pyrolytic characteristics
Xanthoceras sorbifolia (X. S.) Bunge is a high oil content shrub. X. S. kernel has a huge potential for being utilized as a substitute for petrol to produce biodiesel and to relieve the serious situation of energy consumption. Unfortunately, at present huge amounts of X. S. kernels are discarded after oil extraction as useless residue. That is not only a waste of bio-resource but also an environment pollution. Therefore, the utilization of the residue becomes an important issue to be addressed.
Pyrolysis is the thermal decomposition process of sample in an inert state to obtain syngas, tar, and solid residue [1]. Many products can be obtained from the residues through pyrolysis [2], a form of incineration that chemically decomposes organic feedstock by heat in inert atmosphere. Many studies have been reported for the pyrolytic characteristics of terrestrial plants, such as cellulose, sugarcane straw, corn straw, kenaf, etc. [3–7]. However, the pyrolytic characteristics of XSH have not been studied, so pyrolysis poses a promising solution to harness the bio-energy in XSH. On the other hand, extensive efforts have been made to explore innovative approaches for designing textiles in technical areas, such as electrical-conductive textiles, fireproof textile materials, and wearable electronics [8–10]. Cellulose is the important component textiles. So the cellulose thermal degradation is of great importance in the development and storage of textiles and derivatives. Since a full clarification of the mechanism is helpful for the design of decomposition process, it is natural to study kinetics and pyrolytic mechanisms of both the XSH and CCE.
Thermo gravimetric (TG) analysis is a widely used technique [11] for the thermal characterization, which is used for studying the pyrolysis behaviour of sample. Furthermore, TG measurements can provide information regarding the thermal properties of the material and its composition. The pyrolytic characteristics and kinetic of XSH and CCE were evaluated using TG-DTG. The kinetic parameters and the mechanisms of pyrolysis were illustrated. This study will be not only useful for reducing environmental pollution but also helpful to the performance evaluation of textile raw materials.
Before testing, the sample was crushed into powder form that to be able to pass through a 120-mesh screen.
Pyrolytic characteristics were investigated by using a thermal (TG/DSC) analyzer. About 10 mg powder was placed into aluminum oxide crucible, after heating from room temperature to 800°C at rates of 10, 30 and 50 °C min−1 in an inert state with 80 ml.min−1 nitrogen flow rate. Mass losses and calorific changes were TG and DTG data. In this study every experiment was repeated at least twice to ensure the results accuracy.
2.3.1 Determination of the Mechanism and Kinetic Parameters Using Popescu Equation
The mechanism of the primary reaction is described as follows:
where k is the rate constant and volatiles include tar and gas.
The Arrhenius equation to determine the rate of samples conversion was expressed in Eq. (3). The conversion rate is:
where f(α) is the mechanism function with differential coefficient and the conversion degree α is:
where m0 is the initial weight of sample, m represents the sample weight at a specified time t, and the sample weight at the end of the observed reaction stage is m∞.
The temperature increased at a constant heating rate, β (K. min−1) = dT/dt. So:
The final form of Eq. (4) is presented as follows:
where αm, αn are different conversion degrees, Tm, Tn are the corresponding temperatures.
By using this proper value to Eq. (5), resulted in a final plot of
2.3.2 Verification of the Activation Energy (E) and Pre-Exponential Factor
In this study, FWO and KAS [12,13] methods were applied. The activation energy can be obtained by the Ozawa method without selection of the reaction mechanism function. Therefore, it can avoid the error associated with the differences that occur as a result of estimating the reaction mechanism function.
Flynn-Wall-Ozawa equation
Kissinger-Akahira-Sunose equation
With a given value of conversion rate (α), plots of
2.3.3 Kinetic Analysis of Pyrolysis
I is pyrolisis index.
2.4.1 Analysis and Components of X. S. Husk and CCE
The ash content of XSH was 1.05% and was slightly lower than that of CCE. The lignin and hemicellulose contents of husk were significantly higher than those of CCE. The cellulose content in CCE was 43.3% and increased by 28.5% with comparison to husk.
2.4.2 Thermal Degradation Characteristics
The variation of pyrolysis process is related to the chemical composition, which has its own region of pyrolysis temperature. The TG and DTG curves (Fig. 1) showed that the pyrolysis occurred at three main stages (Fig. 2). Stage I occurred at the start of pyrolysis reaction until the temperature reached T1. Stage II (T1 to T5) was composed of two zones which are described in Fig. 1, Zone I occurred from T1 till T3 with maximum weightlessness at T2. Zone II occurred from T3 till T5 with maximum weightlessness at T4. And Stage III occurred when the temperature rose from T5 to 800°C.
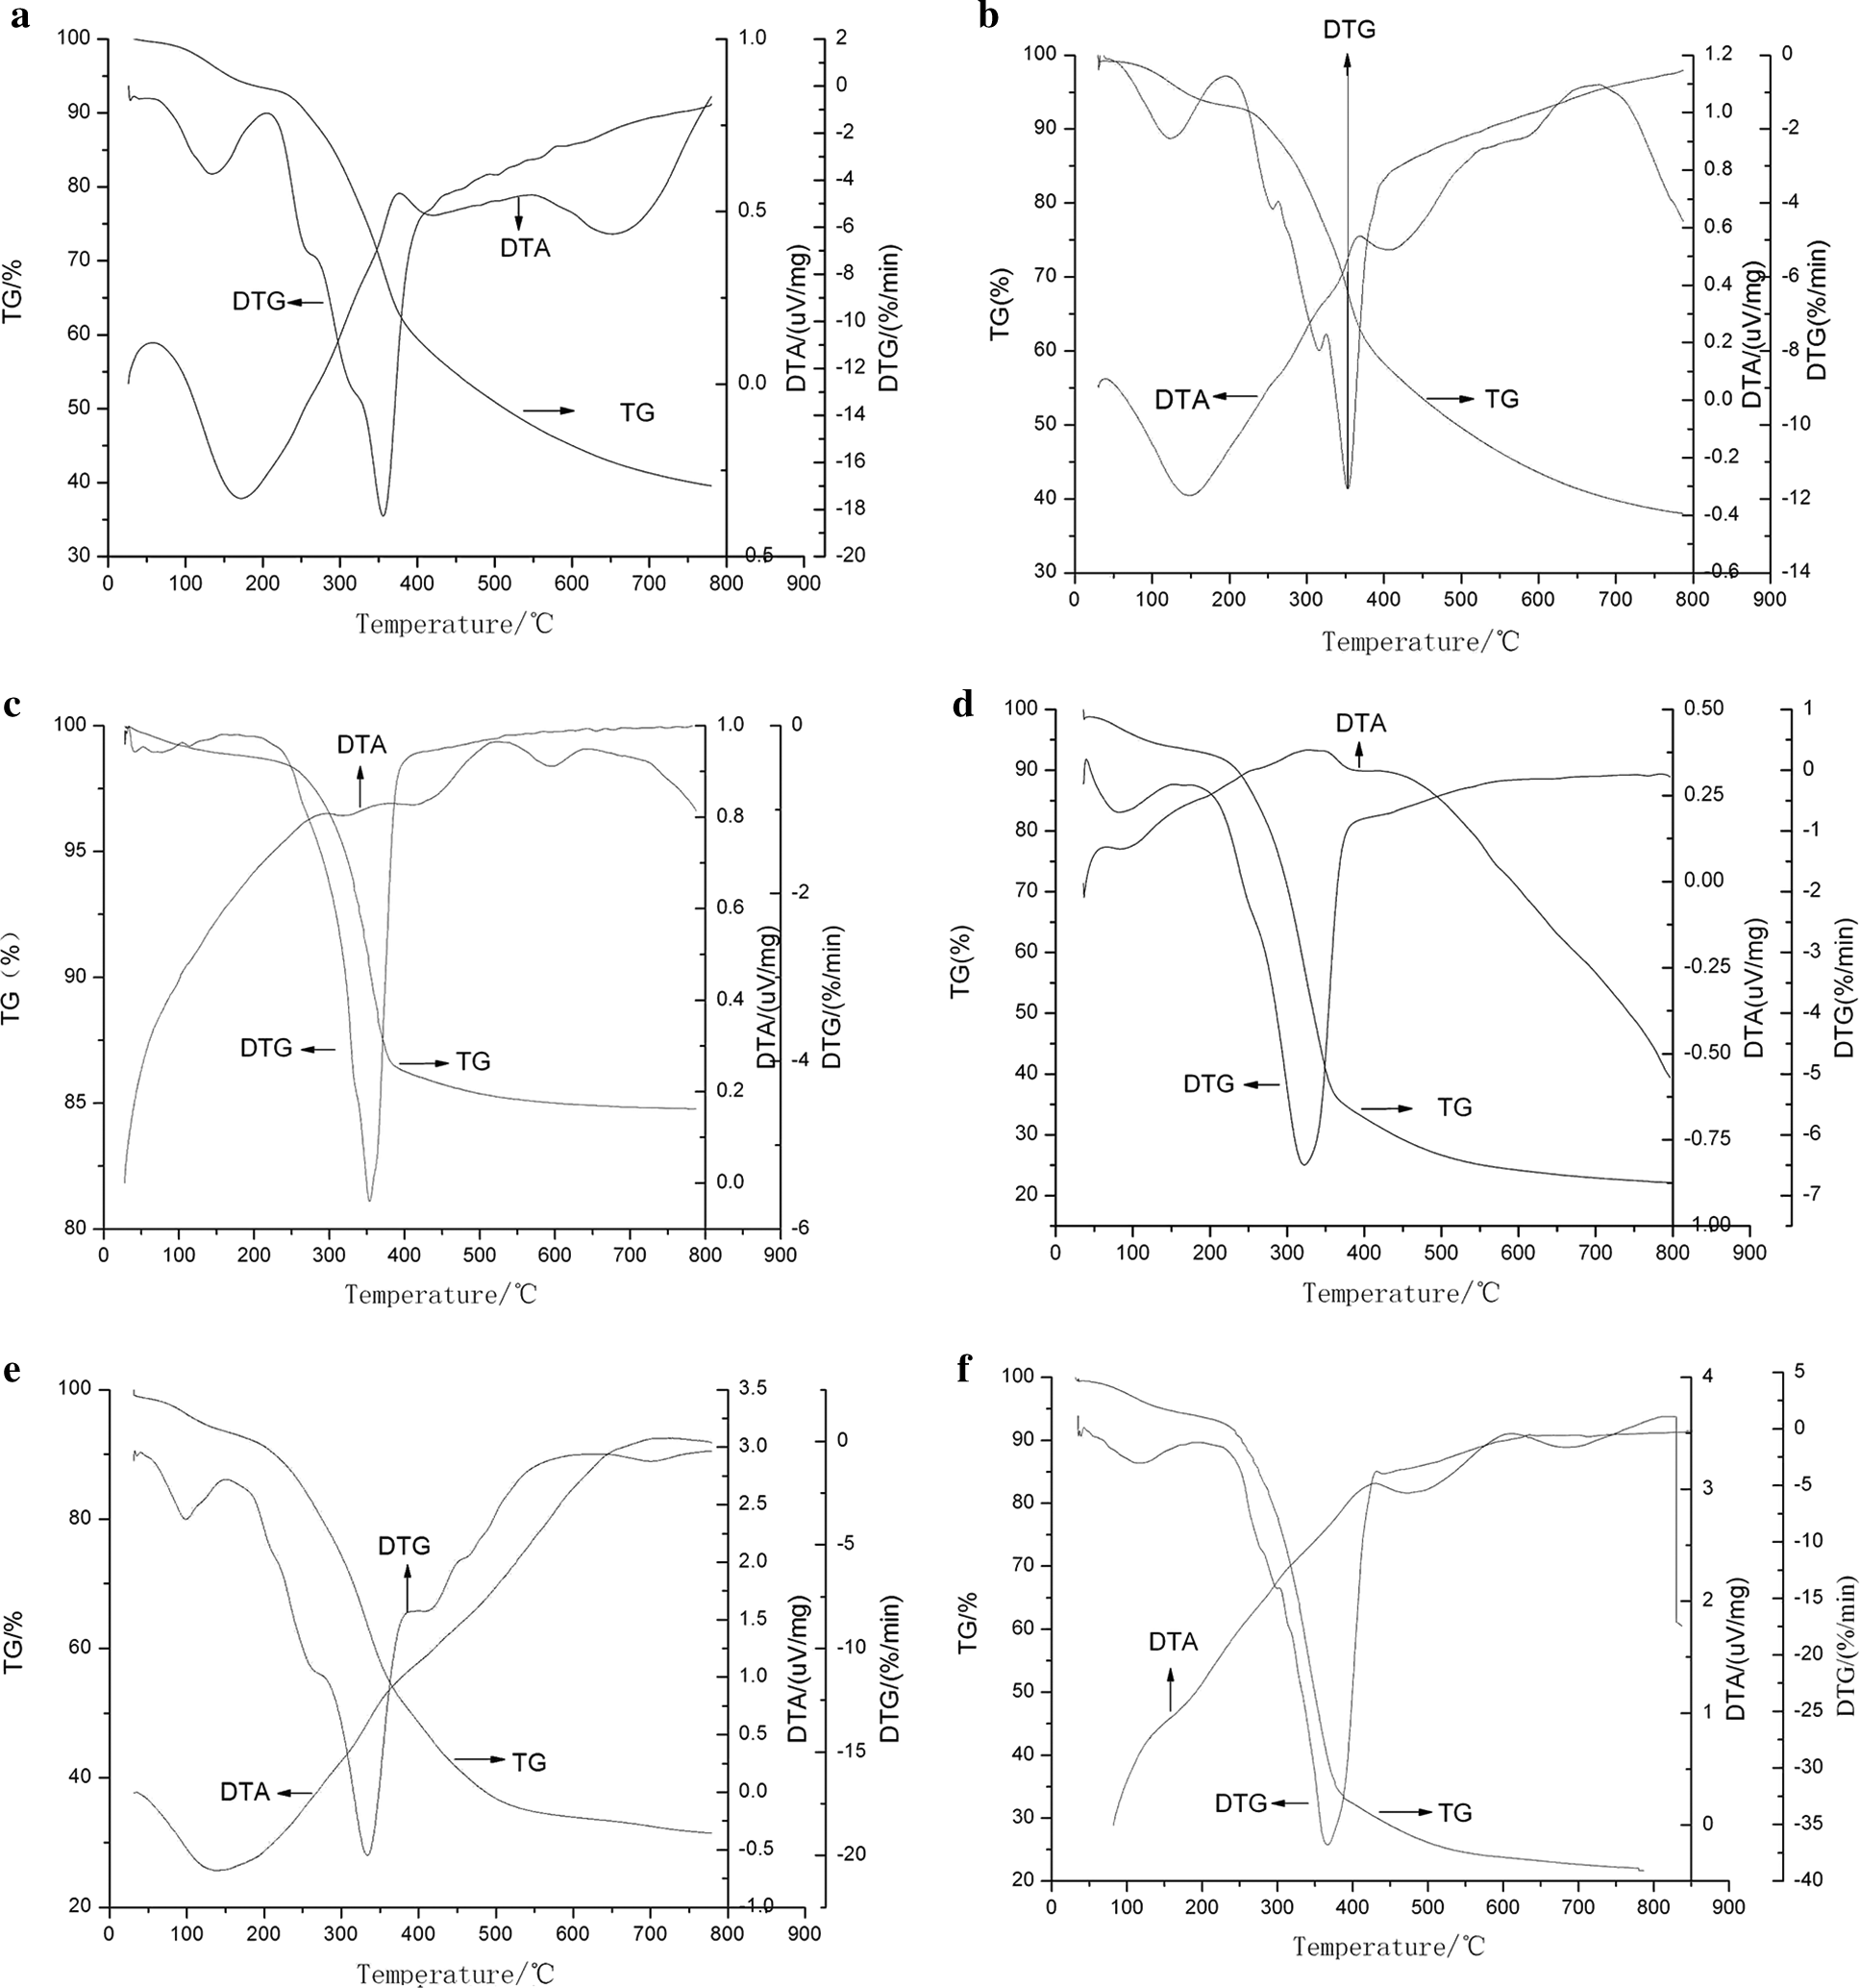
Figure 1: The TG-DTG-DTA curves of X. S. husk and CCE at different heating program. a: 10°C min−1 of XSH; b: 30°C min−1 of XSH; c: 50°C min−1 of XSH; d: 10°C min−1 of CCE; e: 30°C min−1 of CCE; f: 50°C min−1 of CCE
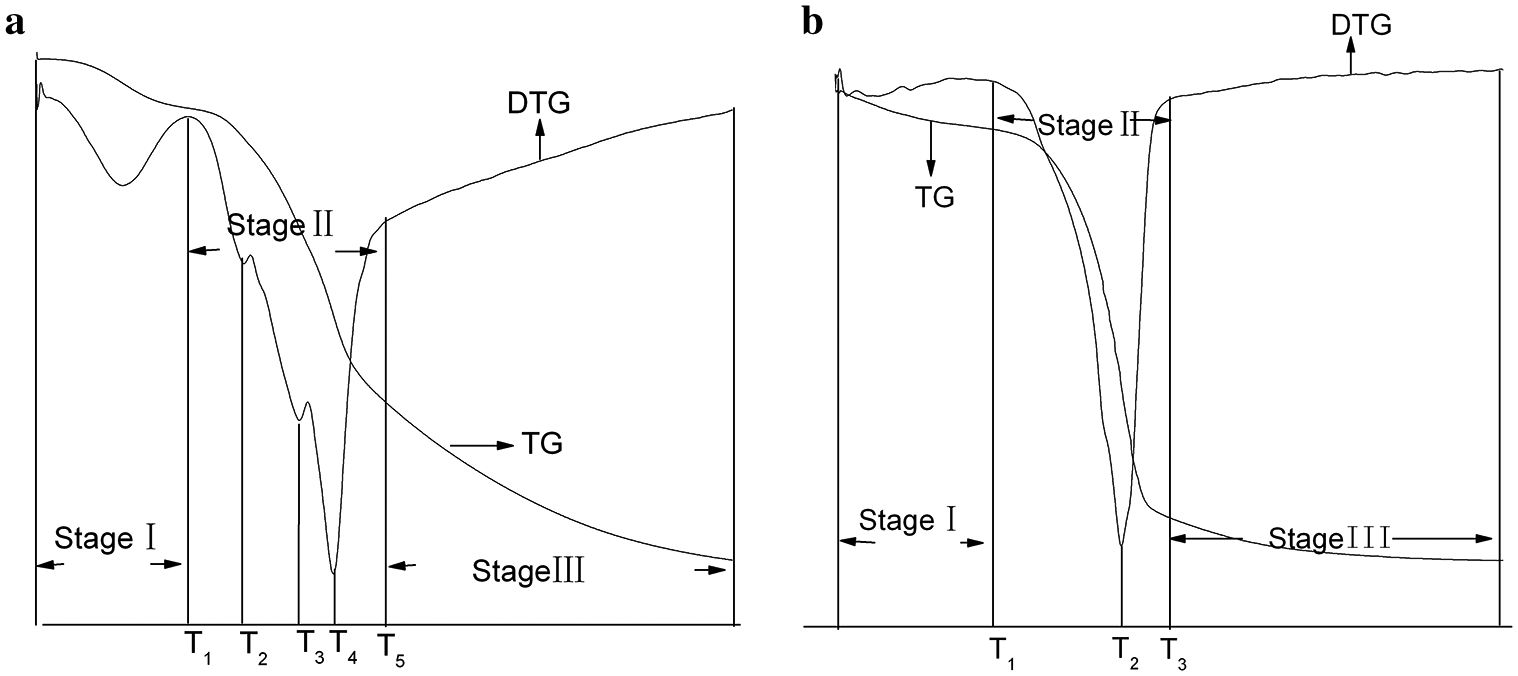
Figure 2: The TG and DTG curves of X. S. husk and CCE. a. XSH; b. CCE
In Stage I (dehydration stage), the mass losses were main due to loss of moisture, including weakly bonded water molecules and cellular water. Stage II as active pyrolysis zone involved devolatilization. The main pyrolytsis process occurred in it because of the high mass loss rate. In this passive pyrolysis stage, polymer macromolecules fracture to form low molecular weight pyrolysis products. The small shoulder at 240°C (XSH) and 303°C (CCE) show the presence of a minor reaction, then a major reaction ensued. This major reaction occurred with an intensive peak at 340–357°C for XSH, and at 322–340°C for CCE, respectively. It can be explained by the components of husk, mostly hemicellulose, cellulose, and lignin. Furthermore, two samples showed overlapping peaks and flat tailing sections by observing DTG curves. The overlapping peaks produced one or two DTG peak with a shoulder located on the left. Vamvuka et al. [14] reported that the shoulder of lower temperature represents the hemicellulose decomposition presented in the sample and that the peak of higher temperature represented the cellulose decomposition. The flat tailing section of the DTG curves corresponded to the pyrolysis of the lignin at high temperatures, which decomposed slowly. This information was consistent with results in literature that the 2nd and 3rd of these TG stages corresponded to the pyrolytsis of lignin and cellulose respectively [15]. It was known that the thermal degradations of hemicelluloses, lignin and cellulose occurred during the temperature intervals of 210–325°C, 310–400°C, and 160–900°C, respectively. Therefore, the DTG curves of CCE exhibit less pronounced shoulder, which indicated that it contains less hemicellulose. But it seems that husk contain a larger amount of hemicelluloses, according to its two well pronounced shoulders. CCE has the higher amount of lignin than XSH, because the tailing section was quite profound. In the Stage III, the residue slowly decomposed, resulting in the formation of a loose porous residue. The initial temperature of decomposition of CCE occurred before XSH. Because there were less inorganic salts in husk and cellulose, and it was useful to catalyze the decomposition. The amounts of final residues of CCE at 800°C were all significantly less than those of XSH. Furthermore, the maximum instantaneous reaction rate for CCE was the higher one in the two samples.
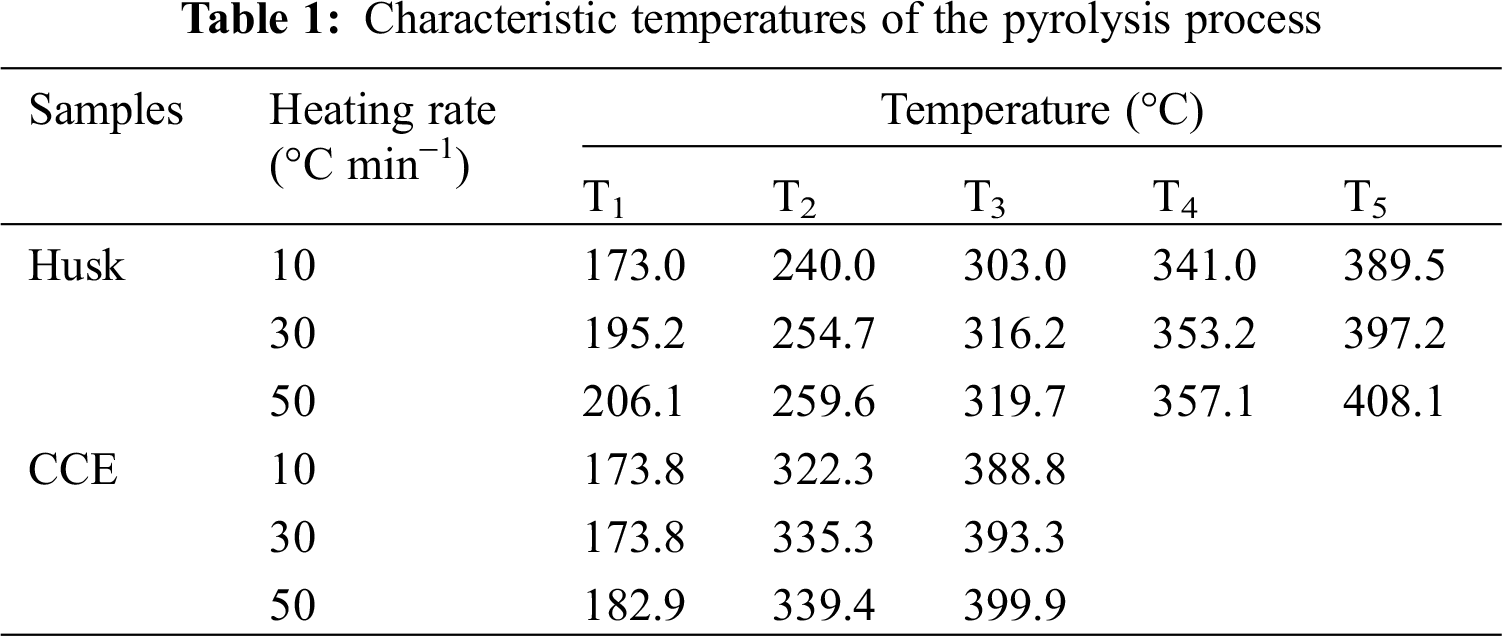
It was significant to know the effect of heating rate on pyrolysis. To be specific, as the heating rate increased, the average reaction rate, temperature range and maximum weightlessness temperature all increased, except the initial temperature of CCE (Tab. 1). The phenomenon took after a previous study of various raw materials [16]. The increased heating rate can provide higher thermal energy, which is conductive to better heat transfer between the sample and the surroundings. The DTA curves are shown in Fig. 1. There were differences between the DTA curve of XSH and that of CCE. For XSH, an endothermic peak occurred in dehydration stage. It accorded with both the evaporation of water and the theory that the drying process requires heat absorption. These results correspond with other conclusions in reference Matheus et al. [17]. However, CCE has no endothermic peak during Stage I. In Stage II, it was observed that as the temperature increased, with exothermic peaks being observed after the corresponding maximum weight loss point. Heating rate affected the conversion, and product distribution, so the DTA curves with different heating rates were different. With the heating rate increasing, the exothermic effect and the peak area increased. Maybe it was due to the increase in the number of samples per unit time. The data indicated that the pyrolysis process was mainly exothermic, which was due to the charring process of CCE. He et al. obtained similar result with wheat straw and corn stalk. While on the contrary, an obvious endothermic peak was observed on the DTA curve of XSH before the maximum exothermic peak.
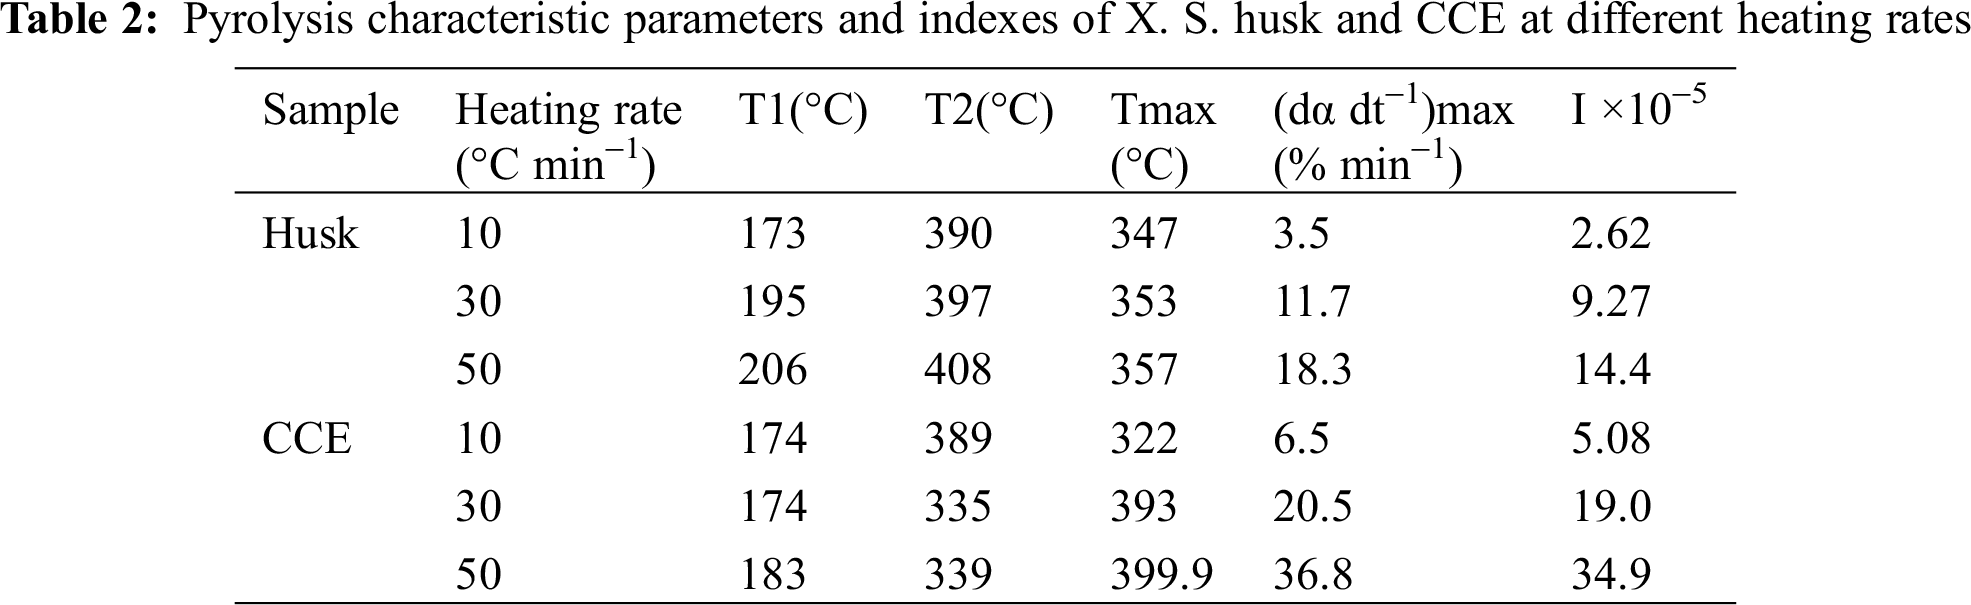
Tab. 2 showed that when the heating rate increased, I (pyrolysis index) increased, which meant that the high heating rate enhanced pyrolytic reactions. In addition, the pyrolytic reaction of CCE was easier than XSH, which matched the results in Tab. 1.
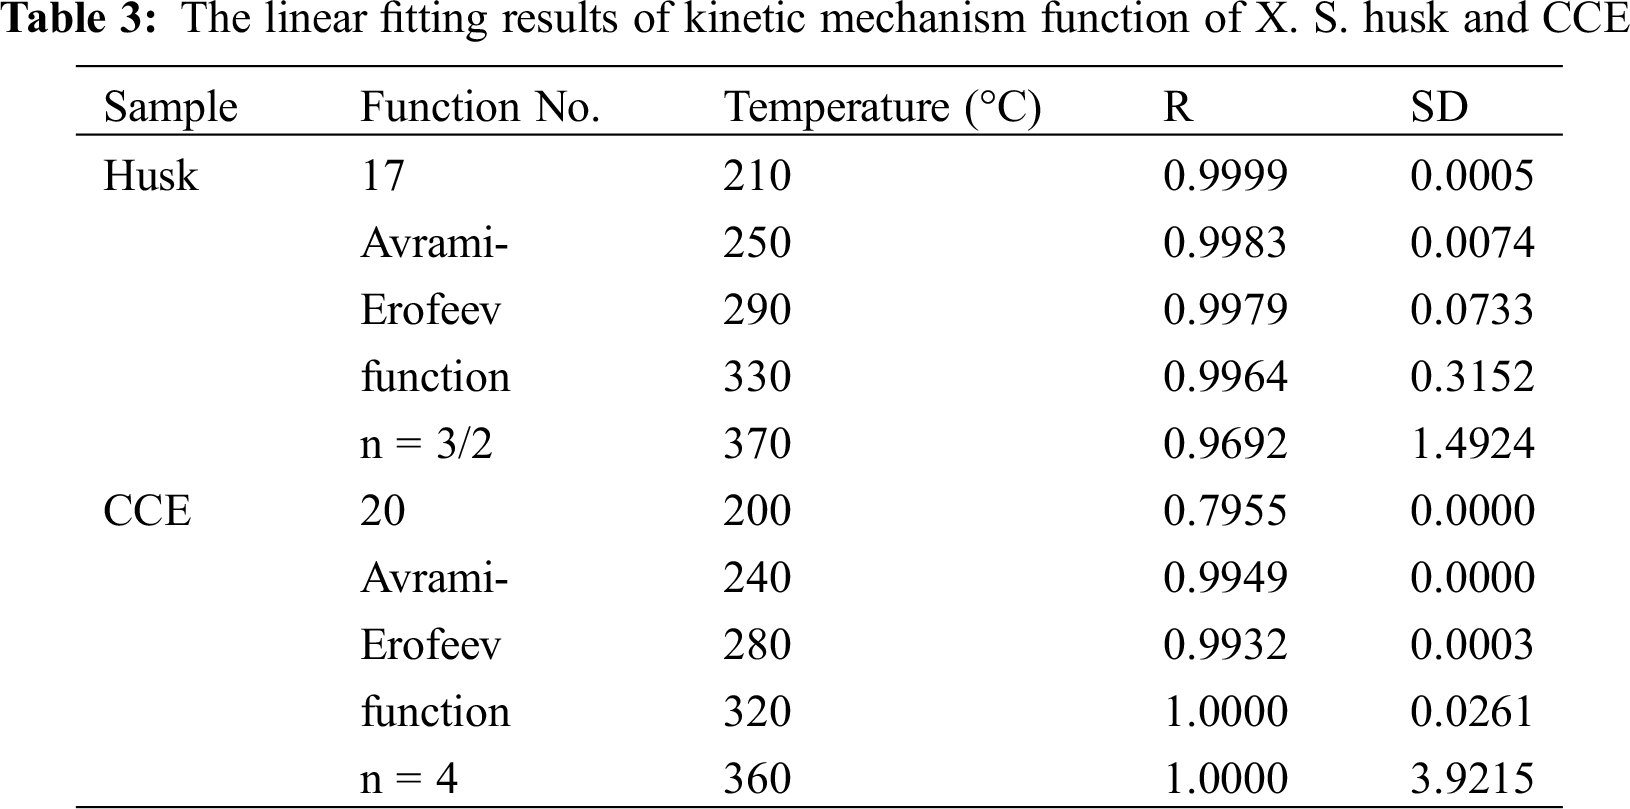
2.4.3 Popescu Method for Calculation Kinetic Parameters
The pyrolytic mechanism can be determined through chosing conversion rates at different temperatures and heating rates. The temperature ranges were applied in Stage II (Tab. 3). Forty-one kinds of mechanisms were analyzed according to Popescu method [17] (Tab. 3). R was the correlation coefficient, the higher the better; and SD was the standard deviation, the lower the better. So the correct mechanism function was the one in which R was at its highest value and SD was at its lowest value. Tab. 3 showed that function 17 Avrami-Erofeev (-[ln (1-α)]1.5) and function 20 Avrami-Erofeev (-[ln(1-α)]4) were the best fits for the pyrolysis of X. S. husk and CCE, respectively. During the main pyrolysis of XSH and CCE, growth after random nucleation were predominant. The reaction order n were 1.5 and 4, respectively.
The determination coefficients in accordance with the linear fittings in Fig. 3, and the values of resultant activation energy were depicted in Tab. 3. Popescu method didn’t use temperature integral function, avoiding the adaptability and compensation effect of Arrhenius equation. So the mechanism function was reliable, and the conclusions was verified using FWO and KAS equations. The curves of lnβ, ln (
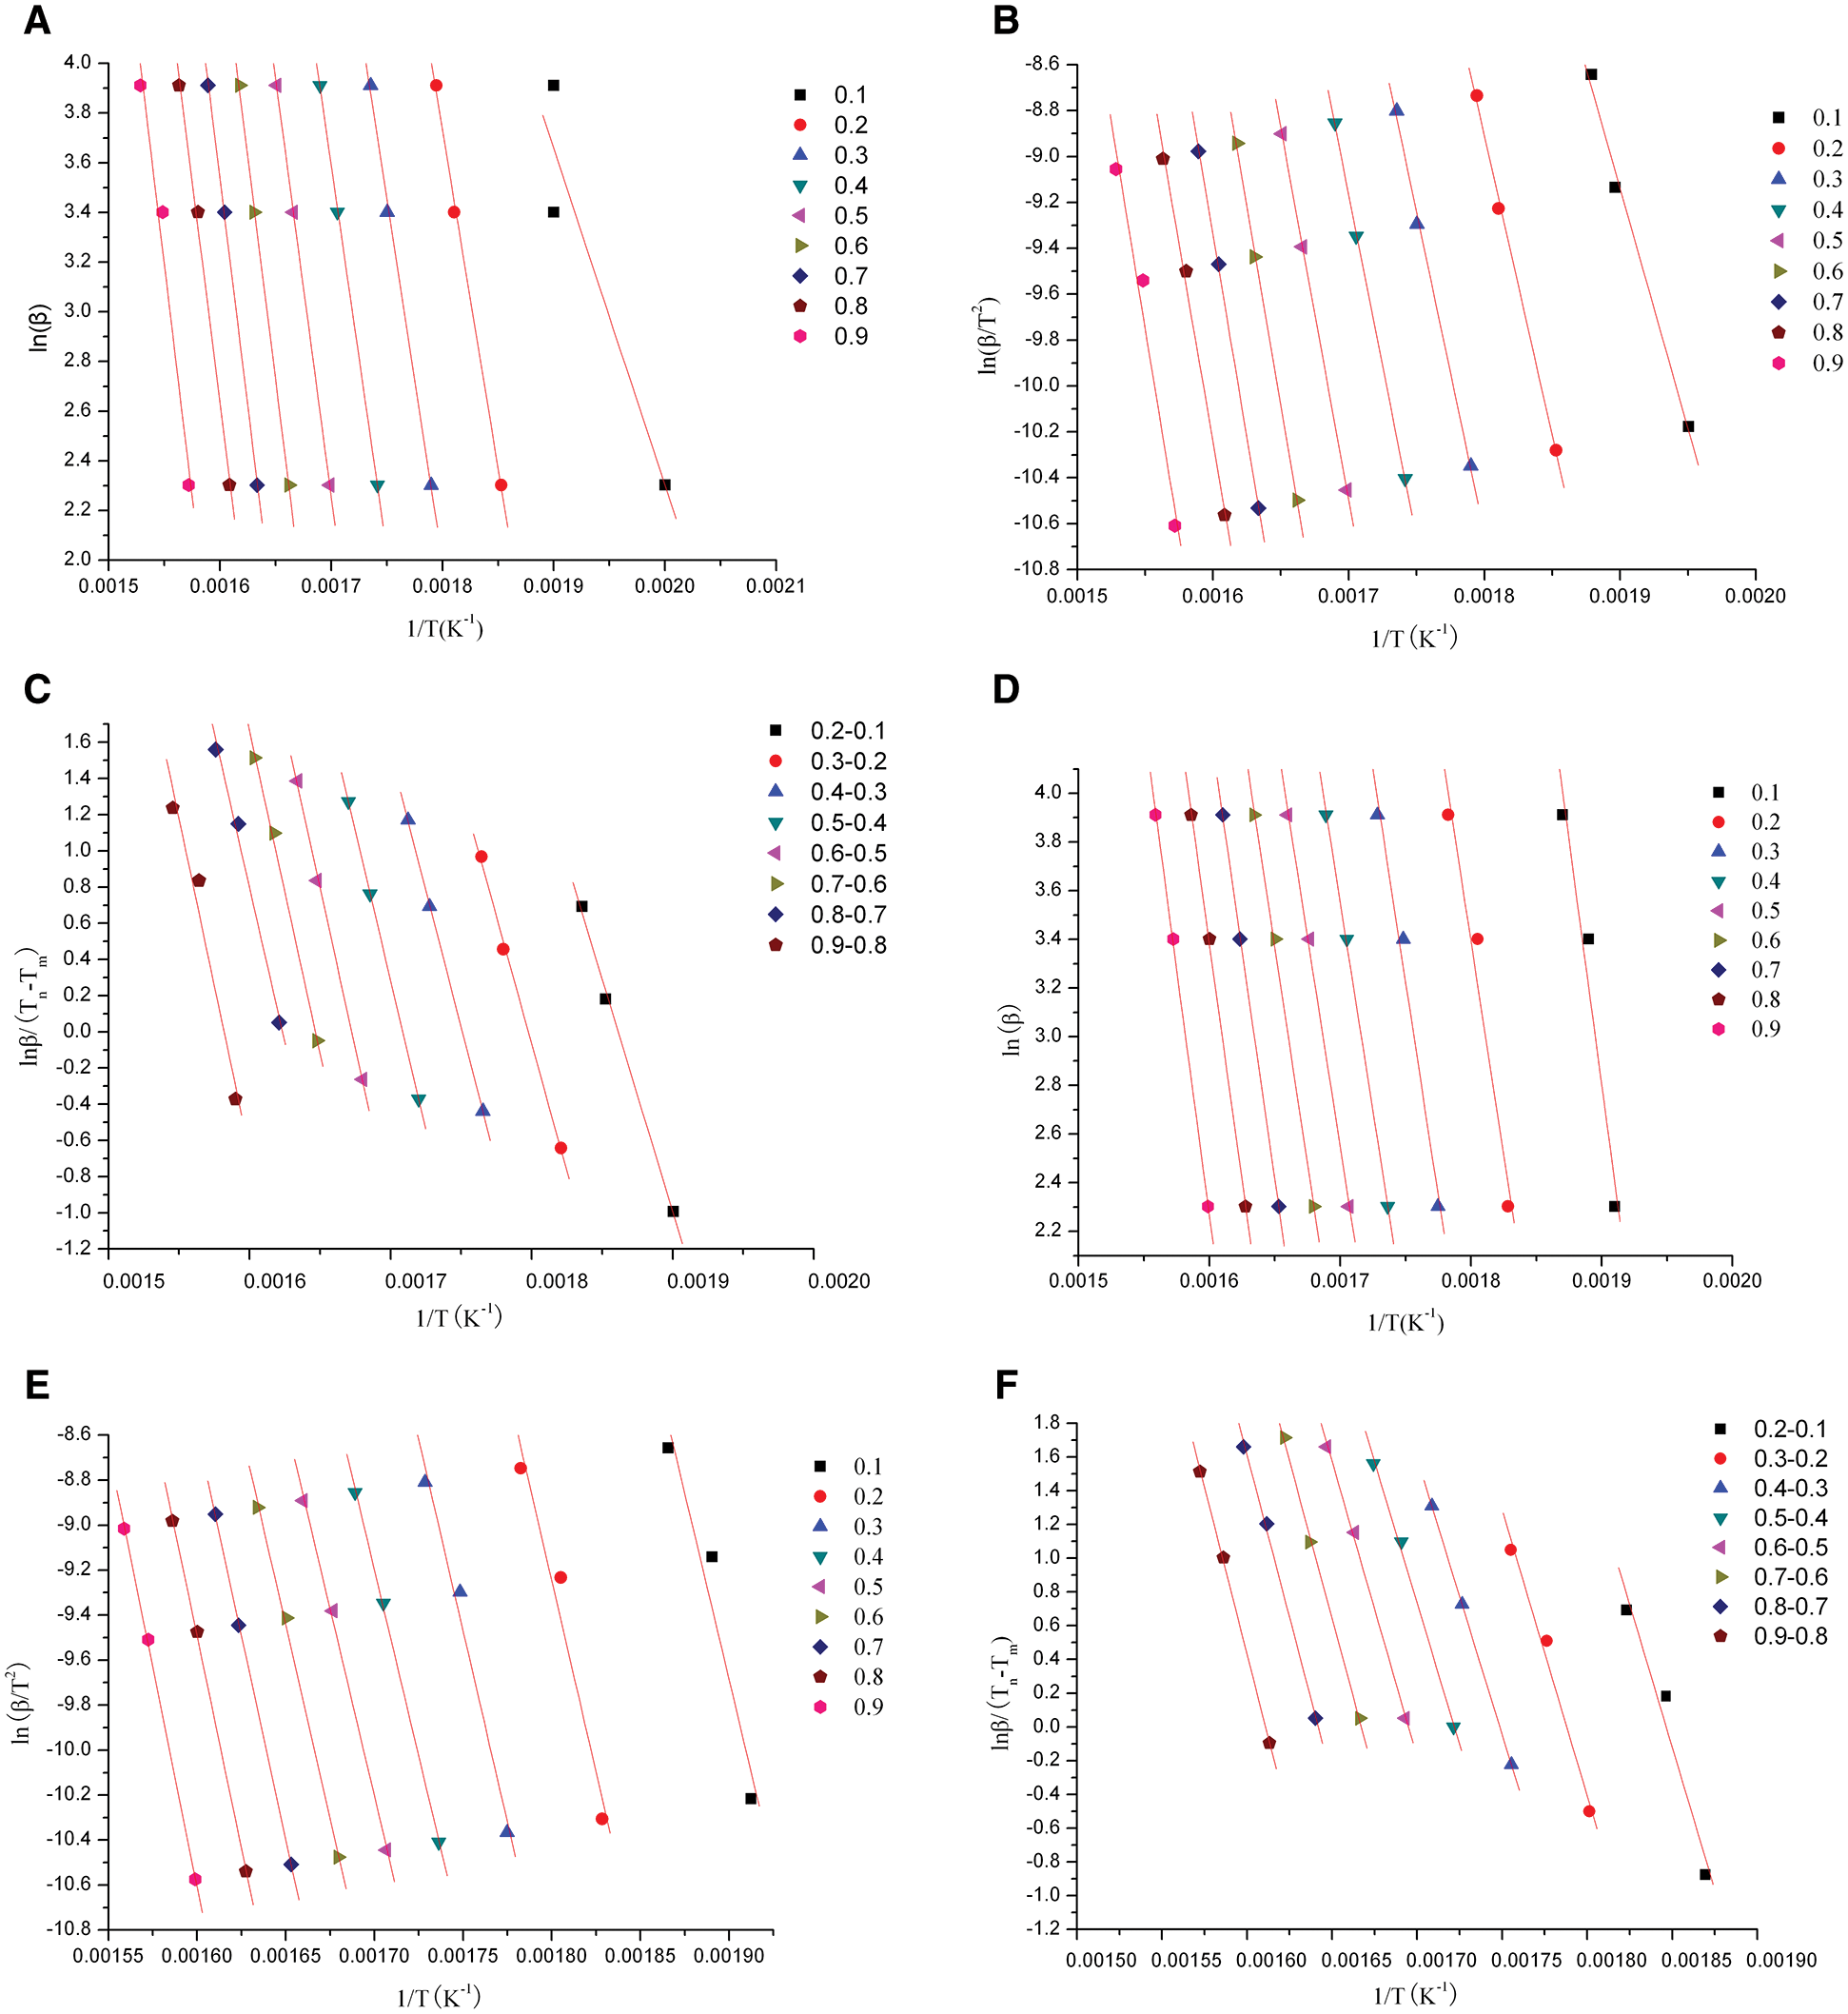
Figure 3: Plots for determining activation energy of X. S. husk and CCE of Stage II. a. XSH plots calculated by FWO; b. XSH plots calculated by KAS; c. XSH plots calculated by Popescu; d. CCE plots calculated by FWO; e. CCE plots calculated by KAS; f. CCE plots calculated by Popescu
The results in Tab. 4 indicated that the activation energy is the minimum energy necessary to initiate a reaction, which was very close to ln A. The correlation factor was between 0.9687 and 1. It indicated that calculations of the activation energies were valid. But in fact, the activation energy has an increasing fluctuation at different conversion rates. This may be ascribed to the complex component present in sample and pyrolysis reactions. The activation energy of XSH was lower than CCE. In any case, the relationship between the activation energy and pre-exponential factor was linear. This phenomenon is called the kinetic compensation effect. It means that an increase in A offset an increase in E. It will slow down the reaction rate at a certain temperature point [17].
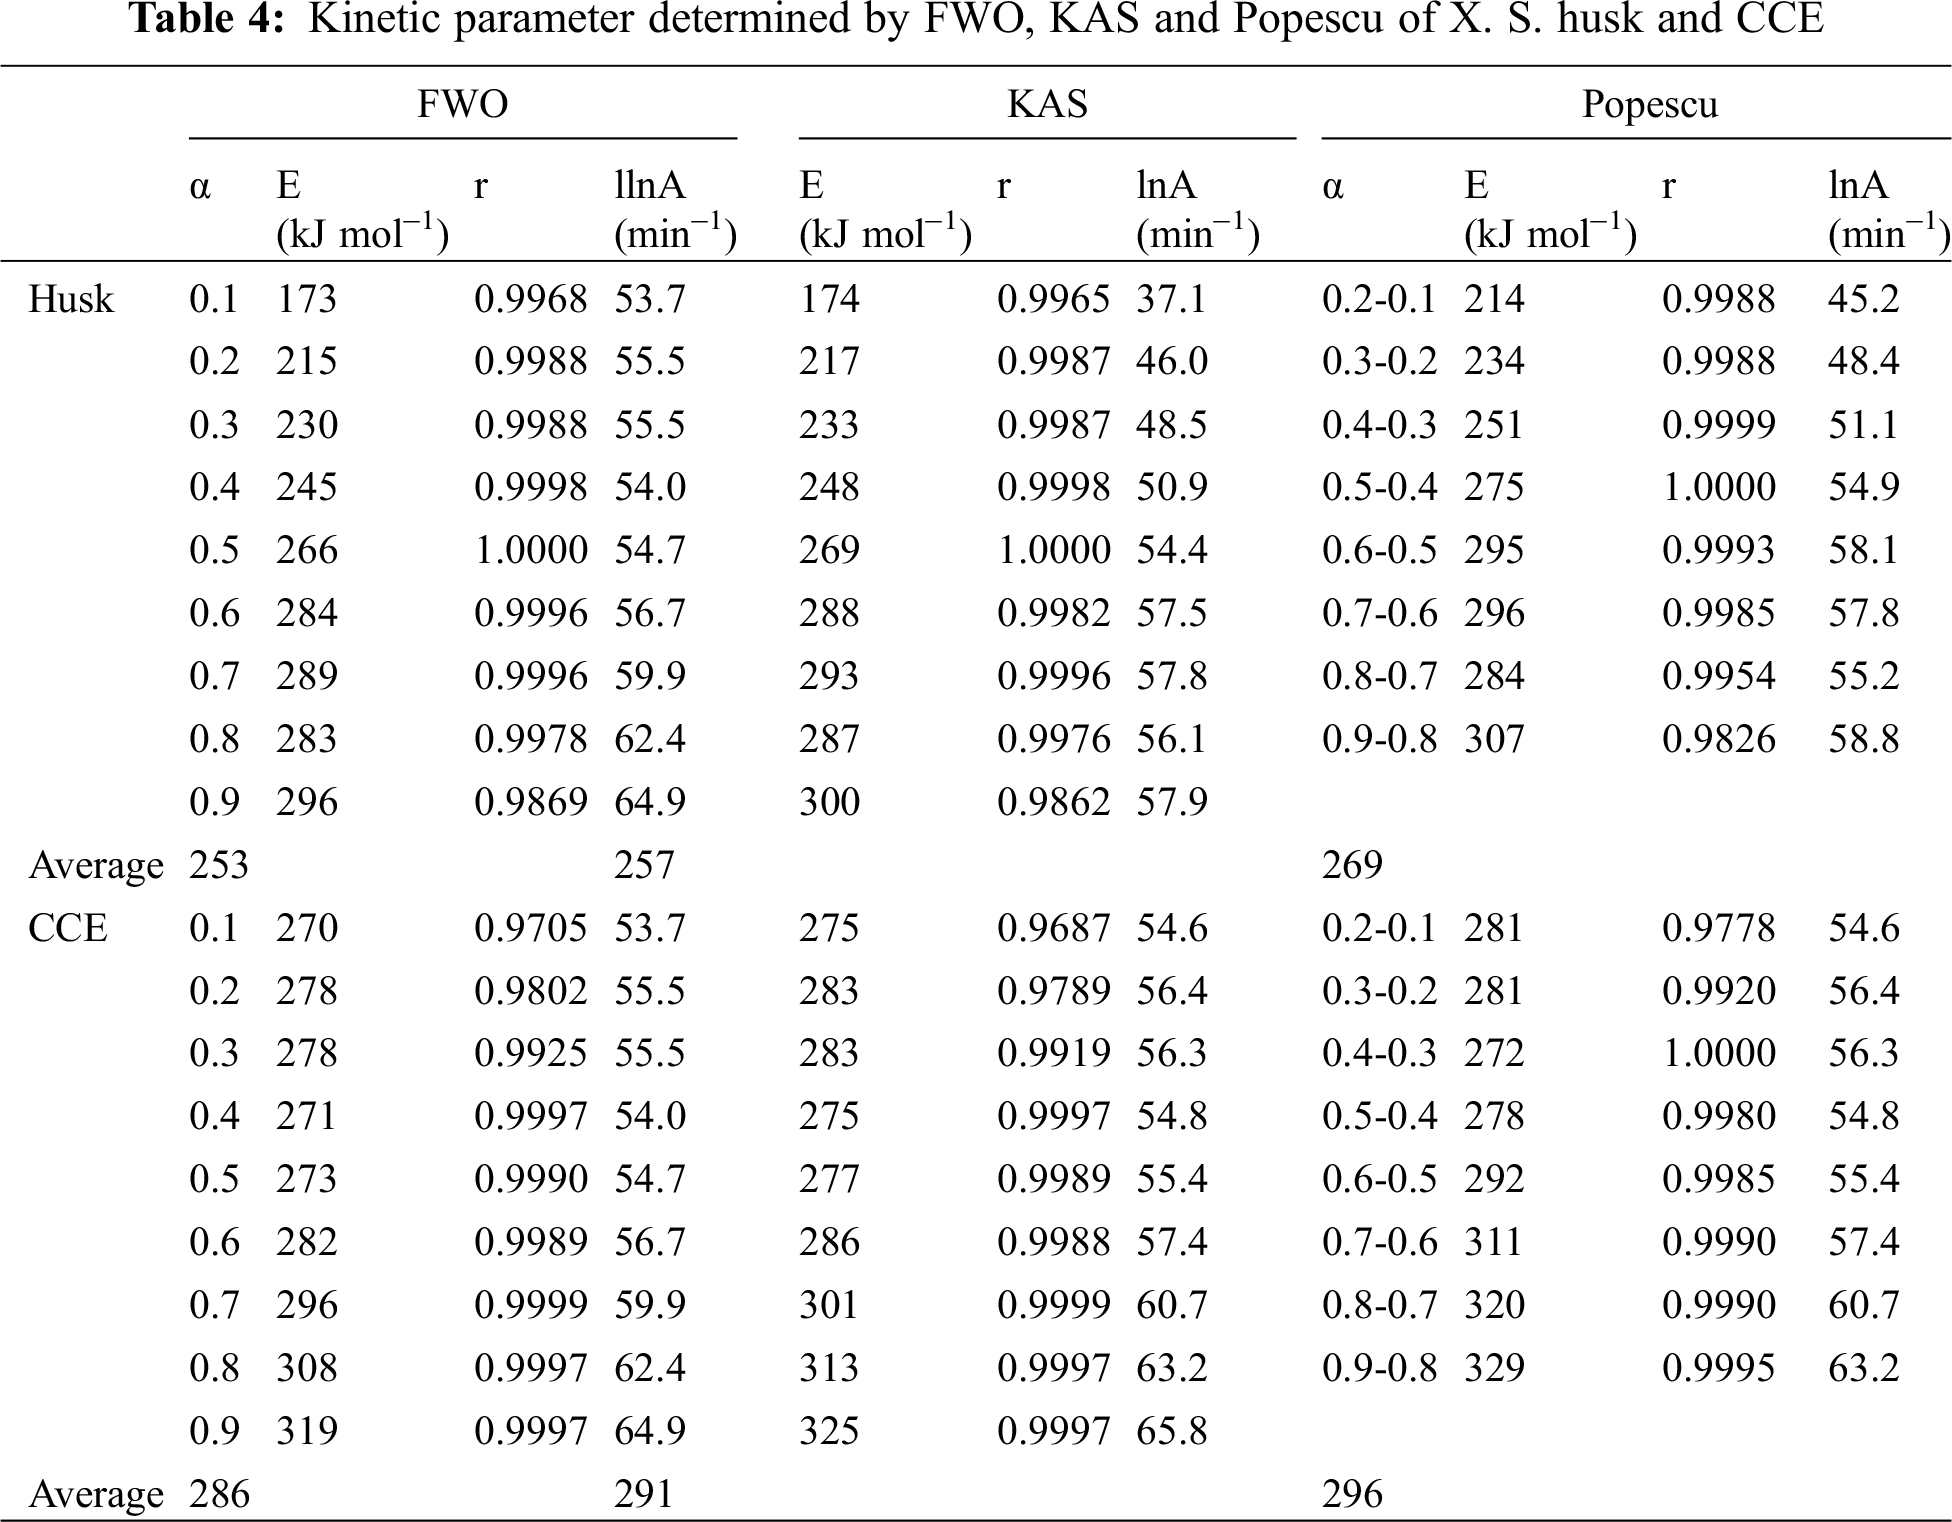
The CCE showed a constant activation energy value at the conversion rate of 10-60%, however, the activation energy increased with the increasing conversion rate for XSH. It means that the activation energy of the CCE was controlled by the slowest step of a multi-step process or it was a one-step reaction. On the other hand, XSH showed a multi-step pyrolysis process due to its component. The pyrolysis of cellulose has been reported to be a multi-step decomposition process by Abidi [18]. It is generally believed that cellulose thermal decomposition can follow complex reaction pathways.
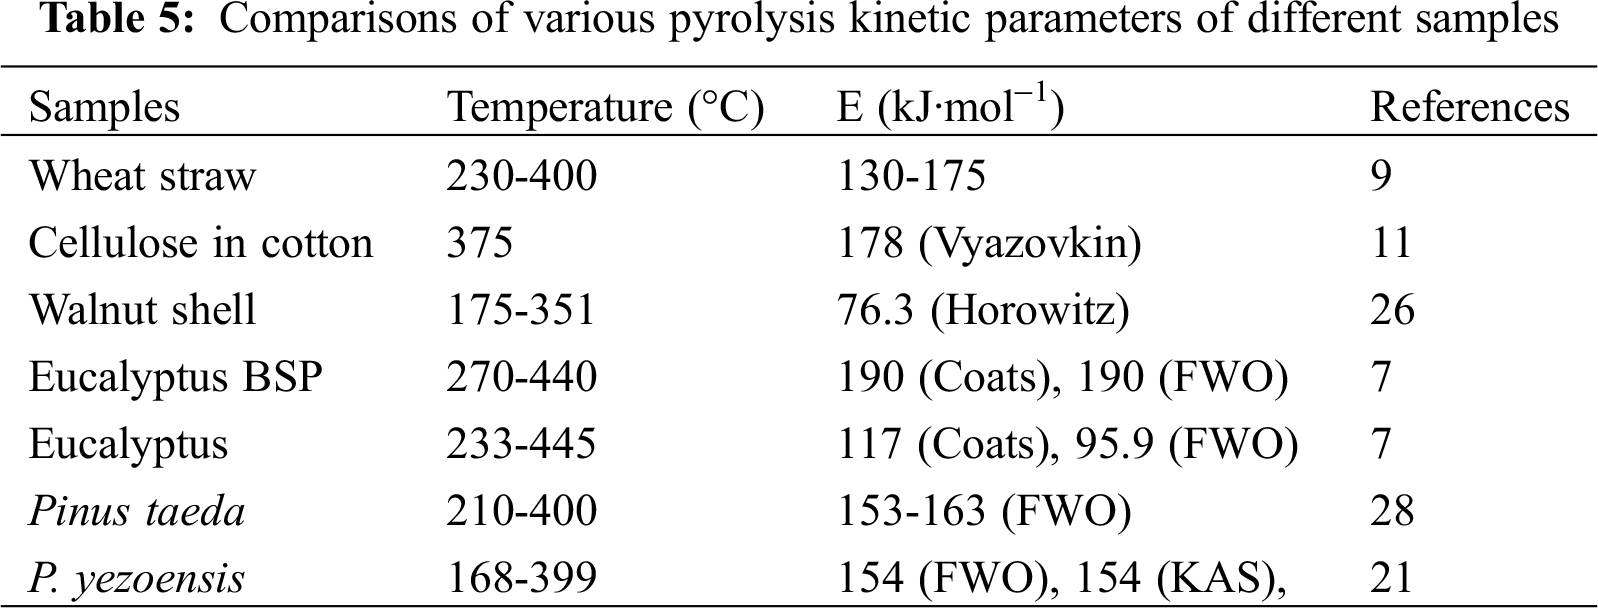
In Tab. 5, the pyrolysis kinetic parameters of various samples were compared. These are not similar to that presented in our paper, suggesting that the pyrolysis was greatly affected by the sample.
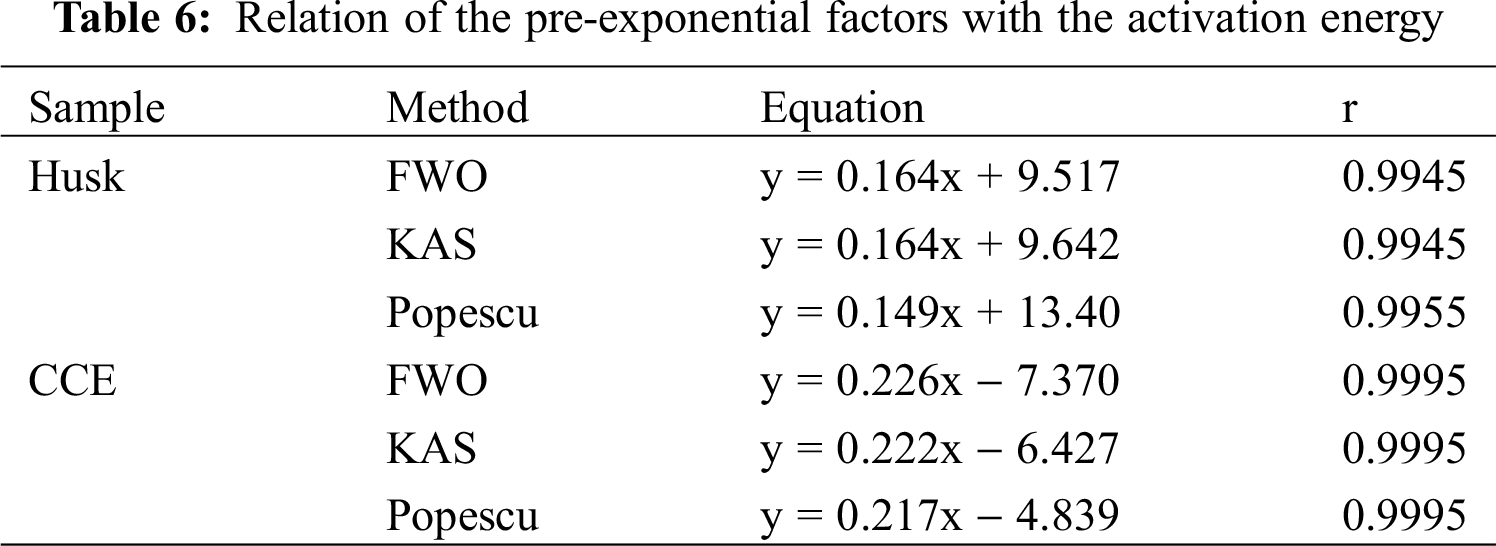
Tab. 6 showed the relation of pre-exponential factors with activation energy. It indicated that when E changed, there was partial compensation for A.
(1) Pyrolytic process of XSH and CCE occured in three stages. Heating rate had an important effect on the pyrolysis.
(2) During the primary decomposition reactions, XSH and CCE showed a reaction mechanism of random nucleation followed by growth, with reaction order of 1.5 and 4, respectively. The activation energies computed using different models namely Popescu, FWO and KAS were similar. Results of this paper is helpful for the design of pyrolytic process, especially for husk.
Funding Statement: This study was supported by the Key Research and Development Program of Shandong Province (2019 GNC106084) and the Key Research and Development Program of the Innovation Research Fund of Zhaoyuan Institute of Industrial Technology (9101-220193).
Conflicts of Interest: The authors declare that they have no known competing financial interests or personal relationships that could have appeared to influence the work reported in this paper.
1. Sukarni, S. M., Rifqi, R. (2020). Pyrolytic characteristics and kinetic parameters evaluation of cassava stalks using thermogravimetric analyzer. Key Engineering Materials, 851, 137–141. [Google Scholar]
2. Yang, X., Zhao, Y., Li, R., Wu, Y., Yang, M. (2018). A modifified kinetic analysis method of cellulose pyrolysis based on TG-FTIR technique. Thermochimica Acta, 665, 20–27. [Google Scholar]
3. Ferreira, R., Meireles, C., Assunçao, R., Barrozo, M., Soares, R. (2020). Optimization of the oxidative fast pyrolysis process of sugarcane straw by TGA and DSC analyses. Biomass and Bioenergy, 134, 105456. [Google Scholar]
4. Gao, Z., Li, N., Chen, M., Yi, W. (2019). Comparative Study on the Pyrolysis of cellulose and its model compounds. Fuel Processing Technology, 193, 131–140. [Google Scholar]
5. Zhang, S. P., Chen, T., Xiong, X. Q. (2018). Effect of washing pretreatment with aqueous fraction of Bio-Oil on pyrolysis characteristic of rice husk and preparation of amorphous silica. Waste and Biomass Valorization, 9, 861–869. [Google Scholar]
6. Fan, F. Y., Yang, Z. L., Xing, X. J. (2021). Study on the pyrolysis properties of corn straw by TG-FTIR and TG-GC/MS. Journal of Thermal Analysis and Calorimetry, 143(5), 3783–3791. [Google Scholar]
7. Lee, B. H., Jeong, T. Y., Trinh, V. T., Jeon, C. H. (2021). Thermal degradation of kenaf (Hibiscus Cannabinus L.Impact of torrefaction on pyrolysis kinetics and thermal behavior. Energy Reports, 7, 951–959. [Google Scholar]
8. Konstantinova, N. I., Eremina, T. Y., Kuznetsova, I. N. (2019). Development of fireproof textile materials safe on contact with human skin. Fibre Chemistry, 51(2), 131–134. [Google Scholar]
9. Trovato, V., Teblum, E., Kostikov, Y., Pedrana, A., Rosace, G. (2020). Sol-gel approach to incorporate millimeter-long carbon nanotubes into fabrics for the development of electrical-conductive textiles. Materials Chemistry and Physics, 240, 122218. [Google Scholar]
10. Heo, J. S., Jimi, E., Kim, Y. H., Par, S. K. (2018). Recent progress of textile-based wearable electronics: A comprehensive review of materials, devices, and applications. Small, 14(3), 1703034. [Google Scholar]
11. Nzihou, A., Stanmore, B., Lyczko, N., Minh, D. P. (2019). The catalytic effect of inherent and adsorbed metals on the fast/flashpyrolysis of biomass: A review. Energy, 170, 326–337. [Google Scholar]
12. Li, D. M., Chen, L. M., Zhao, J. S. (2010). Evaluation of the pyrolytic and kinetic characteristics of Enteromorpha prolifera as a source of renewable bio-fuel from the Yellow Sea of China. Chemical Engineering Research and Design, 88, 647–652. [Google Scholar]
13. Vamvuka, D., Kakaras, E., Kastanaki, E., Grammelis, P. (2003). Pyrolysis characteristics and kinetics of biomass residuals mixtures with lignite. Fuel, 82, 1949–1960. [Google Scholar]
14. Wiedemann, H. G., Bayer, G. (1986). Thermo analytical study on ancient materials and light it sheds on the origin of letters and words. Thermochin Acta, 100, 283–314. [Google Scholar]
15. Raveendran, K., Anuradda, G., Kartic, C. K. (1996). Pyrolysis characteristics of biomass and biomass components. Fuel, 75, 987–998. [Google Scholar]
16. He, F., Yi, W. M., Sun, R. F. (2002). Pyrolys is and its kinetics of corn stalk and wheat straw. Trans of the Chinese Society of Agricultural Engineering, 18, 10–13. [Google Scholar]
17. Matheus, P., Juliane, D., Vinícios, P. (2010). Materials produced from plant biomass part I: Evaluation of thermal stability and pyrolysis of wood. Material Research, 13, 375–379. [Google Scholar]
18. Dong, Z. G., Liu, Z. H., Zhang, X. (2020). Pyrolytic characteristics of hemicellulose, cellulose and lignin under CO2 atmosphere. Fuel, 256, 115890. [Google Scholar]
 | This work is licensed under a Creative Commons Attribution 4.0 International License, which permits unrestricted use, distribution, and reproduction in any medium, provided the original work is properly cited. |