| Fluid Dynamics & Materials Processing |
DOI: 10.32604/fdmp.2021.017591
ARTICLE
Numerical and Experimental Study of a Tornado Mixer
Center of Research and Department, WEICHAI Power Co., Ltd., Weifang, 261061, China
*Corresponding Author: Dailong Shi. Email: shidl@weichai.com
Received: 22 May 2021; Accepted: 02 July 2021
Abstract: A new design of a selective catalytic reduction (SCR) mixer called tornado was developed for a heavy-duty diesel engine to solve the urea deposition problem. A combination of CFD simulation and experimental studies was used to comprehensively evaluate the performance of the tornado mixer. According to the numerical simulations, this mixer can improve the front surface flow uniformity of the SCR carrier by 6.67% and the NH3 distribution uniformity by 3.19% compared to a traditional mixer. Similarly, steady state SCR conversion efficiency test results have shown that the tornado mixer can increase the average SCR conversion efficiency by 1.73% compared to a traditional mixer. Therefore, the tornado mixer outperforms traditional mixers in terms of mixing uniformity, resistance to deposition and impact on NOX emissions. In addition, a dimensionless parameter, the “limiting deviation rate”, is proposed in the present study to improve the mixing uniformity assessment method for SCR mixers (with the explicit intent to evaluate the mixing uniformity more accurately).
Keywords: Diesel engine aftertreatment; SCR mixer; urea deposition; CFD simulation; experimental verification
Currently, SCR systems based on aqueous urea solutions (urea mass fraction of 32.5%) are widely used for NOX emission control in diesel engines [1]. It is well known that the more efficient the combustion process, the more NOX the engine will emit. The introduction of SCR technology has enabled engine manufacturers to solve the trade-off between NOX emission and combustion efficiency. SCR technology achieves NOX emission control by injecting an aqueous urea solution into the high temperature exhaust gas, causing it to evaporate and decompose to produce NH3, which reduces NOX to N2 and H2O.
However, the application of urea-SCR systems poses many challenges. Transient operating conditions, large urea injection or poor mixer construction design can cause incomplete evaporation of the aqueous urea solution, forming a “permanent” liquid film on the mixer wall or exhaust pipe wall [2–7]. The decomposition of the urea in the liquid film produces solid by-products such as Biuret, Cyanuric acid, etc., in addition to the reducing agent NH3 required for the reduction reaction [8–12]. As these solid by-products continue to accumulate, the SCR system exhaust back pressure rises and the uniformity of NH3 on the front surface of the carrier decreases, eventually leading to SCR system failure.
Studies have shown that the SCR mixer structure is one of the key factors affecting the deposit formation [13–17]. In order to solve the urea crystallisation problem that occurs during the application of SCR technology, this paper takes a heavy-duty diesel engine aftertreatment system of the sixth emission stage in China as the research object, and carries out a new structural design of its SCR mixer, using a combination of simulation and experimental studies to make a comprehensive assessment of the new mixer’s anti-deposition performance, mixing uniformity and impact on emissions.
2 Simulation Model Setup and Validation
The aqueous urea solution undergoes two atomisation processes during the spraying process: primary atomisation and secondary atomisation. Primary atomisation is the process whereby the aqueous urea solution is forced under high pressure through the nozzle injection holes, resulting in the droplets becoming a fine mist. During this process, the urea solution forms turbulence in the spray holes of the nozzle, which causes an initial disturbance on the spray surface as it leaves the spray holes. The interaction between the spray and the surrounding gas increases the amplitude of the disturbance until it separates from the spray surface. These separated parts can lead to so-called “secondary droplets”. The amplitude of the disturbance follows the dissipation equation derived from Taylor [18].
where
Assuming that the urea droplet has a diameter of
where
Secondary atomisation of aqueous urea solutions, i.e., secondary fragmentation, is the fragmentation of liquid droplets by non-uniform surface forces. The characteristic metrics for this process are the Weber number and the Onetzog number.
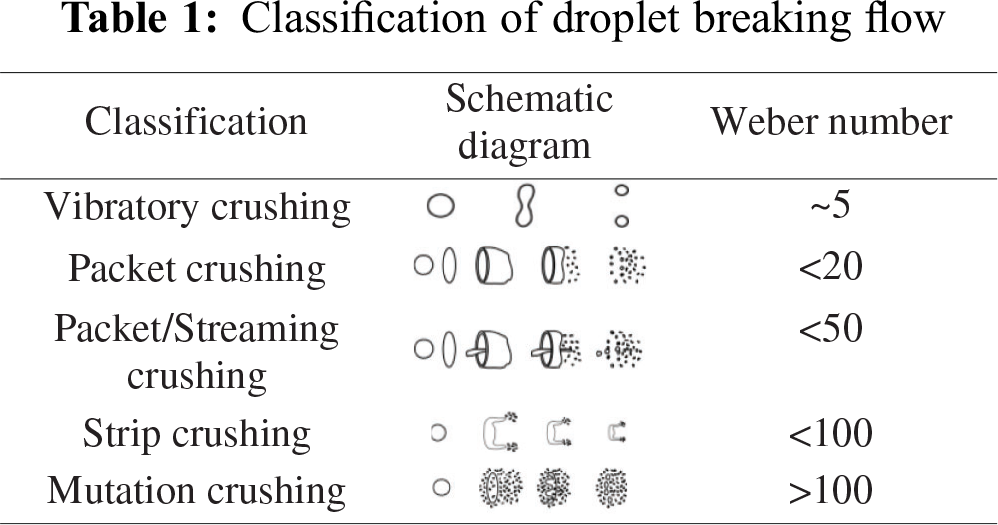
The various broken flow regimes of droplets are classified according to the amplitude of surface tension and viscous drag [19], as shown in Tab. 1.
The governing equations of fluid flow can be written as: Continuity equation:
where, t is time, V is volume, a is the area vector, ρ is the density, v is the velocity,
Momentum equation:
where,
Energy equation:
where, E is the total energy, H is the total enthalpy, q is the heat flux. This equation represents the rate of increase of energy in the micro-element equal to the net heat flux into the micro-element plus the work done on the micro-element by the bulk and surface forces.
The aftertreatment system of a heavy-duty diesel engine is used as the object of study (shown in Fig. 1), and the pre-processing software Hypermesh 14.0 is used for fluid domain extraction, geometric cleaning and surface meshing.
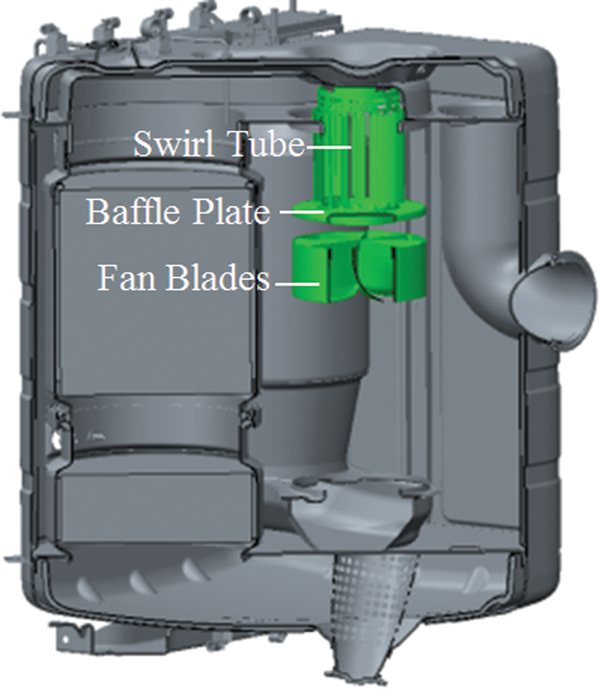
Figure 1: Aftertreatment system and SCR mixer for a heavy duty diesel engine
The 3D fluid simulation software STAR-CCM+14.02 was used for surface mesh reconstruction, volume meshing and numerical calculation. Surface Remesher was chosen for the surface reconstruction, Polyhedral mesher for the volume mesh, Prism Layer Mesher for the boundary layer mesh, Extruder for the carrier mesh, and a mesh base size of 6 mm. the volume mesh is shown in Fig. 2.
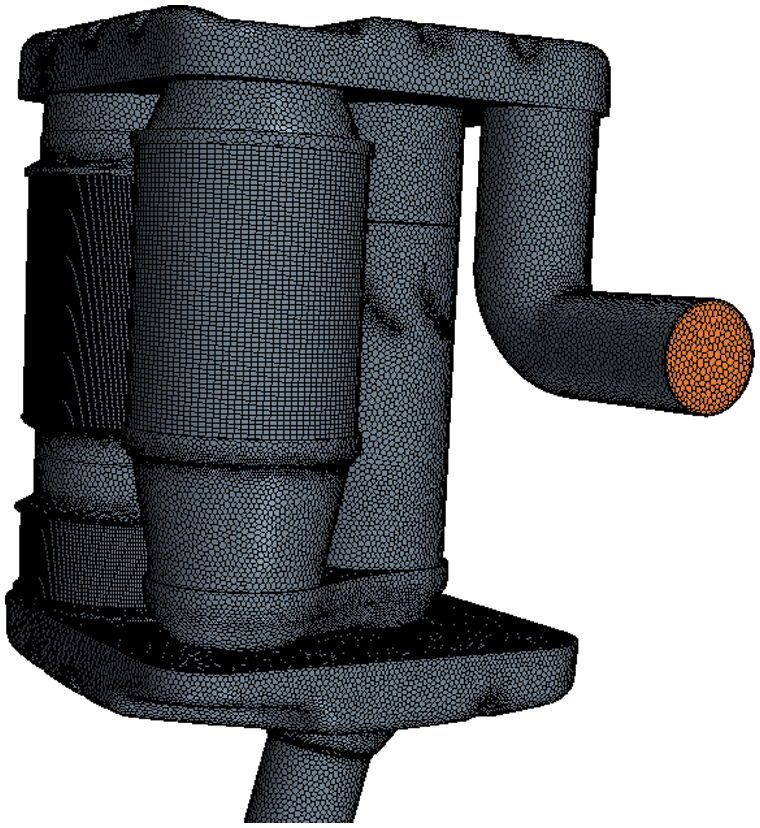
Figure 2: Volume mesh for the aftertreatment system
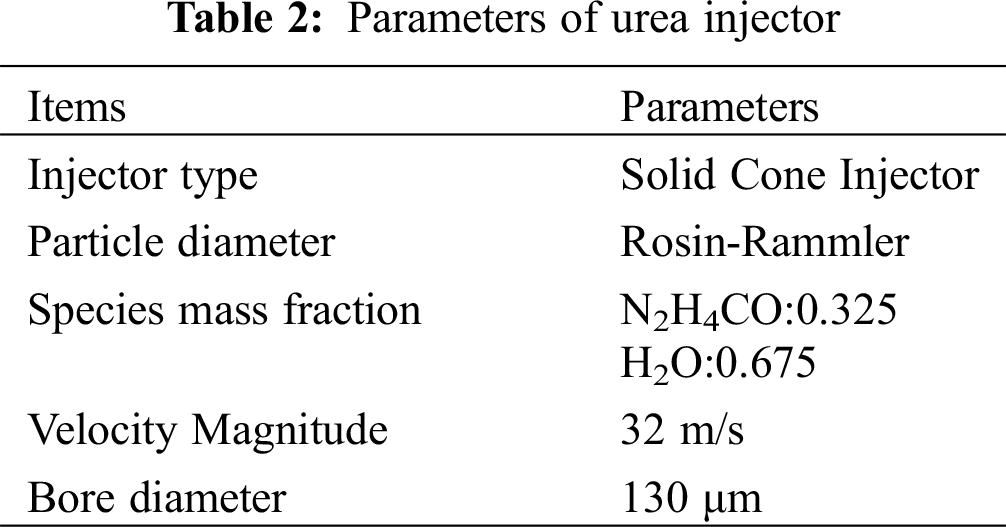
The transfer equation is solved by the PISO method through the second order accuracy finite volume method [20,21]. A Rosin-Rammler distribution with a distribution factor of 5.3 was used for the droplet size. Due to the low urea injection velocity (only 32 m/s), the droplet interactions are not considered in this paper and only the droplet secondary breakup is considered, which is simulated using the TAV (Talor Analogy Breakup) model. The turbulence is simulated by the RNG k-ε RANS model. The outcomes of liquid droplets impacting the wall boundary or fluid film are predicted by the Bai-Gosman model.
Lagrangian Multiphase model was selected for aqueous urea solution injection, and Bai-Gosman Wall Impingement model and Reitz-Diwakar Droplet Breakup model were selected for Droplet Wall Impingement and breakage. Parameters of urea nozzle are shown in the Tab. 2.
Confirmation of operating points for simulation calculations: As urea-SCR aftertreatment is more likely to form deposits at lower exhaust flow rates and temperatures, a low load operating point with lower exhaust flow rates and temperatures (exhaust flow rate of 950 kg/h, exhaust temperature of 240°C and urea injection rate of 700 mg/s) was selected for the assessment of the risk of urea deposit formation. The rated operating point of the engine (exhaust flow rate of 1735 kg/h and exhaust temperature of 555°C) was selected for the back pressure calculation of the aftertreatment system.
Tab. 3 shows the comparison of the pressure loss of the post-treatment system at different operating points with a base grid size of 4 mm (minimum grid size of 1 mm) and 6 mm (minimum grid size of 1.5 mm), respectively. As can be seen from the table, the pressure loss of the aftertreatment system is basically the same for both mesh sizes, indicating that the model basically eliminates the influence of the mesh size on the simulation results, i.e., it proves the irrelevance of the mesh.
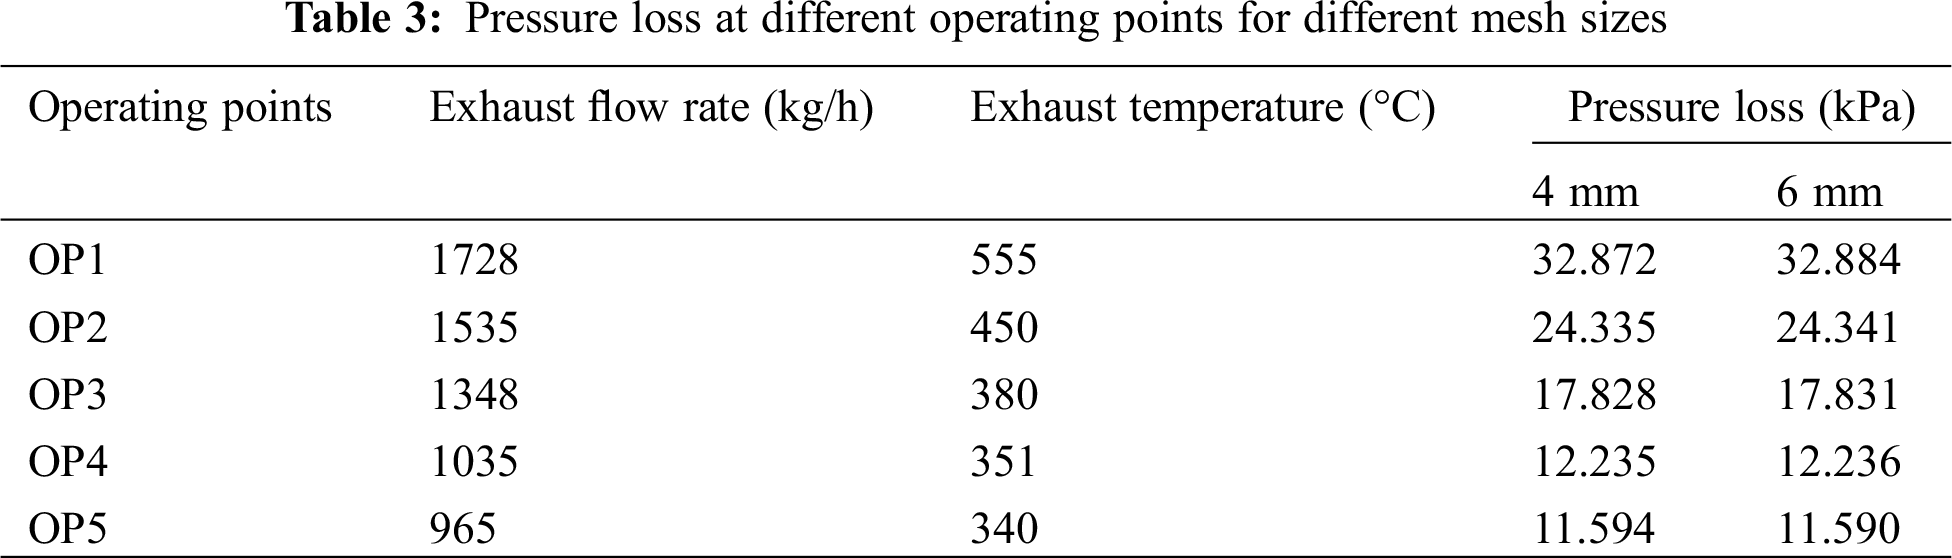
Fig. 3a shows the urea deposition on the wall of the mixer calculated at a low load operating point with low exhaust flow and temperature, and Fig. 3b shows the deposition on the mixer under the engine bench urea deposit cycle. As can be seen from the graphs, the more concentrated areas of urea deposition obtained from the simulation match the actual urea deposition areas in the test, indicating that the model is highly accurate in assessing the risk of urea deposition.
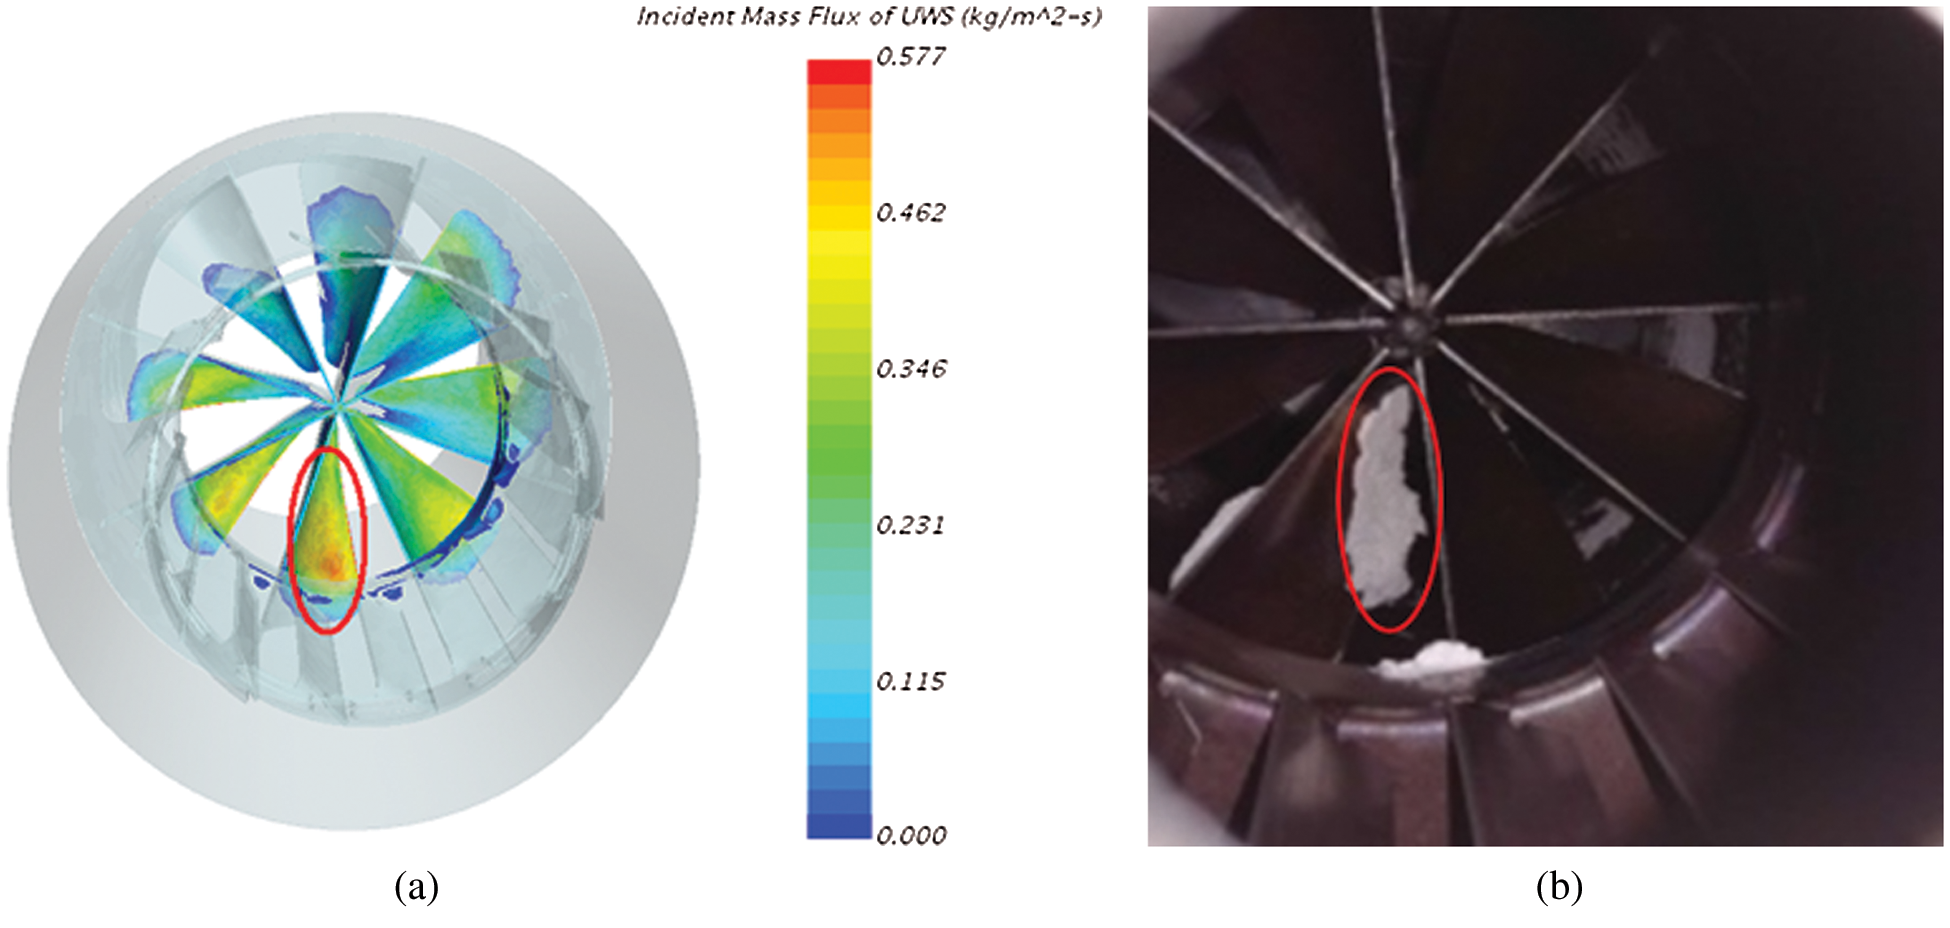
Figure 3: Validation of simulation results (a) Simulation result (b) Test result
3 Mixer Design for the Aftertreatment of a Heavy-Duty Diesel Engine
Equations and mathematical expressions must be inserted into the main text. Two different types of styles can be used for equations and mathematical expressions. They are: in-line style, and display style.
The overall arrangement of the traditional mixer on the post-treatment assembly is shown in Fig. 1. The mixer consists mainly of a swirl tube, baffle plate and fan blades, where the blades of the swirl tube and the fan blades are in opposite directions.
Fig. 3b shows the urea deposition of a traditional mixer under the engine bench urea deposition cycle. As can be seen from the photograph, heavy urea deposits appear on the surface of the fan blades. After the engine exhaust gas enters the mixer, part of the airflow rotates downwards under the action of the swirl plate and part of the airflow flows straight downwards through the channel between the swirl plates. Due to the low engine exhaust gas flow and temperature at the low load operating point, the urea deposited on the fan blades cannot be stripped and evaporated and decomposed in time, and urea deposits are eventually formed.
A new tornado mixer has been designed to solve the urea deposition problem. The mixer mainly consists of a porous swirl tube, a bottom plate and a porous plate, where the swirl tube is partially open. The main function of the cyclone tube is to rotate the exhaust gas at high speed, stripping the urea droplets deposited on the wall of the mixer and wrapping them to rotate and evaporate, ultimately reducing the risk of urea deposition. The main function of the bottom plate is to force the gas stream to rotate around the tube axis. The purpose of the perforated bottom plate is to allow a small portion of the gas stream to flow straight out, reducing the exhaust back pressure. The role of the porous plate is to increase the velocity and NH3 distribution uniformity on the front surface of the SCR carrier. The overall layout of the Tornado mixer in the aftertreatment package structure is shown in Fig. 4.
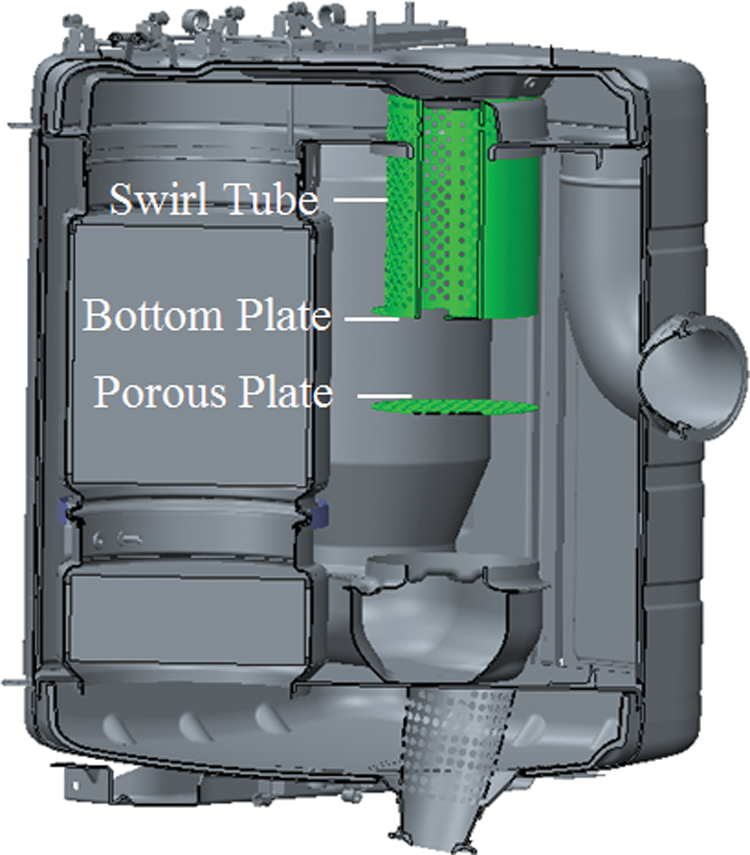
Figure 4: Overall layout of the tornado mixer
4 Simulation and Analysis of Results
To verify the mixing uniformity, resistance to urea deposition and flow performance of the Tornado mixer, CFD simulations were carried out for an aftertreatment system fitted with a traditional mixer (hereinafter referred to as the “traditional structure”) and for an aftertreatment system fitted with a Tornado mixer (hereinafter referred to as the “Tornado structure”).
In order to assess the mixing uniformity of the tornado mixer more accurately, a dimensionless parameter, the “limiting deviation rate”, is proposed, as shown in Eqs. (8) and (9). The limiting deviation rate is divided into the flow distribution limiting deviation rate and the NH3 distribution limiting deviation rate. The flow distribution limiting deviation rate is the deviation rate of the maximum value of velocity from the mean value and the deviation rate of the minimum value of velocity from the mean value for all mesh cells of a certain section; the NH3 distribution limiting deviation rate is the deviation rate of the maximum value of NH3 concentration from the mean value and the deviation rate of the minimum value of NH3 concentration from the mean value for all mesh cells of a certain section.
For the flow distribution, the limiting deviation rate of the flow distribution is defined as,
where,
For the NH3 distribution, the limiting deviation rate of the NH3 distribution is defined as,
where,
Flow uniformity is evaluated by the velocity distribution uniformity index, which is defined as [22].
where,
The velocity uniformity on the front face of the SCR carrier was evaluated, and the axial component of the velocity on the front face of the SCR carrier was selected.
The simulation results of the flow uniformity are shown in Fig. 5. The flow uniformity index at the front face of the SCR carrier for the traditional structure and the Tornado structure are 0.90 and 0.96, respectively. The flow uniformity on the front surface of the SCR carrier for the Tornado structure is 6.67% higher than that of the traditional structure.
Figure 5: Flow distribution on the front surface of the SCR carrier (a) Traditional structure (b) Tornado structure
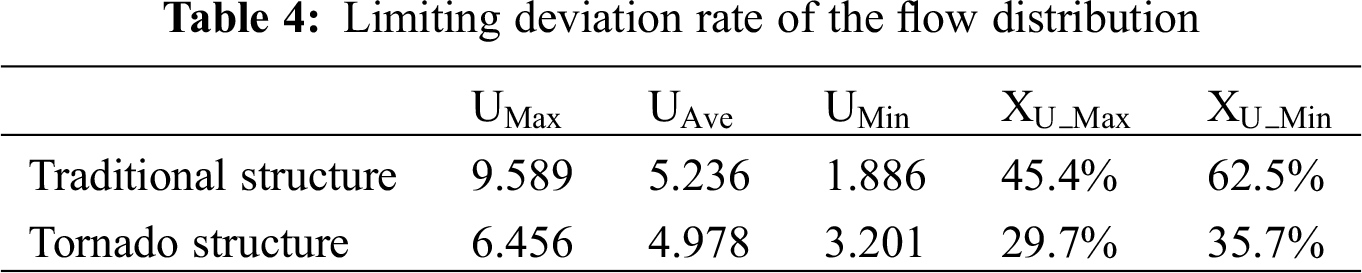
The flow distribution limiting deviation rate on the front surface of SCR carriers of the traditional and tornado structures are shown in Tab. 4. As can be seen from the table, the flow distribution limiting deviation rate on the front face of the SCR carrier with the Tornado structure are lower than that of the traditional structure.
4.1.2 NH3 Distribution Uniformity
NH3 distribution uniformity is evaluated by the NH3 distribution uniformity index, which is defined as [22].
where,
The simulation results of NH3 distribution uniformity are shown in Fig. 6. The NH3 distribution uniformity indexes on the front surface of the SCR carrier for the traditional structure and the tornado structure are 0.94 and 0.97, respectively, and the NH3 distribution uniformity on the front surface of the SCR carrier for the tornado structure is 3.19% higher than that of the traditional structure.
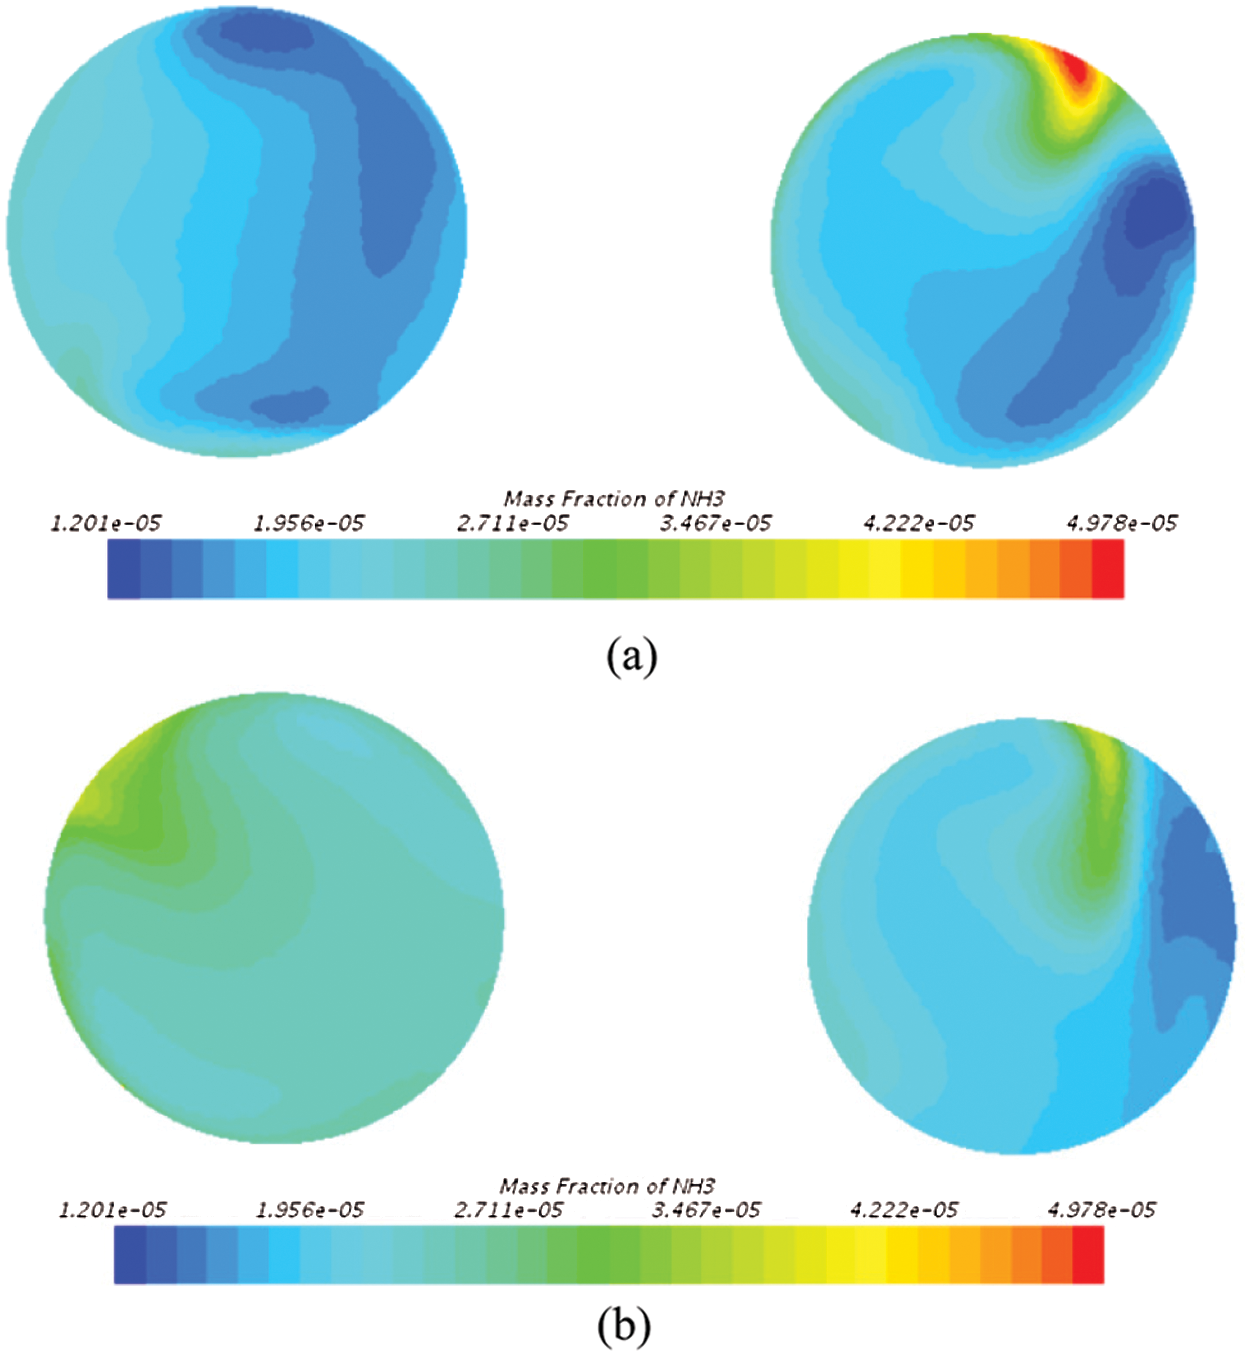
Figure 6: NH3 distribution on the front surface of the SCR carrier (a) Traditional structure (b) Tornado structure
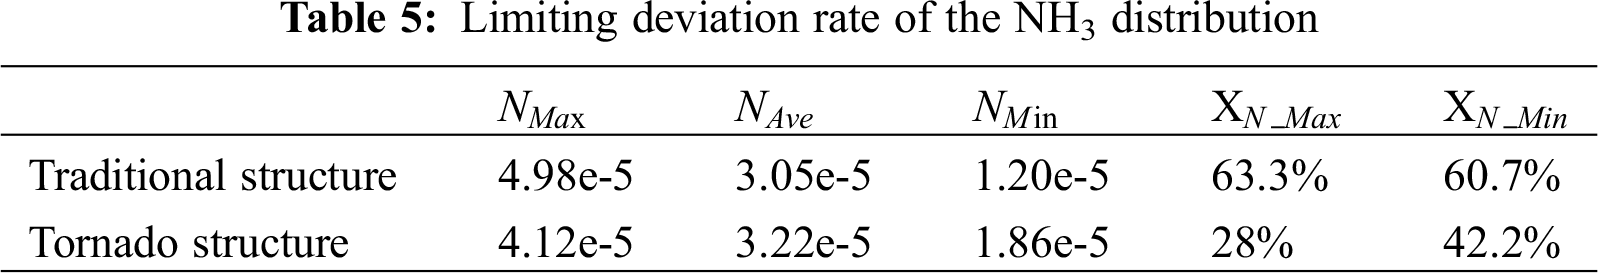
The limiting deviation rates of the NH3 concentration distribution on the front surface of the SCR carriers of the traditional and tornado structures are shown in Tab. 5. As can be seen from the table, the limiting deviation rate of NH3 distribution on the front surface of the SCR carrier of the Tornado structure is lower than that of the traditional structure.
4.2 Risk Assessment of Urea Deposition
The risk of urea deposition can be assessed by the amount of urea deposited on the wall of the mixer. Fig. 7 shows the distribution of urea deposition on the wall of the traditional mixer and the tornado mixer. As can be seen from the graph, the amount of urea deposited on the wall of the tornado mixer is significantly lower compared to the traditional mixer. The main reason for this is that when the engine exhaust gas flows through the Tornado mixer, it rotates at high speed under the action of the porous swirl tube and bottom plate, wrapping and rotating the urea droplets sprayed in above the mixer and flowing downwards, prompting them to evaporate and decompose quickly. At the same time, the high velocity of the flow allows the urea droplets deposited on the walls of the mixer to be stripped away and then evaporated and decomposed, ultimately effectively reducing the risk of urea deposits.
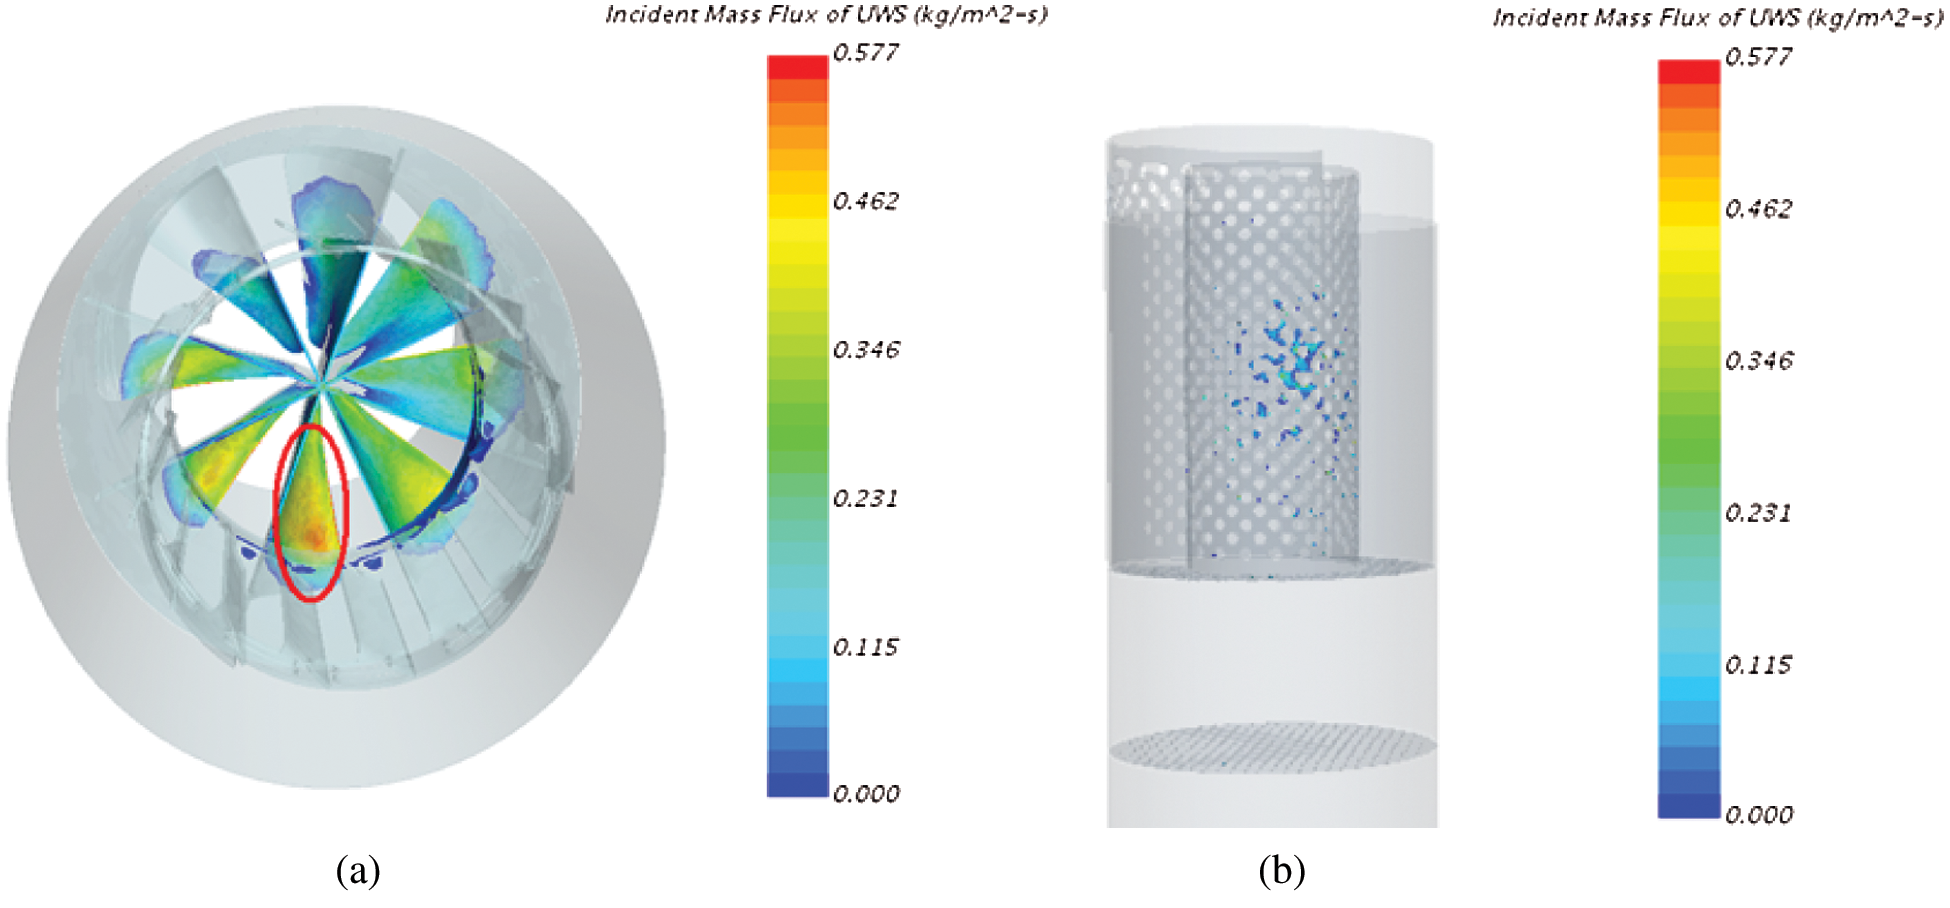
Figure 7: Distribution of urea deposits on the wall of the mixer (a) Traditional structure (b) Tornado structure
The pressure field distributions for the traditional and tornado structures at the rated operating condition are shown in Fig. 8. The total system back pressures for the traditional and tornado structures at the rated operating condition are 32.9 kPa and 34.2 kPa. The tornado structure has a higher system back pressure than the traditional structure by approximately 1.3 kPa, but still meets the engineering limits (<35 kPa).
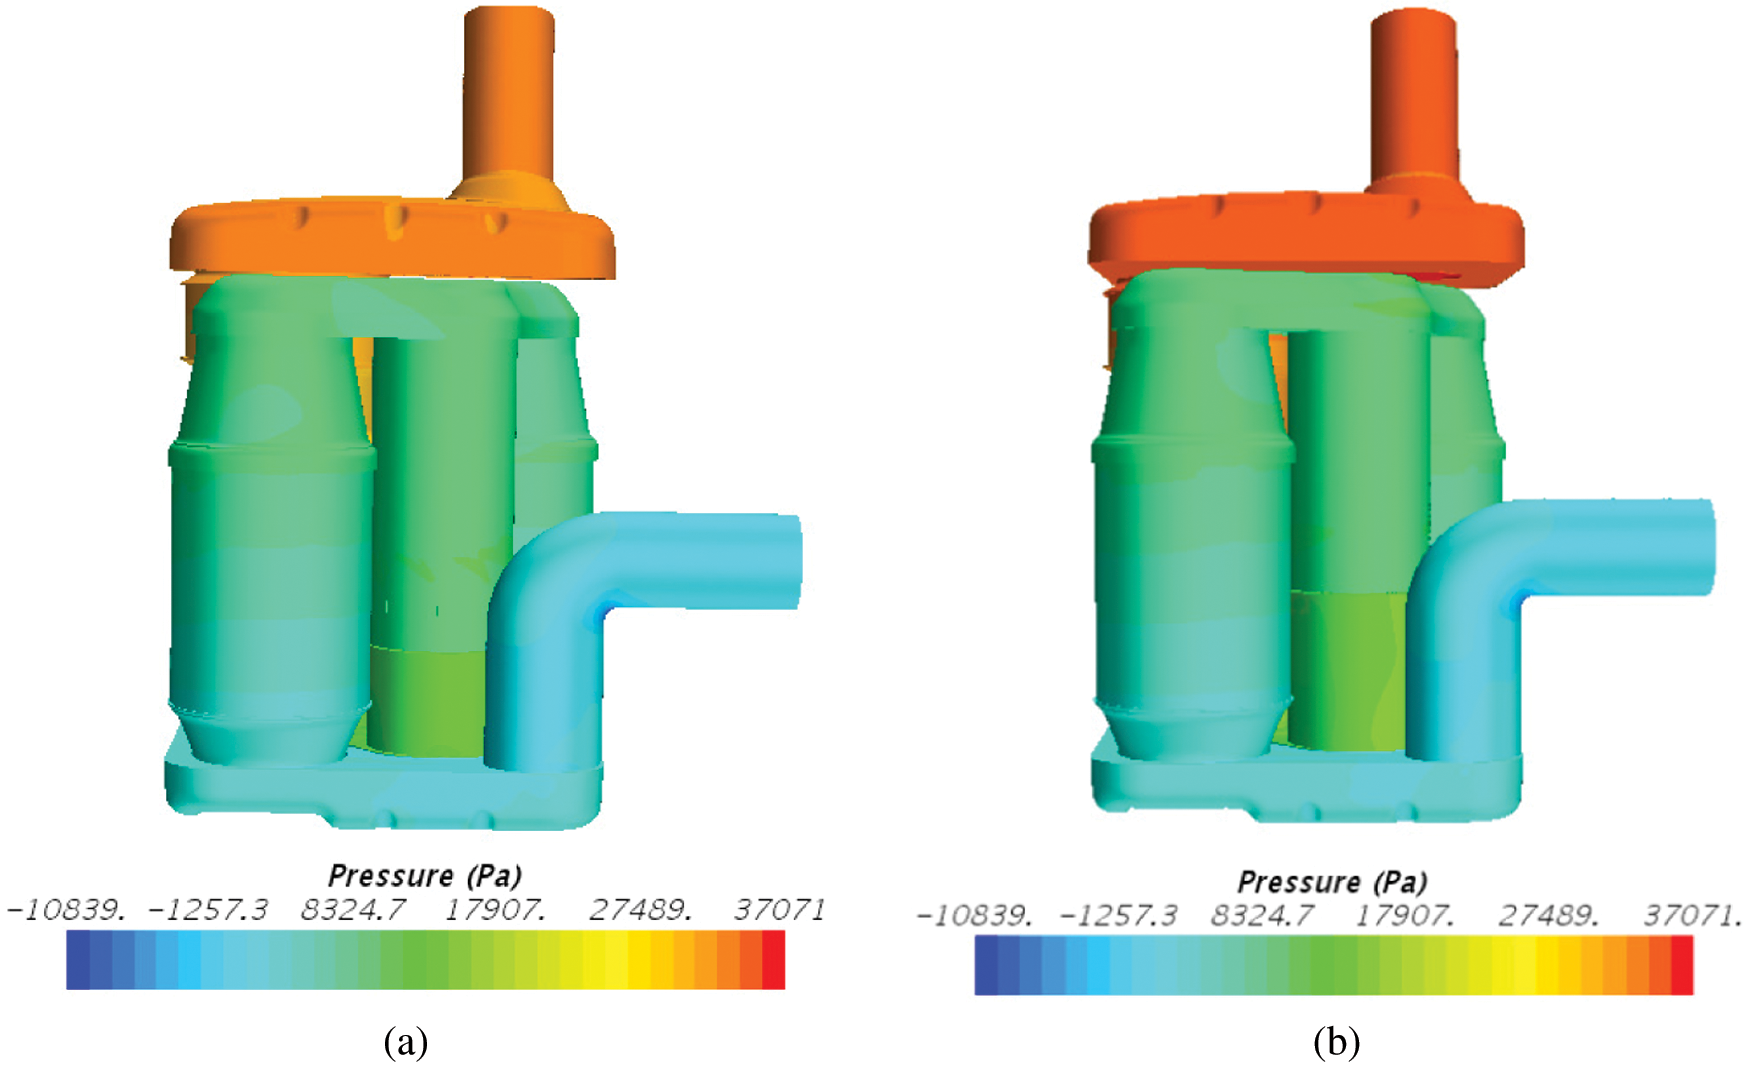
Figure 8: Comparison of back pressure between the two structures (a) Traditional structure (b) Tornado structure
5 Test Study and Discussion of Results
To verify the effect of the Tornado mixer on NOX emissions, steady-state SCR conversion efficiency tests and hot-state WHTC emission test tests were conducted on the traditional and Tornado structures. The engine used for the test was a 12L diesel engine. The test equipment, instruments and meters used are shown in Tab. 6 and were all tested and qualified.
5.1 Steady-State SCR Conversion Efficiency Test
The exhaust line is connected to the aftertreatment (SCR mixer is a traditional mixer), the diesel engine is run at rated speed and the temperature upstream of the SCR is controlled to 300°C by controlling the load. Once the operating conditions have stabilised, measurement of raw NOX and NOX downstream of the SCR (measured by the gas emission equipment 7500DEGR) begins. The urea injection volume is controlled manually at Ammonia Nitrogen Ratio (ANR) ratios of 0.7, 1.0, 1.1 and 1.2, with each ANR waiting at least 2 min for the SCR downstream NOX to stabilise before switching to the next ANR. After the test stop and replace the aftertreatment (SCR mixer is a tornado mixer) and repeat the above steps.
To ensure the validity of the steady-state SCR conversion efficiency test comparison between the Tornado mixer and the traditional mixer, the consistency of the engine raw emissions (NOX emissions upstream of DOC) between the two tests was first verified. Fig. 9 shows a comparison of the engine raw emissions from the two tests, from which it can be seen that the engine raw emissions from the two tests are basically the same, indicating that the comparison test is valid.
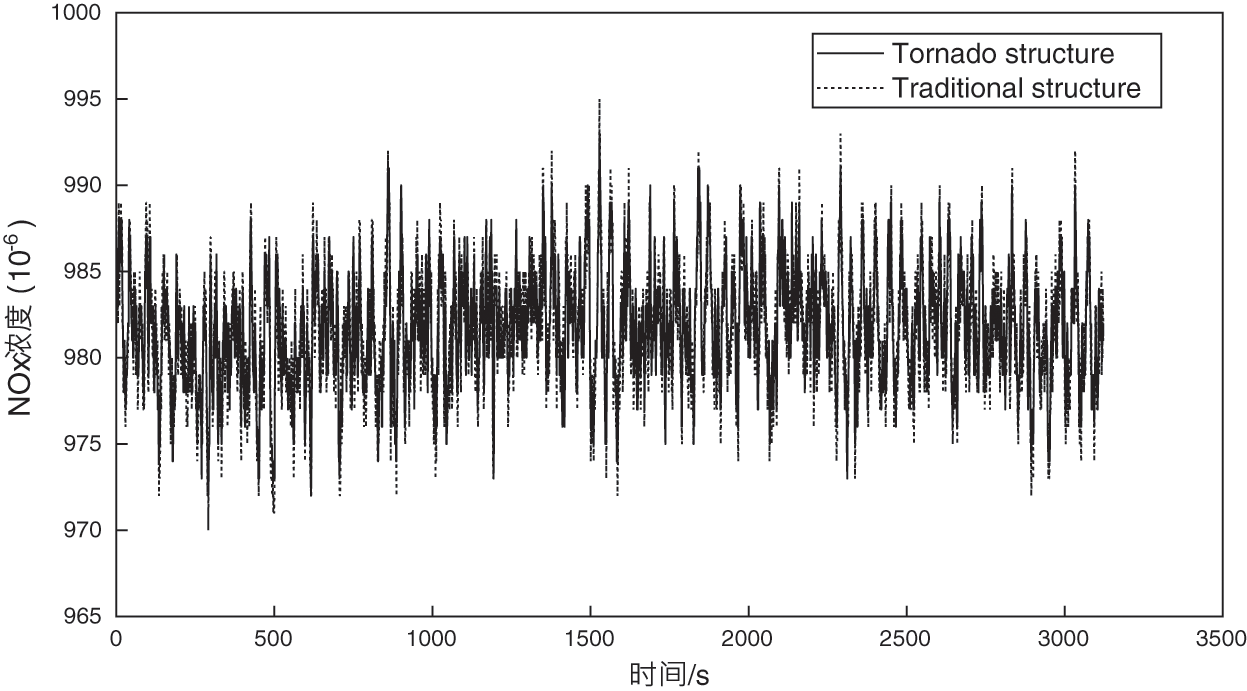
Figure 9: Comparison of NOX raw emissions from steady-state SCR conversion efficiency tests
Tab. 7 and Fig. 10 show the SCR efficiency test results for the Tornado structure and the traditional structure at a steady state point (speed of 1400 r/min, torque of 850 N-m and temperature of 320°C upstream of the SCR) at ANRs of 0.7, 1.0, 1.1 and 1.2 respectively. The Tornado structure has a higher SCR conversion efficiency than the traditional structure at all ANRs, especially at ANR = 1.0, where the average conversion efficiency of the Tornado structure is 1.73% higher than that of the traditional structure. When the engine exhaust gas flows through the tornado mixer, it rotates at high speed under the action of the tornado mixer, wrapping the urea droplets and making them fully evaporated and decomposed, producing more NH3 under the same urea injection volume compared to the traditional mixer; in addition, the porous plate at the bottom of the tornado mixer significantly improves the uniformity of NH3 distribution on the front surface of the SCR carrier, so that the SCR catalyst is efficiently utilised. The Tornado structure has a higher SCR conversion efficiency compared to the traditional structure.
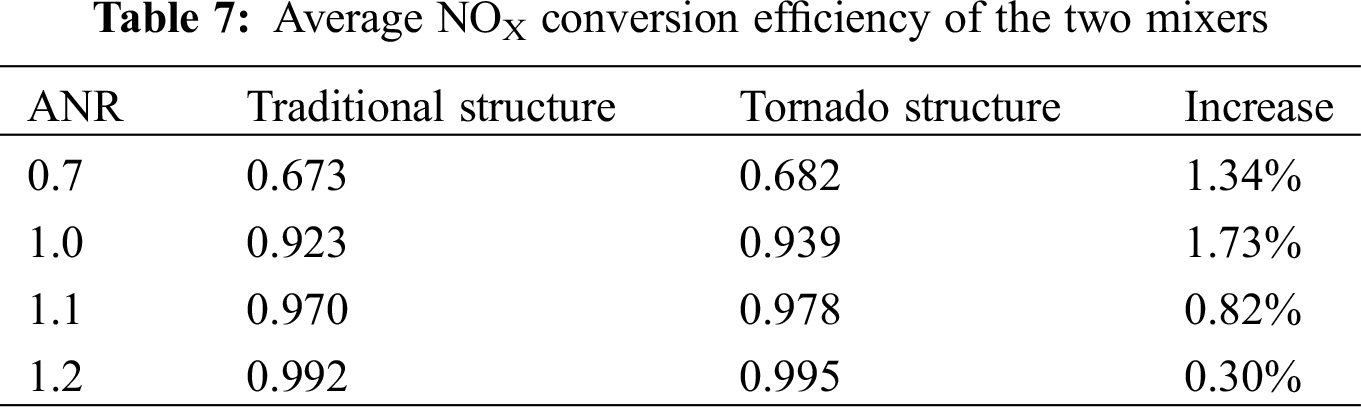
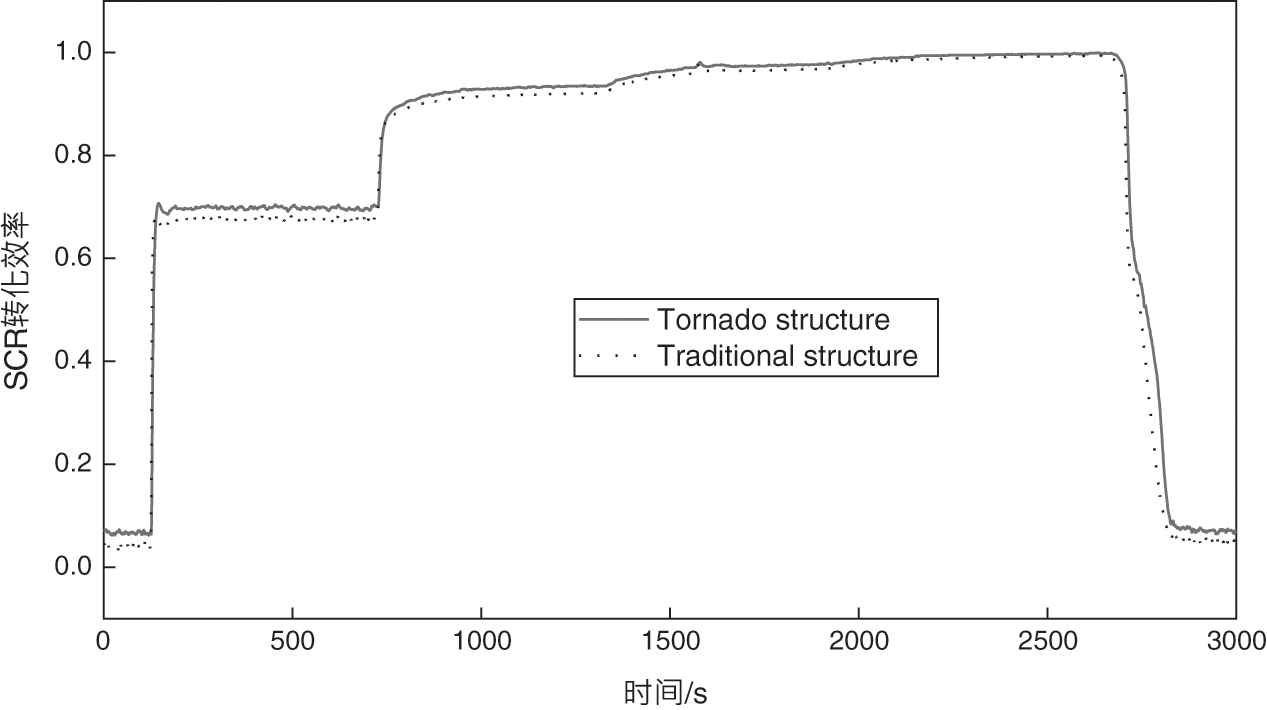
Figure 10: Comparison of steady-state SCR conversion efficiency
To ensure the validity of the comparison between the WHTC emission test tests for the Tornado structure and the traditional structure, the consistency of the engine raw emissions (NOX emissions upstream of the DOC) for the two tests was first verified. Fig. 11 shows the comparison of the engine raw emissions between the two tests. As can be seen from the figure, the engine raw emissions of the two tests are basically the same, indicating that the comparison test is valid. The reason why there is no test data in the first 300 s in the figure is that the engine has just started, the exhaust temperature is low, and the dew point of the nitrogen and oxygen sensor is not released.
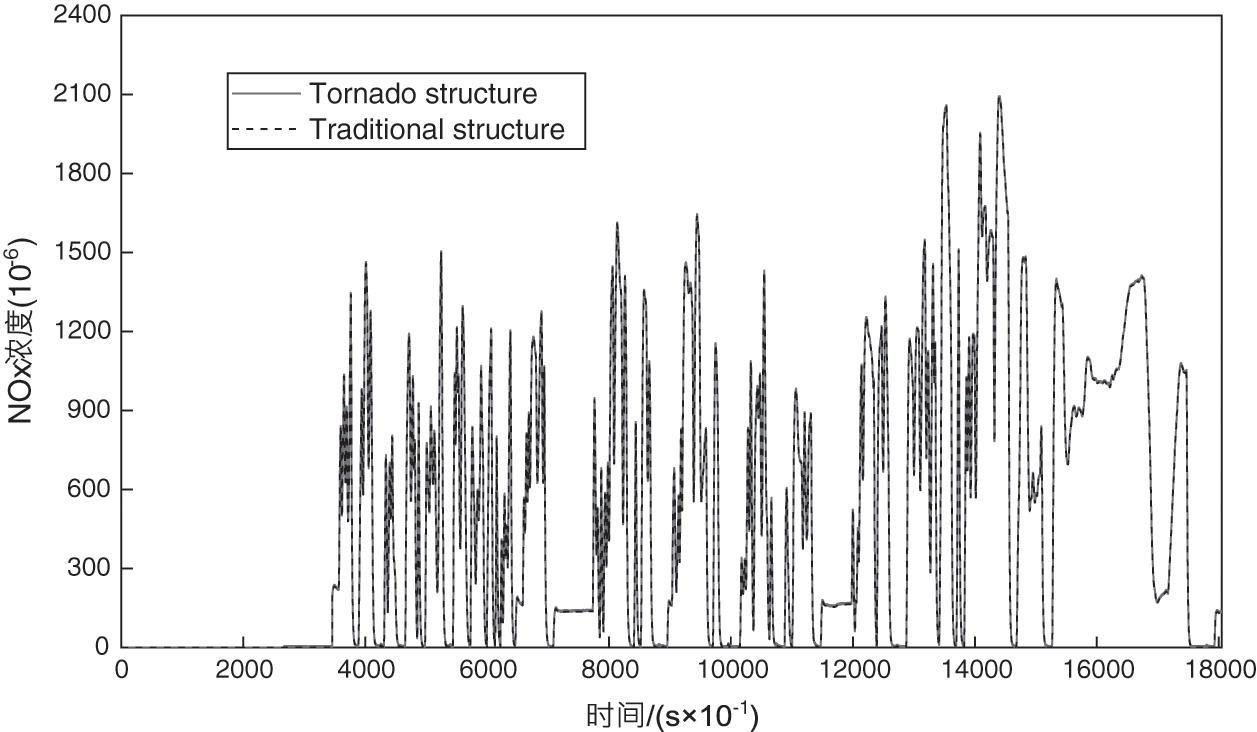
Figure 11: Comparison of NOX raw emissions from WHTC test cycles
Fig. 12 shows a comparison of the volumetric concentrations of NOX emissions downstream of the SCR under the WHTC emission test cycle for the Tornado structure and the traditional structure. It can be seen from the graph that the SCR downstream NOX emissions are lower for the Tornado structure than for the traditional structure.
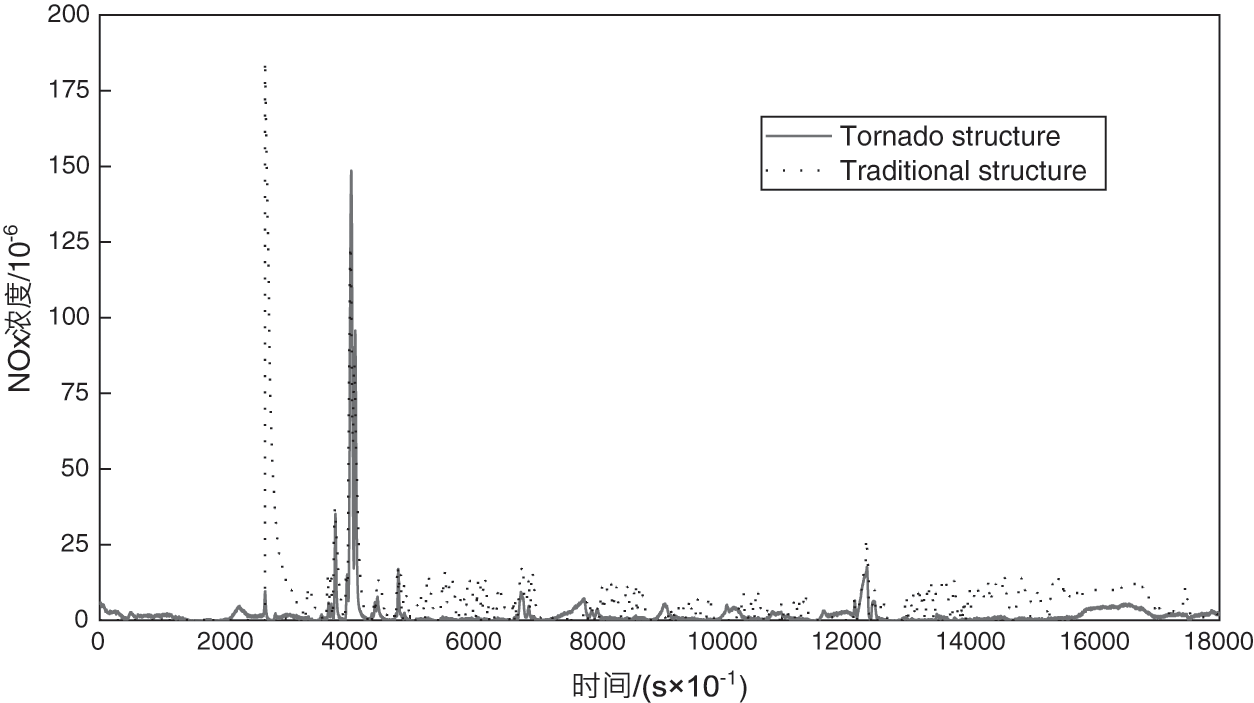
Figure 12: Comparison of NOX emissions downstream of WHTC test cycle SCR
Aiming at the problem of SCR mixer deposition, this study proposes a tornado mixer with extremely high resistance to deposition, which has been evaluated in a combination of simulations and tests, with the following results:
(1) CFD simulation results show that the newly designed Tornado mixer has strong anti-urea deposition performance. The strong disturbance effect effectively promotes the evaporation and decomposition of urea, which can avoid urea deposition under low load operating conditions of diesel engines.
(2) CFD simulation results show that the tornado mixer has strong mixing uniformity, compared with the traditional mixer, it can improve the flow uniformity of SCR carrier front surface by 6.67% and NH3 distribution uniformity by 3.19%.
(3) The results of the steady-state SCR efficiency test and the WHTC emission test show that the Tornado mixer can significantly improve the SCR conversion efficiency and reduce NOX emissions. The average SCR conversion efficiency of the tornado structure is 1.73% higher than that of the traditional structure, and NOX emissions are significantly reduced.
In addition, a method for assessing mixing uniformity, the limiting deviation rate, has been proposed to improve the method for assessing mixing uniformity.
Acknowledgement: The authors would like to thank the editor for the time spent reviewing this manuscript.
Funding Statement: The authors received no specific funding for this study.
Conflicts of Interest: The authors declare that they have no conflicts of interest to report regarding the present study.
1. Shuai, S. J., Tang, T., Zhao, Y. G. (2012). Status and prospects of diesel vehicle emission regulations and after-treatment technologies. Journal of Automotive Safety and Energy Conservation, 3(3), 200–217. [Google Scholar]
2. Birkhold, F., Meingast, U., Wassermann, P., Deutschmann, O. (2006). Analysis of the injection of urea water solution for automotive SCR DeNOx-Systems: Modeling of Two-phase flow and spray/wall-interaction. SAE Technical Paper, 1, 0643. DOI 10.4271/2006-01-0643. [Google Scholar] [CrossRef]
3. Grout, S., Blaisot, J. B., Pajot, K., Osbat, G. (2013). Experimental investigation on the injection of a urea water solution in hot air stream for the SCR application. Evaporation and Spray/Wall Interaction, Fuel, 106, 166–177. [Google Scholar]
4. Smith, H., Lauer, T., Mayer, M., Pierson, S. (2014). Optical and numerical investigations on the mechanisms of deposit formation in SCR systems. SAE International Journal of Fuels and Lubricants, 7(2), 525–542. [Google Scholar]
5. Marion, B., Xuan, C., Martin, W., Olaf, D. (2019). Maximum spreading of urea water solution during drop impingement. Chemical Engineering & Technology, 42(11), 2419–2427. [Google Scholar]
6. Brack, W., Heine, B., Birkhold, F., (2016). Formation of urea based deposits in an exhaust system: Numerical predictions and experimental observations on a hot gas test bench. Emission Control Science & Technology, 2, 115–123. [Google Scholar]
7. Muhammad, K. A. W., Kwangchul, O., Young, J. L., Young, M. W., Ocktaeck, L. (2020). Effects of urea injection timing on predicting NOX conversion in SCR systems. International Journal of Automotive Technology, 21(1), 137–145. [Google Scholar]
8. Börnhorst, M., Deutschmann, O. (2017). Single droplet impingement of urea water solution on a heated substrate. International Journal of Heat and Fluid Flow, 69, 55–61. [Google Scholar]
9. Bai, S. Z., Lang, S. G., Yuan, K. P., Liu, Y., Li, G. X. (2014). Experimental study of urea depositions in urea-SCR system. Advanced Materials Research, 3182, 74–79. [Google Scholar]
10. Schaber, P. M. (2004). Thermal decomposition (pyrolysis) of urea in an open reaction vessel. Thermochimica Acta, 424(1), 131–142. [Google Scholar]
11. Bernhard, A. M., Peitz, D., Elsener, M., Wokaun, A., Krcher, O. (2012). Hydrolysis and thermolysis of urea and its decomposition byproducts biuret, cyanuric acid and melamine over anatase TiO2. Applied Catalysis B: Environmental, 115–116(1), 129–137. [Google Scholar]
12. Ye, K., Wang, G., Cao, X. X., Wang, G. X. (2018). Recent advances in the electro-oxidation of urea for direct urea fuel cell and urea electrolysis. Topics in Current Chemistry, 376(6), 1–38. [Google Scholar]
13. Qian, F., Lü, L., Feng, T., Yang, D. (2017). Experimental and 3D, embedded modeling for diesel engine SCR deposit. International Journal of Automotive Technology, 18(2), 219–227. [Google Scholar]
14. Kabir, M. N., Alginahi, Y., Islam, K. (2015). Simulation of oxidation catalyst converter for aftertreatment in diesel engines. International Journal of Automotive Technology, 16(2), 193–199. [Google Scholar]
15. Sarbendu, S., Sanjay, C., Suresh, K. (2004). An improved model of cored wire injection in steel melts. ISIJ International, 44(7), 1157–1166. [Google Scholar]
16. Duan, S. C., Li, C., Guo, X. L., Guo, H. J., Guo, J. et al. (2019). Thermodynamic analysis for the oxidation behaviour of manganese in iron-based melts during demanganisation processes. Ironmaking & Steelmaking, 46(8), 755–760. [Google Scholar]
17. Hui, L., Zhang, Z., Tang, S., Li, Y., Zhang, Y. (2008). Ultrasonically assisted acid extraction of manganese from slag. Ultrasonics Sonochemistry, 15(4), 339–343. [Google Scholar]
18. Taylor, G. I. (1940). Generation of ripples by wind blowing over a viscous fluid. The scientific papers of GI taylor, pp. 244–254. Cambridge: Cambridge University Press. [Google Scholar]
19. Stiesch, G. (2003). Modeling engine spray and combustion processes. Berlin, Heidelberg: Springer. [Google Scholar]
20. Issa, R. I. (1986). Solution of the implicitly discretized fluid flow equation by Operator-Splitting. Journal of Computational Physics, 62, 40–65. [Google Scholar]
21. Tong, D., Qin, S., Lin, J., Sun, J., Hu, Y. (2021). Thermal analysis of a novel oil cooled piston using a fluid-solid interaction method. Fluid Dynamics & Materials Processing, 17(4), 773–787. [Google Scholar]
22. Tang, J., Li, G. Q., Sun, S. J., Wang, Y. B., Miao, L. et al. (2015). Design and experiment of close-couple SCR converter. Chinese Internal Combustion Engine Engineering, 36(1), 12–17. [Google Scholar]
 | This work is licensed under a Creative Commons Attribution 4.0 International License, which permits unrestricted use, distribution, and reproduction in any medium, provided the original work is properly cited. |