| Fluid Dynamics & Materials Processing |
DOI: 10.32604/fdmp.2022.017743
ARTICLE
CFD-Based Numerical Analysis of the Thermal Characteristics of an Electric Vehicle Power Battery
1Xi’an Traffic Enginering Institute, Xi’an, 710000, China
2Xi’an Technological University, Xi’an, 710000, China
*Corresponding Author: Yaya Wang. Email: c3ajxh@163.com
Received: 02 June 2021; Accepted: 26 July 2021
Abstract: Towards the end to solve the problem of temperature rise in the power battery of electric vehicles, a method based on the coupling of electrochemical, thermal and hydrodynamic aspects is implemented. The method relies on the COMSOL Multiphysics software, which is used here to simulate the thermal behaviour, the related fluid-dynamics and the life attenuation of the power battery. A 3D battery model is built assuming a cylindrical geometry. The diameter of the battery is 18 mm, and its length is 65 mm. The battery charges and discharges at 3C, and the initial temperature is 25°C. Intake flow is set to 0.5 m/s after the air of the battery is cooled. The results show that: (1) The highest temperature of the battery unit increases significantly from 1.14°C of the original nylon heat pipe to 0.17°C of the hot pipe core shaft; (2) When the short circuit of the battery is simulated, the temperature rise of the single battery is close to 20°C, the minimum rise is about 12°C, and their difference reaches 8°C.
Keywords: Fluid mechanics; power batteries; thermal characteristics; electrochemical coupling; thermal control
Electric vehicles have the advantages of low energy consumption and non-exhaust emission, and they also have obvious advantages in energy-saving and protecting the urban environment from pollution. However, there are still many problems in the safety and convenience of using electric vehicles because the power battery of electric vehicles is particularly sensitive to temperature. The high or low temperature will cause the change of the internal structure of the battery, that is, the internal resistance of the Li-ion battery will have different effects on electrode materials, thereby affecting the capacity, cycle life, safety, and reliability of the battery. Waldman studied the decay law of 18650 batteries at −20°C to 70°C. The results show that the decay range at −20°C to 25°C is completely different from that at 25°C to 70°C. When the temperature is below 25°C, the decay rate increases with the decrease of temperature, and the decay rate above 25°C increases with the decrease of temperature [1]. Therefore, it is necessary to study the heat production and heat transfer characteristics of electric vehicle power cells and the Influence of temperature on the performance of the batteries. Research on the cooling mechanism of the power battery can improve the durability of electric vehicles on driving. CFD (Computational Fluid Dynamics) is a rapidly developing discipline in the contemporary era [2].
In the 1950s, China begins research on computational fluid mechanics. Now, computational fluid dynamics has achieved great success. And its calculation methods are finite difference, finite element, priority analysis, spectral algorithm, and pro algorithm [3]. In extreme cases, serious chemical reactions may occur in the battery, resulting in overheating, and even a series of combustion reactions, as well as thermal runaway accidents. Therefore, it has great significance to develop and improve the power battery and its thermal management system [4]. The heat transfer characteristics of a single battery are studied to better improve the heat dissipation and the service life of power batteries.
2 Characteristics of Power Battery
2.1 Principle and Structure of Power Battery
A Li-ion Battery is a kind of high-efficiency recyclable battery, which mainly depends on the insertion and removal of lithium ions between the positive and negative electrodes in the battery to complete the charge and discharge (that is, the storage and release of electric energy) [5]. The packaging methods of the commercial power of Li-ion batteries are generally divided into winding packaging or stacking packaging. And the cylindrical battery is generally a winding package, and the polymer square or soft package battery is the generally a laminated package. The two kinds of batteries are only packaged in different ways, and their internal materials and components are the same [6]. The cylindrical battery and soft pack battery are composed of the positive electrode, the negative electrode, battery shell, and diaphragm. The physical battery of the cylindrical battery and soft pack battery is shown in Fig. 1.
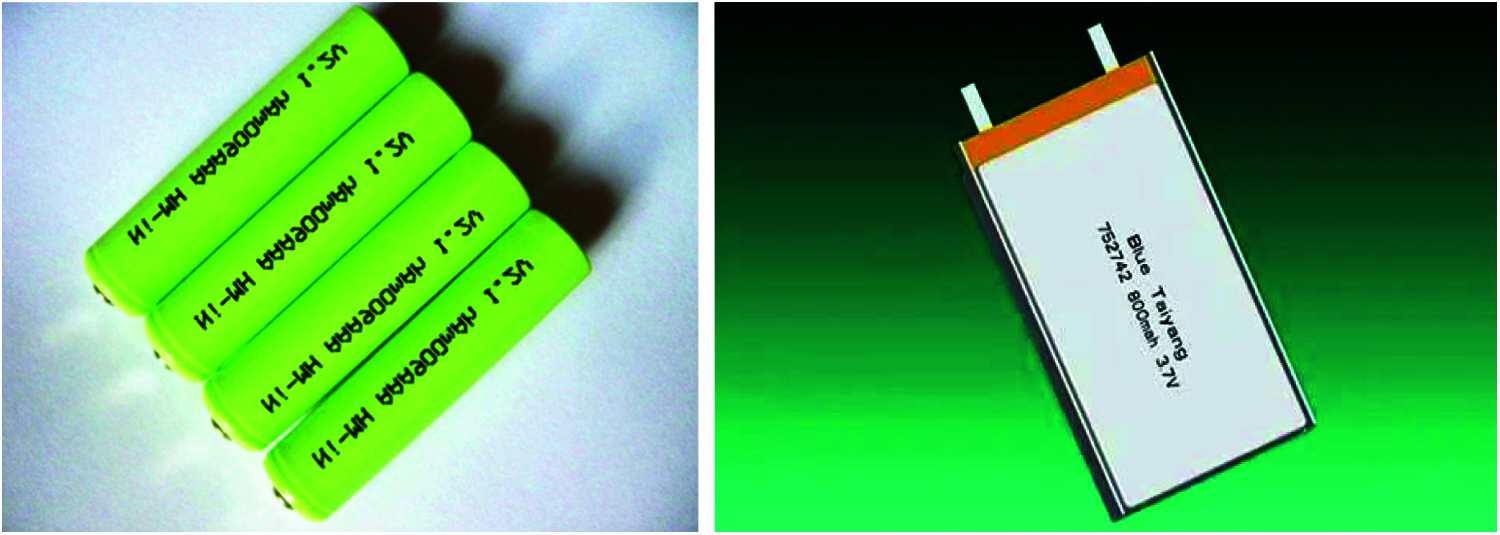
Figure 1: Physical picture of the batteries
2.2 Characteristics of Power Batteries
The power battery has the advantages of high efficiency and long cycle life, which is in line with the requirements of lightweight and range for electric vehicles. But it is very sensitive to temperature, high power, short time and high current discharge will also have a different impact on A Li-ion battery.
2.2.1 Advantages of Power Battery
(1) The energy density is high, about 120–200w h/g, which can reach more than 2 times of Ni-Mh battery.
(2) Under normal process conditions, the cycle life of the power battery can reach more than 2000 times, and the capacity attenuation is much smaller than other batteries.
(3) There is no memory effect of a power battery. Compared with a lead-acid battery, a power battery has no memory effect and does not need to be fully charged and discharged in the initial state.
(4) The self-discharge rate is low. In conventional placement, the self-discharge of a Li-ion battery is low, which maintains a high load for a long time, and will not cause a large capacity attenuation rate.
2.2.2 Disadvantages of Power Batteries
(1) It is very sensitive to temperature. The ideal working temperature of the power battery is 20–45°C. If the temperature is too high, the chemical reaction inside the power battery will be rapid, the heat will be seriously attenuated, and even the heat will be out of control; If the temperature is too low, the capacity of the battery will be seriously attenuated and the battery will not work normally.
(2) It is not safe. The chemical properties of the materials of a power battery are very active, which is easy to cause fire and even explosion accidents in extreme cases.
(3) The management system is complex. Because the power battery pack is composed of single batteries, and every single battery is different, especially the complexity and particularity of thermal management. The temperature difference between the batteries is too large, which leads to the further increase of the difference in the performance of the battery, resulting in the inaccurate detection of the capacity and performance of the battery pack.
2.3 Influence of Temperature on Power Batteries
(1) Influence of temperature on the performance of the batteries
Li-ion batteries are very sensitive to temperature. Research shows that the working temperature range of li-on batteries is generally −30–50°C, and their most suitable working temperature is generally 18–40°C. The main influence of temperature on the performance of the battery lies in the thermal runaway of extremely high temperatures and the serious attenuation of the capacity of the battery at extremely low temperatures. The effect of temperature on the battery is shown in Fig. 2.
(2) Influence of low temperature on power batteries
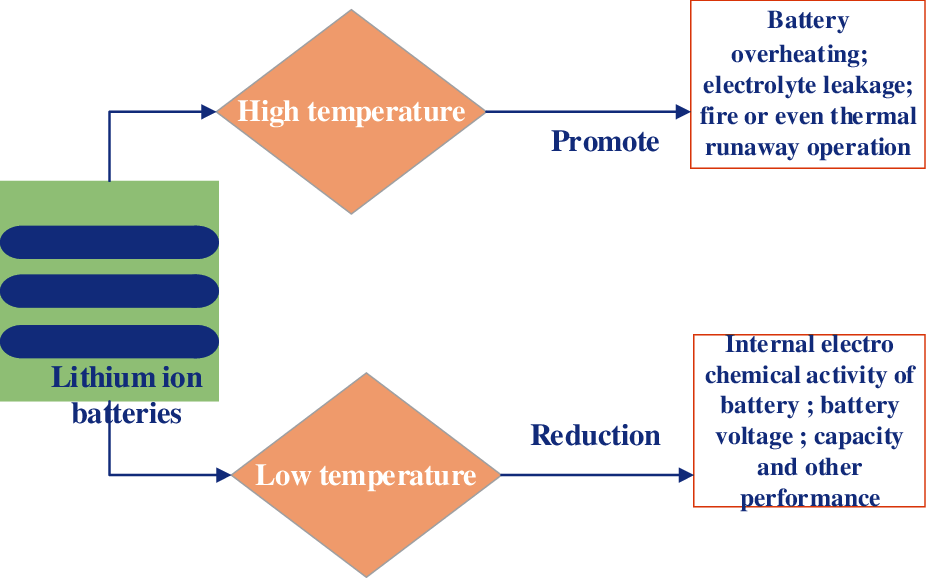
Figure 2: Influence of temperature on battery performance
Although the thermal runaway phenomenon will not appear at low temperatures, the research shows that when the temperature is lower than 0°C, the performance of the battery will be affected; and when the temperature is lower than −20°C, the performance of the battery will be seriously degraded. Friesen et al. [7] compared the performance of Li-ion batteries at low temperatures. The results show that the output power and energy density of the battery are 800 w/L and 100 W/h/L at 25°C, and 10 W/L and 5 W/h/L at −40°C, respectively. Javani et al. [8] analyzed the change of inner electrode of li-on batteries and revealed the effect of low temperature on the performance of the batteries. The electron micrograph of the electrode material after low-temperature cycling shows that there is a dense layer of Al2O3 and a lithium film on the cathode of li-on batteries [9]. The process of lithium deposition is irreversible, and the deposited lithium cannot be converted into li-on to return to the electrolyte. In a word, low temperature can lead to the reduction of activity, the increase of internal resistance, and the decrease of battery capacity and voltage.
(3) Influence of high temperature on power batteries
When the battery is working at a high temperature, the temperature will accelerate the internal reaction of the battery, causing the change of ion shuttle effect in the battery and resulting in the change of internal resistance. If the temperature is not controlled, the positive and negative materials of Li-ion batteries may be bonded, or even partially dissolved; A chain reaction process in which the temperature rises until the heat is out of control. Ning et al. [10] found that at 55°C, the capacity of li-on batteries decays 70% after 800 cycles, while at 25°C, the same number of cycles decays only 30%. Some studies on the decay mechanism at high temperatures of the batteries show that extreme high temperatures can cause strong side reactions, which may lead to the instability of the crystal structure of the positive and negative electrodes [11]. In addition, high temperature may also affect the SEI composite layer. During the first charge-discharge process of liquid li-on batteries, the electrode material and electrolyte react at the solid-liquid interface to form a passivation layer covering the surface of the electrode material. The passivation layer is a solid electrolyte, called solid electrolyte interface film, and simple SEI film [12]. which further affects the performance of the battery; the decrease of active substances and free ions will lead to the increase of internal resistance. All these factors will lead to the capacity degradation and power reduction of the batteries.
Besides the influence of operation on the capacity and performance of the batteries under high-temperature conditions, long-term storage in a high temperature environment will also lead to the attenuation of the capacity of the batteries. Fang et al. [13] stored the battery at high temperatures in a high-capacity state. The results show that the power attenuation is mainly affected by temperature in the first four weeks, and then by time. Meanwhile, Qu et al. [14] found that the capacity decay is more rapid at higher temperatures. Cheng et al. [15] reported that the capacity of a Li-ion battery decreased from 650 mAh to 20 mAh after 60 days of storage at 60°C. In conclusion, storage and working temperature have an important influence on battery performance. Therefore, it is very important to ensure the storage and use of a Li-ion battery at the right temperature. To solve this problem, Yu et al. [16] listed the storage environment of the battery requirement:
a) The storage environment should be dry, clean, well ventilated and suitable temperature;
b) Avoid direct sunlight;
c) The distance between the battery and any heat source shall be at least 2 m;
d) No extrusion or any mechanical stress is allowed.
2.4 Study on the Heating Mechanism of Power Battery
2.4.1 Research on Heat Generation and Heat Transfer of Li-on
At present, there are many studies on the internal heat generation theory of Li-ion batteries, as well as some mathematical models. The thermal simulation technology is also a branch of studying the internal heat dissipation mechanism of power batteries in fluid dynamics. The purpose is to qualitatively and quantitatively know about the physical phenomenon of fluid flow in the battery. COMSOL Multiphysics software is used for the design and research of the battery. The most common one is shown in Eq. (1) [17]. This equation accurately describes the internal heat generation of the battery, but its disadvantage is that it contains too many electrochemical parameters, which increases the amount of calculation and makes the equation too complex. Therefore, the simplified form of the equation is proposed by Abboud et al. [18], as shown in Eq. (2).
A is the heat generation rate per unit volume, W/m3;
I is the current. When the battery is charging, I is positive; and when the battery is discharging, I is negative;
The voltage at x and b
UOC is the voltage of the open circuit in V;
F is the final heat generated by the battery and the unit is J;
Cb is the initial heat generated by the battery and the unit is J
∇ indicates the increase of voltage and the unit is V.
In the process of heat dissipation, heat is dissipated through heat transfer, heat convection, and heat conduction. For the common thermal management methods, the temperature of the electric fluid is mainly controlled by heat transfer and heat convection. In the process of solving the thermal model of the battery, the initial conditions and boundary conditions need to be used, and the boundary conditions can be expressed as the following:
hx and εδ represent the heat exchange coefficient between the battery and the outside world;
T and Trmb are the temperature of battery and environment, K; M is the thermal conductivity;
The radiant heat transfer coefficient is expressed as follows (4) for simplifying the calculation.
Note: the letters in Eq. (4) are the same as those in Eqs. (1)–(3).
When T is slightly larger than Trmb, Eq. (4) can be written as Eq. (5).
hx, hs and hrad are the external heat exchange coefficients of the battery and the initial, the final and the integrated components.
The internal heat of Li-ion batteries mainly includes internal reaction heat Qa, Joule heat Qb, polarization heat Qc and side reaction heat Qd. The total heat of the battery is the sum of the above heat, which can be expressed as Eq. (6):
The mathematical model of the heat transfer of the battery is based on the law of heat transfer. The process of heat generation and heat transfer of Li-on batteries follows the energy conservation law, which can be expressed as: the total heat input from outside Qin + the internal heat of battery Qgen = the total heat dissipated Qout + the internal energy increment Qbat of the battery, as shown in Eq. (7):
The heat transfer path of the battery is: first, the heat generated by chemical reaction and the internal resistance is transferred from the inside of the battery to its surface; second, the heat is transferred to the external environment through active or passive heat dissipation measures.
3 Simulation Analysis of Power Batteries
3.1 Thermal Simulation of the Single Battery
The thermal simulation of a single battery is carried out based on COMSOL. In the simulation, the conjugate heat transfer interface and electrochemical interface of COMSOL are simulated by the one-dimensional model of a single battery [19], and the three-dimensional model of li-on batteries is used to simulate the heat transfer process of batteries.
In the simulation, the initial temperature is set to 25°C. The single cylindrical li-ion battery is 18,650 (diameter 18 mm, height 65 mm), and the soft pack battery size is 230 × 160 × 8 mm. The ambient temperature is set to 25°C and the inlet air velocity is set at 0.1 m/s to simulate the air flow caused by the slight disturbance of hot air in natural cooling; The charge and discharge rate of the battery is 1C and 2C. Figs. 2 and 3 show the current, voltage, and simulated temperature distribution of the 18650 cylindrical battery under 1C and 2C charging and discharging conditions [20]. It can be concluded that under the cooling condition of 0.1 m/s, the maximum temperature of 1C discharge battery after 2500 s cycles is 299.83 K, which is about 0.5°C higher than the initial temperature, and the temperature is slightly increased but almost unchanged. The temperature increases by 3.23°C in 2C discharge, which is higher than that in 1C discharge. This shows that the larger the discharge rate is, the worse the thermal uniformity of the single battery is, that is, the greater the temperature difference of each part of the battery is.
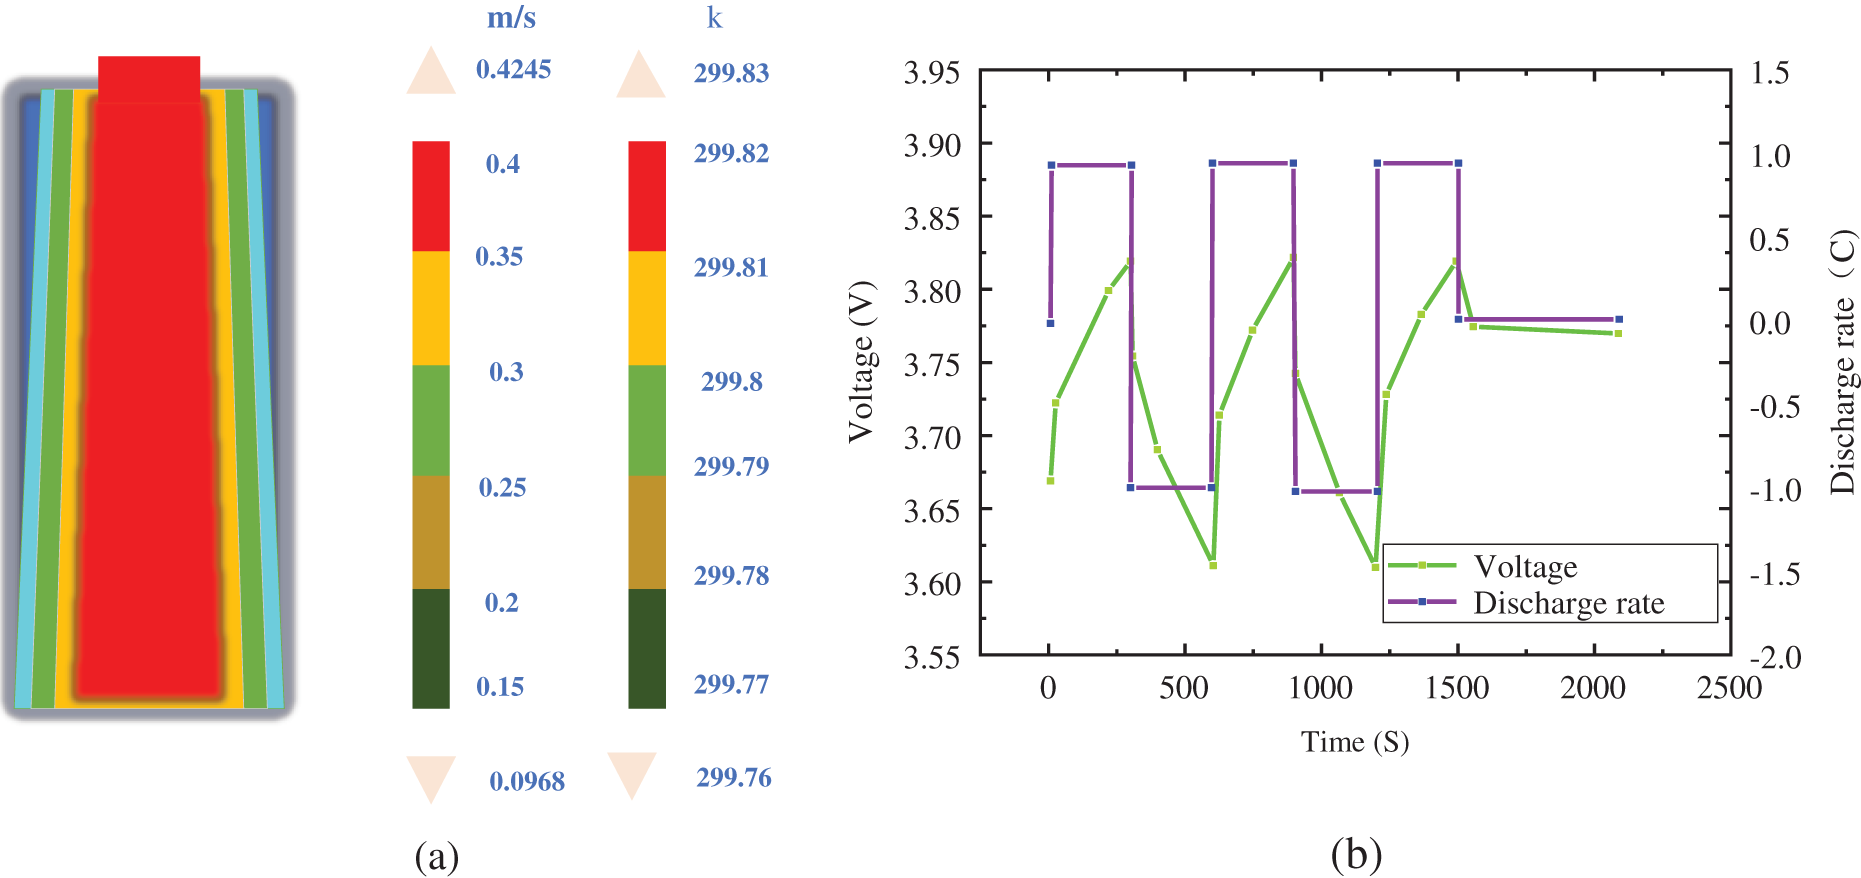
Figure 3: Internal temperature distribution and voltage of 1C discharge rate of a cylindrical battery. (a) Temperature distribution under battery charging and discharging conditions; (b) Change of current and voltage under battery charging and discharging conditions
3.2 Improvement of Internal Performance of Simulation Batteries
The inner core of commercial cylindrical batteries is Ninon mandrel, which has low thermal conductivity and is easy to generate heat accumulation, leading to the performance degradation of the battery. Therefore, the structure of a new cylindrical lithium-ion battery structure is proposed: (1) a heat pipe is used to replace the Ninon mandrel, improving the heat dissipation performance of a single battery; (2) the COMSOL software is used to simulate and verify the effect of the new structure.
3.2.1 Simulation Results of a Cylindrical Battery
The current, voltage, and simulated temperature distribution of the 18650 cylindrical battery under 1C and 2C charging and discharging conditions are shown in Fig. 3 and Fig. 4, respectively.
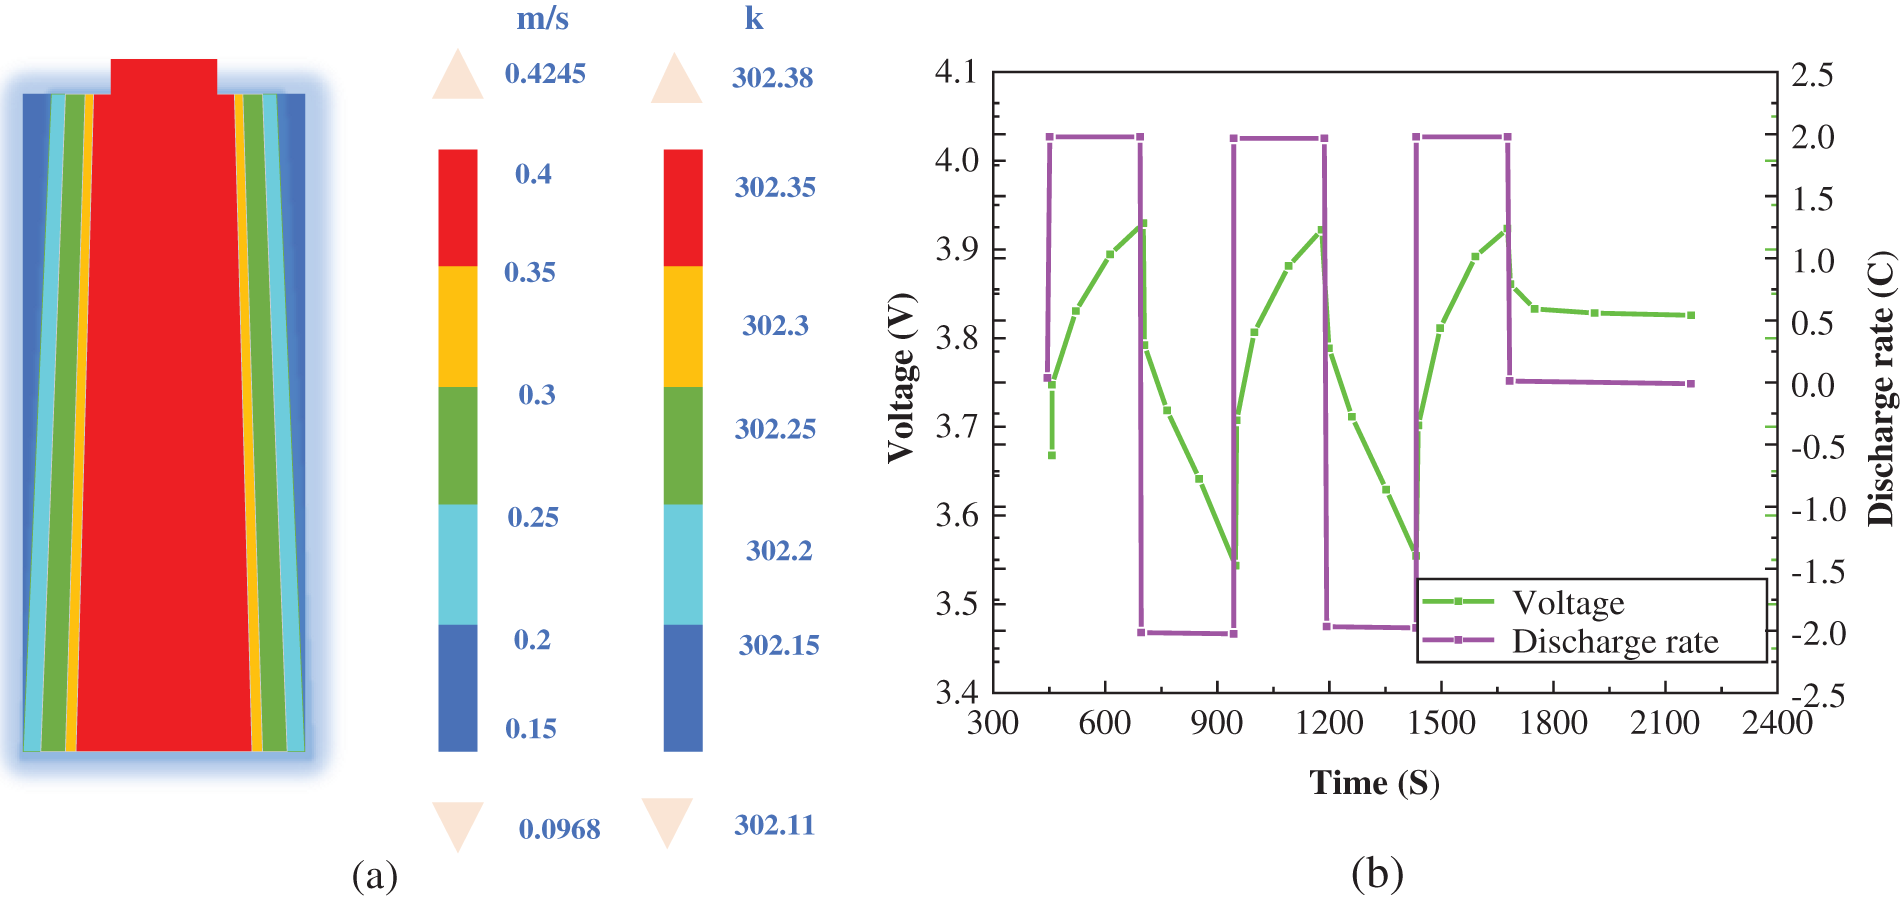
Figure 4: Internal temperature distribution and voltage of 2C discharge rate of a cylindrical battery. (a) Temperature distribution under battery charging and discharging conditions; (b) Change of current and voltage under battery charging and discharging conditions
Fig. 3a shows the simulation temperature distribution of the 18650 cylindrical battery under 1C charging and discharging conditions.
Fig. 3b shows the current, voltage of the 18650 cylindrical battery under 1C charging and discharging conditions.
Combined with Figs. 3a and 3b, it can be concluded that under the cooling condition of 0.1 m/s, the maximum temperature of the discharge battery at 1C is 299.83 k after 2,500 s cycles, which is about 0.5 K higher than the initial temperature of 299.76 k. The temperature increases slightly, the voltage changes from 3.6 V to 3.83 V, and the high and low voltages change between 0.23 V.
Fig. 4a shows the simulated temperature distribution of the 18,650 cylindrical battery under charge and discharge conditions at 2C.
Fig. 4b shows the current and voltage of the 18650 cylindrical battery under charge-discharge conditions at 2C.
Combined with Figs. 4a and 4b, it can be concluded that under the cooling condition of 0.1 m/s, the maximum temperature of the discharge battery at 2C after the 2,500 s cycle is 302.38 k, which is about 0.26 k higher than the initial temperature of 302.11 k. The temperature increases slightly, the voltage changes from 3.55 v to 3.93 v, and the high and low voltage change between 0.38 v.
As a whole, it can be concluded that: under the conditions of the same cooling and discharge cycle, the higher the discharge rate is, the greater the variation range of the high and low voltage of a single battery is, that is, the worse the overall thermal uniformity of the battery is, and the greater the temperature difference of each part of the battery is accordingly. The thermal uniformity of the battery explains the thermal effect of the battery. The factors that affect the thermal effect of the battery are the charge-discharge rate, voltage, internal resistance, the manufacturing process, the structure of the battery, and raw materials.
3.2.2 Simulation Results of Soft Cells
The simulation results of the soft cell show that the soft cell used in the thermal simulation is 235 × 130 × 8 mm, and the capacity of the single battery is 10 Ah. At the initial condition of 298.15 K, charge and discharge cycles at 1C and 2C rates are simulated respectively, and the results are shown in Fig. 4.
Fig. 5a shows the simulation results of the soft cells at 1C rate charge and discharge cycle.
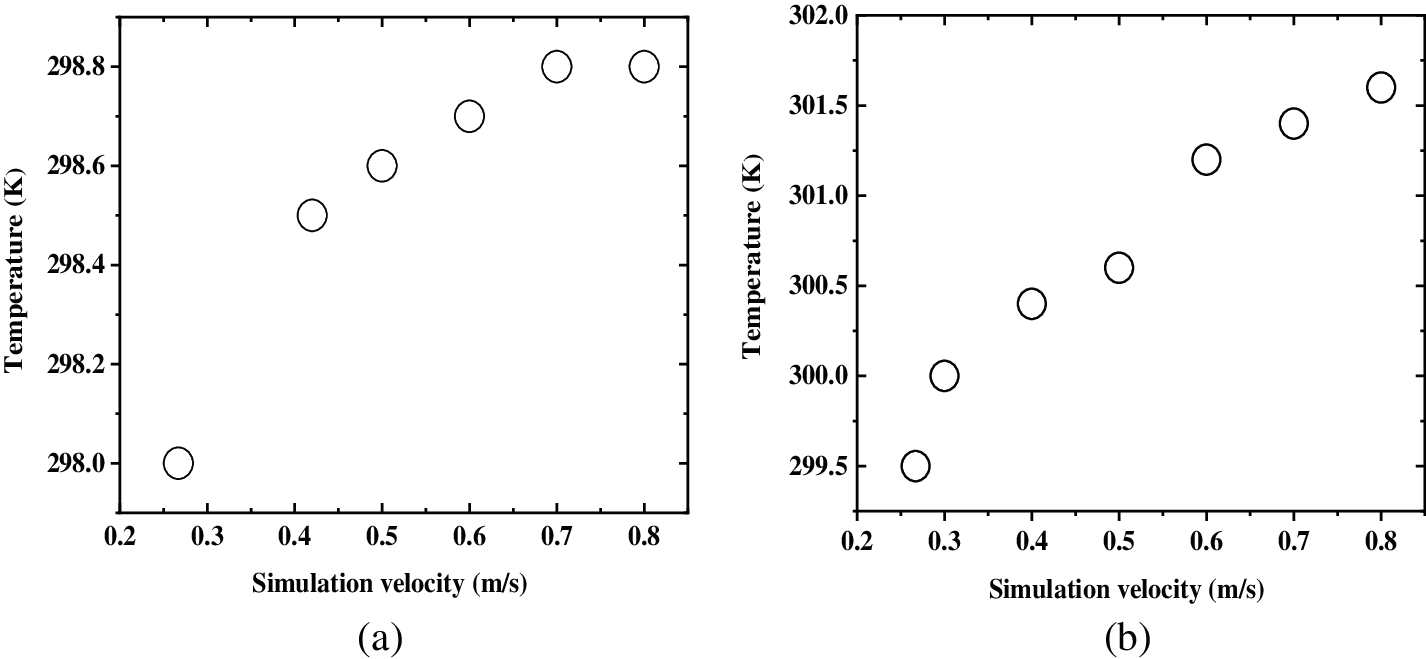
Figure 5: Simulation results of soft cells. (a) Simulation results of soft battery under 1C rate charge discharge cycle; (b) Simulation results of soft battery under 2C rate charge discharge cycle
Fig. 5b shows the simulation results of the soft cells at the 2C rate charge and discharge cycle.
3.3 Improvement of Internal Heat Dissipation Performance of the Batteries
The internal winding mandrel of general commercial cylindrical batteries is the Ninon mandrel, which has low thermal conductivity and is easy to produce heat accumulation, leading to battery performance degradation. Therefore, a new cylindrical Li-ion battery structure is proposed in this section: the heat pipe is used to replace the Ninon mandrel to improve the heat dissipation performance of the single battery, and the COMSOL software is used for simulation to verify the effect of the new structure. The three-dimensional model of the 18650 battery is the prototype, which is 18 mm in diameter and 65 mm in length; The initial temperature is 25°C. To simulate the state of the battery under the condition of air cooling, the inlet air flow rate is set as 0.5 m/s.
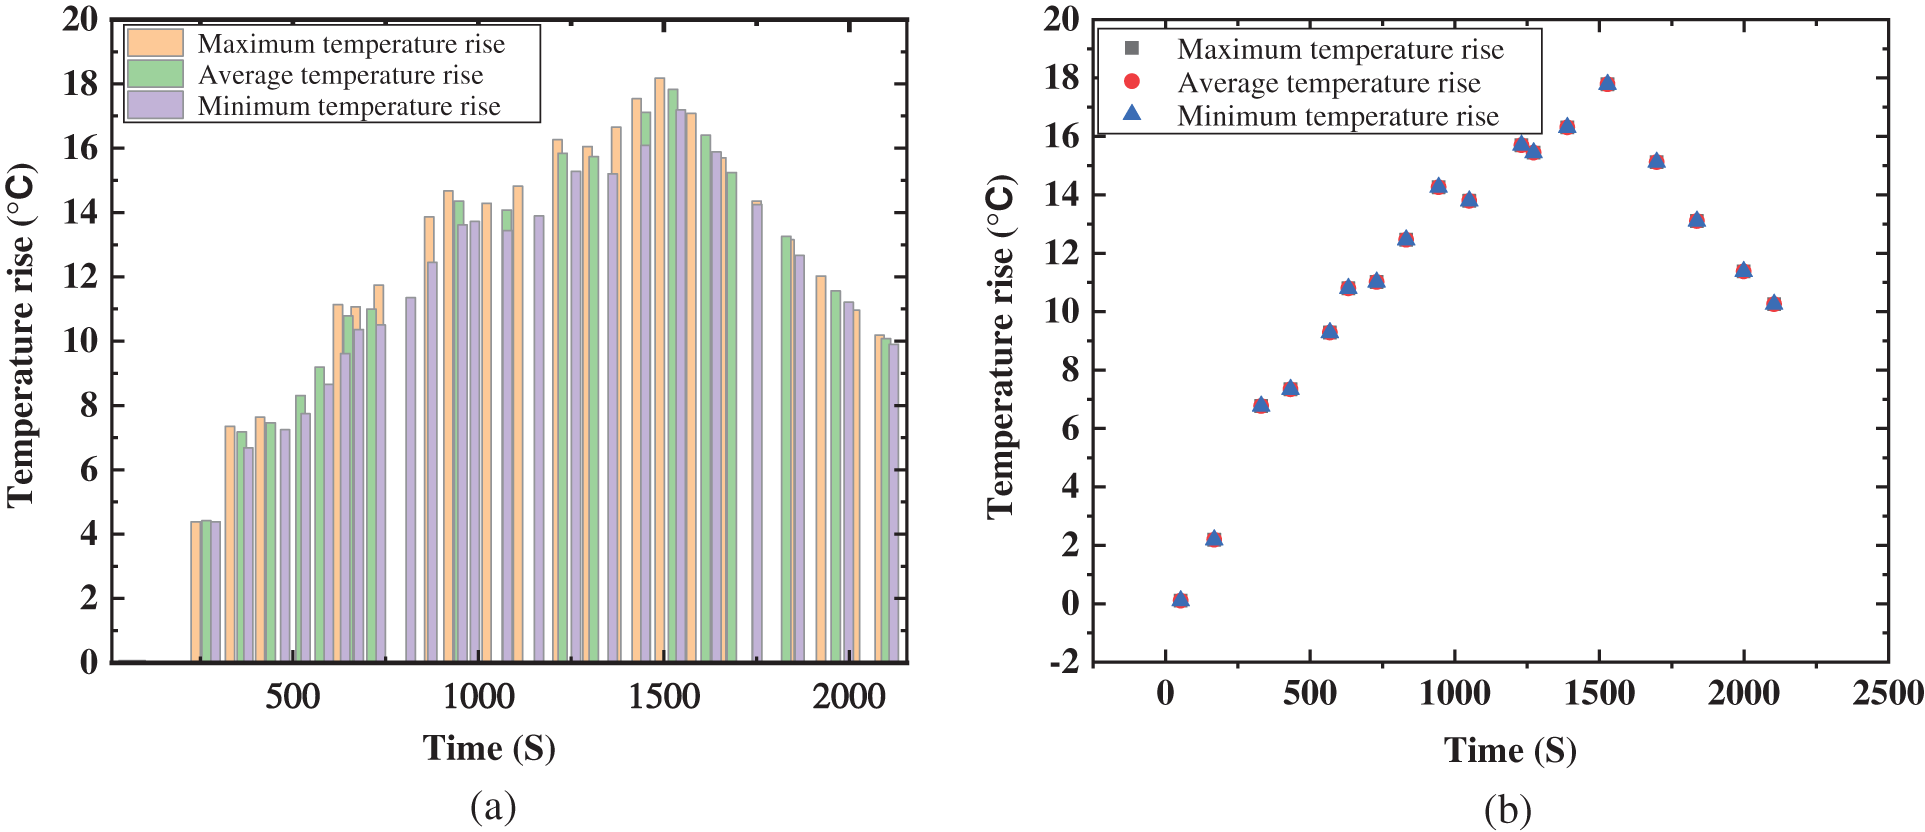
Figure 6: Comparison of the temperature rise between heat pipe mandrel and nylon mandrel
According to the simulation results of Ninon mandrel, the center temperature of the battery is higher than the surface temperature, and the maximum temperature difference of the whole battery is 1.14°C. According to the simulation results after the replacement, the maximum temperature is 315.95 K, which is significantly lower than 316.46 K of Ninon mandrel. In addition, the maximum temperature difference of the battery is 0.17°C, which is significantly lower than 1.14 before replacement. Fig. 6 shows that the maximum temperature rise of the battery decreases and the temperature difference of the battery is significantly improved by replacing the Ninon mandrel with the heat pipe mandrel. There is no difference in the maximum temperature rise, average temperature rise, and minimum temperature rise.
4 Study on the Life Span and Safety of Power Batteries
4.1 Simulation of the Hydrodynamic Life Decay of the Batteries
The main reasons for the capacity and lifetime degradation of Li-ion batteries are side effects and degradation of battery materials. The attenuation and degradation of the batteries are affected by many factors, such as current density and material concentration distribution at different locations. To simulate the effect of different charge and discharge rates on the performance of li-on batteries, the electrochemical interface of COMSOL software is used to model the attenuation of recyclable lithium in li-on batteries. In the simulation process, based on the one-dimensional model of li-on batteries, the working mode of charge and discharge cycle is set as follows: (1) 1C constant current charging to the upper limit voltage of 4.1 V; (2) Charge at a constant voltage of 4.1 V until fully charged; (3) Discharge to lower limit voltage with 1C constant current. The calculation is speeded up, the convergence is improved, and the time acceleration factor is added.
Fig. 7 below shows the first charge and discharge voltage curves of the battery under 1C, 2C, and 3C charge and discharge cycles.
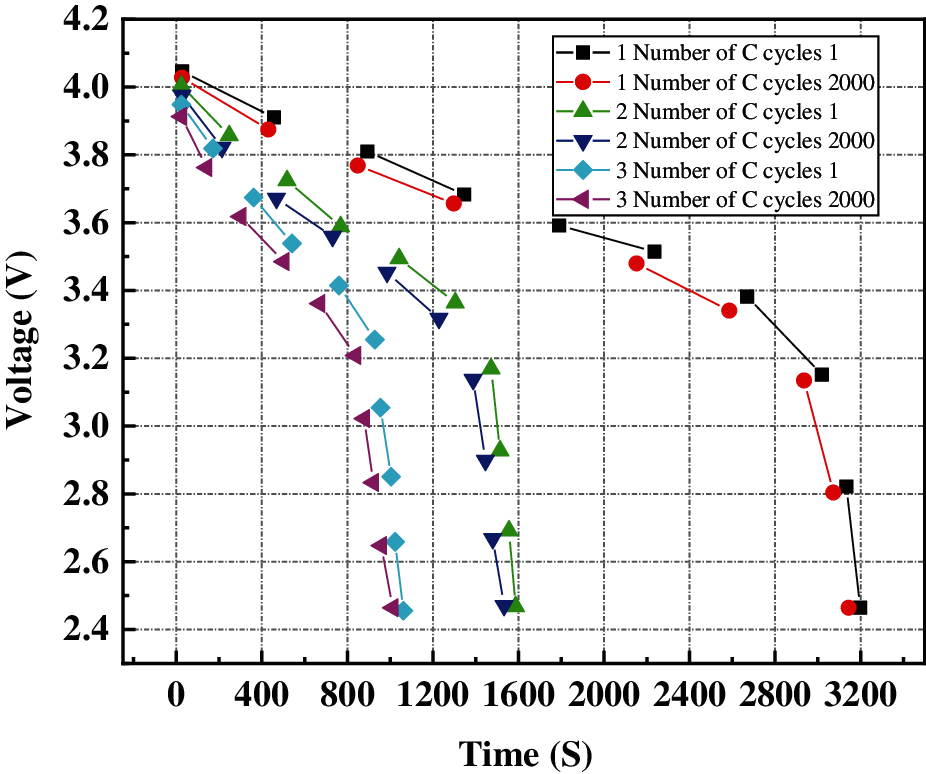
Figure 7: Comparison of voltage drop of first and last cycle at different charge and discharge rates
Fig. 7 shows that with the increase of charge-discharge rate, the decrease of voltage of the battery is accelerating. When the battery is discharged at 3C, the voltage drop to the cut-off voltage is 1,050 s, while the discharge time at 1 C and 2C is 3,000 s and 1,480 s, respectively. In addition, the voltage drop during the last cycle of discharge is significantly different from that during the first cycle of discharge, and the voltage drop during the last cycle of discharge is faster. The above results show that the high charge-discharge rate significantly reduces the performance of the battery.
4.2 Simulation of the Thermal Safety of the Battery
The thermal simulation of the external short circuit of the battery is as follows: (1) the positive and negative poles are directly connected together, and there will be a huge current through the battery body at the moment of short circuit; (2) the 18650 cylindrical battery is used in the simulation, with the maximum voltage of 4.2 V at full capacity, 65 mm in height, 18 mm in diameter, 4 mm in mandrel diameter and 0.1 mm in shell thickness; (3) the two-dimensional axisymmetric model is used, and the ambient temperature and initial temperature are set at 25°C.
Fig. 8 shows the voltage and current changes after the external short circuit of the battery in the simulation.
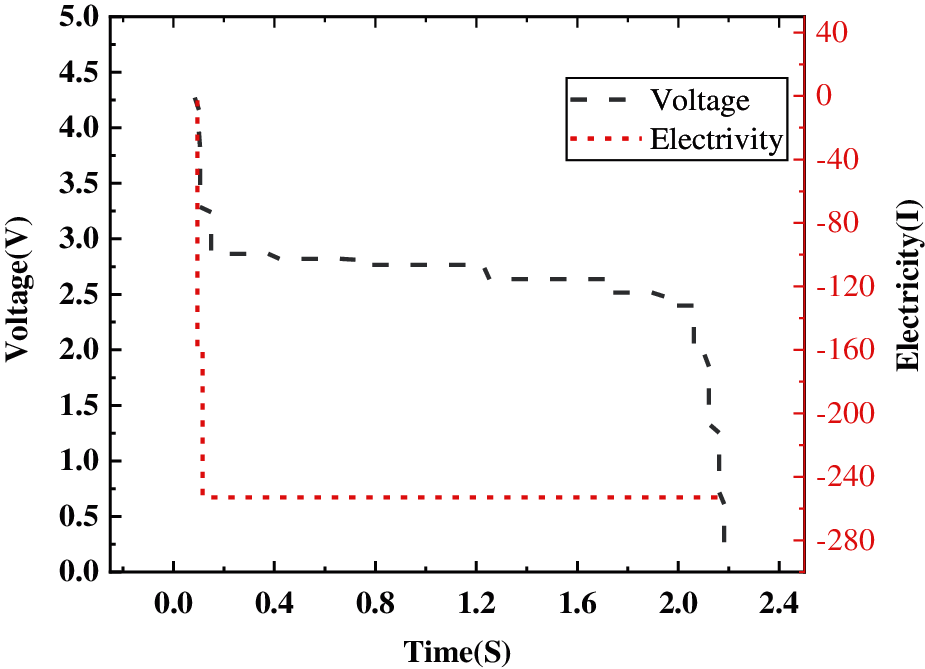
Figure 8: Curve of the changes of the voltage and current of external short circuit of the battery
The current rapidly rises to nearly 300 A and the voltage rapidly drops to 0 within about 2 s after the external short circuit occurs. An external short circuit will seriously damage the battery, leading to a failure.
Fig. 9 shows the temperature change of the battery in the process of an external short circuit.
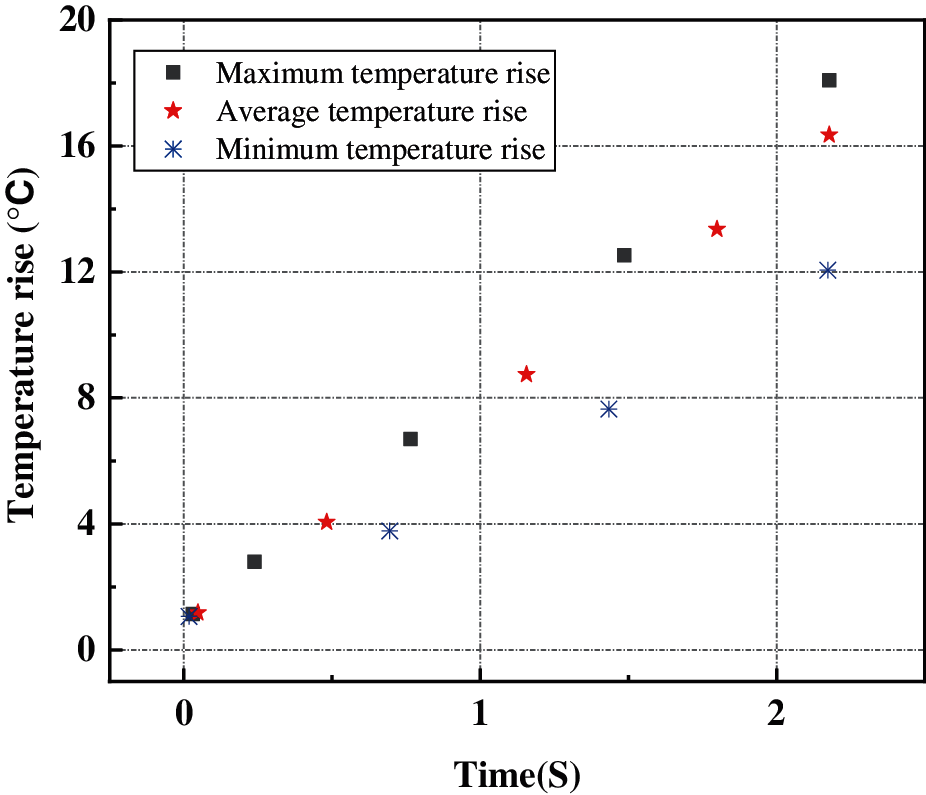
Figure 9: Transient temperature rise of the external of the battery
The maximum temperature rise, average temperature rise and minimum temperature rise of the 18650 battery at the time of external short circuit are displayed. The temperature curve shows that the maximum temperature rise of the 18650 battery can reach nearly 20°C, the minimum temperature rise is about 12°C, and the temperature difference of battery can reach 8°C. This will seriously affect the performance and safety of the battery.
The heat transfer model of the cylindrical battery and the soft package monomer is established, and the heat transfer process is analyzed. The COMSOL software is used to simulate the hydrodynamic of power batteries at 1C, 2C, and 3C. The simulation model is based on the electrochemical thermal coupling method. Based on the simulated cloud image and temperature rise curve, the thermal characteristics of the battery at different charging and discharging rates can be obtained.
In this study, the influence of temperature on the basic performance and life decay of lithium-ion batteries is studied, and the influence of the heat pipe inside the battery is reduced. There are two conclusions: (1) The maximum temperature rise of the cell increases significantly from 1.14°C of the original nylon heat pipe to 0.17°C of the heat pipe mandrel. (2) When the short circuit of the battery is simulated, the temperature rise of the single battery is close to 20°C, the minimum rise is about 12°C, and the temperature difference reaches 8°C.
The solution proposed in this study is to replace nylon heat pipe with heat pipe mandrel, which has certain practical significance. The following aspects need to be improved.
(1) Because of the limitation of the performance of computers, the model of the battery is simplified. The battery can be regarded as a uniform heat receiver. In the future, the internal structure of the battery is refined, the positive and negative ears of the battery is increased, and the accuracy of the theoretical simulation data is improved. (2) In the battery temperature rise experiment and thermal simulation, the external temperature of the battery is a fixed value, while in the actual working process, the current and external environment temperature of the battery are a dynamic process. The focus of future research will be the fluid mechanics to explore the heat dissipation characteristics of the batteries under sudden changes in ambient temperature, as well as the fluid dynamics of power batteries with different raw materials under low-temperature conditions, designing power batteries suitable for low-temperature environment, and exploring the endurance and service life of electric vehicles in low-temperature environment.
Funding Statement: The authors received no specific funding for this study.
Conflicts of Interest: The authors declare that they have no conflicts of interest to report regarding the present study.
1. Bai, S., Bao, F., Zhao, F. Z. (2021). On the efficiency of a cfd-based full convolution neural network for the post-processing of field data. Fluid Dynamics & Materials Processing, 17(1), 39–47. DOI 10.32604/fdmp.2021.010376. [Google Scholar] [CrossRef]
2. Cheng, H., Du, G. S., Zhang, M., Wang, K., Bai, W. B. (2020). Determination of the circulation for a large-scale wind turbine blade using computational fluid dynamics. Fluid Dynamics & Materials Processing, 16(4), 685–698. DOI 10.32604/fdmp.2020.09673. [Google Scholar] [CrossRef]
3. Zhou, H. M., Gao, H. Z., Fang, Z., Yang, J. X., Wu, M. G. (2020). Analysis of gas-solid flow characteristics in a spouted fluidized bed dryer by means of computational particle fluid dynamics. Fluid Dynamics & Materials Processing, 16(4), 813–826. DOI 10.32604/fdmp.2020.010150. [Google Scholar] [CrossRef]
4. Li, Y. X. (2020). Analyzing the flow field in the oil chamber of a hydrostatic guide rail used for ultra-precision machining numerical simulation and performance optimization. Fluid Dynamics & Materials Processing, 16(6), 1129–1145. DOI 10.32604/fdmp.2020.09437. [Google Scholar] [CrossRef]
5. Sun, C. F., Shang, J. Z., Luo, Z. R., Li, X., Lu, Z. Y. et al. (2020). CFD simulation and experimental study of a New elastic blade wave energy converter. Fluid Dynamics & Materials Processing, 16(6), 1147–1159. DOI 10.32604/fdmp.2020.09937. [Google Scholar] [CrossRef]
6. Nagasubramanian, G. (2020). Electrical characteristics of 18650 Li-ion cells at low temperatures. Journal of Applied Electrochemistry, 31(1), 99–104. DOI 10.1023/A:1004113825283. [Google Scholar] [CrossRef]
7. Friesen, A., Hildebrand, S., Horsthemke, F. (2018). Al2O3 coating on anode surface in lithium ion batteries impact on low temperature cycling and safety behavior. Journal of Power Sources, 363(30), 70–77. DOI 10.1016/j.jpowsour.2017.07.062. [Google Scholar] [CrossRef]
8. Akbarzadeh,M., Jaguemont, J., Kalogiannis,T., Karimi, D., He, J. et al. (2021). A novel liquid cooling plate concept for thermal management of lithium-ion batteries in electric vehicles. Energy Conversion and Management, 231(15), 113862. DOI 10.1016/j.enconman.2021.113862. [Google Scholar] [CrossRef]
9. Bower, A. F., Guduru, P. R., Sethuraman, V. A. (2019). A finite strain model of stress, diffusion, plastic flow and electrochemical reactions in a Li-ion-ion half-cell. Journal of the Mechanics and Physics of Solids, 59(4), 804–828. DOI 10.1016/j.jmps.2011.01.003. [Google Scholar] [CrossRef]
10. Ning, G., Haran, B., Popov, B. (2020). Capacity fade study of Li-ion-ion batteries cycled at high discharge rates. Journal of Power Sources, 117(1–2), 160–169. DOI 10.1016/S0378-7753(03)00029-6. [Google Scholar] [CrossRef]
11. Wu, M. S., Chang, J. (2021). High-rate capability of a Li-ion battery after storing at elevated temperature. Electrochimica Acta, 52(11), 3719–3725. DOI 10.1016/j.electacta.2006.10.045. [Google Scholar] [CrossRef]
12. Jaguemont, J., Omar, N., Den, B. (2018). Phase-change materials (PCM) for automotive applications. Applied Thermal Engineering, 26(3), 308–320. DOI 10.1016/j.applthermaleng.2017.12.097. [Google Scholar] [CrossRef]
13. Fang, G., Huang, Y., Yuan, W. (2019). Thermal management for a tube–shell Li-ion battery pack using water evaporation coupled with forced air cooling. RSC Advances, 9(18), 9951–9961. DOI 10.1039/C8RA10433F. [Google Scholar] [CrossRef]
14. Qu, J., Wang, C., Li, X. (2018). Heat transfer performance of flexible oscillating heat pipes for electric hybrid-electric vehicle battery thermal management. Applied Thermal Engineering, 3(2), 1–9. DOI 10.1016/j.applthermaleng.2018.02.045. [Google Scholar] [CrossRef]
15. Cheng, J., Li, Z., Jiang, F. (2018). Experimental investigation on using the electric vehicle air conditioning system for lithium-ion battery thermal management. Energy ForSustainable Development, 45(6), 88–95. DOI 10.1016/j.esd.2018.05.005. [Google Scholar] [CrossRef]
16. Yu, L., Li, Y. (2019). A flexible-possibilistic stochastic programming method for planning municipal-scale energy system through introducing renewable energies and electric vehicles. Journal of Cleaner Production, 207, 772–787. DOI 10.1016/j.jclepro.2018.10.006. [Google Scholar] [CrossRef]
17. Walker, W. Q., Darst, J. J., Finegan, D. P. (2019). Decoupling of heat generated from ejected and non-ejected contents of 18650-format lithium-ion cells using statistical methods. Journal of Power Sources, 415, 207–218. DOI 10.1016/j.jpowsour.2018.10.099. [Google Scholar] [CrossRef]
18. Abboud, A. W., Gentle, J. P., Mcjunkin, T. R. (2020). Using computational fluid dynamics of wind simulations coupled with weather data to calculate dynamic line ratings. IEEE Transactions on Power Delivery, 35(2), 745–753. DOI 10.1109/TPWRD.61. [Google Scholar] [CrossRef]
19. López-Núñez, O. A., Alfaro-Ayala, J. A., Ramírez-Minguela, J. J. (2020). Optimization of a linear fresnel reflector applying computational fluid dynamics, entropy generation rate and evolutionary programming. Renewable Energy, 152, 698–712. DOI 10.1016/j.renene.2020.01.105. [Google Scholar] [CrossRef]
20. Wickramaarachchi, W., Narayana, M. (2020). Pyrolysis of single biomass particle using three-dimensional computational fluid dynamics modeling. Renewable Energy, 146, 1153–1165. DOI 10.1016/j.renene.2019.07.001. [Google Scholar] [CrossRef]
 | This work is licensed under a Creative Commons Attribution 4.0 International License, which permits unrestricted use, distribution, and reproduction in any medium, provided the original work is properly cited. |