| Fluid Dynamics & Materials Processing |
DOI: 10.32604/fdmp.2022.017922
ARTICLE
Thermal Analysis by Means of Differential Scanning Calorimetry of the Characteristic Thermodynamic Temperatures of a Cu-Zr-Al Bulk Metallic Glass
Shaanxi Key Laboratory of Photoelectric Functional Materials and Devices, School of Material and Chemical Engineering, Xi’an Technological University, Xi’an, 710021, China
*Corresponding Author: Yanhong Li. Email: liyanhong@xatu.edu.cn
Received: 17 June 2021; Accepted: 12 August 2021
Abstract: In this study a Cu43Zr48Al9 bulk metallic glass prepared by the copper mold casting method is considered. In recent years, Cu-Zr-Al systems like this have enjoyed widespread attention due to their high strength, high hardness, high corrosion resistance and low cost. Here samples of this substance are studied using DSC (Differential scanning calorimetry) to determine the effect of different test conditions (heating rate, sample mass, sample specific surface area and sample crystal phase) on the characteristic thermodynamic temperature of the bulk metallic glass. Experimental results show that almost all of the five characteristic thermodynamic temperatures (Tg, Tx, Tp, Tm, Tl) of this substance have higher values when the heating rate is increased. The influence of the variation of sample mass, sample specific surface area and sample crystal phase on the amorphous alloy characteristic temperature is very weak. lower the heating rate, the more developed the crystalline phase in the amorphous alloy will be.
Keywords: Cu-Zr-Al amorphous; influence factors; characteristic thermodynamic temperature; DSC
Bulk metallic glass (BMG) has become a promising new structural material due to its high strength, great resistance against wearing, and excellent corrosion resistance properties [1–8]. However, most BMGs exhibit relatively little glass formation ability and thermal stability. Currently, thermal analysis [9–12] (DSC) is one of the most convenient and widely used methods for the analysis of thermal material. DSC technology is a method that can be employed for measuring the characteristic thermodynamic temperatures during the process of heating bulk metal glass, including glass transition temperature (Tg), crystallization temperature (Tx), crystallization peak temperature (Tp), and melting temperature (Tm). An index of thermal stability of bulk metallic glass can be obtained using the DSC thermal analysis test instrument, as shown in Fig. 1a. There are five characteristic thermodynamic temperatures of amorphous: Tg, Tx, Tp, Tm, and Tl. This can be seen in Fig. 1b. The transition of an amorphous state from equilibrium metastable state to non-equilibrium metastable state is known as an amorphous state transition, and the temperature at the start of the transition is the glass transition temperature Tg, which is the transition between the glassy state and high elastic state. During the heating process, the bulk metallic glass transforms from the non-equilibrium metastable state to equilibrium state, and the initial temperature at which the glass crystallizes is known as crystallization temperature Tx. The temperature at which the most energy is released during amorphous crystallization is the peak crystallization temperature (Tp). The temperature at which the transition from solid to liquid starts is the solid-line temperature (Tm). The temperature at which the solid is completely transformed into a liquid is the liquidus temperature (Tl).
A comprehensive evaluation and comparison of the thermal stability of bulk metallic glass can be performed. However, DSC is a dynamic temperature analysis technique and there are many factors that can affect its experimental results. The measurement results will not only be affected by the material state, but also by other factors including experimental conditions. Results that are obtained under different test conditions may contain significant errors [13].
When conducting research on the influence of test conditions on the characteristic temperature of bulk metallic glass, it is of great significance to improve the testing accuracy by obtaining the optimum testing conditions. This is effective for improving the glass formation ability GFA of the Cu-Zr-Al BMGs.

Figure 1: DSC test instrument and DSC curves (a) DSC thermal analysis test instrument (b) DSC curves and thermodynamic temperature
In this paper, the results of the experiment will be compared and analyzed. The will be conducted using DSC under different test conditions with test samples of bulk metallic glass, and the influence of test conditions on the five characteristic thermodynamic temperatures of BMGs will be researched. By calculating the GFA as a criterion of ∆T ( ∆T = Tx − Tg), Trg (Trg = Tg/Tl), γ (γ = Tx/(Tg + Tl)), α (α = Tx/Tl), the GFA and thermal stability of the sample can be analyzed under different test conditions. The correct conditions can be chosen and the thermodynamic temperature change rule under different test conditions can be summarized.
Master alloy ingots with a nominal composition of Cu43Zr48Al9 were prepared by arc-melting a mixture of Cu (99.9%), Zr (99.99%), Al (99.99%) and Y (99.99%) in a high-purity argon atmosphere. In order to ensure complete melting and compositional homogeneity, the alloy ingots were re-melted three times. The molten alloys were then suction cast into a copper mold a rod 3 mm in diameter was obtained under negative pressure. The thermal characteristic parameters of the alloys were determined using a differential scanning calorimeter (DSC) in a high-purity argon atmosphere.
This experiment uses the amorphous alloy Cu43Zr48Al9 as its research object for analyzing the change trend and rule of characteristic thermodynamic temperatures (Tg, Tx, Tp, Tm, Tl) in a variety of DSC test conditions. The test conditions include sample quality, sample specific surface area, crystal phase state of the sample, and temperature rise rate of the instrument.
3.1 Influence of Sample Quality on DSC Test Results
Due to the quality of the sample is not the same as lead to there are some different of test results. In order to determine a more appropriate test quality, the test quality of 20, 40, 60, 80 and 100 mg by DSC test, different quality of Cu43Zr48Al9 test results by DSC as shown in Fig. 2. The measured results of the various characteristics of temperature and glass formation ability parameters are shown in Table 1.

Figure 2: DSC curves of Cu43Zr48Al9 bulk metallic glass with different masses
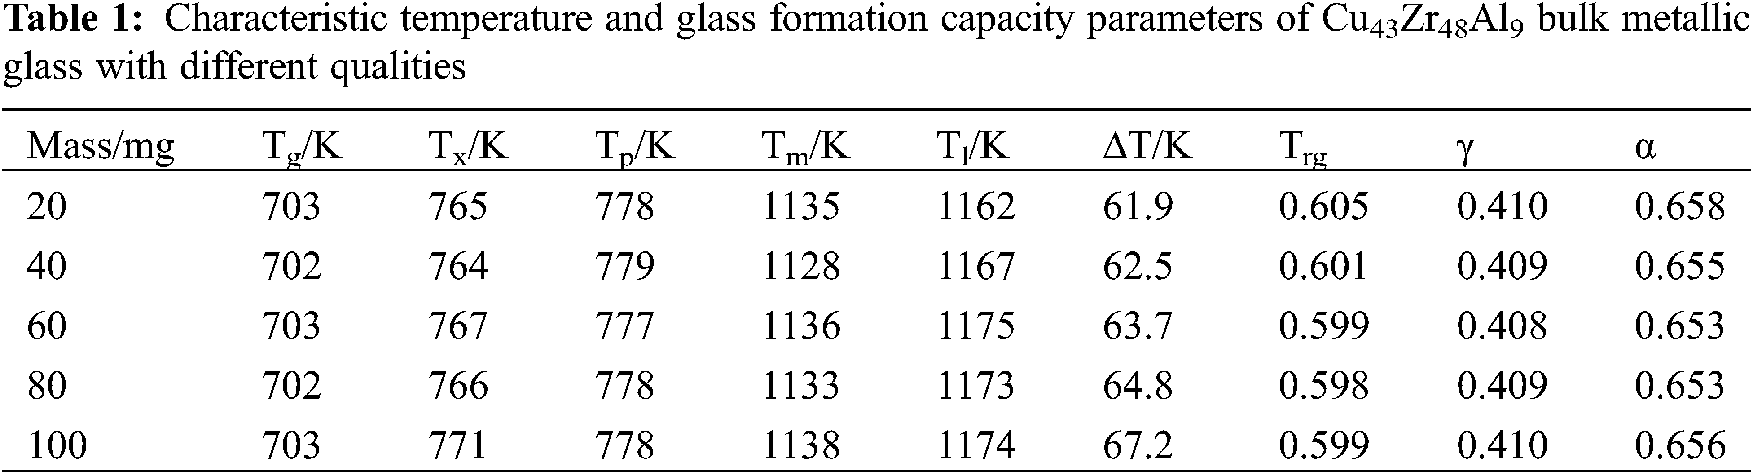
From Fig. 3 and Table 1, with Cu43Zr48Al9 as the research object and examining the five characteristics of temperature change trend, it can be seen that the change to Tg and Tp is the least and the change to Tl is the largest.
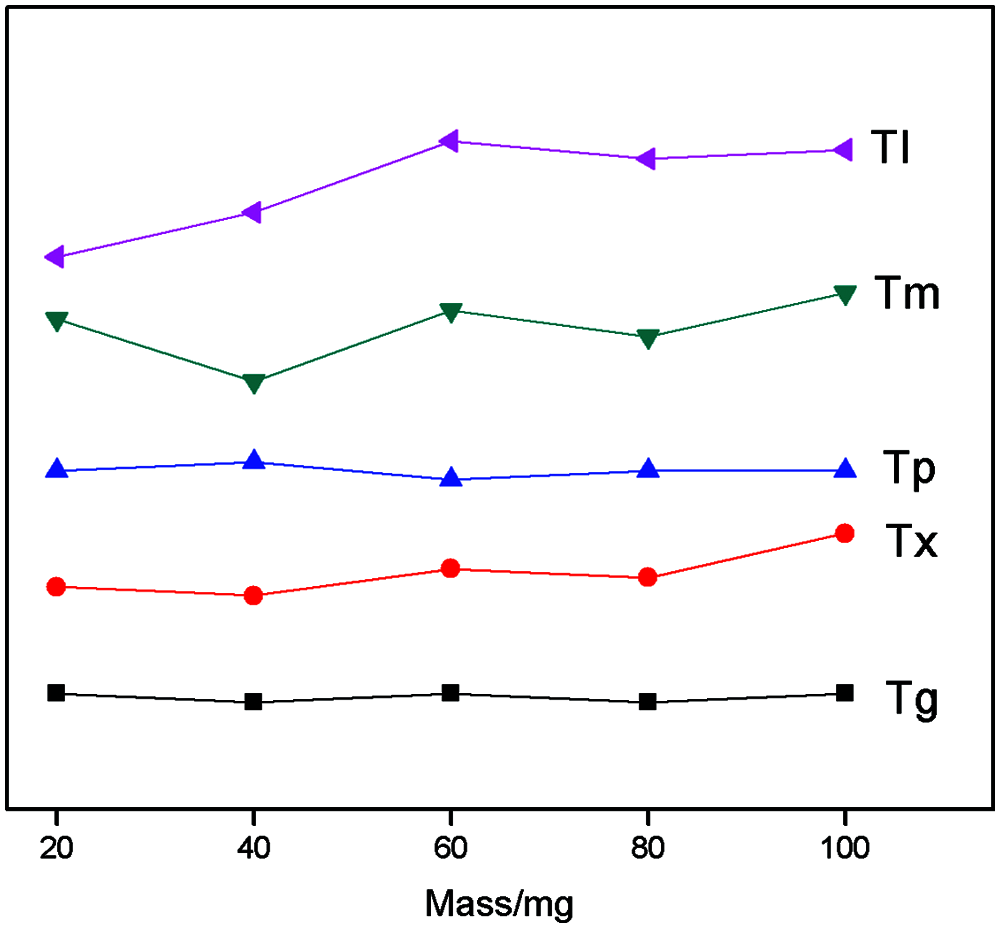
Figure 3: Characteristic temperature variation trend of Cu43Zr48Al9 bulk metallic glass with different qualities
The variation trend of GFA parameters ∆T, Trg, γ, and α of Cu43Zr48Al9 samples with different qualities can be seen in Fig. 4. Fig. 4a displays the trend of ∆T as sample quality changes; Fig. 4b shows the trend of Trg, γ, and α as sample quality changes. The figure shows that ∆T exhibits an increasing trend as the sample quality increases. Trg, γ, and α display a tendency of decreasing first and then increasing as sample quality increases. According to the comprehensive results, when the sample quality is 100 mg, ∆T, Tg, Tx, and Tp are larger, and demonstrate good thermal stability.
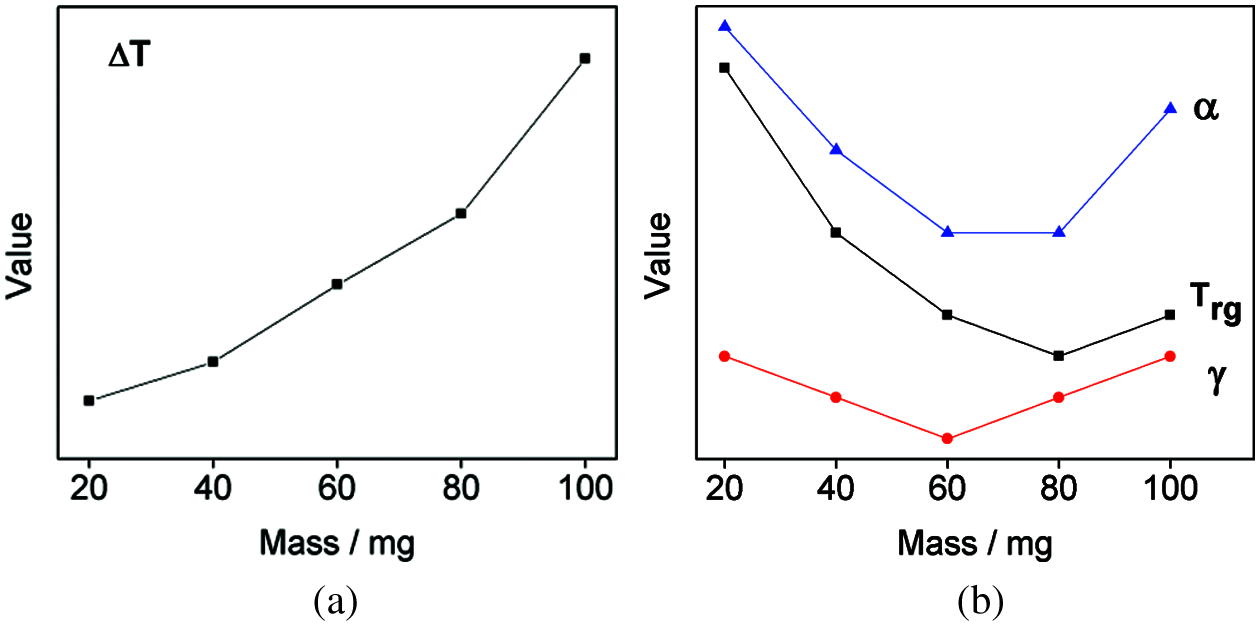
Figure 4: Variation trend of GFA parameters of Cu43Zr48Al9 with different mass (a) Mass-∆T (b) Mass-Trg, γ and α
3.2 Influence of Specific Surface Areas on DSC Test Results
Due to the different specific surface areas of the samples, differences were evident during the heating area of samples during the DSC test, and differences occurred during the process of heat conduction and the physicochemical reaction of samples. It is therefore necessary to study the influence of the specific surface area of samples on the characteristic thermodynamic temperature of bulk metal glass. The specific surface areas of samples A and B were 1.0 and 2.0. The DSC curves of Cu43Zr48Al9 with different specific surface areas can be seen in Fig. 5. The characteristic temperatures and glass formation capacity parameters of the measured results can be seen in Table 2.
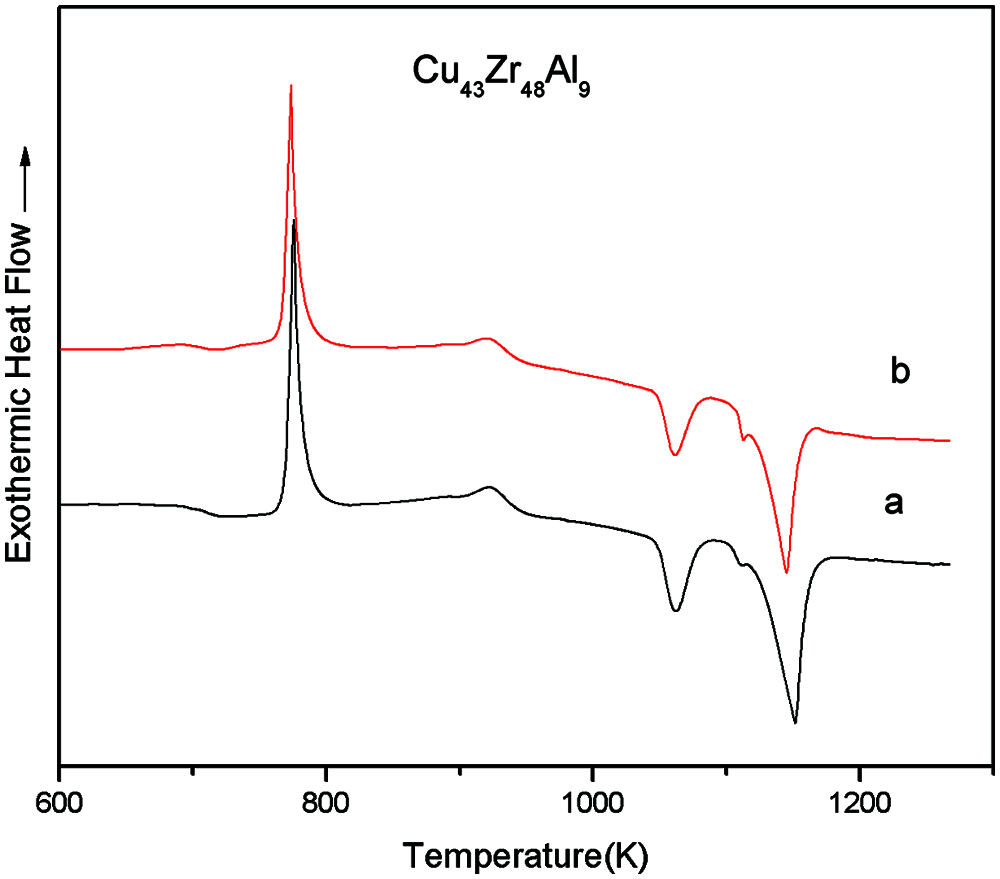
Figure 5: DSC curves of Cu43Zr48Al9 with different specific surface areas
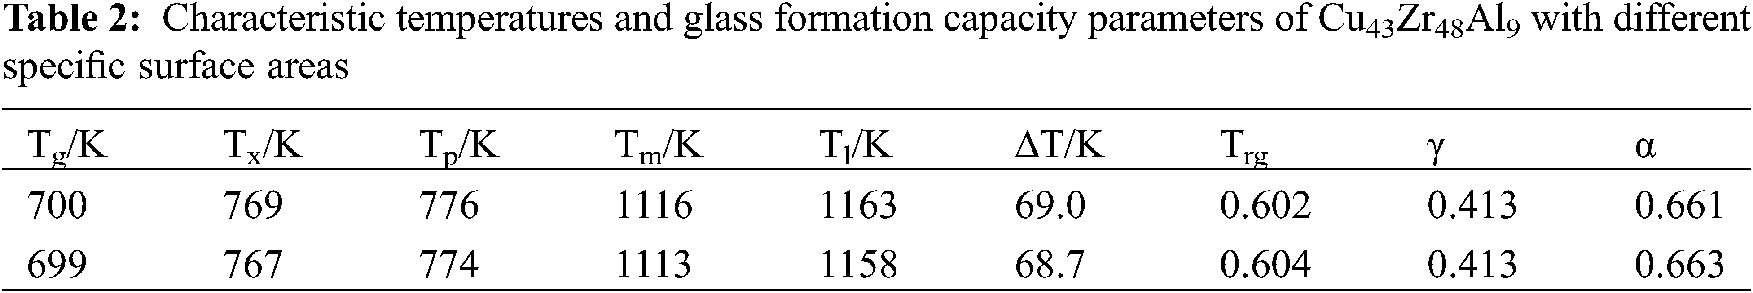
According to Fig. 5 and Table 2, the specific surface areas of samples have little influence on the DSC test results, Tg, Tx, Tp, and Tm have little influence, and Tl has great influence. It can be seen from GFA parameters ∆T, Trg, γ, and α that the specific surface area of the sample has little influence on the characteristic thermodynamic temperature.
3.3 Sample Crystal Relative to DSC Test Results
With the stepped sample bar (Fig. 6), the cooling rate of the sample bar decreases from 3 mm front end to 7 mm end. In the direction of increasing diameter, the proportion of non-crystals in the crystal phase gradually becomes smaller. Studying the influence of the sample crystal on characteristic thermodynamic temperature would better guide us to prepare suitable measurement samples.
The DSC curves of Cu43Zr48Al9 in different crystal phases can be seen in Fig. 7. The characteristic temperatures and glass formation capacity parameters of Cu43Zr48Al9 in different crystal phases can be seen in Table 3.
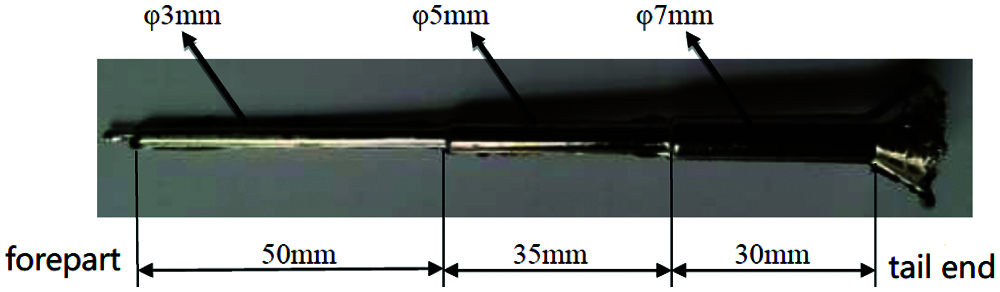
Figure 6: Sample photo
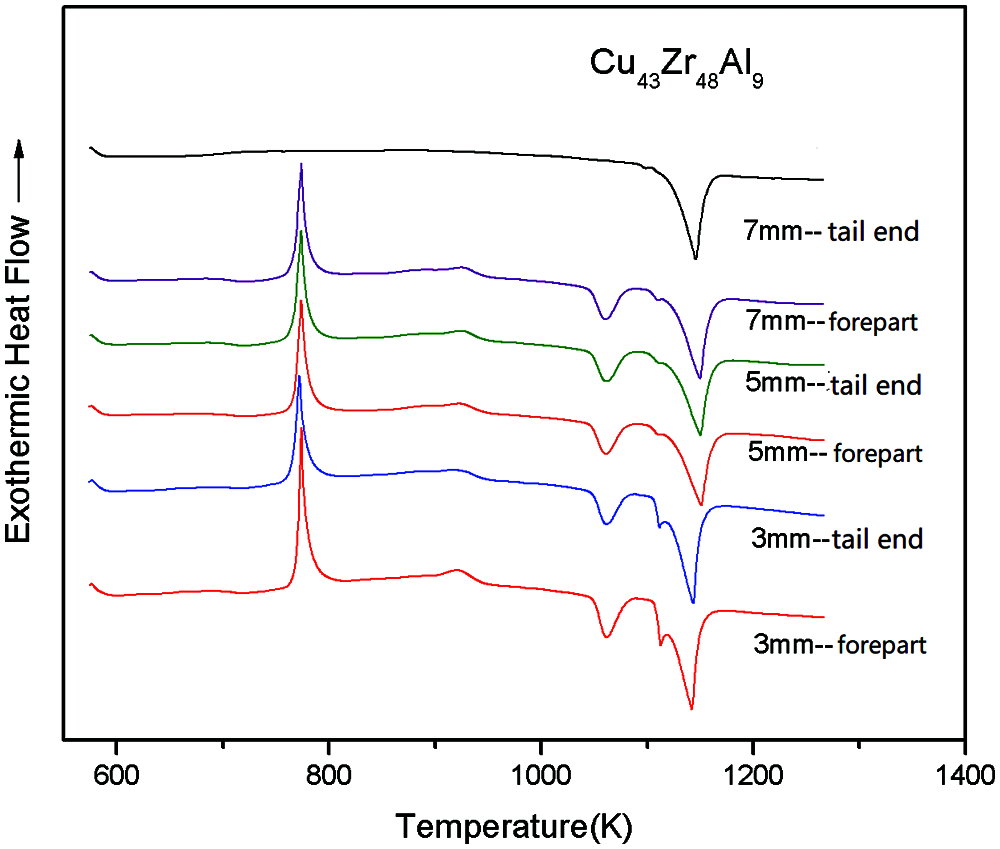
Figure 7: DSC curves of Cu43Zr48Al9 in different crystal phases
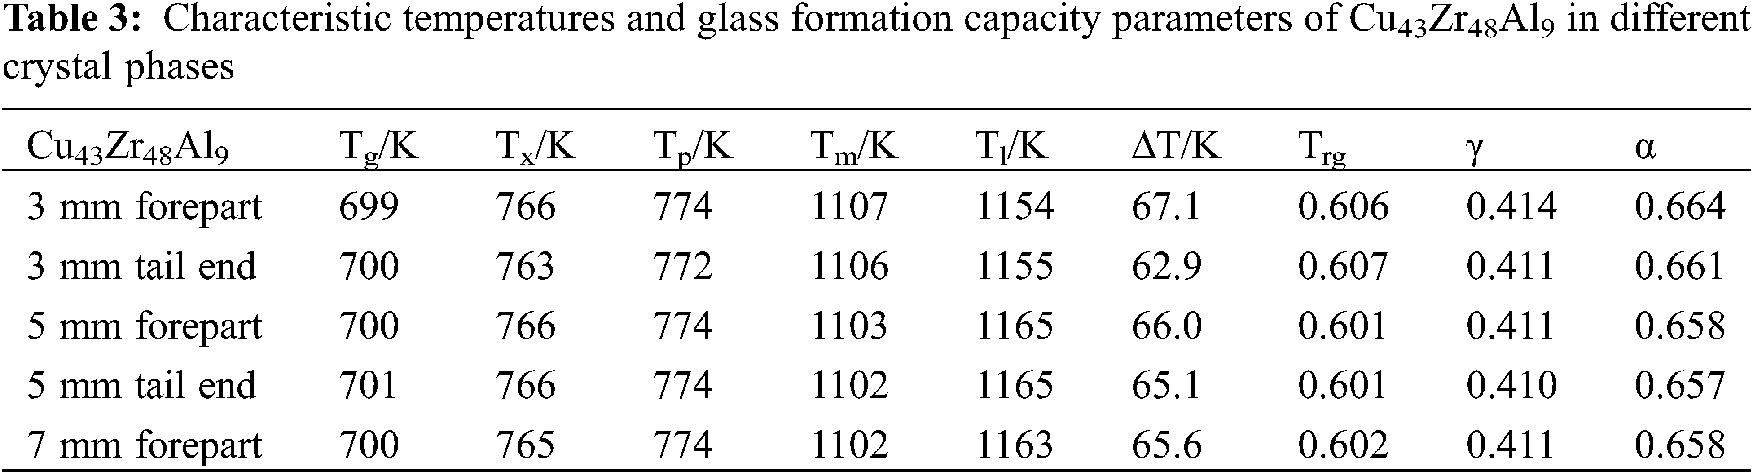
From Fig. 7 and Table 3, it can be seen that the change in crystal phase has little influence on the DSC measurement results. With the same sample, there is little difference in the Tg, Tx, Tp, and Tm of different crystal phases, with the smallest change evident in Tg and Tp, followed by Tx and Tm, and the largest being Tl.
Cu43Zr48Al9 samples under different crystal phases as the GFA parameters of ∆T, Trg, γ, and α can be seen in Fig. 8. Fig. 8a as for delta T as the change of sample crystal phase change trend, Fig. 8b for Trg, γ, α, as the change of sample crystal phase change trend, ∆ T change pattern, sample 3 mm good amorphous front-end crystal phase composition as so delta T is larger, showed good thermal stability. The changes of Trg, γ, and α have a tendency to decrease as the amorphous composition of the crystal phase decreases (from the 3 mm front end to the 5 mm end). Therefore, the sample with a diameter of 3 mm has a larger Trg, γ, and α, which demonstrates a better glass formation ability.
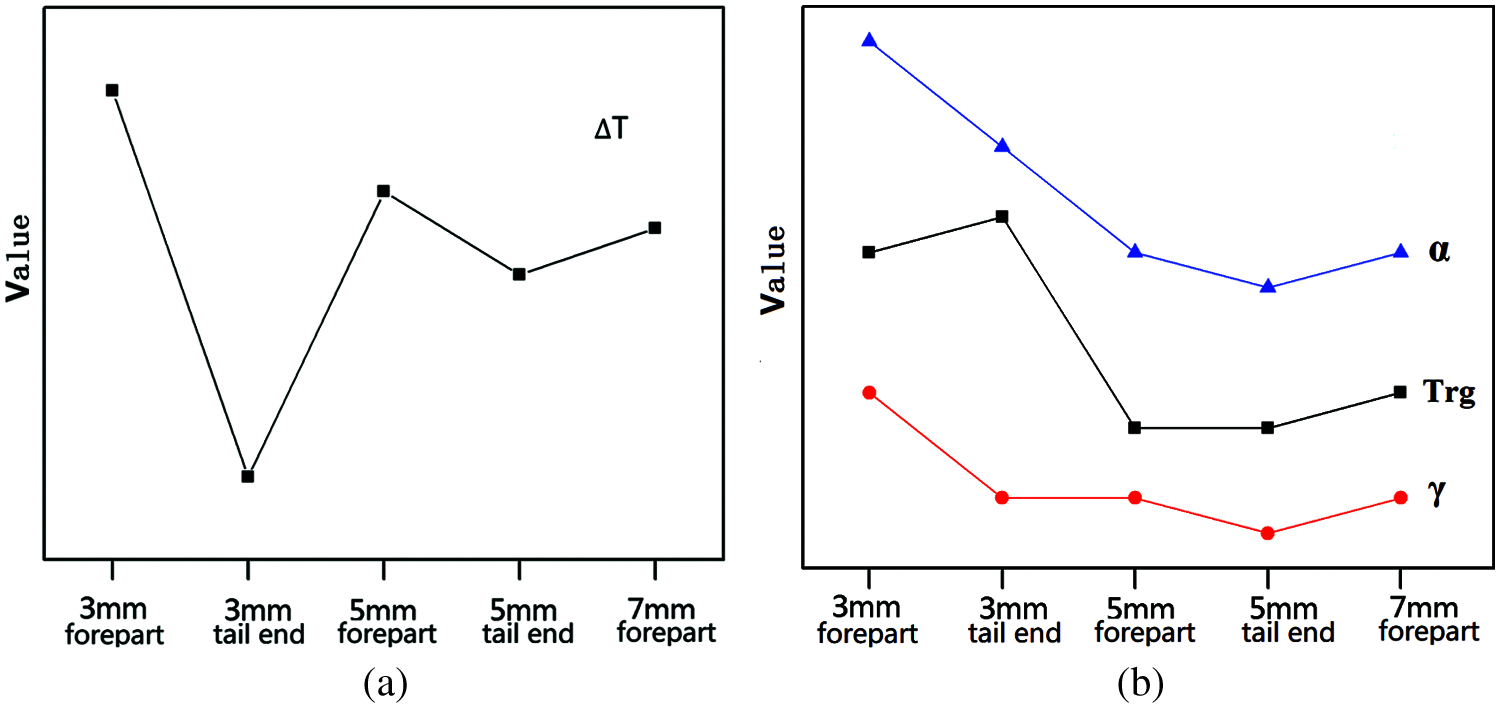
Figure 8: GFA parameter variation trend of Cu43Zr48Al9 in different crystal phases (a) Crystal phase-∆T (b) Crystal phase-Trg, γ, and α
As the position of amorphous alloy Cu43Zr48Al9 rod specimen is more backward (the diameter of 3 mm is set as the front), the amorphous content of the crystal phase decreases and ultimately crystallizes. From the 3 mm forepart end to the 7 mm forepart, the characteristic temperature point of the sample in the DSC measurement results exhibits very little change, and the 3 mm measurement data demonstrates good thermal stability.
3.4 Influence of Heating Rate on DSC Test Results
Different heating rates cause different amounts of heat to be received by test samples per unit of time. With test samples that have the same composition and state, the effects different heating rates have on their characteristic thermodynamic temperatures can be better studied, in order to better understand their thermostatic crystallization behavior. This paper has studied the Cu43Zr48Al9 DSC curves measured at 5, 10, 20, 30, 40 and 50 °C/min.
The DSC test curves of Cu43Zr48Al9 at different heating rates can be seen in Fig. 9, and the characteristic temperatures and glass formation ability parameters of the DSC measured results can be seen in Table 4.
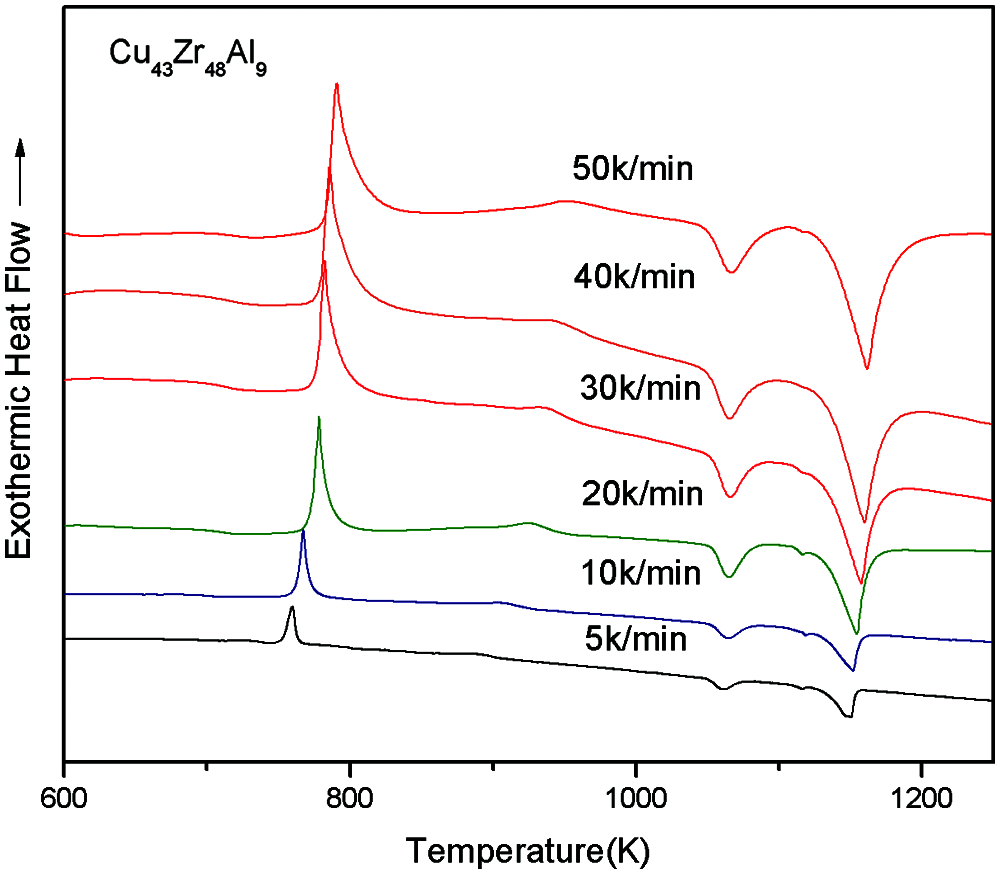
Figure 9: DSC curves under different heating rates
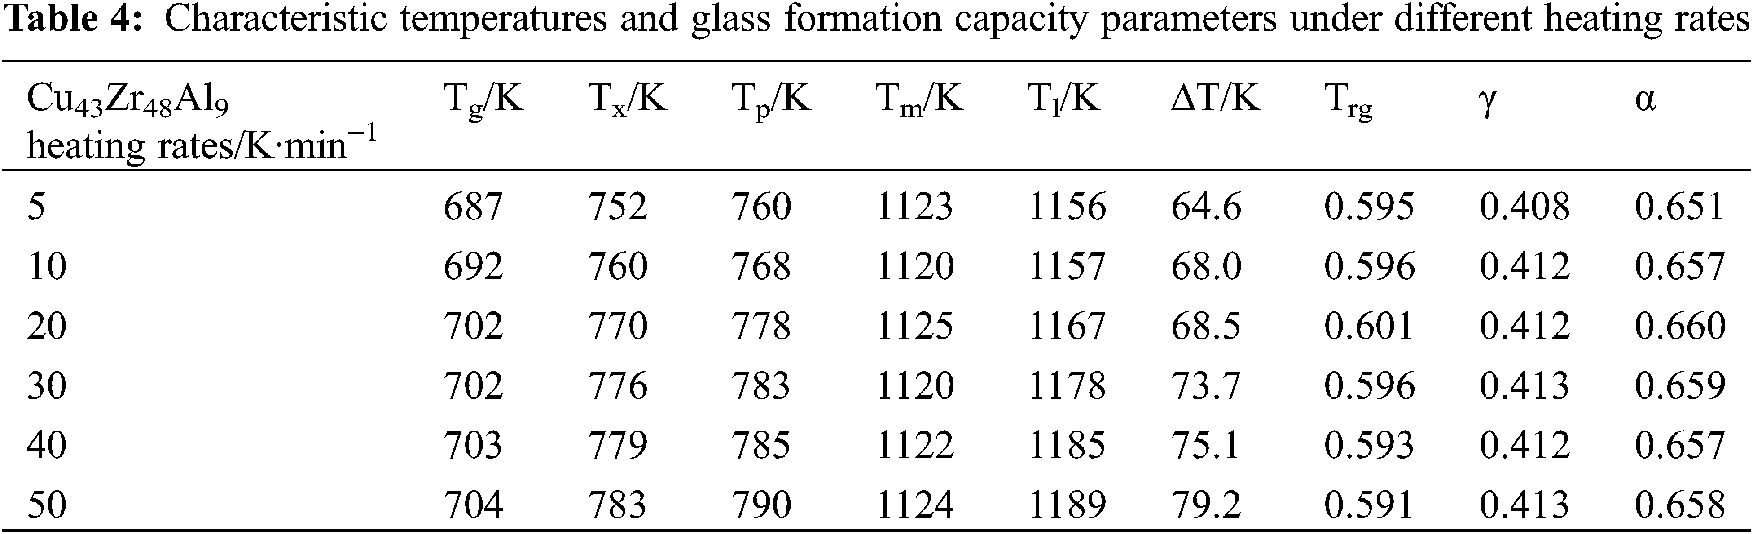
From Fig. 10 and Table 4, it can be seen that the heating rate of DSC measurement results shows the influence of a certain regular. As the heating rate increases, the characteristics of temperature Tg, Tx, Tp, Tm, Tl, almost all Tm and corresponding to high end mobile. This suggests that the glass transition and melting behavior of the amorphous alloy is a type of dynamic behavior of temperature dependence. Fig. 10 displays the variation trend of the characteristic temperatures of Cu43Zr48Al9 at varying heating rates. When heating rates are different, Tm changes the least, followed by Tg, and Tx, TP, and Tl are the most significant.
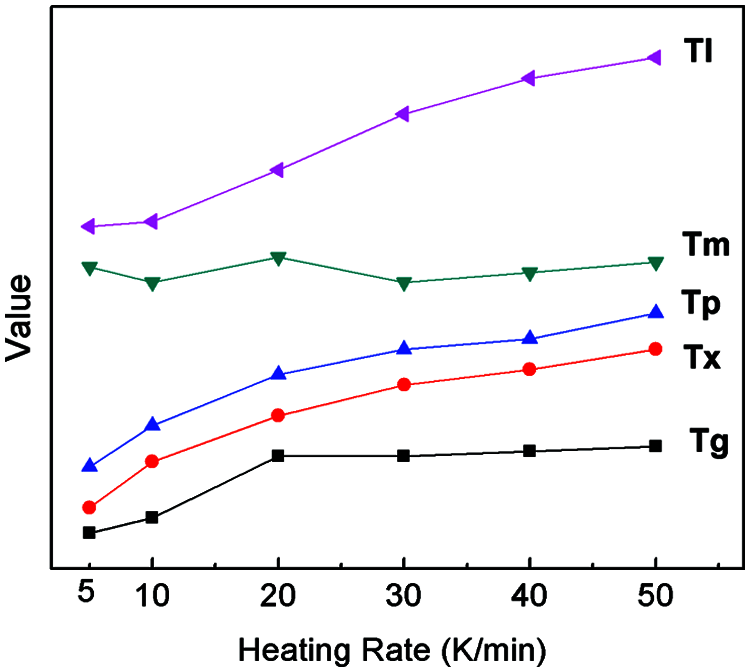
Figure 10: Trend of characteristic thermodynamic temperatures at different heating rates
The variation trend of GFA parameters ∆T, Trg, γ, and α of Cu43Zr48Al9 at different heating rates can be seen in Fig. 11. The higher the heating rate, the higher the value of ∆T. Trg, γ, and α show no obvious change rule, and α and Trg are the largest with a heating rate of 20 °C/min.
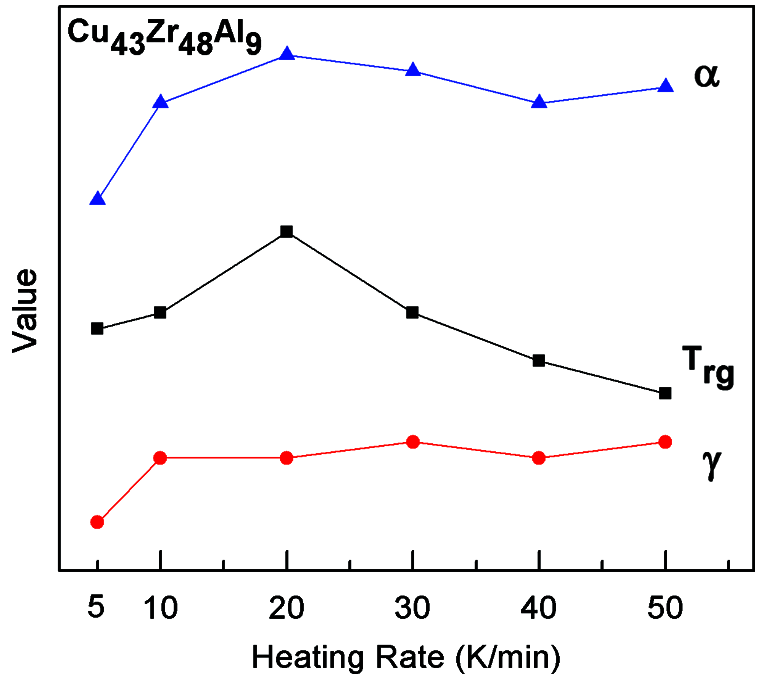
Figure 11: GFA parameter variation trend of Cu43Zr48Al9 at different heating rates
This paper has used Cu-Zr-Al bulk metallic glass as its research object for studying the influence different test conditions have on the thermodynamic temperature of amorphous characteristics and has reached the following conclusions:
1) The heating rate has a significant influence on the characteristic temperature points, and the five characteristic thermodynamic temperatures (Tg, Tx, TP, Tm, Tl) all increase in temperature as the heating rate increases. The GFA parameter ∆T also increases as the heating rate increases.
2) The sample mass, sample specific surface area, and thermodynamic temperature of the crystal relative to the amorphous characteristics of the sample have very little influence.
3) The influence degree of test conditions on the thermodynamic temperature of Cu-Zr-Al bulk metallic glass: sample surface area < sample crystal phase < sample mass < heating rate.
Funding Statement: This work was supported financially by the President Fund of Xi’an Technological University (No. 0852-302021407).
Conflicts of Interest: The authors declare there to be no conflicts of interest to report in relation to this study.
1. Yang, K., Fan, X., Li, B., Li, Y., Wang, X. et al. (2018). Non-isothermal crystallization kinetics in supercooled liquid region of Cu-Zr-Al-Y bulk metallic glass. Acta Metallurgica Sinica (English Letters), 31(3), 290–298. DOI 10.1007/s40195-017-0625-0. [Google Scholar] [CrossRef]
2. Yang, K., Fan, X., Li, B., Li, Y., Wang, X. (2017). Solidification microstructures of Cu-Zr-Al-Y BMG produced by casting in a wedge-shaped copper mold. International Journal of Materials Research, 108(3), 202–207. DOI 10.3139/146.111464. [Google Scholar] [CrossRef]
3. Li, B., Li, Y., Yang, K., Li, J., Fan, X. (2016). Effect of yttrium addition on the non-isothermal crystallization kinetics and fragility of Cu-Zr-Al bulk metallic glass. Thermochimica Acta, 642(4648), 105–110. DOI 10.1016/j.tca.2016.08.001. [Google Scholar] [CrossRef]
4. Yao, Z., Qiao, J., Pelletier, J., Yao, Y. (2016). High temperature deformation behaviors of the Zr63.36Cu14.52Ni10.12Al12 bulk metallic glass. Journal of Materials Science, 51(8), 4079–4087. DOI 10.1007/s10853-016-9729-6. [Google Scholar] [CrossRef]
5. Ma, J., Hanan, J., Komanduri, R., Lu, H. (2012). Simulation of the deformation mechanisms of bulk metallic glass (BMG) foam using the material point method. Computer Modeling in Engineering & Sciences, 86(4), 349–384. DOI 10.3970/cmes.2012.086.349. [Google Scholar] [CrossRef]
6. Zhang, C., Wang, J., Qiu, N., Xie, K., Li, H. (2015). Cerium addition on pitting corrosion of (Cu50 Zr50)100–2xCe2x (x = 0, 1, 2 and 3) metallic glasses in seawater metallic glasses in seawater. Journal of Rare Earths, 33(1), 102–106. DOI 10.1016/S1002-0721(14)60389-6. [Google Scholar] [CrossRef]
7. Li, P., Meng, F., Wang, Y., Dong, M., Shi, J. et al. (2015). Glass forming ability and thermodynamic properties in novel La-Al-Cu-Co bulk metallic glasses. Journal of Rare Earths, 33(9), 972–976. DOI 10.1016/S1002-0721(14)60514-7. [Google Scholar] [CrossRef]
8. Deng, L., Zhou, B., Yang, H., Jiang, X., Jiang, B. et al. (2015). Roles of minor rare-earth elements addition in formation and properties of Cu-Zr-Al bulk metallic glasses. Journal of Alloys and Compounds, 632, 429–434. DOI 10.1016/j.jallcom.2015.01.036. [Google Scholar] [CrossRef]
9. Rady, M., Arquis, E. (2010). A comparative study of phase changing characteristics of granular phase change materials using DSC and T-History methods. Fluid Dynamics & Materials Processing, 6(2), 137–152. DOI 10.3970/fdmp.2010.006.137. [Google Scholar] [CrossRef]
10. Tong, D., Qin, S., Lin, J., Sun, J., Hu, Y. (2021). Thermal analysis of a novel oil cooled piston using a fluid-solid interaction method. Fluid Dynamics & Materials Processing, 17(4), 773–787. DOI 10.32604/fdmp.2021.013425. [Google Scholar] [CrossRef]
11. Carandente, V., Savino, R., Iacovazzo, M., Boffa, C. (2013). Aerothermal analysis of a sample-return reentry capsule. Fluid Dynamics & Materials Processing, 9(4), 461–484. DOI 10.3970/fdmp.2013.009.461. [Google Scholar] [CrossRef]
12. Yu, P., Huang, C., Liu, L., Guo, H., Liu, C. (2020). Heat and mass transfer characteristics of alkali metals in a combined wick of high-temperature heat pipe. Fluid Dynamics & Materials Processing, 16(2), 267–280. DOI 10.32604/fdmp.2020.06528. [Google Scholar] [CrossRef]
13. Zhang, J., Wang, L., Zhang, C., Bai, S. (2020). Influence of steam and sulfide on high temperature selective catalytic reduction. Fluid Dynamics & Materials Processing, 16(3), 615–621. DOI 10.32604/fdmp.2020.09654. [Google Scholar] [CrossRef]
 | This work is licensed under a Creative Commons Attribution 4.0 International License, which permits unrestricted use, distribution, and reproduction in any medium, provided the original work is properly cited. |