| Fluid Dynamics & Materials Processing |
DOI: 10.32604/fdmp.2022.018186
ARTICLE
The Effect of the Gap Ratio on the Flow and Heat Transfer over a Bluff Body in Near-Wall Conditions
1School of Mechanical Engineering, Nantong University, Nantong, 226019, China
2School of Mechanical Engineering, Nantong Institute of Technology, Nantong, 226019, China
*Corresponding Author: Guannan Xi. Email: guannanxi@ntit.edu.cn
Received: 06 July 2021; Accepted: 20 August 2021
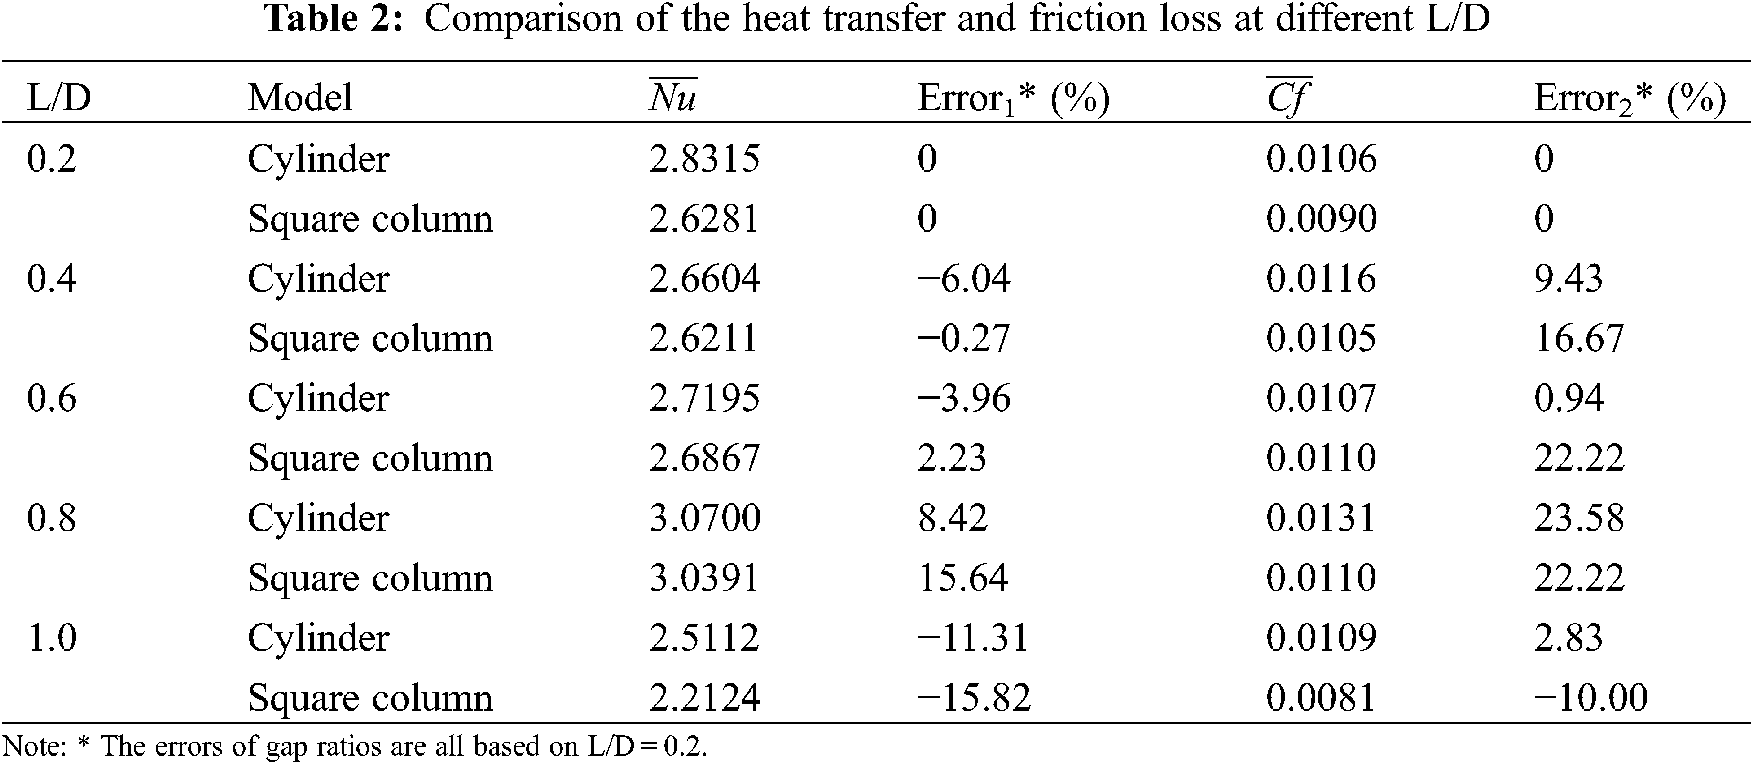
Abstract: In order to study the effect of different gap ratios on the thermofluid-dynamic field around a bluff body located in proximity to a heated wall, a series of experiments and numerical simulations have been conducted. The former were carried out using an open circulating water tank experimental platform and a single cylinder and square column as geometrical models (their characteristic length being D). The latter were based on the well-known SIMPLE algorithm for incompressible flow. The results show that the gap ratio is an important factor affecting the wake characteristics of near-wall bluff bodies. When the gap ratio is small, the influence of the wall on the bluff body wake is large. With an increase in the gap extension, periodic vortex shedding is enabled and heat transfer is strengthened accordingly; in addition, the vortex shedding period is larger for the square column. The square column displays hysteresis compared with the cylinder at the same gap ratio (the critical gap ratio of cylinder is 0.2∼0.4, while that of square column is 0.4∼0.6).
Keywords: Transition flow; gap ratio; near-wall; flow characteristic; enhanced heat transfer
Nomenclature
| | Time-spatial averaged Skin Friction Coefficient |
| | Time-averaged Skin Friction Coefficient |
| Cp | Specific heat capacity |
| D | Characteristic length of model |
| k | Thermal conductivity |
| L | Gap between the model and wall |
| L/D | Gap ratio |
| | Time-spatial averaged Nusselt Number |
| | Time-averaged Nusselt Number |
| P | Pressure |
| Re | Reynolds Number |
| Reg | Grid Reynolds Number |
| T | Temperature of fluid |
| t | Time |
| Uin | Mainstream velocity |
| ΔXmax | The maximum grid size |
| ΔXmin | The minimum grid size |
| Greek Symbols | |
| δ | Thickness of the boundary layer |
| ρ | Density of fluid |
| μ | Dynamic viscosity |
| ϕ | Transport variables |
| Γϕ | Diffusion coefficient |
| | Source term |
Energy is the basis for the survival and development of the industrial field, its total consumption continues to grow in recent years, how to improve energy efficiency is a problem that we need to pay attention to. When the fluid flows on the wall, there will be a boundary layer [1]. Affected by the boundary layer, there will be disturbance near the wall. Inserting a bluff body near the wall can effectively destroy the wall boundary layer, and make the stable flow state near the wall change to the unstable flow state in advance, so as to change the flow state of the flow field. This has been applied in the design of heat exchanger, enhanced heat transfer in the tube is an effective way to improve the energy utilization and heat transfer efficiency.
According to the previous research results, we generally accept that the flow is insensitive to Re, but strongly depends on L [2]. Most experimental studies are carried out at Re
In addition, the heat transfer over near-wall cylinder are also studied. Fujita et al. [8] obtained the distribution of heat transfer coefficient through experiment when L/D = 0∼1.0 at Re = 7.0 × 10³. They found that D, Uin, δ and the insertion position all have an impact, but gap ratio is the main factor. Suzuki et al. [9] studied the flow over near-wall cylinder with different gap ratio in turbulence through experiment. It was demonstrated that the interaction between the cold fluid flowing to the wall and the hot fluid flowing out of the wall is the main reason for the difference between heat transfer and momentum transfer. Wang et al. [10] demonstrated that the variation of turbulent boundary layer and the heat transfer performance is significantly related to the interaction between the cylinder and the wall boundary layer through large eddy simulation (LES).
Compared with the cylinder, the flow over near-wall square column has received limited attention. Martinuzzi et al. [11] studied the pressure distribution of near-wall square column with L/D = 0.07∼1.6 at Re = 1.89 × 10³ and δ = 0.5D. They found that four gaps related to the flow patterns. Durao et al. [12] analyzed the frequency spectrum of flow over square column with different gap ratio at Re = 1.4 × 10⁴. It was concluded that 0.35 is the critical gap ratio to suppress the vortex street. Bosch et al. [13] conducted a visualization experiment on the flow over near-wall square column at Re = 2.2 × 10⁴. It was found that the critical gap ratio to suppress vortex shedding is 0.35∼0.5.
In terms of the effect on heat transfer over near-wall square column, Yao et al. [14] studied it at Re
Generally speaking, most studies are mainly on laminar or turbulence, little research on heat transfer enhancement on transition flow has been concerned. The critical value from transition flow to turbulence is difficult to determine. However, the flow instability on transition flow usually shows the law of periodicity or quasi periodicity, which is different from the randomness of turbulence. It is highly significant to study the condition on transition flow. And the research on near-wall cylinder and square column on transition flow is still lack of further comparison and induction. This can play a certain theoretical guiding role for practical application in some engineering fields. In this study, we choose Re = 300 to study them with same characteristic length D in the same experimental device, so that they can be compared directly.
2 Experimental Facility and Instrumentation
The test bench includes the water tank, water pump, diaphragm valve, honeycomb device, rectification, contraction, test and transition sections, as shown in Fig. 1. Water is driven from the lower tank to the upper tank by the water pump firstly. The flow velocity is controlled by diaphragm valve, then water flows into the rectification section and contraction section. There are two different honeycomb devices in the rectification section, which ensure the acceleration and rectification of the flow. In order to prevent the back flow from affecting the test, the transition section is set much longer. At last, water flows into the lower water tank through the right water tank and the bottom pipe, thus forming a complete circulation process.
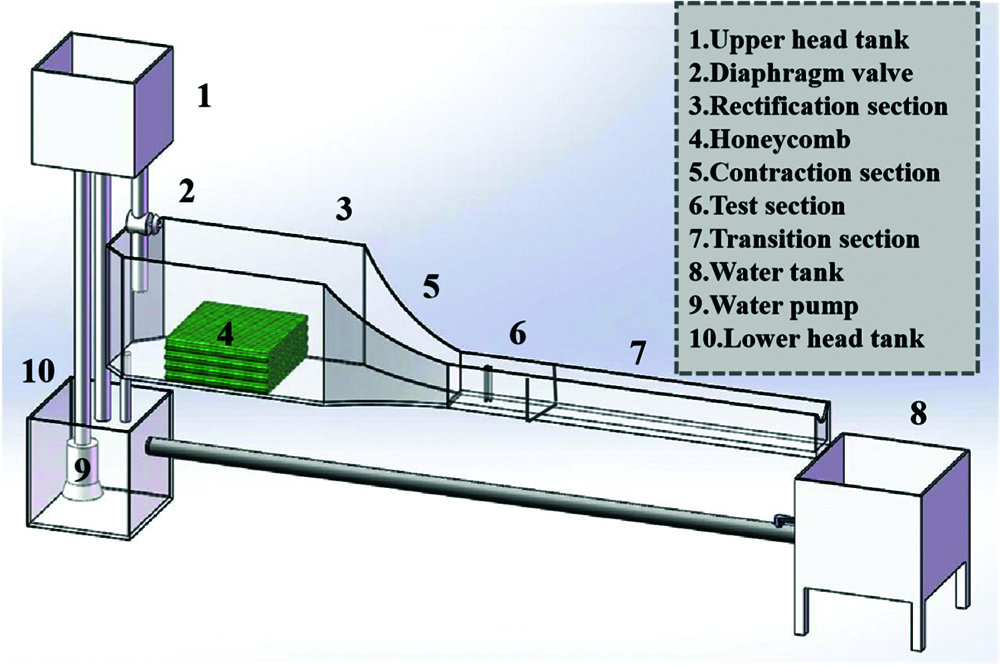
Figure 1: Schematic of open-loop, recirculating water test bench
2.2 Particle Image Velocimetry (PIV) System
Fig. 2 shows the schematic of PIV System, which includes a dual-pulse laser, cooler, CCD camera, synchronous controller, and computer. Silver-plated hollow glass spheres (13∼15 μm in diameter) with good light scattering and follow ability are added into test bench as tracer particles. Experimental models are made of smooth and transparent acrylic material, which can effectively suppress the optical pollution caused by reflection. The synchronization controller can synchronize the frequency of laser and camera. The laser produces a sheet light source to water surface and irradiates vertically in the middle of models.Meanwhile, the camera takes photos of the shooting area which are transmitted to computer in real time. Then all photos are post-processed by software (Insight 4G) to obtain the information we need.
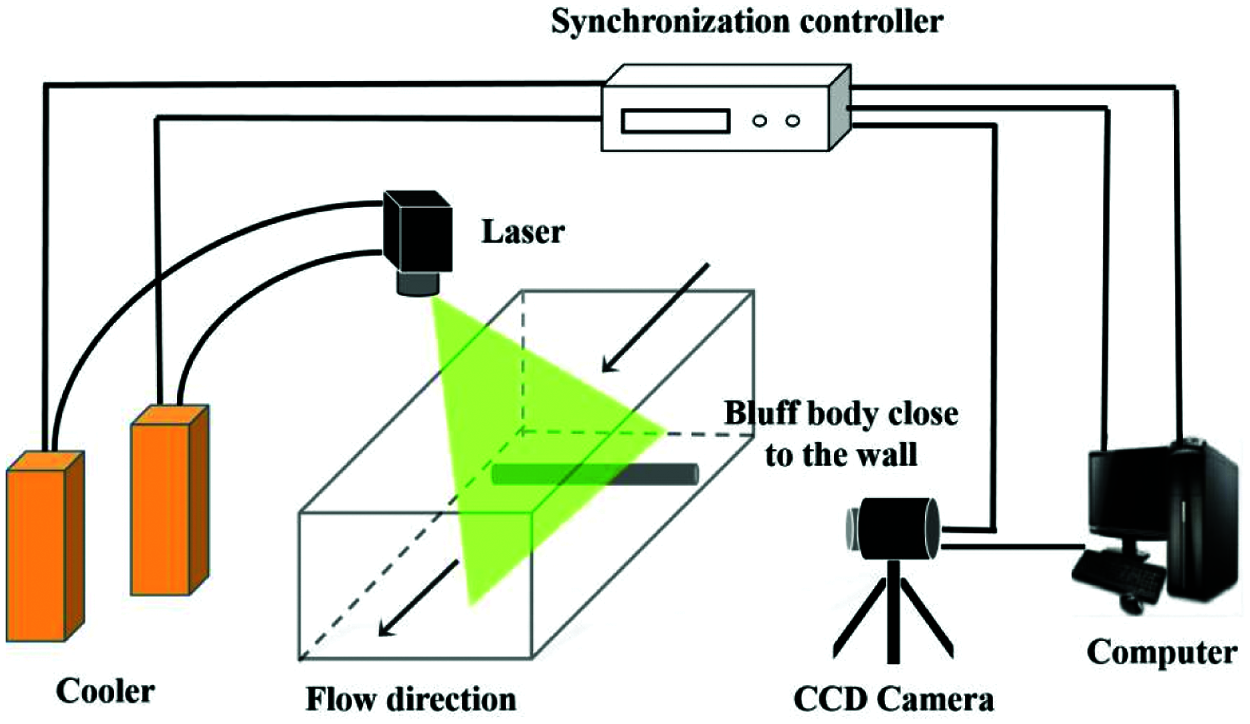
Figure 2: Schematic of PIV system
Fig. 3 shows the schematic of shooting area.In this study, the Reynolds Number Re is defined by the following equation:
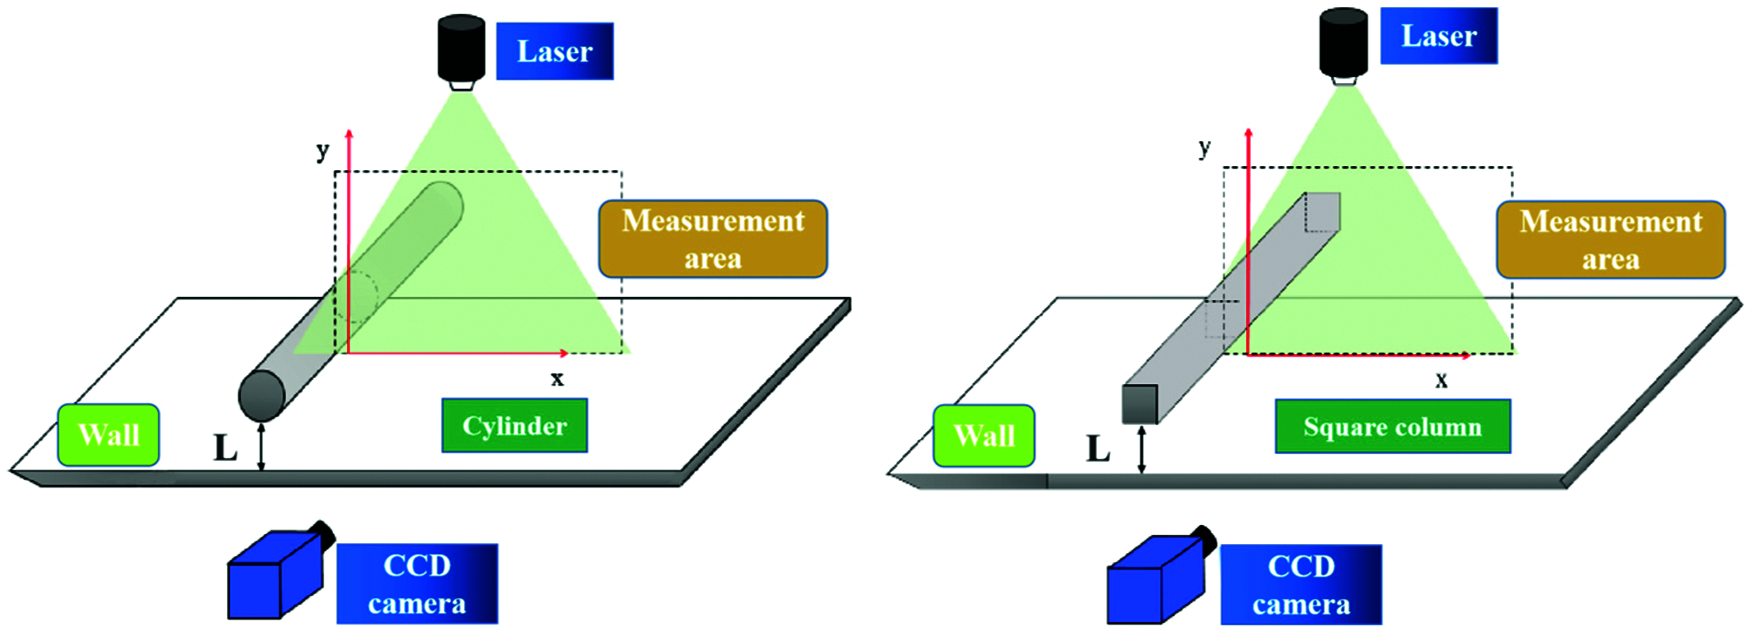
Figure 3: Schematic of the shooting area
In experiment, we choosed Re = 300, T = 25°C, and D = 15 mm. The frequency of laser is 20 Hz, 400 photos are taken with CCD camera in each condition.
The schematic of verifying the stability of test section is shown in Fig. 4. In the middle of X direction, we selected 60 points to obtain the average velocity distribution in the horizontal direction as shown in Fig. 5a. We can see that the water flow is relatively stable in middle position. Then we selected 15 laser surfaces in Z direction, and selected the same x and y coordinate points on these 15 sections to obtain the velocity vector diagram of each point. As shown in Fig. 5b, the velocity is approximately equal in the horizontal plane of 50∼250 mm, which means the flow is stability and uniformity.
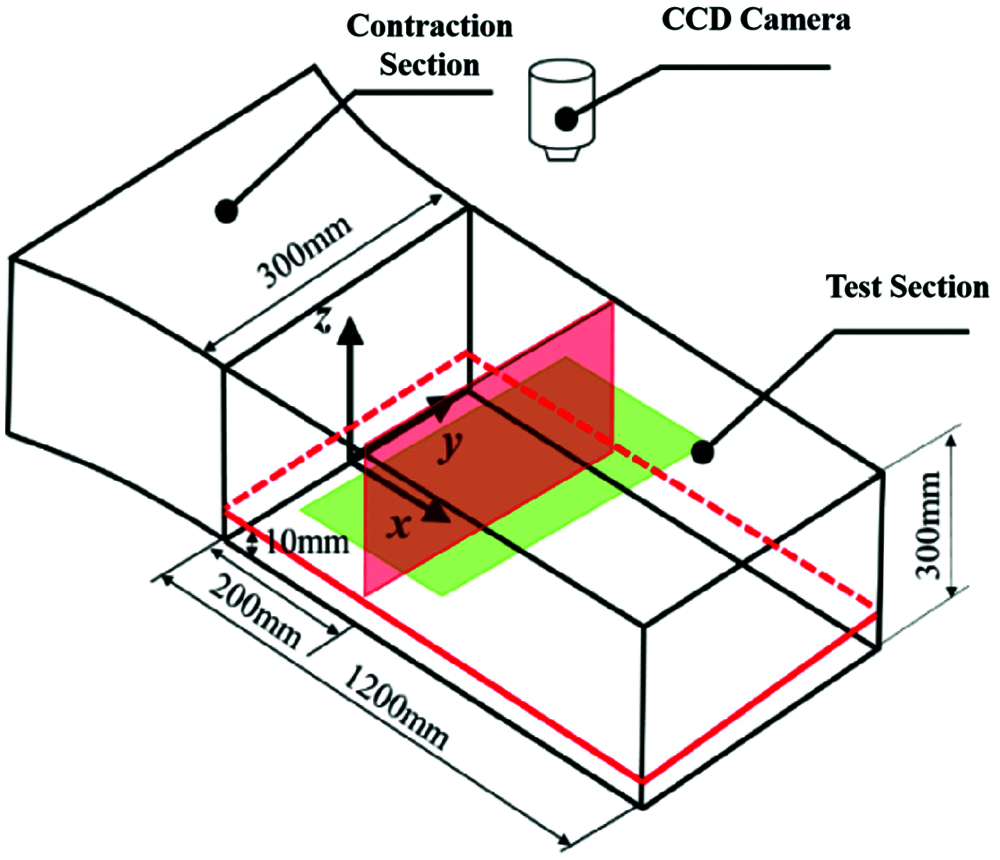
Figure 4: Schematic of test section verification
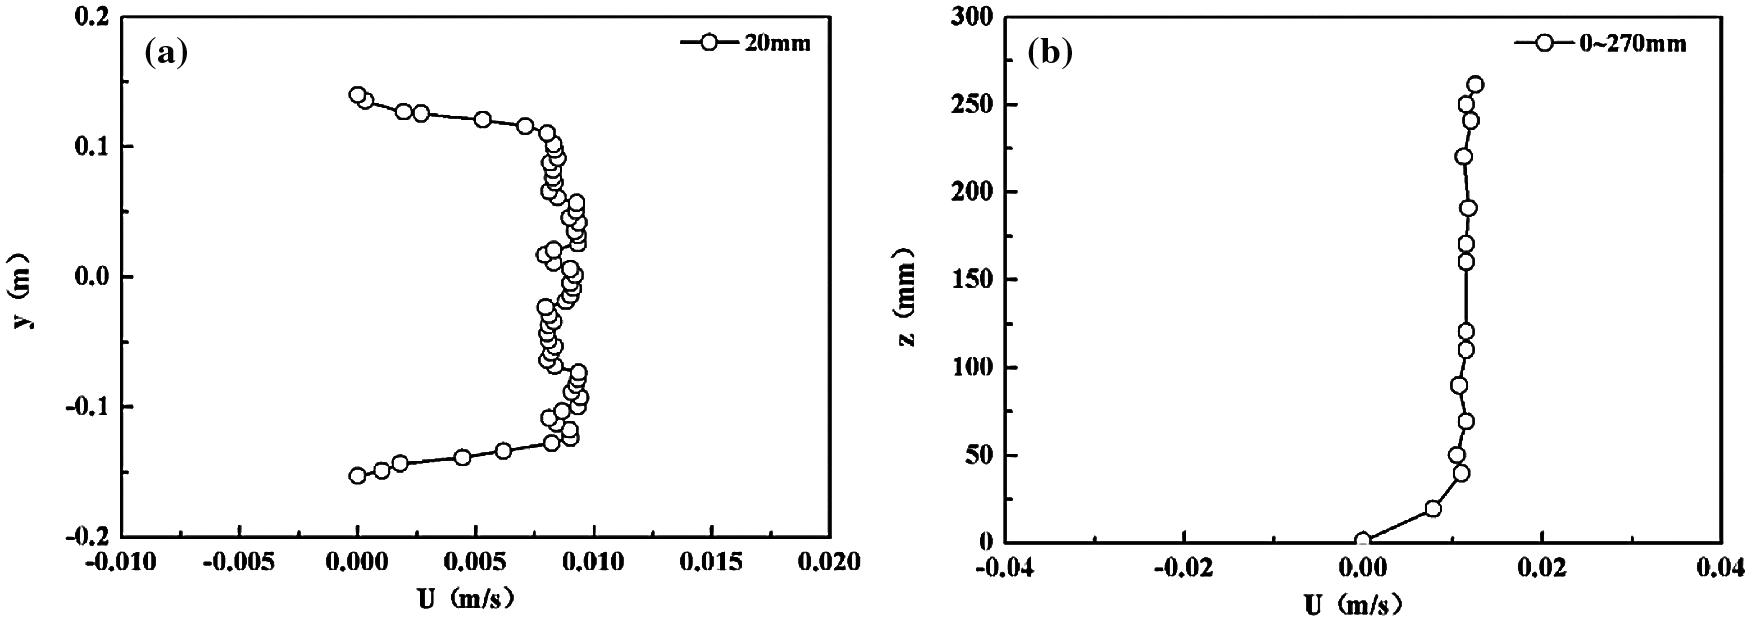
Figure 5: The average velocity distribution (a) the horizontal direction; (b) the vertical direction
3 Numerical Calculation Models and Methods
In recent years, computational fluid dynamics (CFD) has developed rapidly due to the rapid progress of computer technology. The software Fluent we used in this study is a commercial CFD software package with high popularity in the world, which has strong universality.
3.1 Numerical Calculation Model and Boundary Conditions
The numerical calculation models is shown in Fig. 6. X is the direction of flow, the Y direction is perpendicular to the X direction. H its the height of test section. The red wall (Hot Wall) represents the uniformly heated wall, Twall = 328 K. Two models are not heated.The inlet boundary (Xup) and outlet boundary (Xdown) are 15D and 70D from the model, respectively. Tin is inlet temperature, Tin = 298 K.
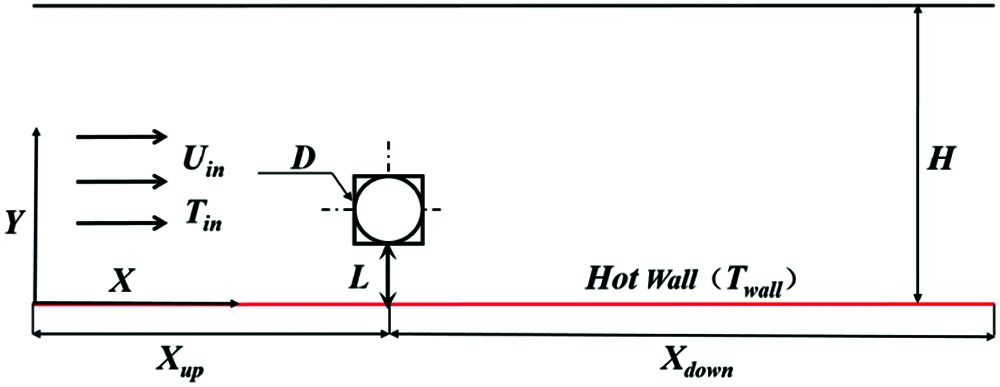
Figure 6: Schematic of numerical calculation models
In this study, the continuous and incompressible water (physical parameters are constant) was assumed, and it belongs to two-dimensional numerical simulation. The governing equations can be considered as follows:
Momentum equation in X direction:
Momentum equation in Y direction:
Energy equation:
As shown in Fig. 7, in order to effectively capture characteristics of the separated shear layer around models, an O-type grid was used and further refined around the cylinder; for the square column, the surrounding grid is directly performed encryption. In order to ensure the calculation accuracy, the maximum grid width does not exceed 15 times the minimum grid width.
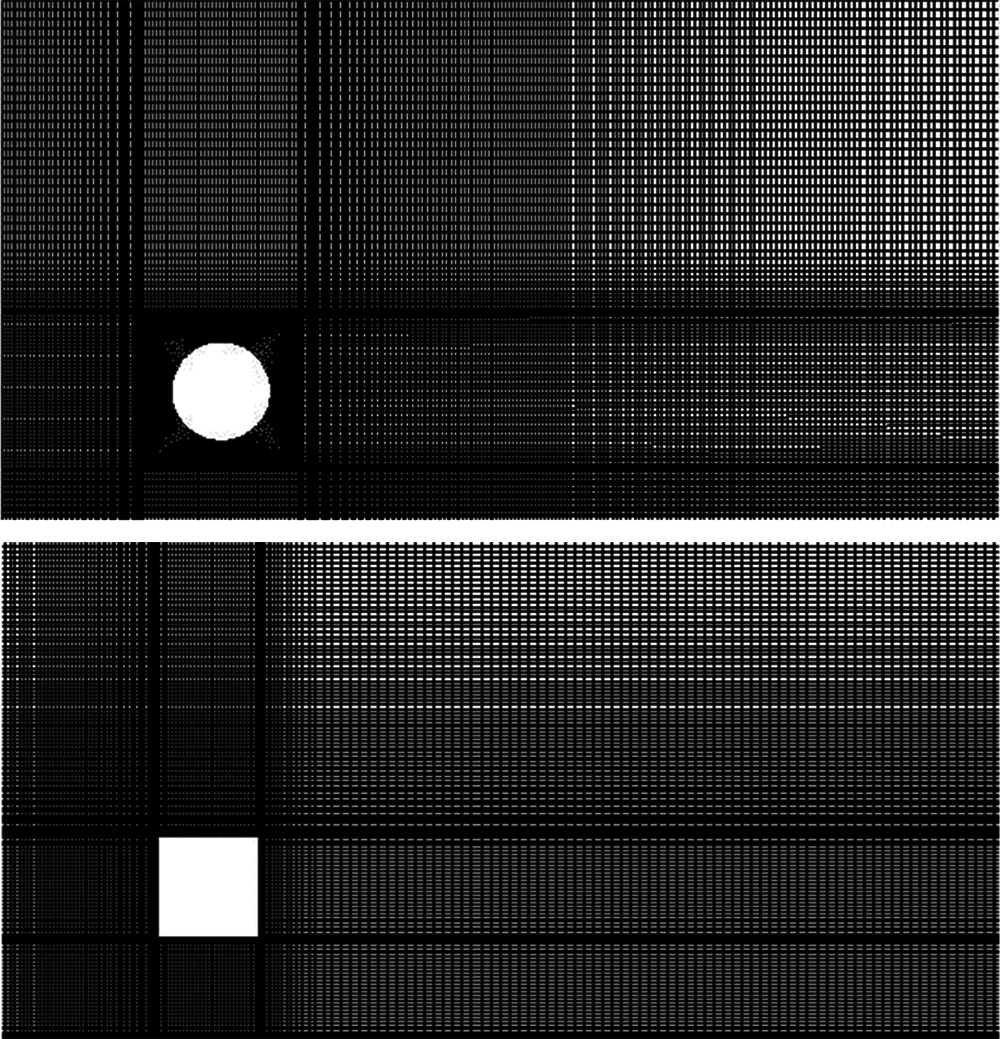
Figure 7: Locally enlarged grids distribution of models
3.4 Discretization of Governing Equations
The Finite Volume Method (FVM) commonly used in numerical heat transfer has accurate integral conservation, and the coefficients of the discrete equation have clear physical significance. Most CFD software such as Fluent and Flotherm both adopt this method.
We used this method to rewrite the above control Eqs. (2)–(5) into the general format, the equation is as follow:
Integrating the general form of the governing equation, the convection term adopts the first-order upwind style, the diffusion term adopts the central difference format, and the two-dimensional discretization equation of the following form is obtained:
3.5 Coupling and Correction of Pressure & Velocity
In the governing equations, the pressure as the source term appears in the momentum equation in the form of first derivative, the pressure and velocity are coupled with each other. As shown in Fig. 8, we use the SIMPLE Algorithm [18] based on staggered grid to correct the pressure field and velocity field in each iteration.
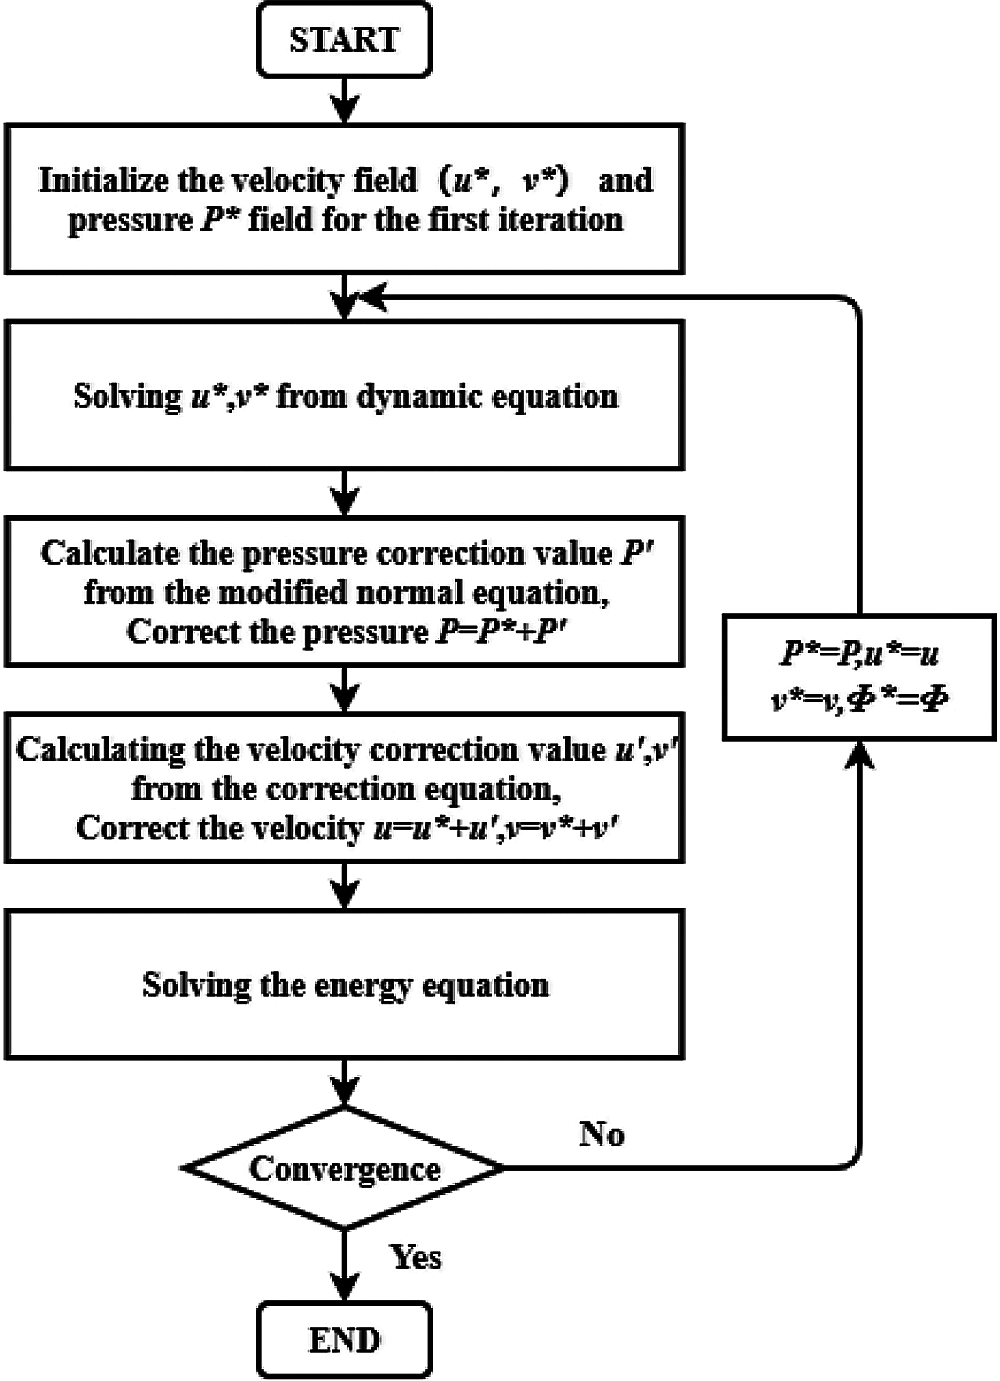
Figure 8: Flow chart of SIMPLE algorithm
3.6 Grid Independence Verification
The grid density has an important influence on calculation results. And Reg is used to represent the grid density [19], which is defined in Eq. (8).
Taking the near-wall single cylinder as an example, three different densities (Reg = 2, 6 and 10) grids were tested for numerical calculation, the values for local Nusselt number on the wall are shown in Fig. 9. The comparison shows that there are small differences between three densities at the peak. As shown in Table 1, the difference between Reg = 6 and Reg = 2 is very limited (only 0.908%). To balance the grid accuracy and the computing cost, Reg = 6 was chosen in this study.
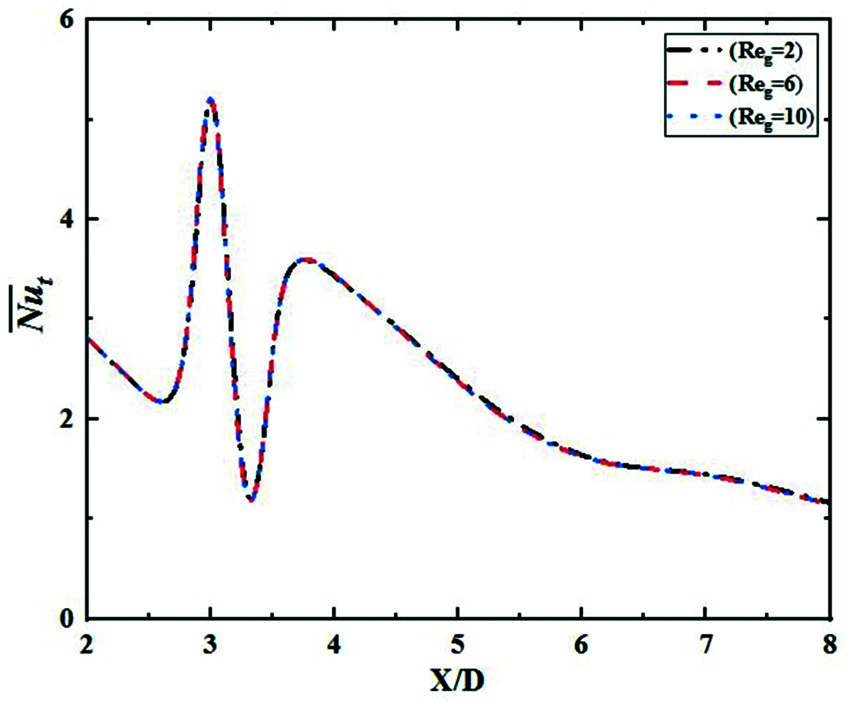
Figure 9: Grid independence verification
4.1 Numerical Simulation Verification
The instantaneous vorticity field of the case with L/D = 0.4 were chosen to verify the accuracy and reliability of the numerical calculations, Fig. 10 presents the comparison between numerical calculation and experiment results.

Figure 10: Comparison of simulation and experimental results (a) experimental results (b) simulation results
It can be seen that the numerical simulation result is in good agreement with the experimental results. For L/D = 0.4, the vorticity scale and intensity of them are basically same. It can be considered that the calculation results in this study are accurate and reliable.
4.2 The Time-Average Flow Field
Considering the generality of the time-averaged characteristics, the time-averaged streamline and velocity field (Figs. 11a and 11b) and vorticity of models are compared through experiment. In flow field, the changes of flow are mainly manifested in the changes of the separation shear layer and the scale of vortexes. Vorticity is generally defined as the curl of the velocity vector. In Figs. 12a and 12b, blue represents negative vortex which guides clockwise flow; red indicates positive vortex which guides counter clockwise flow. The depth of color indicates the strength of the vorticity.

Figure 11: (a): Time-averaged streamline of cylinder at different L/D (b): Time-averaged streamline of square column at different L/D

Figure 12: (a): Time-averaged vorticity of near-wall cylinder at different L/D (b): Time-averaged vorticity of near-wall square column at different L/D
When L/D = 0.2, flow over models forms a double-sided separation shear layer, the upper shear layer forms a clockwise recirculation, the vorticity intensity is high. At this time, the development of shear layer on the lower side is restrained, the velocity through the gap is accelerated, and a counter clockwise negative vortex is formed, a clockwise back flow is formed at a distance. When L/D = 0.4∼0.6, the vorticity intensity of clockwise vortex on the upper side is smaller, the shear layer on the lower side develops slowly. And the strength of counter clockwise vortex increases, a vortex pair with clockwise vortex on the upper side is formed. The scales of vortex pairs of square column is larger than before. When L/D = 0.8, the inhibition of the wall weakens, the scale and intensity of vortex gradually increase. The vortex pair behind square column is larger than that of cylinder. When L/D = 1.0, the inhibition is further weakened, the vortex pair behind models tends to be symmetrical. However, the scale and vorticity intensity of vortexes have no changes, which is similar to that without wall. It is indicated that the influence of the wall is already very small.
4.3 Analysis of the Velocity Section
In order to study the influence on the flow instability of the wall at different L/D, the cross-sectional distribution of time-averaged velocity was analyzed, as shown in Fig. 13. Take the case with L/D = 1.0 as an example, three sections were selected at X/D = 1.5, 3.0, and 4.5, respectively.

Figure 13: The velocity of different cross-sections of cylinder (a–c) and square column (d–f) at different L/D Single cylinder (a–c) Single square column (d–f)
At X/D = 1.5 section, the distribution of cylinder and square column are shown in Figs. 13a and 13d, respectively. When L/D = 0.2, the inhibitory effect of the wall is strong, the acceleration effect of flow is not obvious; when L/D = 0.4∼0.6, the near-wall velocity of cylinder is significantly accelerated, while it has not changed significantly for square column. When L/D = 0.8, the weakening of inhibitory effect causes the near-wall velocity of flow to increase continually. At this time, the reflux area at the far side of square column disappears, the velocity near the wall begins to increase significantly. When L/D = 1.0, the lower shear layer is fully developed, and the acceleration effect of flow near the wall reaches the strongest.
At X/D = 3.0, as shown in Figs. 13b and 13e, respectively. When L/D = 0.2, X/D = 3.0 is at the edge of the far clockwise recirculation zone, so the near-wall velocity of flow is almost zero, the wall disturbance is weak at this time. When L/D = 0.4, the velocity near the wall of cylinder does not change significantly, and the disappearance of the clockwise reflux area causes the velocity on the back of cylinder to increase significantly, the velocity of square column is also accelerated. When L/D = 0.6∼1.0, the velocity near the wall of models gradually increases, it reaches the fastest when L/D = 1.0.
At X/D = 4.5, as shown in Figs. 13c and 13f, respectively. When L/D = 0.2∼0.4, X/D = 4.5 section is near the clockwise recirculation zone, the near-wall velocity is negative at this time. When L/D increases to 0.6, the velocity on the back side of cylinder increases. However, there is still a clockwise recirculation zone in the far side of square column, and its velocity which is smaller than that of cylinder has no obvious change. When L/D = 0.8∼1.0, the velocity curve of square column is similar to that of X/D = 1.5 and 3.0. And the scale of the vortex pair behind cylinder is small at X/D = 4.5, resulting in less impact on the speed at the same conditions which makes it gradually close to the speed in the main flow.
4.4 Transient Periodic Flow Characteristics
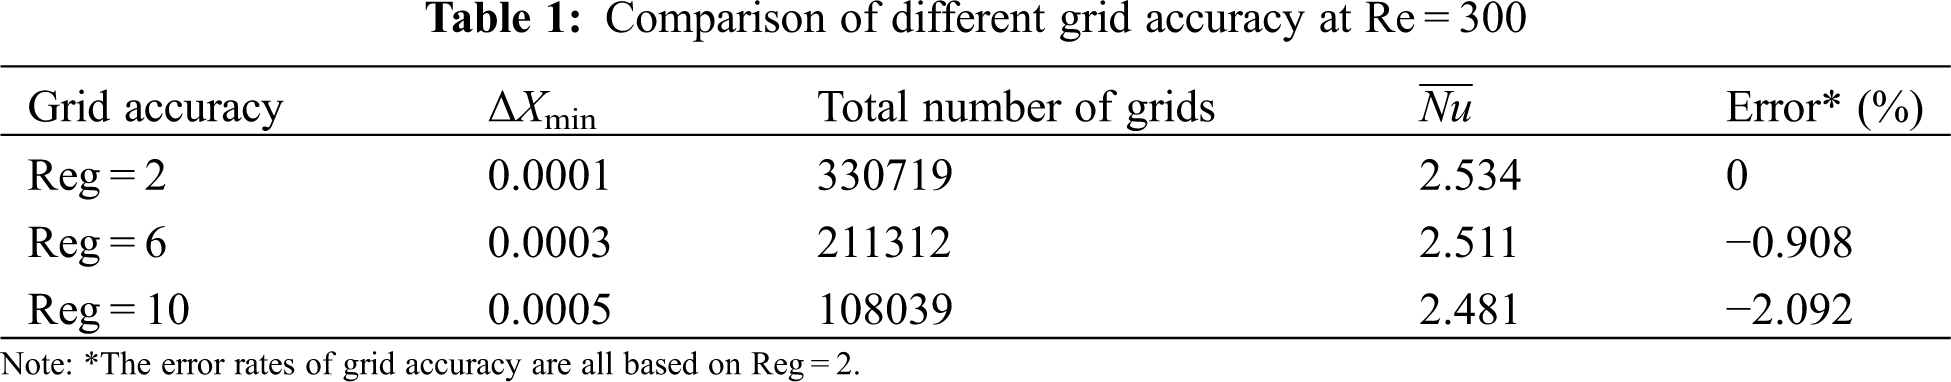
The flow field under the transition flow has a periodic change law. In order to explore the flow periodicity of near-wall models, the wake monitoring point in Y direction over time of the case with L/D = 0.2, 0.6, 1.0 was chosen to analyze. The point is selected at the position with a lateral distance of X = 2.5D from the center of models. The vertical distance varies with the change of gap.
Figs. 14 and 15 show the fluctuation diagram (V-t) and power spectral density diagram (PSDf) of velocity of the monitoring point in Y direction with time respectively. It can be seen that the velocity of two models varies irregularly with t near the horizontal axis. And the amplitude is relatively small at L/D = 0.2. The power spectral density also has different peaks at multiple frequencies, indicating that there is no periodic characteristics at this time.

Figure 14: Velocity fluctuation diagram at different L/D (a) Single cylinder (b) Single square column
Figure 15: Power spectral density diagram at different L/D (a) Single cylinder (b) Single square column
When L/D = 0.6, the amplitude of velocity of near-wall cylinder is bigger, while there is no obvious change for square column. The results show that there are peaks at frequency of 1.5 Hz and 1.2 Hz for two models, respectively, which means that the periodic vibration with main frequency of 1.5 Hz and 1.2 Hz are formed respectively. When L/D = 1.0, the vibration of velocity remains periodic and the main vibration frequency decreases slightly, but the amplitudes in Y direction of them are different. The amplitude of velocity and the disturbance degree of square column increases, while those of cylinder decreases. In general, the main vibration frequency for square column decreases gradually, which is slightly smaller than that of cylinder, indicating that the period of square column is much longer.
The preceding discussion shows that two models both have periodic characteristics. Therefore, the transient characteristics of flow in a periodic cycle are discussed in detail. The instantaneous streamlines and velocity magnitude fields in a periodic cycle for the case with L/D = 1.0 are presented in Figs. 16a and 16b. The yellow and blue arrows present the clockwise vortex A and counter clockwise vortex B, respectively. At the beginning, the vortex A formed. With the development, the scale of vortex A continues to increase and gradually moves to the far side of models, and finally disappears completely; at the same time, the vortex B also experiences a process from formation, development to shedding, and the phenomenon of alternating shedding of positive and negative vortex is shown in the wake of flow. This indicates that the periodic vortex motion of the wake near the wall increases the flow instability.
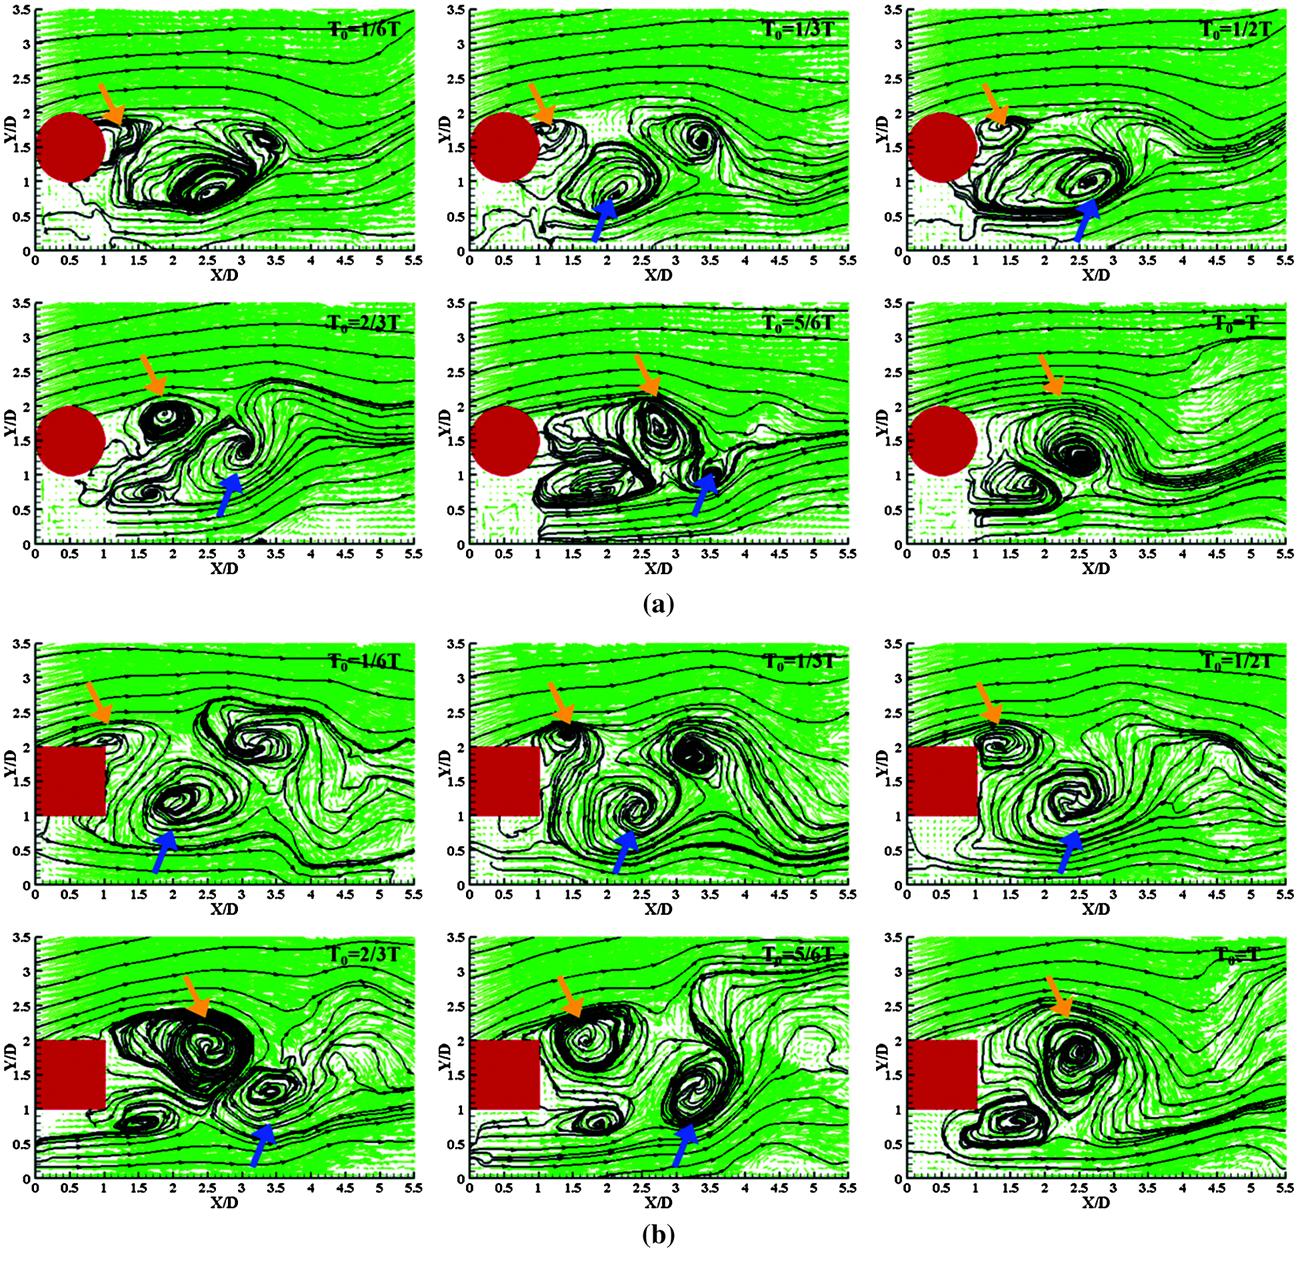
Figure 16: (a): Streamlines and velocity field in a periodic cycle of cylinder at L/D = 1.0 (b): Streamlines and velocity field in a periodic cycle of square column at L/D = 1.0
4.5 Heat Transfer Enhancement Characteristics of the Wall
Fig. 17 presents the instantaneous temperature fields of two models at different L/D. It can be seen that their instantaneous temperature fields have the similar characteristics. When L/D = 0.2, the gap is small, the heat transfer effect is poor and the wall temperature boundary layer is thick. With the increase of L/D, the viscosity of the wall decreases, and the thickness of temperature boundary layer becomes thinner, which indicates that the heat transfer effect is gradually enhanced. Significantly, the temperature boundary layer behind cylinder is thinner than that of square column when L/D = 0.6.
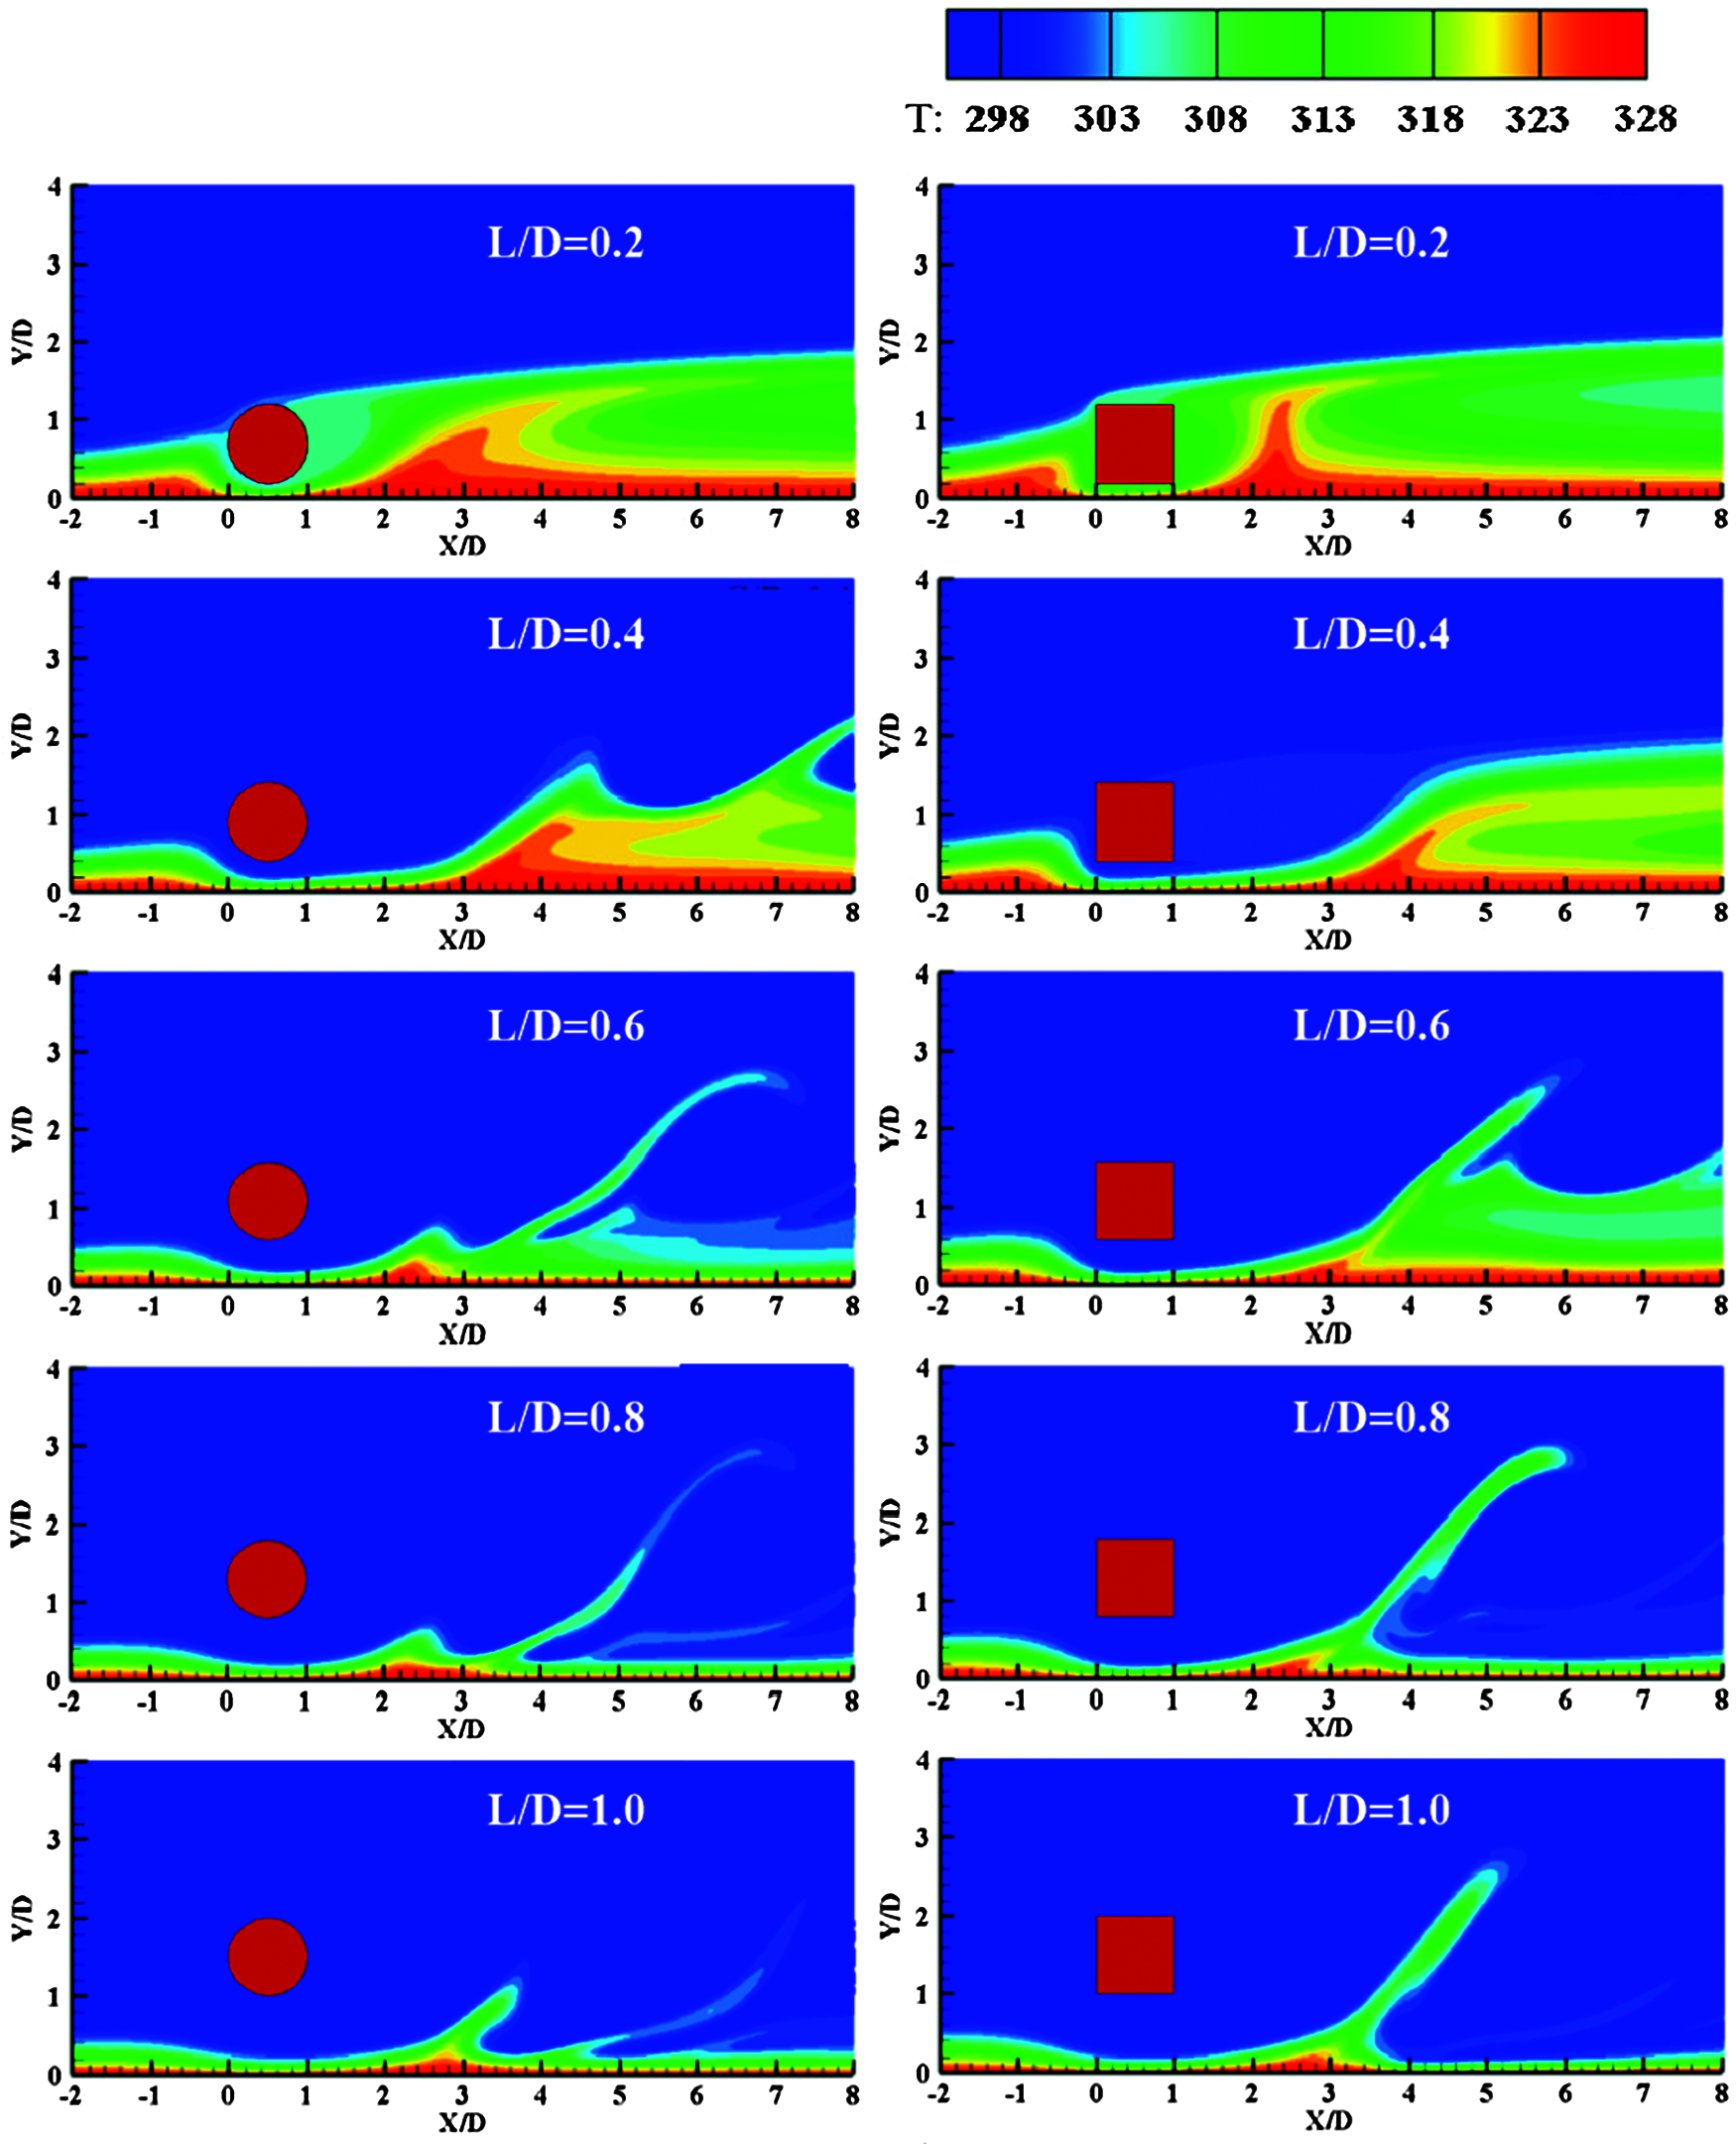
Figure 17: Instantaneous temperature fields at different L/D
Figs. 18a and 18b show the

Figure 18: The time-averaged nusselt Number at different L/D: (a) cylinder; (b) square column
In general, the
Then time-averaged Friction Coefficient (

Figure 19: The time-averaged friction Coefficient at different L/D: (a) Single cylinder; (b) Single square column
According to the analysis, it can be known that the flow through the gap is squeezed and accelerated, which makes the heat transfer to be strengthened and produces the first peak of
In order to further explore the enhanced heat transfer effect at different L/D, we analyzed the time-spatial averaged Nusselt Number
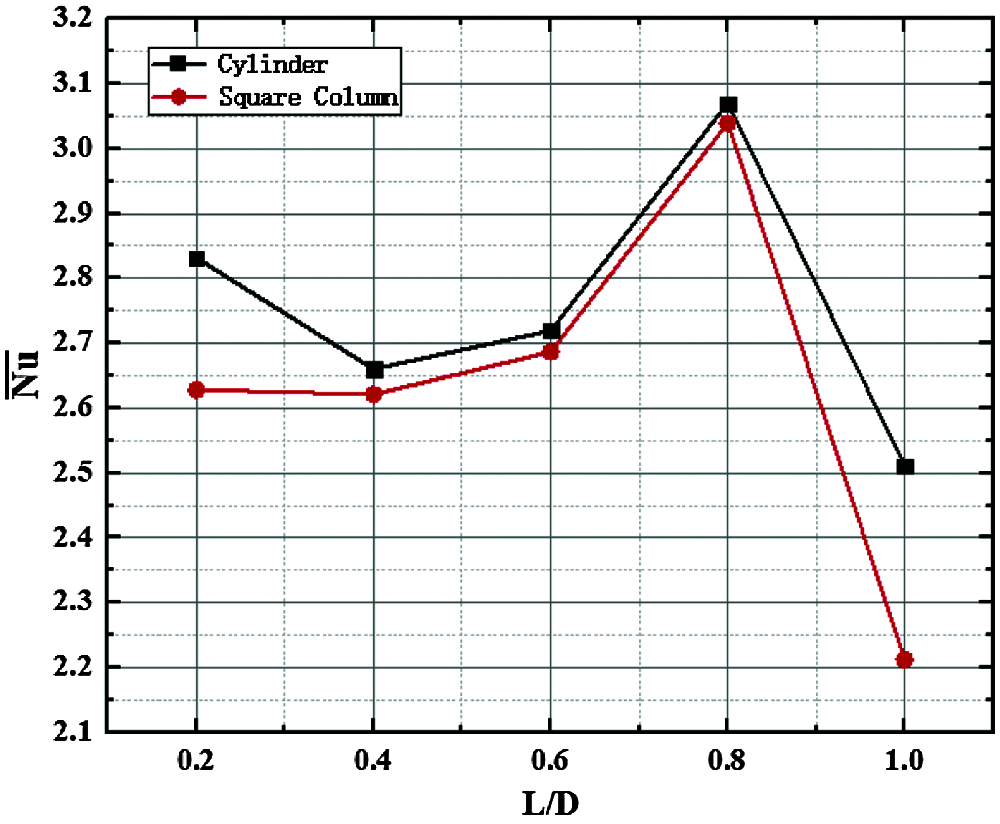
Figure 20: Time-spatial averaged nusselt number of models at different L/D
As we can see, the
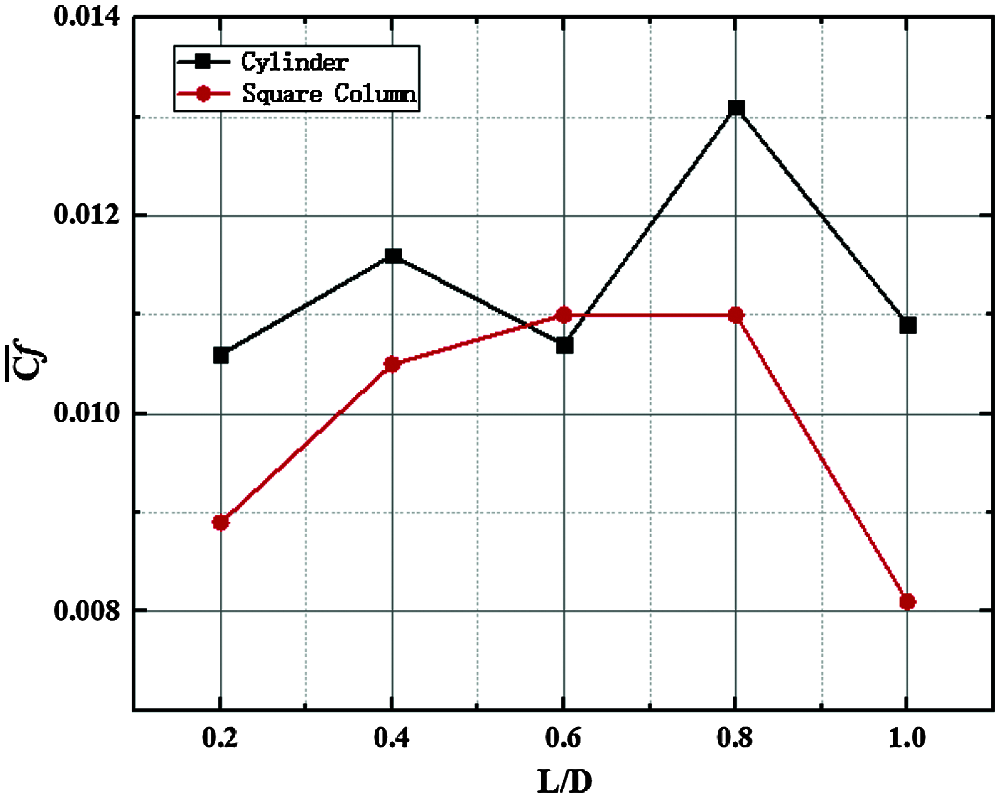
Figure 21: Time-spatial averaged friction coefficient of models at different L/D
In transition flow (Re = 300), we analyzed the effect of different gap ratios (L/D = 0.2∼1.0) on flow and heat transfer over single bluff body near the wall. The main conclusions drawn from the results provided are as follows:
(1) The gap ratio is an important factor affecting the wake characteristics of bluff body in near-wall condition. When it is small, the inhibition effect of the wall is strong, the heat transfer effect is poor and the temperature boundary layer on the wall is thick, models have no periodic characteristics; with its increasing, the inhibition effect decreases, the thickness of wall temperature boundary layer becomes thinner which means the heat transfer effect is obviously enhanced, and periodic vortex shedding motion is finally formed which strengthens the flow instability;
(2) The wake of square column has fixed separation points (on the front and rear sides), while the cylinder is not. And the vortex size and vorticity intensity of square column are greater. In addition, the vortex shedding period of the flow around square column is also longer. However, the heat transfer effect of near-wall cylinder is much better and reaches the best when L/D = 0.8.
(3) The square column displays hysteresis compared with the cylinder at the same gap ratio (the critical gap ratio of cylinder is in 0.2∼0.4, while that of square column is 0.4∼0.6).
Acknowledgement: The author sincerely thanked the National Natural Science Foundation of China for funding, mainly for research on the separation and reattachment instability of transition flow and the mechanism of heat transfer enhancement.
Funding Statement: This work was supported by National Natural Science Foundation of China (Grant No. 51476080).
Conflicts of Interest: The authors declare that they have no conflicts of interest to report regarding the present study.
1. Raiola, M., Ianiro, A., Discetti, S. (2016). Wake of tandem cylinders near a wall. Experimental Thermal & Fluid Science, 78, 354–369. DOI 10.1016/j.expthermflusci.2016.06.003. [Google Scholar] [CrossRef]
2. Wang, X. K., Tan, S. K. (2008). Comparison of flow patterns in the near wake of a circular cylinder and a square cylinder placed near a plane wall. Ocean Engineering, 35(5–6), 458–472. DOI 10.1016/j.oceaneng.2008.01.005. [Google Scholar] [CrossRef]
3. Bearman, P. W., Zdravkovich, M. M. (1978). Flow around a circular cylinder near a plane boundary. Journal of Fluid Mechanics, 89(1), 33–47. DOI 10.1017/S002211207800244X. [Google Scholar] [CrossRef]
4. Grass, A. J., Raven, P., Stuart, R. J., Bray, J. A. (1983). The influence of boundary layer velocity gradients and bed proximity on vortex shedding from free spanning pipelines. Journal of Energy Resources Technology, 106(1), 70–78. DOI 10.1115/1.3231028. [Google Scholar] [CrossRef]
5. Taniguchi, S., Miyakoshi, K. (1990). Fluctuating fluid forces acting on a circular cylinder and interference with a plane wall. Experiments in Fluids, 9(4), 197–204. DOI 10.1007/BF00190418. [Google Scholar] [CrossRef]
6. Lei, C., Cheng, L., Kavanagh, K. (1999). Re-examination of the effect of a plane boundary on force and vortex shedding of a circular cylinder. Journal of Wind Engineering and Industrial Aerodynamics, 80(3), 263–286. DOI 10.1016/S0167-6105(98)00204-9. [Google Scholar] [CrossRef]
7. Wang, X. K., Tan, S. K. (2008). Near-wake flow characteristics of a circular cylinder close to a wall. Journal of Fluids & Structures, 24(5), 605–627. DOI 10.1016/j.jfluidstructs.2007.11.001. [Google Scholar] [CrossRef]
8. Fujita, H., Takahata, H., Yamashita, R. (1981). The forced convective heat transfer on a plate with a cylinder inserted in the boundary layer: 2nd report, effects of cylinder diameter and comparison with the case of a square bar. Nihon Kikai Gakkai Ronbunshu, B Hen/Transactions of the Japan Society of Mechanical Engineers, Part B, 47(361), 317–325. DOI 10.1299/kikaib.47.317. [Google Scholar] [CrossRef]
9. Suzuki, H., Suzuki, K., Sato, T. (1988). Dissimilarity between heat and momentum transfer in a turbulent boundary layer disturbed by a cylinder. International Journal of Heat and Mass Transfer, 31(2), 259–265. DOI 10.1016/0017-9310(88)90008-7. [Google Scholar] [CrossRef]
10. Wang, J., Zhao, Y. (2015). Heat and fluid flow characteristics of a rectangular channel with a small diameter circular cylinder as vortex generator. International Journal of Thermal Sciences, 92, 1–13. DOI 10.1016/j.ijthermalsci.2015.01.018. [Google Scholar] [CrossRef]
11. Martinuzzi, R. J., Bailey, S., Kopp, G. A. (2003). Influence of wall proximity on vortex shedding from a square cylinder. Experiments in Fluids, 34(5), 585–596. DOI 10.1007/s00348-003-0594-0. [Google Scholar] [CrossRef]
12. Durao, D., Gouveia, P., Pereira, J. (1991). Velocity characteristics of the flow around a square cross section cylinder placed near a channel wall. Experiments in Fluids, 11(6), 341–350. DOI 10.1007/BF00211788. [Google Scholar] [CrossRef]
13. Bosch, G., Kappler, M., Rodi, W. (1996). Experiments on the flow past a square cylinder placed near a wall. Experimental Thermal and Fluid Science, 13(3), 292–305. DOI 10.1016/S0894-1777(96)00087-8. [Google Scholar] [CrossRef]
14. Yao, M., Nakatani, M., Suzuki, K. (1995). Flow visualization and heat transfer experiments in a turbulent channel flow obstructed with an inserted square rod. International Journal of Heat & Fluid Flow, 16(5), 389–397. DOI 10.1016/0142-727X(95)00047-T. [Google Scholar] [CrossRef]
15. Icoz, T., Jaluria, Y. (2006). Design optimization of size and geometry of vortex promoter in a two-dimensional channel. Journal of Heat Transfer, 128(10), 1081–1092. DOI 10.1115/1.2345433. [Google Scholar] [CrossRef]
16. Dhinakaran, S. (2011). Heat transport from a bluff body near a moving wall at re = 100. International Journal of Heat & Mass Transfer, 54(25–26), 5444–5458. DOI 10.1016/j.ijheatmasstransfer.2011.07.046. [Google Scholar] [CrossRef]
17. Tanweer, S., Dewan, A., Sanghi, S. (2019). Influence of three-dimensional wake transition on heat transfer from a square cylinder near a moving wall. International Journal of Heat and Mass Transfer, 148, 118986. DOI 10.1016/j.ijheatmasstransfer.2019.118986. [Google Scholar] [CrossRef]
18. Patankar, S. V., Spalding, D. B. (1972). A calculation procedure for heat, mass and momentum transfer in three-dimensional parabolic flows. Journal of Heat Mass Transfer, 15(10), 1787–1806. DOI 10.1016/0017-9310(72)90054-3. [Google Scholar] [CrossRef]
19. Xu, J. H., Zou, S., Inaoka, K., Xi, G. N. (2017). Effect of reynolds number on flow and heat transfer in incompressible forced convection over a 3D backward-facing step. International Journal of Refrigeration, 79, 164–175. DOI 10.1016/j.ijrefrig.2017.04.012. [Google Scholar] [CrossRef]
 | This work is licensed under a Creative Commons Attribution 4.0 International License, which permits unrestricted use, distribution, and reproduction in any medium, provided the original work is properly cited. |