| Fluid Dynamics & Materials Processing |
DOI: 10.32604/fdmp.2022.017534
ARTICLE
Numerical Simulation of Liquid-Solid Coupling in Multi-Angle Fractures in Pressure-Sensitive Reservoirs
1State Key Laboratory of Petroleum Resources and Prospecting, China University of Petroleum (Beijing), Beijing, 102249, China
2College of Petroleum Engineering, China University of Petroleum (Beijing), Beijing, 102249, China
*Corresponding Author: Yuetian Liu. Email: Liuyts2020@163.com
Received: 18 May 2021; Accepted: 12 August 2021
Abstract: This study clarifies the seepage characteristics of complex fractured pressure-sensitive reservoirs, and addresses a common technological problem, that is the alteration of the permeability degree of the reservoir bed (known to be responsible for changes in the direction and velocity of fluid flows between wells). On the basis of a new pressure-sensitive equation that considers the fracture directional pressure-sensitive effect, an oil-gas-water three-phase seepage mathematical model is introduced, which can be applied to pressure-sensitive, full-tensor permeability, ultralow-permeability reservoirs with fracture-induced anisotropy. Accordingly, numerical simulations are conducted to explore the seepage laws for ultralow-permeability reservoirs. The results show that element patterns have the highest recovery percentage under a fracture angle of 45°. Accounting for the pressure-sensitive effect produces a decrease in the recovery percentage. Several patterns are considered: inverted five- seven- and nine-spot patterns and a cross-row well pattern. Finally, two strategies are introduced to counteract the rotation of the direction of the principal permeability due to the fracture directional pressure-sensitive effect.
Keywords: Pressure-sensitive reservoir; multi-angle fracture; liquid-solid coupling; numerical simulation; waterflood development method
Based on Warren and Root’s single-phase seepage equation, in 1976, Kazemi et al. [1] developed a tool for simulating the multi-well single-phase and two-phase seepage of fractured reservoirs. In 1986, Nakornthap et al. [2] built a numerical simulation model capable of simulating heterogeneous isotropic matrices and heterogeneous anisotropy fracture systems, and characterized fracture permeability in tensor form. In 1987, Chen et al. [3] coupled the mathematical equations of shafts, and developed a simulator for the numerical simulation of the dual-medium, three-dimensional, three-phase, and multi-component thermal recovery of fractured reservoirs based on the fully implicit solution. In 1988, Sonier et al. [4] considered the effect of fractures in numerical simulation, and introduced a saturation function to simulate the dynamic changes of gravity. In 1989, Por et al. [5] developed a simulator prioritizing interactions between matrix rocks, and found that the capillary force exerted a significant effect on the recovery ratio.
Previous studies on the numerical simulation of reservoirs considering fractures mostly focused on conventional reservoirs. This is not the case with domestic studies in this field. In 1997, Wang et al. [6] simulated the repeated fracturing of low-permeability reservoirs using a single-medium model. In 2003, Jiang et al. [7] introduced the method of fracture propagation in a study on hydraulic fracturing, and discovered that this method was more effective than purely increasing fracture permeability. In 2004, Yin et al. [8] mainly explored the numerical simulation of oil recovery by imbibition, and showed that this approach was only applicable to water-wet fractured reservoir beds; moreover, the larger the capillary force in the matrix system, the higher the recovery ratio of the reservoir. In 2005, Yuan et al. [9] considered the deformation characteristics of fracture systems with changing pressure in a dual-medium numerical simulation. In 2009, Chen et al. [10] adopted a dual-medium model to simulate the production of reservoirs with fractures around injection wells, and reproduced the flow status of actual reservoir beds as far as possible by coupling multiple grid types. Based on the discrete fracture model, in 2010, Zhang et al. [11] built mathematical models for matrix systems and fracture systems containing fracture-matrix and fracture-fracture channeling terms; moreover, they solved these terms using the finite element method, obtained a generalized characteristic matrix equation, and improved discrete fracture reservoirs with controlled oil-water flow directions. Ding et al. [12] performed the sophisticated numerical simulation of late-stage reservoirs under development with spatially partitioned, temporally segmented characteristic parameters. These methods have considered the differences in fracture parameters of different regions, as well as changes of physical parameters of reservoir beds (e.g., porosity, permeability, and phase seepage) with time in reservoir development. In 2012, Song [13] created relative permeability curves considering the starting pressure gradient and the stress-sensitive effect based on physical simulation experiments; Song performed a simulation study of low-permeability reservoirs using the numerical simulation software ECLIPSE and the stress sensitivity keyword ROCKTABH, and initiated the pressure gradient keyword Threshold Pressure. Zhang et al. [14] built a two-dimensional, two-phase seepage mathematical model for fractured reservoirs that considers minimum and pseudo-starting pressure gradients, and solved them using the alternative direction implicit method. In 2013, Wang et al. [15] compiled a water-drive numerical simulation software product that simultaneously considers both starting pressure gradient and reservoir bed stress sensitivity in the numerical simulation of low-permeability reservoirs. Ji [16] explored the distribution laws of the permeability degree and fracture propagation direction by adjusting fracture system and matrix system parameters based on the dual-medium model. In 2014, Wu et al. [17] built a three-dimensional, three-phase liquid-solid coupling seepage mathematical model that considers fracture-induced anisotropy; they compiled a coupling solver applicable to ultralow-permeability reservoirs, considering the dynamic changes of reservoir permeability.
In summary, international studies rarely investigated low-permeability, compact, or other special reservoir types and their fractures. Many studies have explored low-permeability, compact, and other special fractured reservoirs, but have not sufficiently assessed the pressure-sensitive deformation characteristics induced by fracture directivity. Studying the influence of the fracture directional pressure-sensitive effect on the seepage mechanism of ultralow-permeability fractured reservoir is vital. Furthermore, improving the seepage theory of ultralow-permeability fractured pressure-sensitive reservoir provides vital guiding significance for improving the development effect of reservoirs.
2 Mathematical Modeling of Seepage
In numerical modeling, the permeability of the reservoir bed was characterized as full-tensor permeability. The fracture permeability in the permeability tensor was calculated using a pressure-sensitive equation that considers the fracture directional pressure-sensitive effect [18,19]. This equation can be used to solve the problem of waterflood development pattern simulation while considering both full anisotropy and fracture pressure-sensitive effect in different directions on oilfield sites. In addition to this primary characteristic, the following basic assumptions were adopted in the modeling:
1) A reservoir contains oil, gas, and water phases, and no consideration is given to temperature fluctuations. Oil and water are immiscible, and gas is insoluble in water. The compressibility of fluids is considered.
2) Fluid seepage obeys Darcy’s law.
3) Rocks in reservoirs are an isotropic medium, subject to linear elastic deformation.
4) Pressure equilibrium is achieved instantly.
2.1 Calculation of Equivalent Permeability
In the model, rocks containing micro fractures and small-scale natural fractures were treated as an equivalent continuous medium. It was assumed that fluid pressures change simultaneously in all fractures, in which case, the changes of the effective stresses borne by matrix rocks from various sides and their volumetric deformations are symmetric. This implies that the centerline of each rod-line matrix block and the center points of each square matrix block experienced no displacement with the deformation of matrix blocks. Consequently, the region enclosed by A, B, C, and D in Fig. 1 maintained a constant volume during the deformation of matrix blocks, i.e., the constant volume boundary condition was met. For this reason, this region was adopted as the fixed volume element model for fractured mediums. Grid selection was achieved as illustrated in Fig. 1, i.e., the region enclosed by the center points A, B, C, and D of matrix blocks was assumed as one grid. At the same time, because of the presence of the stress arching effect, the entire reservoir boundary [20] could be approximated as a fixed boundary.
Figure 1: Schematic diagram of the relationship between characteristic volume element and element pattern
It was assumed that fractures develop only in the x-y plane, do not develop in the z direction, and fractures in the reservoir bed are all vertical penetrating fractures. Then, the full-tensor permeability of the fractured reservoir bed can be expressed by Eq. (1):
where fracture permeability is calculated from the pressure-sensitive equation, considering the fracture directional pressure-sensitive effect [18] (Eq. (2)):
The components of the permeability tensor obey the following relationships: kxy = kyx; kxz = kzx; kyz = kzy.
The fracture permeability calculation model is compared with the previous models, its innovation lies in considering the direction of fracture pressure-sensitive effect. Could be used to calculate a single set of different direction and the direction of more groups of different fractures fracture network pressure sensitive aperture and permeability variation. The process of building and derivation of the model is to fracture as an independent object of study. Instead of conventional method used in the fracture and matrix system together as an equivalent medium to study the effect of pressure sensitive.
2.2 Mathematical Models for Seepage
Based on Section 2.1, new permeability tensor calculation model considering the effect of fracture pressure sensitive direction and the corresponding seepage flow mathematical model was established. In the model, the permeability of the reservoir bed was characterized in the form of full-tensor permeability. Single-phase and oil-gas-water three-dimensional, three-phase seepage mathematical models were built that consider fracture directional pressure-sensitive effect.
(1) Single-phase seepage mathematical model
where η = 1/μC .
(2) Oil-gas-water three-phase seepage mathematical model
Oil component:
Gas component:
Water component:
By summarizing the previous research results, the idea of full implicit difference iterative solution is adopted. The core idea of calculation is to calculate the permeability field of the next time step by explicit method using the pressure-sensitive equation considering the directional pressure-sensitive effect of fracture (in which the influence of stress change on fracture apertureis taken into account). An explicit method is used to calculate the permeability of each grid. Then the numerical simulation of the reservoir considering the directional pressure sensitive effect of fractures is realized by updating the permeability field. In each time step, the pressure and permeability values of the previous time step are used as the basic parameters. The calculation result of this time step is output. It is then used to calculate the permeability of the next time step. Finally, the full implicit differential iterative solution of fluid flow module is realized. Detailed solution steps are shown in the following programming process of fracture pressure-sensitive numerical simulation software module.
Fig. 2 shows the comparison between the calculated results (black curve) obtained after the numerical solution of the seepage mathematical model established in this paper and the data obtained from the physical simulation test (red hollow points). It can be seen that the numerical calculation results are in good agreement with the experimental test values [18]. It shows that the mathematical model established in this paper is reliable.
Figure 2: Experimental test and theoretical calculation results comparison curve
3 Basic Model for the Numerical Simulation of Liquid-Solid Coupling
3.1 Overview of the Background Reservoir
The WY (Wang Yao) reservoir of the CQ (Chang Qing) oilfield is a typical low-permeability fractured pressure-sensitive reservoir and was therefore adopted as the background reservoir. The reservoir has a mean apparent permeability of 2.29 × 10⁻³ μm2, an apparent porosity of 13.2%, a mean original formation pressure of 9.13 MPa, a saturation pressure of 6.23 MPa, and a formation saturation pressure difference of 2.90 MPa. After waterflood development, the production energy has recovered to some extent, but the production well was subjected to water breakthrough (i.e., water injection). Because of the presence of fracture-induced anisotropy, the flow direction of injected water in the reservoir is obvious.
3.2 Basic Parameters of a Typical Element Pattern
The BLACKOIL module of the ECLIPSE software E300 simulator was adopted to build a basic seepage model for the reservoir in the Cartesian coordinate system. As the reservoir itself is not a homogeneous isotropic reservoir, in the simulated development of the reservoir, the geometric boundary of a well array would not necessarily overlap with the streamline boundary in the well array. To prevent errors caused by open element streamlines, each computing element was designed with nine well arrays; therefore, the model had a total of 32,761 grids (grid dimensions: 30 × 30 × 2; grid size: 10 m × 10 m × 10 m).
Table 1 shows the mesh sensitivity analysis results (using five-point well pattern, 45° fracture, pressure sensitive effect considered as an example). It can be seen that the values of recovery and water cut after 20 years of model exploitation change with the change of grid number. When the mesh number is greater than or equal to 32,760, the recovery ratio and water cut value are relatively stable and have little change. Therefore, it is reasonable to choose 32,761 grids.
3.3 Compilation of a Fracture Pressure-Sensitive Numerical Simulation Software Module
To consider the fracture directional pressure-sensitive effect in the numerical simulation of ultralow-permeability fractured pressure-sensitive reservoir, it is necessary to apply Eq. (2) in the numerical simulation. The keyword ROCKTABH of commercial numerical simulation software ECLIPSE only yields the change laws of the overall equivalent permeability of fractured rocks with pressure. However, it cannot separately reflect the influence of the fracture pressure-sensitive effect on full-tensor permeability. Therefore, a numerical simulation software module for the pressure-sensitive full-tensor permeability of fractures with different directions was compiled to optimize both the seepage field and development method of the ultralow-permeability reservoir. As illustrated in Fig. 3, the module first reads the pressure data of the last time step, and then substitutes these data into the pressure-sensitive equation considering the fracture directional pressure-sensitive effect (Eq. (2)). Then, the permeability value of the next time step is calculated, and written into the numerical simulation file to perform operations.
Figure 3: Numerical simulation flow chart considering fracture directional pressure sensitive effect
The study of the model of fluid-solid coupling property for the fluid drive solid.
The number of iterations setting principles: To make sure every time step to achieve convergence, or can clearly see the main residual curve tends to level. At the same time, the time step must be greater than or equal to the minimum grid length divided by the flow velocity or rotating flow velocity. In order to ensure that each iteration is within a grid range, there will be no error in the results due to cross-grid. However, in practice, the calculation speed may increase after a period of calculation. At this time, the time step can be set larger. Finally, in order to obtain a more accurate final solution, the time step is adjusted to be smaller and a subtle calculation is performed. Comparing the convergence of the model under different time steps, it is finally determined that the time step of the fluid unit simulation is 1 month. In order to accurately compare the production effect, the comparison simulation time is set to 20 years. In actual modeling, the overlap of nodes will occur on the boundary of fluid-solid coupling due to modeling reasons. You cannot use the kneading node command to turn the overlapped nodes into one. The time step for solving the stress-sensitive permeability (solid element) is equal to the time step for solving the fluid field and fluid-structure interaction.
According to the idea of fluid-solid coupling, first assume the fluid pressure distribution. Using the pressure-sensitive permeability Eq. (2) to obtain the fracture aperture and permeability, then solve the fracture flow field. Compare the current calculated pressure with the previously assumed pressure, if the difference meets a certain accuracy, then enter the next time step. Otherwise, update the pressure distribution and recalculate, and iterate to the convergence condition. When 0 < α < 1/2, the iterative method is convergent. Set the maximum number of iterations to 50.
3.4 Simulation Scheme Design and Establishment of the Production System
To fully identify the influence of the fracture directional pressure-sensitive effect on the areal pattern seepage characteristics of this ultralow-permeability reservoir, a total of 80 numerical simulation models were designed (summarized in Table 2).
By combining the actual development data of the WY reservoir with related engineering methods, the production system parameters of the above models are established as presented in the following:
1) The production well is under constant-pressure production, with a flowing bottom-hole pressure (FBHP) of 3.8 MPa.
2) The injection well is injected with water at constant pressure, with an FBHP of 24.13 MPa.
3) The term of simulated development is 20 years.
4) The simulated time step length is one month.
4.1 Effect of the Fracture Angle on the Seepage Field of Element Patterns
(1) Effect of the fracture angle on the saturation field
Fig. 4 illustrates the effects of fractures with different directions on the saturation field in different pattern types after ten years of development.
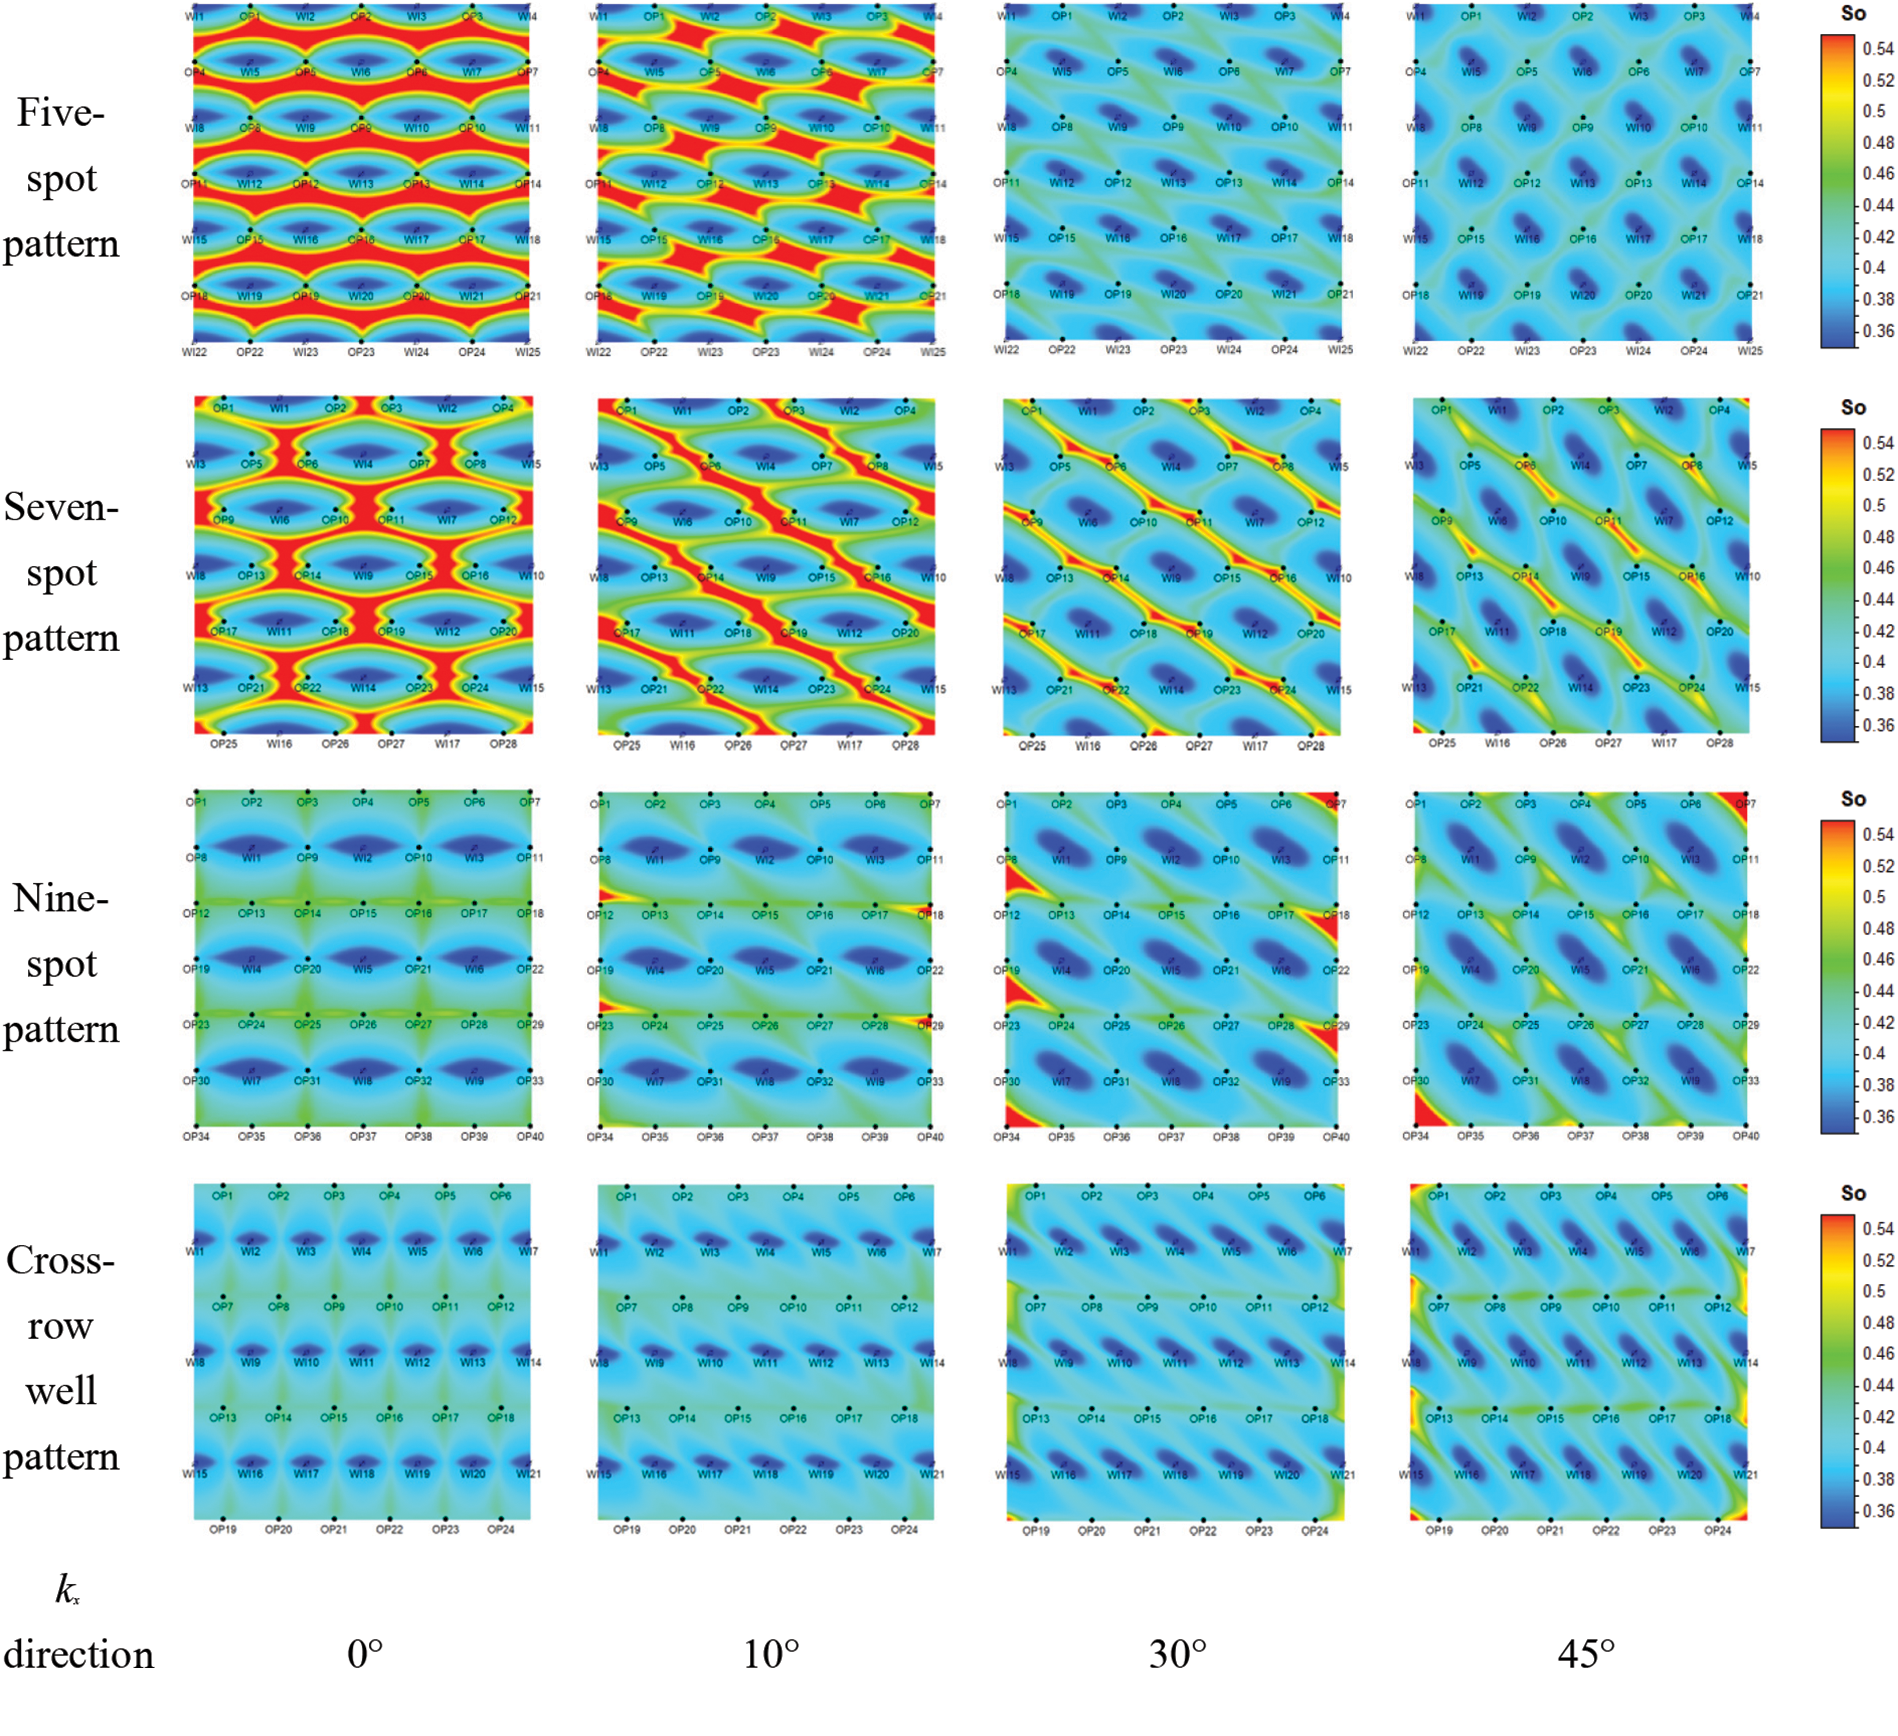
Figure 4: Oil saturation distribution map after ten years of development
As shown in Fig. 3, fluid injected into element patterns always preferentially flows along the direction of the maximum principal permeability kx; therefore, oil wells in the direction of the maximum principal permeability were affected by the injected fluid to a large extent, while those in the vertical fracture direction had low efficiency. The saturation isoline near the injection well was elliptical, and the elliptical long axis was parallel to the direction of the maximum principal permeability.
(2) Effect of fracture angle on the pressure field
Fig. 5 illustrates the effects of fractures with different directions on the pressure field in different pattern types after ten years of development.
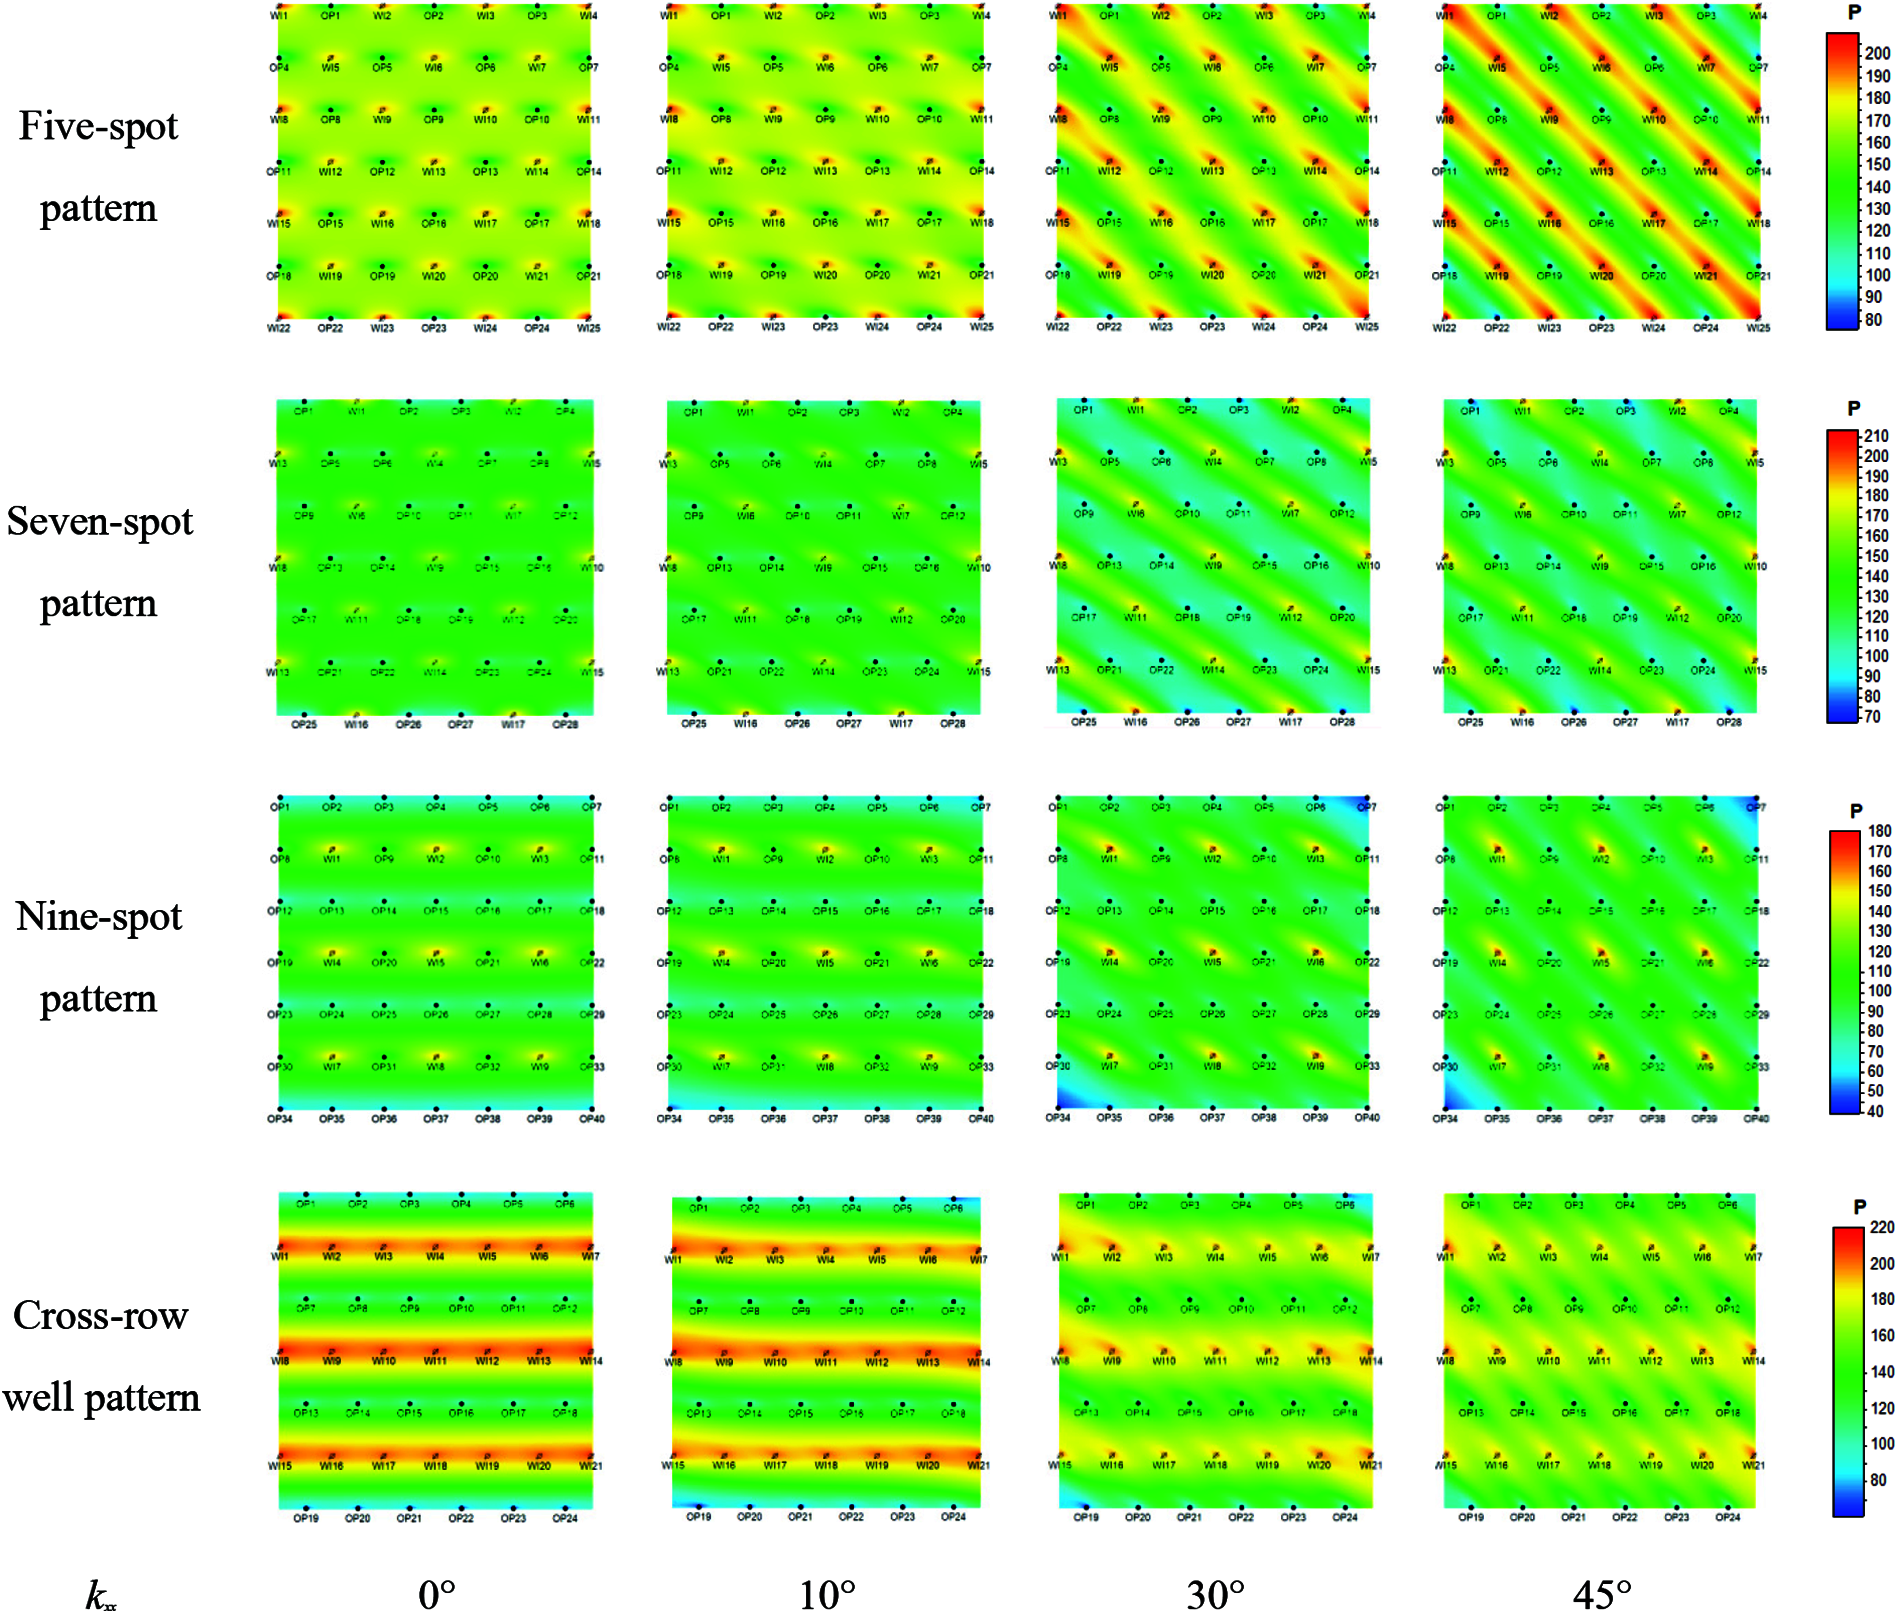
Figure 5: Formation pressure distribution map after ten years of development
According to Fig. 5, the seepage resistance parallel to the direction of the maximum principal permeability was small, while that perpendicular to this direction was large. When the injection-production direction and the direction of the maximum principal permeability featured an included angle, after the same production time, the pressure parallel to the direction of the maximum principal permeability experienced a small loss and maintained a high level. The pressure perpendicular to this direction maintained a low level because of a large loss.
4.2 Optimization of Fracture Angle and Injection-Production Direction
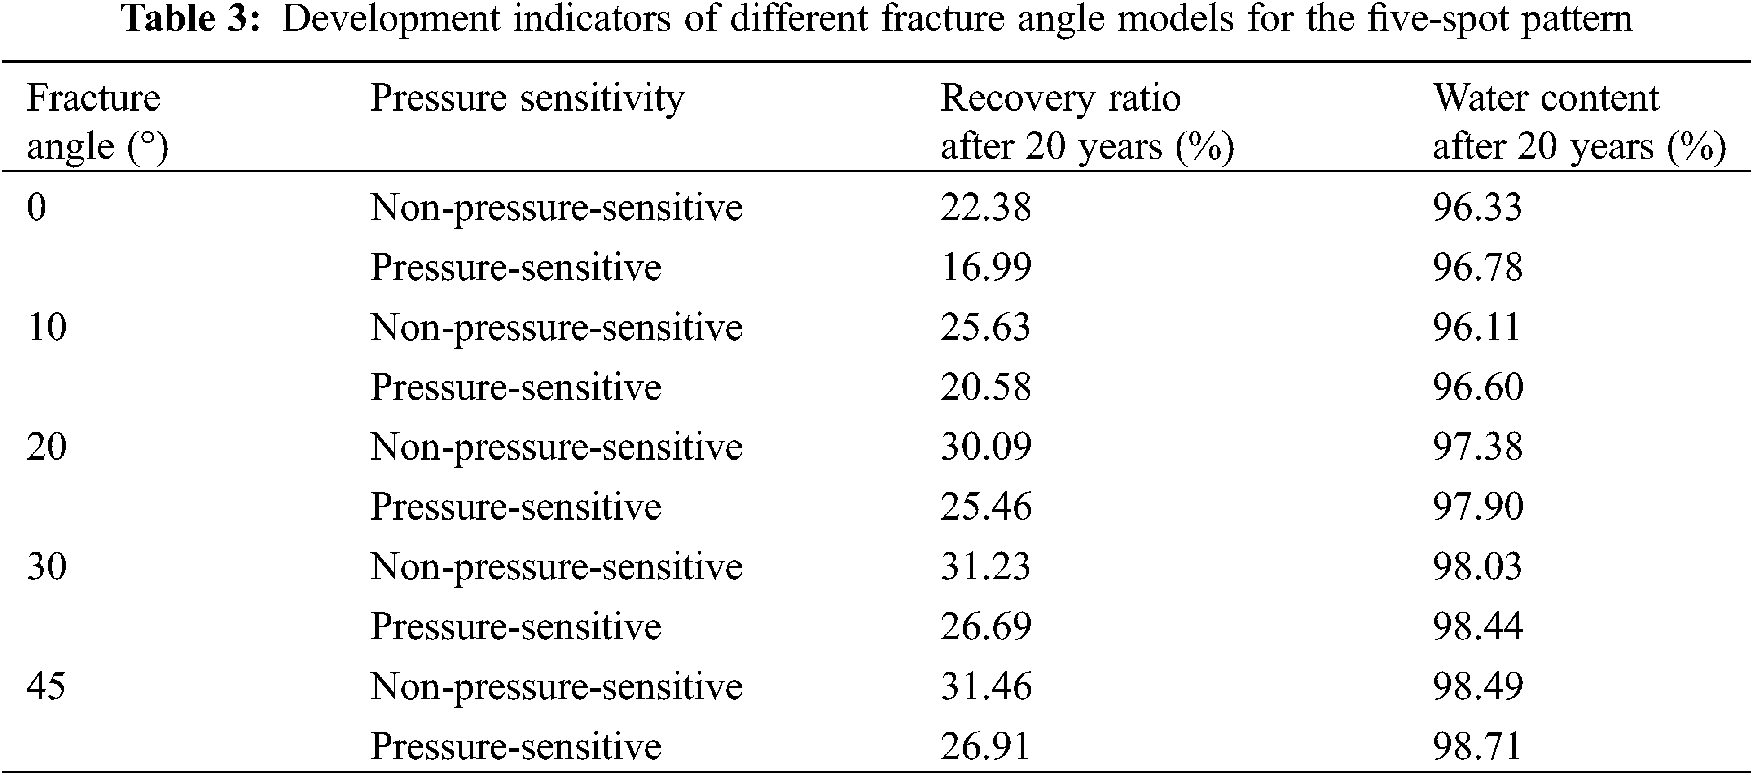
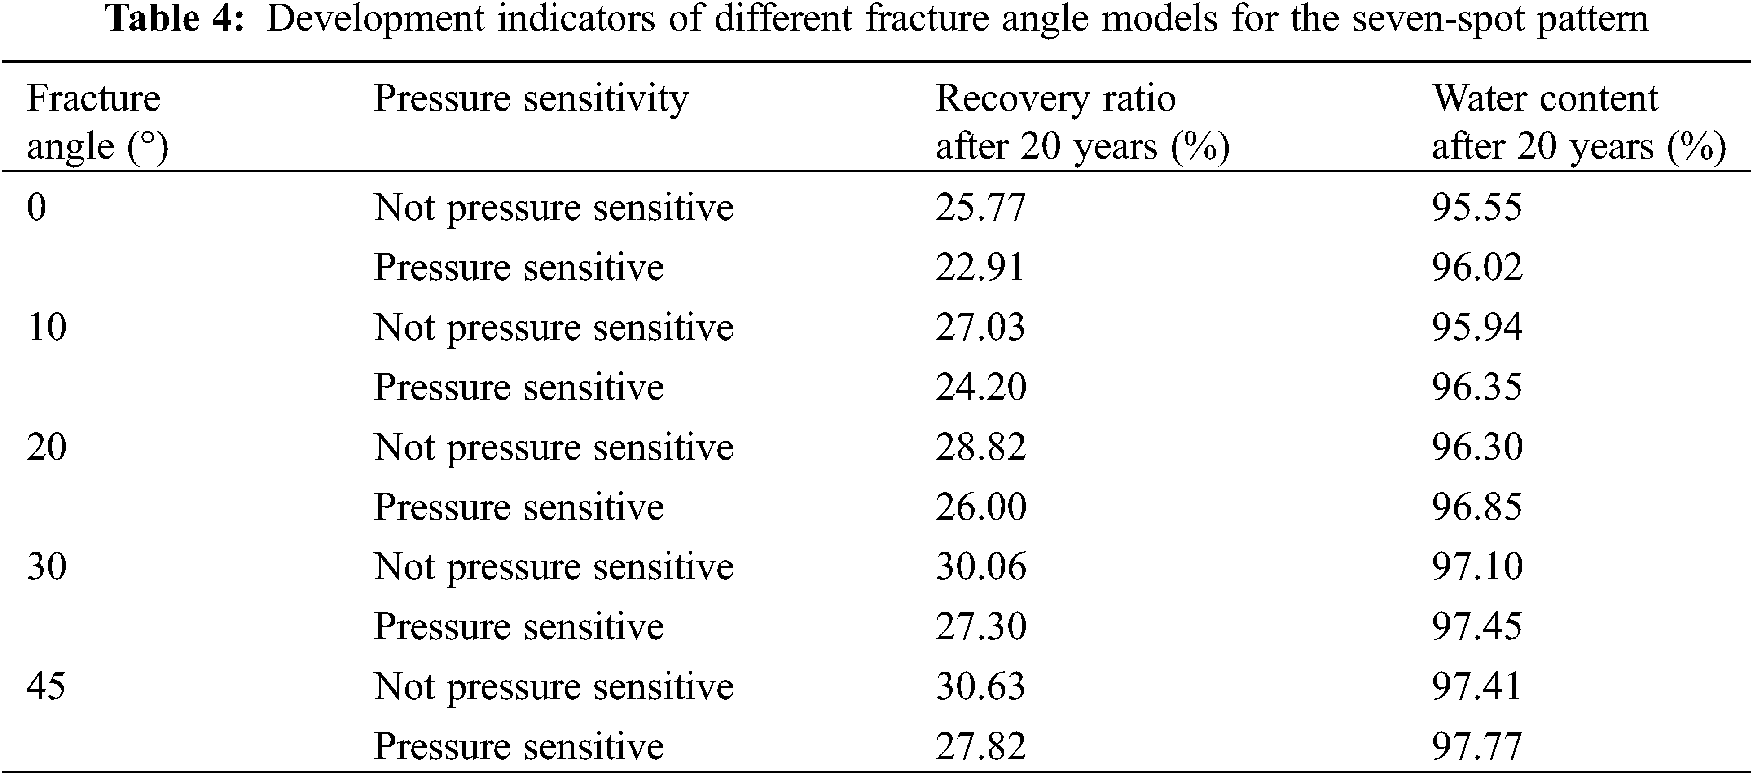
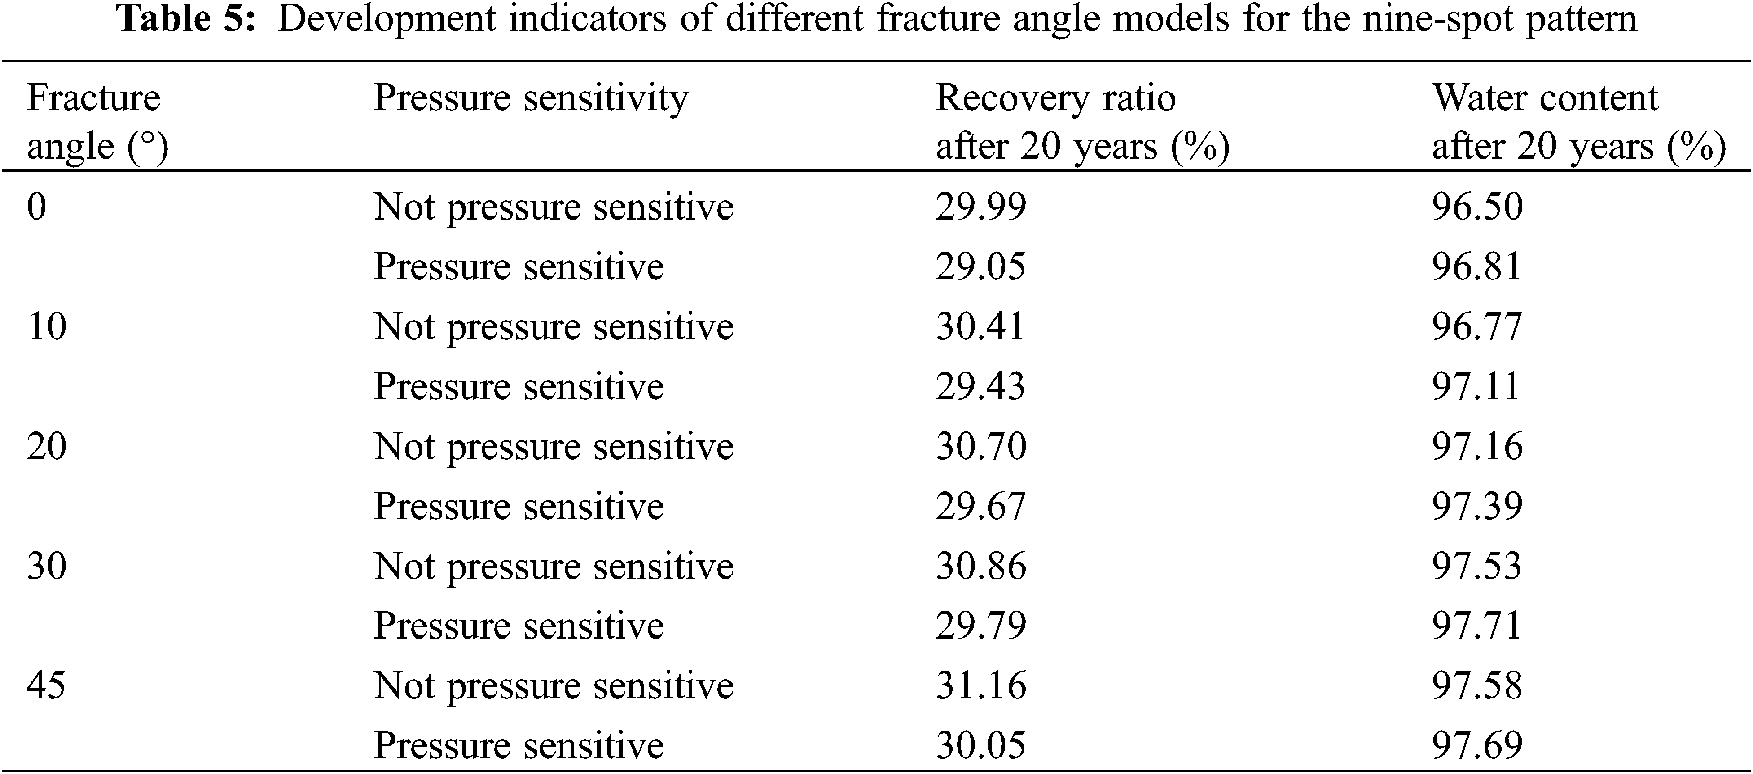
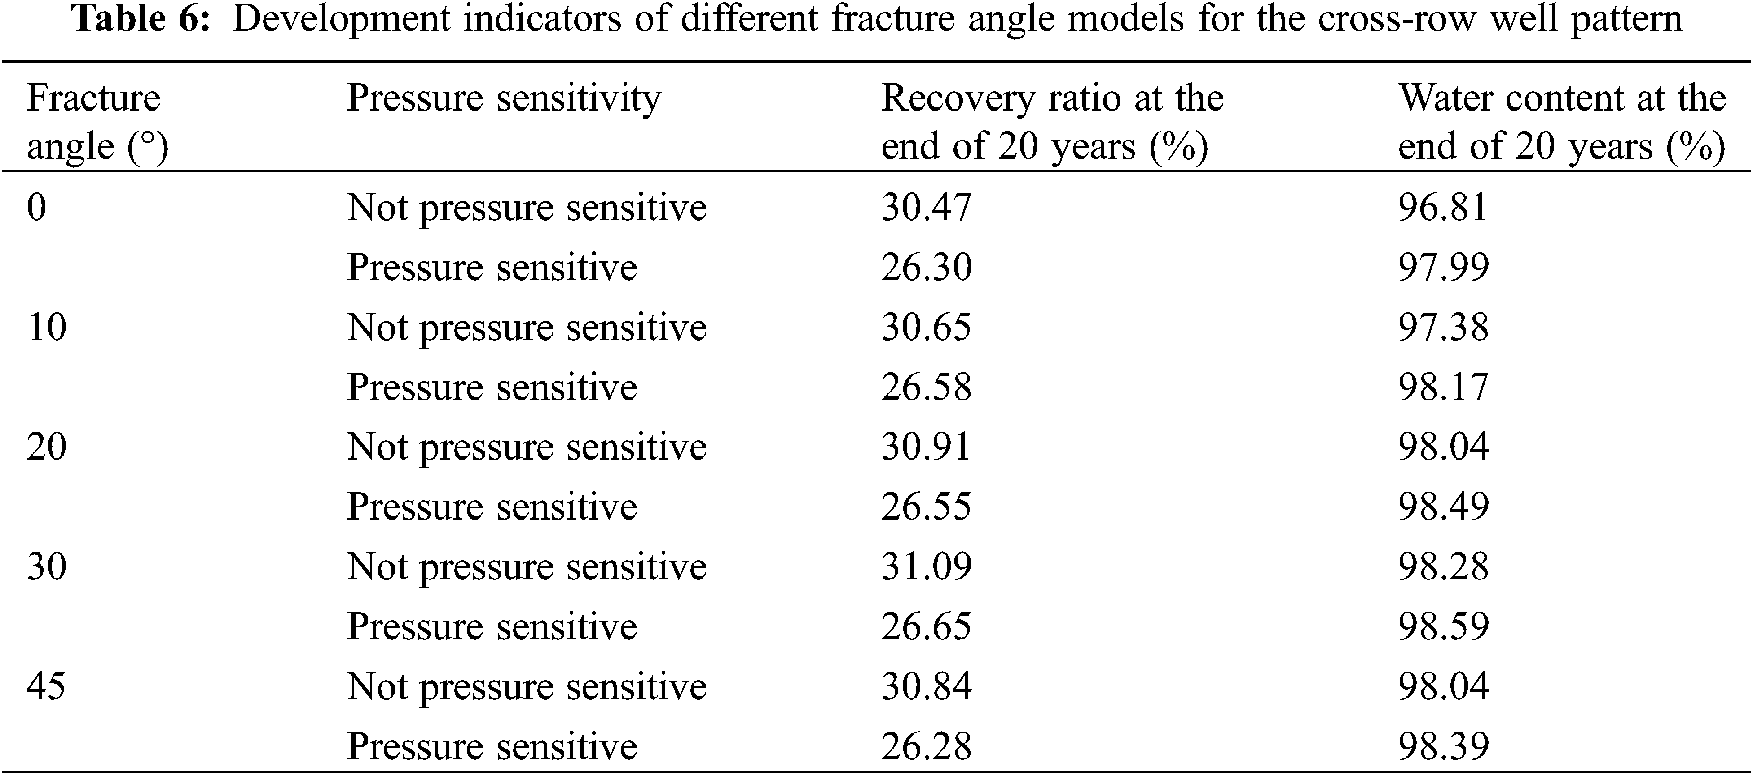
Figs. 6–9 show the relationship curves between recovery percentage and water content for the same type of element patterns under the effects of fractures with different directions. Tables 3–6 provide the values of the ultimate recovery ratios and water contents after 20 years. Clearly, when the water contents of the five-spot pattern, the seven-spot pattern, the nine-spot pattern, and the cross-row well pattern increased to the same value, they had the highest recovery percentage under a fracture angle of 45°. Under fracture angles of 30°, 20°, 10°, and 0°, their recovery percentages decreased successively. For element patterns with the same fracture direction, the recovery percentage considering the pressure-sensitive effect was always lower than that without considering the pressure-sensitive effect.
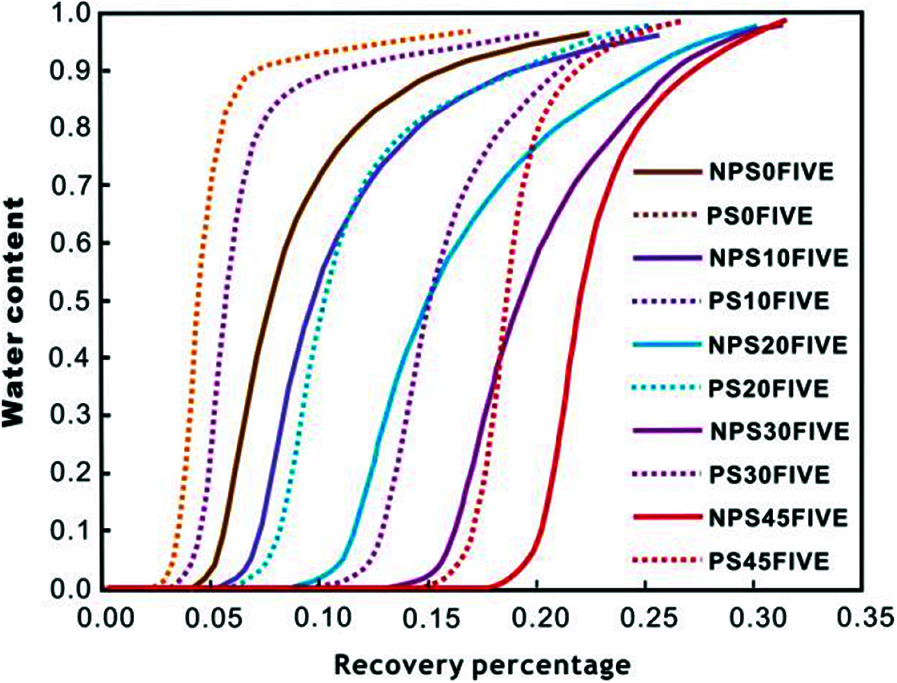
Figure 6: Relationship curve between recovery percentage and water content for the five-spot pattern
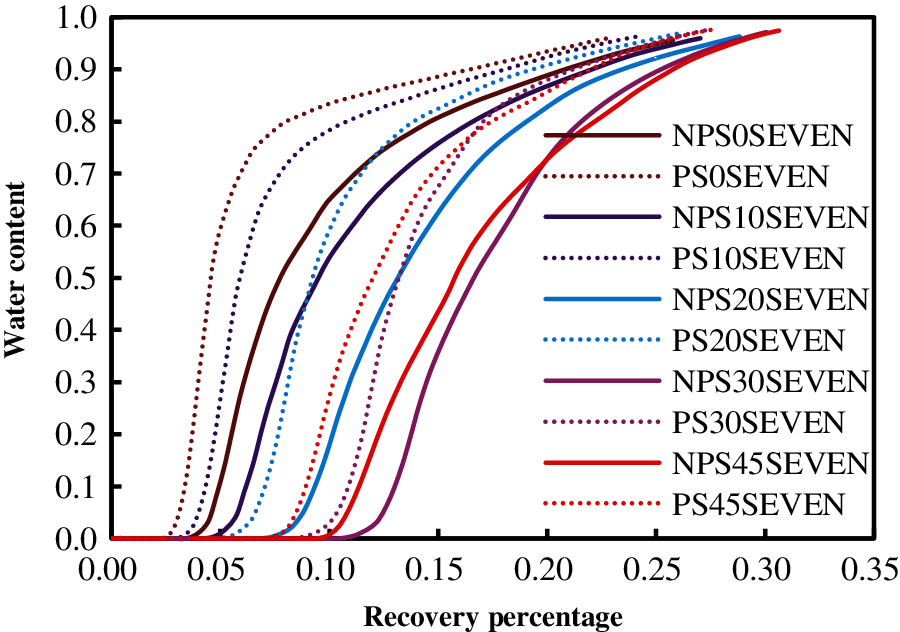
Figure 7: Relationship curve between recovery percentage and water content for the seven-spot pattern
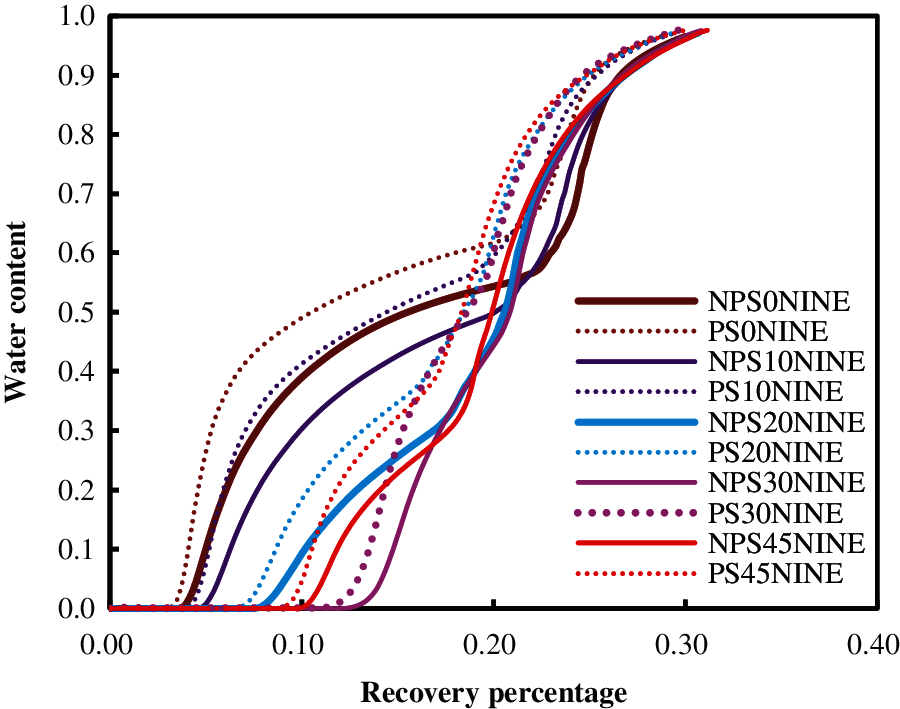
Figure 8: Relationship curve between recovery percentage and water content for the nine-spot pattern
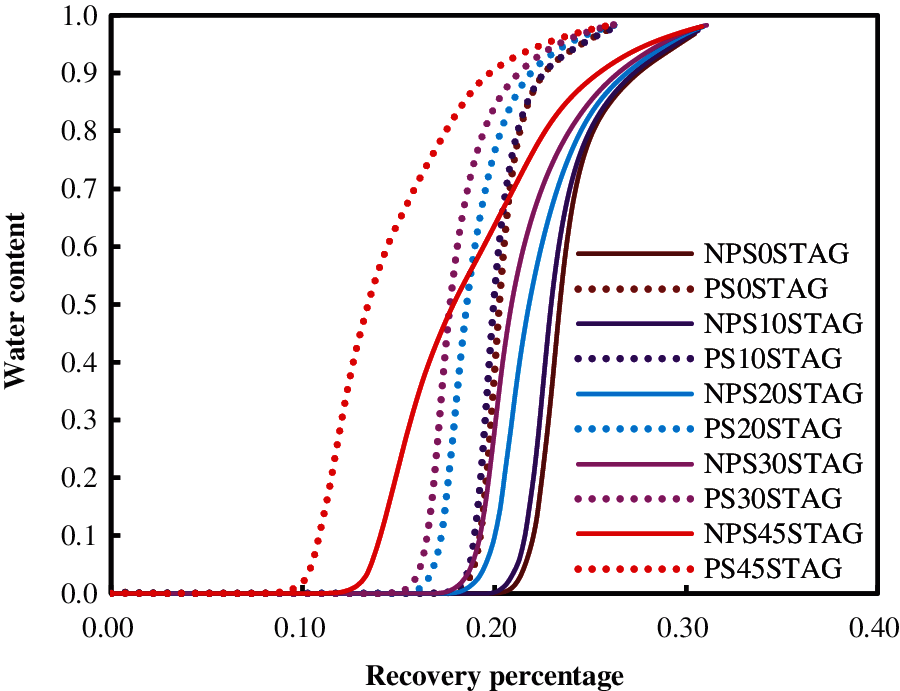
Figure 9: Relationship curve between recovery percentage and water content for the cross-row well pattern
4.3 Optimization of Fracture Angles and Spacing Patterns
When the fracture direction remained constant, element patterns of different types and areas manifested different development effects. This is caused by differences in well pattern distance, injection-production ratio, and other parameters. The following numerical simulation models ensured the same density for various patterns and the same production system for both oil and water wells. Figs. 10a–10e show the relationship curves between recovery percentage and water content after 20 years of development. The inverted nine-spot pattern achieved the best development effect when the included angles between the direction of fracture development and the direction of the macroscopic pressure gradient were 0°, 10°, 20°, 30°, and 45°, respectively. After 20 years, the differences among the four element patterns in the ultimate water content were small; however, the inverted nine-spot pattern had a longer water-free recovery period and a higher ultimate recovery ratio.

Figure 10: Matching relationship between different spacing patterns and fracture angles (a) 0° fracture (b) 10° fracture (c) 20° fracture (d) 30° fracture (e) 45° fracture
4.4 Development Adjustment Ideas
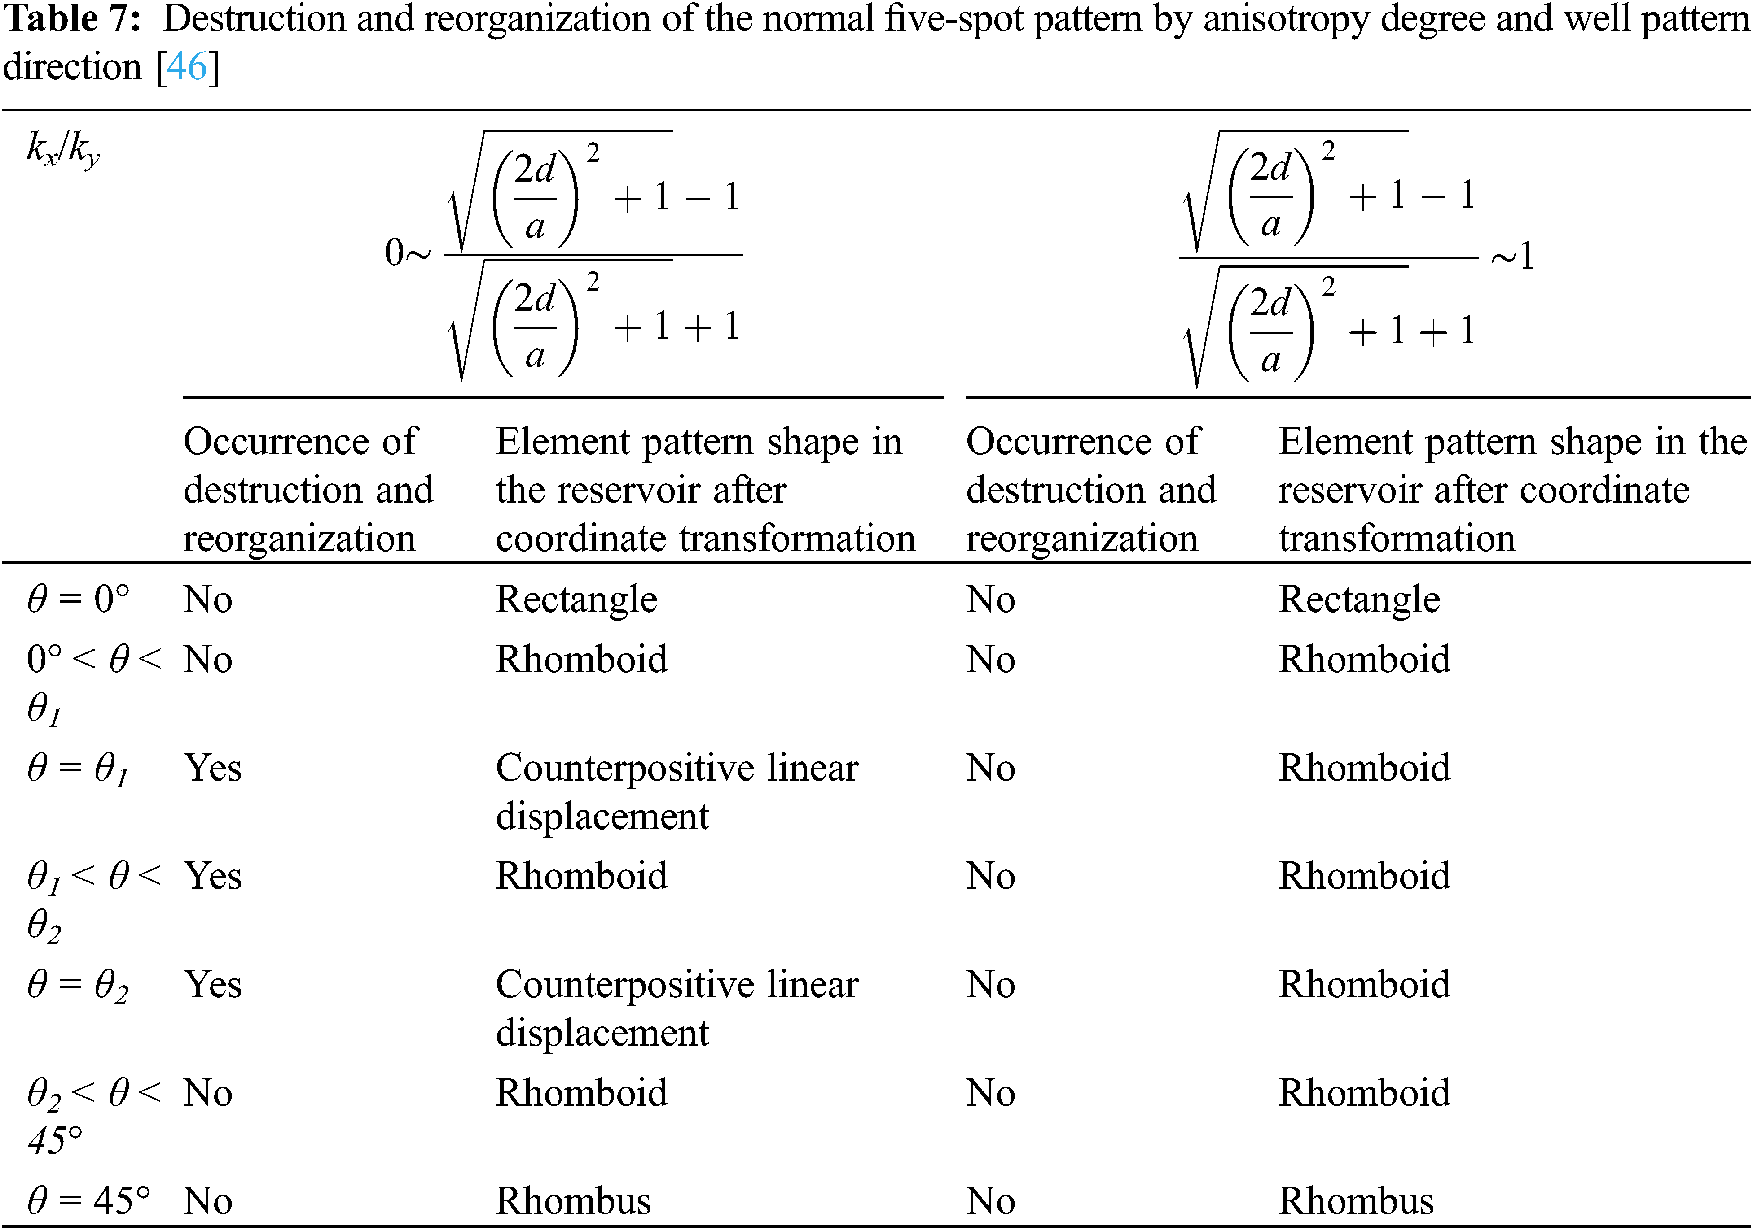
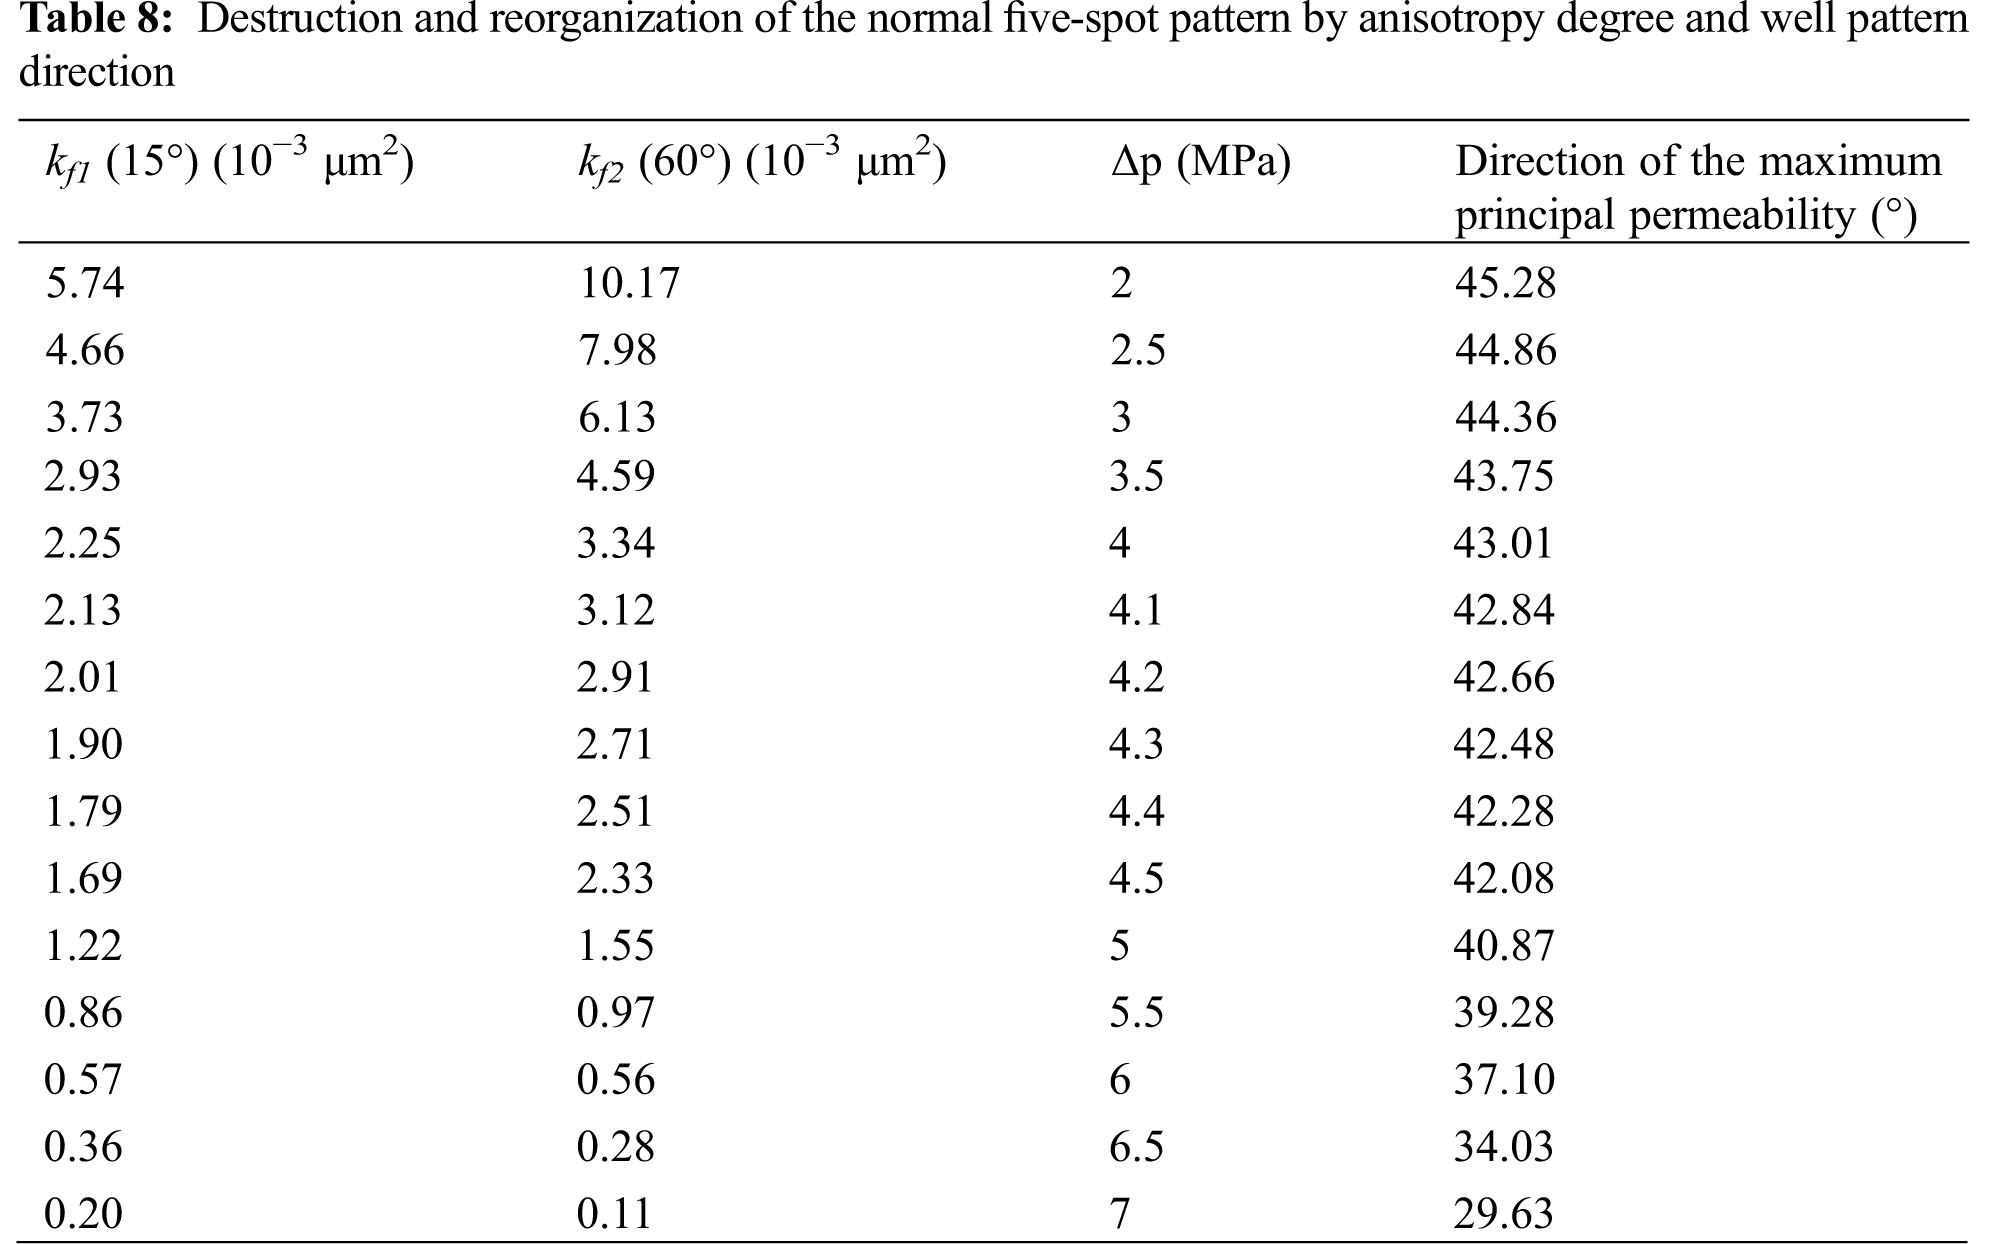
A square inverted five-spot pattern was adopted for a case study, and the characteristics of the seepage field were analyzed under different included angles between fracture direction and well pattern direction (line direction of injection-production well. The direction from the injection well to the production well is positive). The results showed that, for the square inverted five-spot pattern, when the well pattern direction in the element pattern was neither parallel nor perpendicular to the injection-production well connecting line direction, the injection-production pattern manifested complex seepage characteristics. Analyzing the destruction and reorganization of the pattern by the permeability of the reservoir with fracture-induced anisotropy [21–45] showed that the destruction and reorganization of the injection-production relationship of the pattern was simultaneously affected by the intensity of anisotropy and the included angle between fracture direction and well pattern direction. Table 7 shows the correlations of the two factors with the critical failure angle of the injection-production relationship of the five-spot pattern.
Because of the presence of fracture directional pressure-sensitive effect during waterflood development, the direction of the maximum principal permeability may constantly change with changing pore fluid pressure [18]. To protect the injection-production relationship of the original pattern from destruction and improve the development effect, this study proposed to maintain a reasonable formation pressure. Furthermore, the included angle between the direction of the maximum principal permeability and well pattern direction should always be kept within a safe range to protect the original element pattern from destruction. The specific formation pressure level needs to be determined according to reservoir parameters.
The five-spot pattern developed with two fractures in the reservoir bed was taken as example in this study. The included angles between the two fractures and the direction of the macroscopic pressure gradient were 15° and 60°, respectively. The 15° fracture had an initial permeability kf1 of 11.7 × 10⁻³ μm2, and the 60° fracture had an initial permeability kf2 of 22.9 × 10⁻³ μm2. Other parameters are listed in the following: matrix permeability: 1.36 × 10⁻³ μm2; original formation pressure: 15 MPa; water injection pressure: 28 MPa; Flowing bottom-hole pressure: 9 MPa. According to the above parameters, kx/ky = 25. In this case, the equation in Table 6 can be employed to calculate the critical failure angle of the injection-production relationship of the element pattern (either 2.5° or 42.5°). According to the superposition principle [18], the direction of the maximum principal permeability was 46.44° at the initial state. Table 8 lists the permeability values of the two fractures after a formation pressure drop of Δp and the calculation results of the direction of the maximum principal permeability. Clearly, when formation pressure decreased by 4.3 MPa, the direction of the principal permeability rotated by 3.6°. In this case, the direction of the maximum principal permeability was 42.48°, which exceeded the critical failure angle of the injection-production relationship of the element pattern. Thus, to prevent the direction of the maximum principal permeability in the reservoir bed from rotating by more than 2.5°, it is necessary to control the amplitude of the formation pressure drop below 4.3 MPa. Consequently, the injection-production relationship of the original element pattern is not destroyed.
The water injected into the fractured reservoir always preferentially flows along the direction of fracture development, and it would be very difficult to recover the oil from most matrices. Moreover, the fracture directional pressure-sensitive effect would cause a rotation of the direction of the principal permeability, thus changing the flow direction of injected water [18]. Based on these characteristics, this study integrated the following development adjustment ideas: Over the course of waterflood development, the direction of the principal permeability can be adjusted by changing the formation pressure based on an understanding of the remaining oil distribution in the study area (as illustrated by the example in Table 7). This changes the flow direction of the injected water, increases the swept volume, and improves the water-drive effect. The specific range of the required formation pressure adjustment depends on reservoir parameters and the distribution of remaining oil.
Zhao et al. [24] revised the effective stress value of a coal mass after hydraulic fracturing by applying the principle of statistical damage mechanics; they built a model for describing the liquid-solid coupling of coal seams in hydraulic fracturing (Fig. 11). Fu [26] considered the elastic deformation of reservoir bed mediums, and established a liquid-solid coupling mathematical model of the discrete fractured-vuggy model and related numerical simulation method (Fig. 12). Hood et al. [27] performed numerical simulation of liquid-solid coupling for shales with different bedding dip angles that were collected from the Niutitang Formation in Northern Guizhou Province using RFPA2D-Flow numerical simulation software (Fig. 13); moreover, they probed into the effects of the bedding structure on the evolution laws of compressive strength, elastic modulus, and acoustic emission signal of these shales. These scholars have conducted their studies on a small scale, without exploring the numerical simulation of single-well, macroscopic well arrays. Thus, the research findings of this study present a pragmatic advancement.

Figure 11: Cloud image of pore water pressure distribution in coal seams at different fracturing times [24] (a) t = 2 h (b) t = 4 h (c) t = 6 h (d) t = 8 h
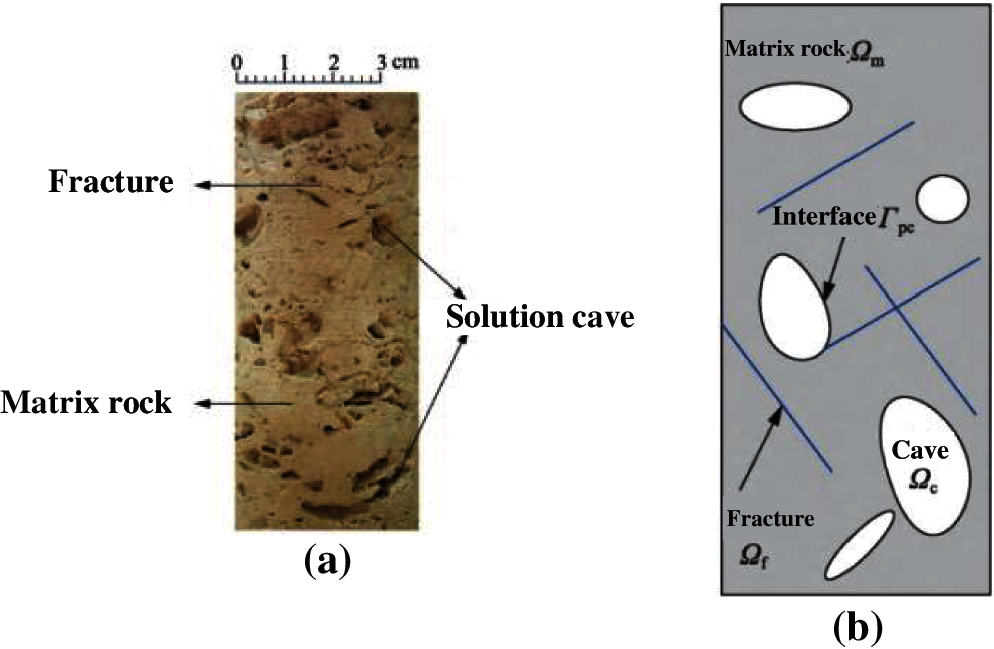
Figure 12: Shale rupture process and acoustic emission experiment [26] (a) rock core (b) discrete fractured-vuggy model
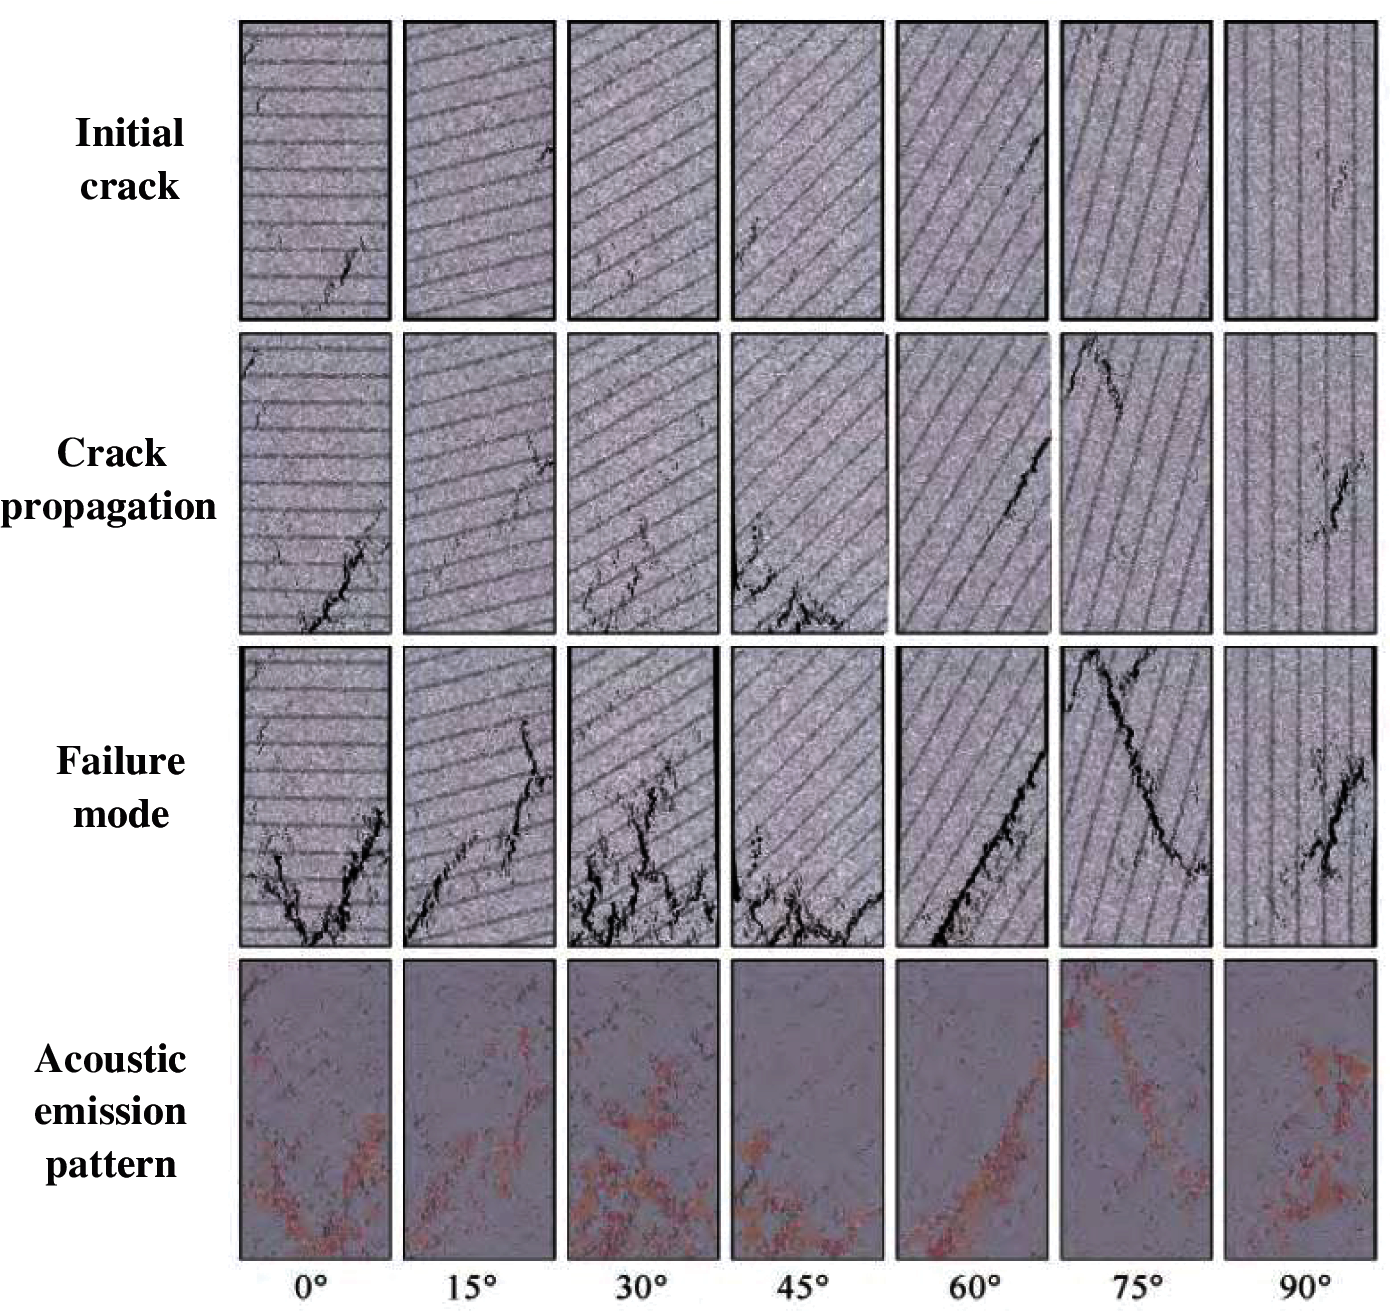
Figure 13: Shale rupture process and acoustic emission experiment [27]
Conventional numerical simulation methods mostly equate the fracture permeability to the matrix grid. When the average pore fluid pressure changes, the fracture system and matrix system deform as the same equivalent medium. When using this kind of method, it is difficult to reflect how the pressure-sensitive permeability of fractures in different directions changes. When simulating actual reservoir production, it is difficult to reflect the change of the injected fluid flow direction caused by the directional pressure-sensitive effect of fractures. As shown in Fig. 14, the range of formation pressure during the production process extends outward in a circular shape.
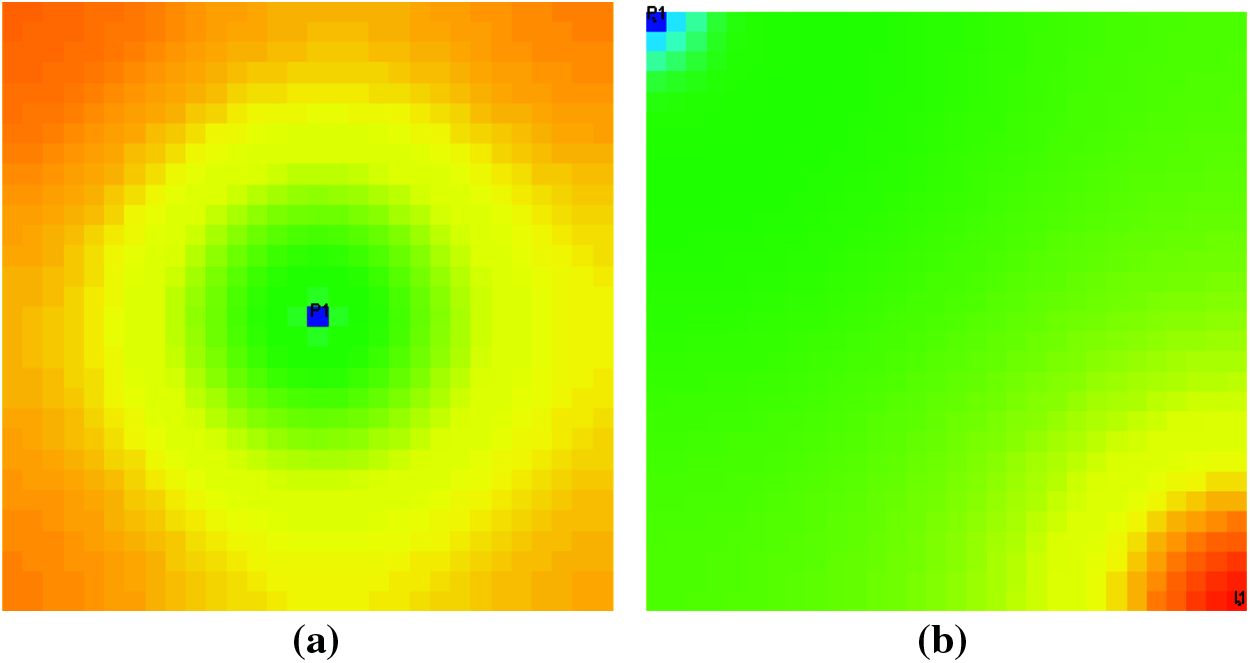
Figure 14: Formation pressure distribution map of a well after 90 days of production (a) a production well (b) one production well, one water injection well

Figure 15: Pressure diffusion process in seepage medium (a) two groups of fracture (b) initial stage (c) in production (d) stable state
The finite element method is used to carry out the multi-field fluid-solid coupling calculation of the actual oil reservoir, which requires a large amount of calculation. And the fractures and matrix are treated as independent units. Although this method can separately calculate the pressure-sensitive permeability change law of the fracture, but the injected fluid will always flow preferentially along the fractures. When simulating actual reservoir production, it is also difficult to reflect the change of the injected fluid flow direction caused by the directional pressure-sensitive effect of fractures. The red color in Fig. 15 indicates the area with higher pressure, and the dark blue indicates the area with lower pressure. It can be seen that as the production process progresses, pressure always preferentially propagates along the fractures.
The numerical simulation method established in this manuscript can not only calculate the pressure-sensitive deformation characteristics of fractures alone, but also reflect the change of the injected fluid flow direction caused by the directional pressure-sensitive effect of fractures in the simulation of actual reservoir production (Figs. 16 and 17). Therefore, the numerical simulation method established in this manuscript is more suitable for the simulation of actual reservoir production and development.
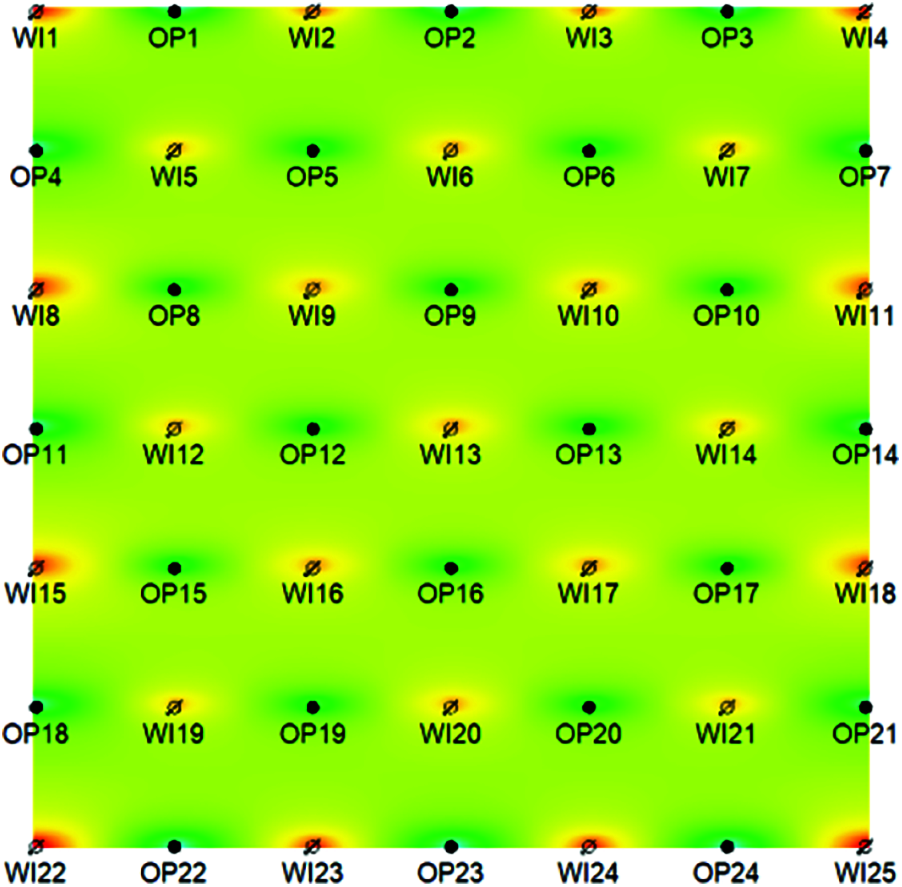
Figure 16: Distribution map of formation pressure after ten years development (five-point well pattern, 0° fracture)
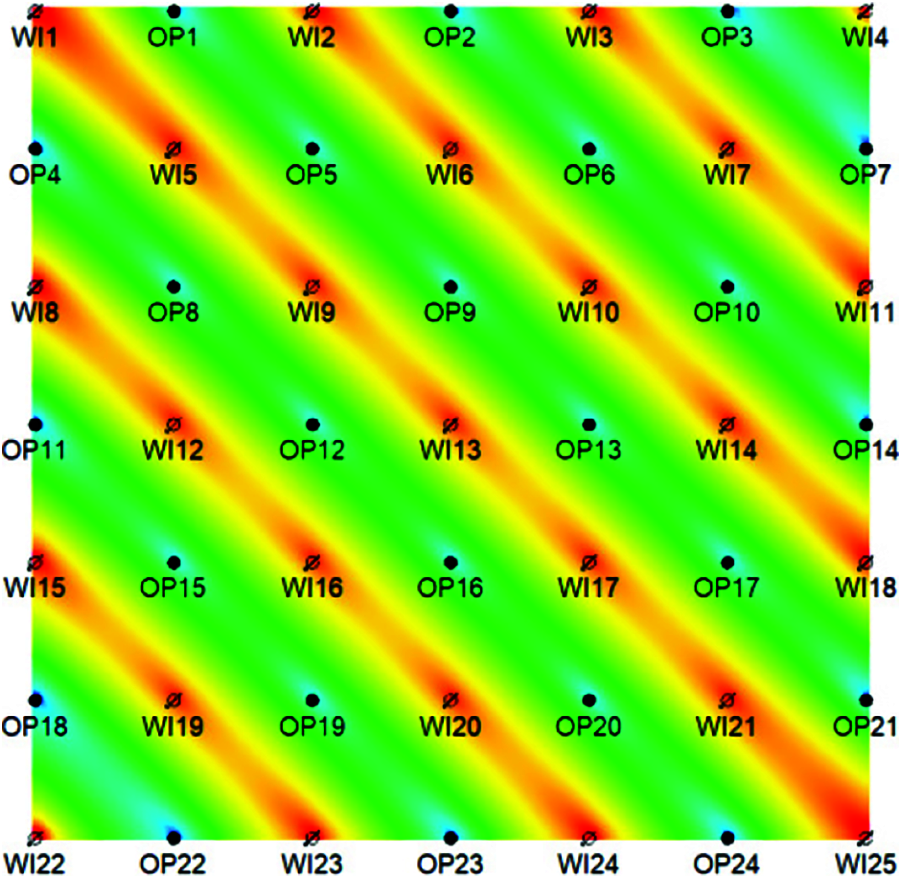
Figure 17: Distribution map of formation pressure after ten years development (five-point well pattern, 45° fracture)
(1) Based on a pressure-sensitive equation that considers fracture directivity, this study built an oil-gas-water three-phase seepage mathematical model for a pressure-sensitive, full-tensor permeability, ultralow-permeability reservoir with fracture-induced anisotropy. Moreover, this model was used it to perform a numerical simulation of an ultralow-permeability fractured reservoir. The innovation of this pressure-sensitive equation lies in the fracture as an independent research object to analyze its pressure-sensitive permeability. At the same time, the directional pressure-sensitive effect is also considered.
(2) By utilizing this pressure-sensitive equation that considers fracture directivity, a fracture pressure-sensitive numerical simulation software module was compiled to explore the seepage laws and development adjustment methods of ultralow-permeability reservoirs. As shown by the results of this study, under a fracture angle of 45°, element patterns had the highest recovery percentage. For element patterns with the same fracture direction, the recovery percentage that considers pressure-sensitive effect was always lower than the recovery percentage that was calculated without considering the pressure-sensitive effect. The inverted nine-spot pattern was more suitable for ultralow-permeability fractured pressure-sensitive reservoirs than the inverted five-spot pattern, the inverted seven-spot pattern, and the cross-row well pattern.
(3) In the waterflood development of an ultralow-permeability fractured reservoir, the fracture directional pressure-sensitive effect would cause a rotation of the direction of the principal permeability, thus changing the flow direction of the injected water. With regard to this problem, this study introduced two development adjustment ideas: 1) maintaining a reasonable formation pressure, and preventing the included angle between the direction of the principal permeability and well pattern direction from reaching the critical failure angle of the symmetry element; 2) changing the formation pressure and adjusting the direction of the principal permeability, thus altering the flow direction of the injected water and improving the water-drive effect.
Acknowledgement: This work is financially supported by the National Natural Science Foundation Project (No. 51374222), National Major Project (No. 2017ZX05032004-002), the National Key Basic Research & Development Program (No. 2015CB250905), CNPC’s Major Scientific and Technological Project (No. 2017E-0405), and SINOPEC Major Scientific Research Project (No. P18049-1).
Funding Statement: The authors received no specific funding for this study.
Conflicts of Interest: The authors declare that they have no conflicts of interest to report regarding the present study.
1. Kazemi, H., Merrill Jr, L. S., Porterfield, K. L., Zeman, P. R. (1976). Numerical simulation of water oil flow in naturally fractured reservoirs. SPE Journal, 16(6), 317–326. DOI 10.2118/5719-PA. [Google Scholar] [CrossRef]
2. Nakornthap, K., Evans, R. D. (1986). Numerical simulation and reservoir characterization of multiphase fluid flow in naturally fractured formations. SPE California Regional Meeting, pp. 1–20. DOI 10.2118/15130-MS. [Google Scholar] [CrossRef]
3. Chen, W. H., Wasserman, M. L., Fitzmorris, R. E. (1987). A thermal simulator for naturally fractured reservoirs. SPE Symposium on Reservoir Simulation, San Antonio, Texas. DOI 10.2118/16008-MS. [Google Scholar] [CrossRef]
4. Sonier, F., Souillard, P., Blaskovich, F. T. (1988). Numerical simulation of naturally fractured reservoirs. SPE Reservoir Engineering, 3(4), 1114–1122. DOI 10.2118/15627-PA. [Google Scholar] [CrossRef]
5. Por, G. J., Boerrigter, P., Maas, J. G., de, A. (1989). A fractured reservoir simulator capable of modeling block-block interaction. SPE Annual Technical Conference and Exhibition, San Antonio, Texas. DOI 10.2118/19807-MS. [Google Scholar] [CrossRef]
6. Wang, Y. H., Jiang, D., Lu, Y. (1997). Numerical reservoir simulation for refracturing low permeable formation. Petroleum Exploration and Development, 24(1), 47–19. [Google Scholar]
7. Jiang, R. Z., Hou, J. F., Zhao, M. (2003). Numerical simulative technique about low permeable sandstone fractured reservoir. Petroleum Geology & Oilfield Development in Daqing, 22(6), 30–32. [Google Scholar]
8. Yin, D. Y., Wang, G. F., Liu, G. N. (2004). Numerical simulation of imbibition oil recovery for low permeability reservoirs. Journal of Daqing Petroleum Institute, 28(2), 31–33. [Google Scholar]
9. Yuan, S. Y., Ran, Q. Q., Hu, Y. L. (2005). Numerical simulation of low permeability dual media reservoir considering fracture deformation. Progress in Natural Science, 15(1), 77–83. [Google Scholar]
10. Chen, M. F., Jiang, H. Q. (2009). Reservoir-fracture coupling numerical simulation of injector fracturing for Low-permeability reservoir. Drilling & Production Technology, 32(2), 29–32. [Google Scholar]
11. Zhang, Y., Yuan, X. C., Yao, J. (2010). Discrete fracture numerical simulation method of reservoir. Journal of Daqing Petroleum Institute, 34(3), 80–85+127. [Google Scholar]
12. Ding, Z. P., Liu, Y. T., Wang, G. X., Tu, B. (2010). Study on numerical simulation of fractured reservoir with strong heterogeneity and time variant. Fault-Block Oil & Gas Field, 17(3), 330–333. [Google Scholar]
13. Song, C. T. (2012). Numerical reservoir simulation considering threshold pressure gradient and stress sensitive phenomenon. Science Technology and Engineering, 25, 6319–6326. [Google Scholar]
14. Zhang, H. Q. (2011). Numerical simulation of low permeability fractured reservoir based on nonlinear flow law. China University of Petroleum, Beijing. [Google Scholar]
15. Wang, J., Liu, H. Q., Liu, R. J., Xu, J. (2013). Numerical simulation for low-permeability and ultra-low permeability reservoirs with considering starting pressure and stress sensitivity effects. Chinese Journal of Rock Mechanics and Engineering, S2, 3317–3327. [Google Scholar]
16. Ji, Y. C. (2013). Numerical simulation of fractured conglomerate reservoir. Journal of Oil and Gas Technology, 1, 110–112+176. [Google Scholar]
17. Wu, J. L., Liu, Y. T., Luo, J. (2014). Numerical simulation of fluid-solid coupling in fractured stress-sensitive reservoirs. Chinese Journal of Computational Physics, 4, 455–464. [Google Scholar]
18. Feng, Y. L., Liu, Y. T., Ding, Z. P., Chen, J., Mao, X. L. et al. (2018). Deformation characteristics of a set of parallel fractures and dynamic permeability model. Fault-Block Oil & Gas Field, 25(6), 736–741. [Google Scholar]
19. Gao, D. Z. (2007). Soil quality and soil mechanics. 3rd Ed., pp. 93–95. Beijing: People’s Communications Press. [Google Scholar]
20. Fanliao, W. (2017). Research on calculation and application of reservoir effective stress. China University of Petroleum (Beijing). [Google Scholar]
21. Liu, Y. T. (1999). Study on seepage theory of multi-anisotropic reservoir. China University of Petroleum (Beijing). [Google Scholar]
22. Zhao, X. D., Tang, J. P. (2020). Establishment and numerical simulation of fluid-solid coupling model of coal seam under hydraulic fracturing. Mining Safety & Environmental Protection, 47(5), 18–22. [Google Scholar]
23. Niu, J., Su, J. Z., Yan, X. (2020). An efficient numerical simulation method with hydro-mechanical coupling model of fractured shale oil reservoir based on embedded discrete fracture model and extended finite element method. Science Technology and Engineering, 20(7), 2643–2651. [Google Scholar]
24. Huang, Z. Q., Zhou, X., Liu, L. J. (2020). Numerical modeling for coupled hydro-mechanical processes in fractured-vuggy carbonate reservoirs. Journal of China University of Petroleum (Edition of Natural Science), 44(1), 96–105. [Google Scholar]
25. Lou, Y. L., Wu, Z. H., Wang, A. L. (2020). Numerical simulation of rupture process of shale under action of fluid-solid coupling. Coal Geology & Exploration, 48(1), 105–112. [Google Scholar]
26. Fu, H. (2019). Study on calculation method of shale gas reservoir reserves and numerical simulation under fluid-solid coupling. Xi’an Shiyou University. [Google Scholar]
27. Hood, J. A., Mignogna, R. B. (1993). Isolating fracture-induced anisotropy from background anisotropy. USA: Springer. [Google Scholar]
28. Santos, J. E., Martínez Corredor, R. (2017). Analysis of fracture induced anisotropy in a Biot medium as function of effective pressure. Biot Conference on Poromechanics, pp. 1682–1689. ParisTech, Paris, France. [Google Scholar]
29. Carcione, J. M. (2012). Numerical experiments of fracture-induced velocity and attenuation anisotropy. Geophysical Journal International, 191, 1179–1191. DOI 10.1111/j.1365-246X.2012.05697.x. [Google Scholar] [CrossRef]
30. Barton, N. (2007). Fracture-induced seismic anisotropy when sharing is involved in production from fractured reservoirs. Journal of Seismic Exploration, 16(2–4), 115–143. [Google Scholar]
31. Papangelo, A., Scheibert, J., Sahli, R. (2019). Shear-induced contact area anisotropy explained by a fracture mechanics model. Physical Review E, 99(5), 1–11. DOI 10.1103/PhysRevE.99.053005. [Google Scholar] [CrossRef]
32. Kim, G. Y., Narantsetseg, B., Ryu, B. J., Yoo, D. G., Lee, J. Y. et al. (2000). Fracture orientation and induced anisotropy of gas hydrate-bearing sediments in seismic chimney-like-structures of the ulleung basin, East Sea. Marine and Petroleum Geology, 47, 182–194. DOI 10.1016/j.marpetgeo.2013.06.001. [Google Scholar] [CrossRef]
33. Colin, M., Sayers. (2011). Characterizing production-induced anisotropy of fractured reservoirs having multiple fracture sets. Geophysical Prospecting, 60(5), 919–939. DOI 10.1111/j.1365-2478.2011.01030.x. [Google Scholar] [CrossRef]
34. Sil, S., Srinivasan, S. (2009). Stochastic simulation of fracture strikes using seismic anisotropy induced velocity anomalies. Exploration Geophysics, 40(3), 257–264. DOI 10.1071/EG08129. [Google Scholar] [CrossRef]
35. Prioul, R., Donald, A., Koepsell, R. (2007). Forward modeling of fracture-induced sonic anisotropy using a combination of borehole image and sonic logs. 77th Annual Meeting, San Antonio, Texas, USA, SEG. [Google Scholar]
36. Koyama, T., Fardin, N., Jing, L. (2006). Numerical simulation of shear-induced flow anisotropy and scale-dependent aperture and transmissivity evolution of rock fracture replicas. International Journal of Rock Mechanics & Mining Sciences, 43(1), 89–106. DOI 10.1016/j.ijrmms.2005.04.006. [Google Scholar] [CrossRef]
37. Auradou, H., Drazer, G., Hulin, J. P. (2005). Permeability anisotropy induced by the shear displacement of rough fracture walls. Water Resources Research, 41(9), 1–10. DOI 10.1029/2005WR003938. [Google Scholar] [CrossRef]
38. Koyama, T., Fardin, N., Jing, L. (2004). Shear induced anisotropy and heterogeneity of fluid flow in a single rock fracture by translational and rotary shear displacements—A numerical study. International Journal of Rock Mechanics & Mining Sciences, 41(3), 426. DOI 10.1016/j.ijrmms.2003.12.026. [Google Scholar] [CrossRef]
39. Schoenberg, M. A. (2002). Time-dependent anisotropy induced by pore pressure vaiation in fractured rock. Journal of Seismic Exploration, 11(1), 83–105. [Google Scholar]
40. Ojo, S. A., Shrestha, S., Rassi, J. E. (2021). The use of compact specimens to determine fracture toughness anisotropy of Ti–6Al–4V additively manufactured for repair. Materials Science and Engineering A, 823(6), 141779. DOI 10.1016/j.msea.2021.141779. [Google Scholar] [CrossRef]
41. Nejati, M., Bahrami, B., Ayatollahi, M. R. (2021). On the anisotropy of shear fracture toughness in rocks. Theoretical and Applied Fracture Mechanics, 113(1), 102946. DOI 10.1016/j.tafmec.2021.102946. [Google Scholar] [CrossRef]
42. Leclerc, J., Marteleur, M., Colla M, S. (2021). Ductile fracture of high strength steels with morphological anisotropy, Part II: Nonlocal micromechanics-based modeling. Engineering Fracture Mechanics, 2021(1), 107716. DOI 10.1016/j.engfracmech.2021.107716. [Google Scholar] [CrossRef]
43. Karanam, M. K., Gulivindala, G., Chinthapenta, V. R. (2021). Effect of anisotropy on the ductile fracture in metal reinforcements of brittle matrix composites. Theoretical and Applied Fracture Mechanics, 112(3), 102923. DOI 10.1016/j.tafmec.2021.102923. [Google Scholar] [CrossRef]
44. Muhammad, W., Brahme, A. P., Ibragimova, O. (2021). A machine learning framework to predict local strain distribution and the evolution of plastic anisotropy & fracture in additively manufactured alloys. International Journal of Plasticity, 136, 102867. DOI 10.1016/j.ijplas.2020.102867. [Google Scholar] [CrossRef]
45. Chatterjee, S., Askari, R., Jeng, J. Y. (2020). Stochastic fracture simulation using pixel-based multiple-point geostatistics by integrating seismic radial anisotropy and well data: Applications in two hydrology sites. Environmental Earth Sciences, 79(23), 1–19. DOI 10.1007/s12665-020-09258-y. [Google Scholar] [CrossRef]
46. Xie, W. W. (2018). Application of streamline method for study on water flooding development characteristics in anisotropic oil reservoirs. China University of Geosciences (Beijing). [Google Scholar]
 | This work is licensed under a Creative Commons Attribution 4.0 International License, which permits unrestricted use, distribution, and reproduction in any medium, provided the original work is properly cited. |