| Fluid Dynamics & Materials Processing |
DOI: 10.32604/fdmp.2022.017593
ARTICLE
Analysis of the Microstructure and Macroscopic Fluid-Dynamics Behavior of Soft Soil after Seepage Consolidation
Institute of Civil Engineering, Huanghe S&T University, Zhengzhou, 450063, China
*Corresponding Author: Fang Jin. Email: d1ixav@163.com
Received: 22 May 2021; Accepted: 29 July 2021
Abstract: The purpose is to study the microstructure and macroscopic fluid-dynamic behavior of soft soil after it has been subjected to a seepage consolidation procedure. First, the microscopic pore structure of soft clay is quantitatively studied by a scanning electron microscope technique. Second, the average contact area rate of soil particles is obtained employing statistical analysis applied to microscopic images of soft soil, and the macroscopic porosity of soft clay is determined through an indoor geotechnical test. Finally, mathematical relationships are introduced by fitting the results of the test. The results show that the unmodified empirical equation for the permeability coefficient of coarse-grained soil produces large errors in calculations related to cohesive soils. By contrast, the permeability coefficient calculated by the empirical equation modified by the average contact area ratio theory is in good agreement with the measured average value of the indoor test.
Keywords: Seepage consolidation; soil structure; microstructure; macro-mechanics
The characteristics of the microstructure of soil have important practical significance in engineering. A large number of studies show that the state and change of the microstructure of soil affect mechanical properties [1]. Many facts prove that the mechanical properties of soil depend essentially on its microstructure [2,3]. The purpose of the previous research on the microstructure of soil is to explore the influence of internal factors on external physical and mechanical properties, and find out the internal relationship between microstructure and macroscopic mechanical parameters. The macroscopic mechanical properties of soil are extremely complex, and they cannot be properly analyzed by traditional methods [4]. Generally speaking, soil structure refers to the form of arrangement, void properties, soil particles, or the interaction between particles and fabric [5]. Soil has a certain structure, which is reflected in the evolution law and the natural structure of soil. The fuzziness and uncertainty of physical and mechanical behavior are embodied at the macro level.
The calculation models and constitutive relations in the soil mechanics theory are established based on traditional methods. These calculation models are widely used in engineering and have made some achievements. However, these models cannot show the characteristics of the microstructure of soil only at the macro level, or significant differences between theoretical calculation and actual monitoring are caused in the engineering field [6]. it is necessary to explore the internal relationship between the microstructure and the macroscopic physical and mechanical properties of soil, which enriches the traditional calculation theory and helps to construct the mechanical theory suitable for analyzing the mechanical behavior of soil. Although the concept of microstructure is proposed several decades ago and there is a lot of research on the microscopic mechanism of soil, the research on the internal relationship between soil microstructure and macroscopic mechanical properties is still in its infant.
The soft clay in and around the area is taken as the research object. Based on the SEM test, the quantitative analysis of the microstructure of soft clay is made according to the statistics. Combined with the macro properties and micro parameters of soft clay, the relationship between the macro physical parameters and micro parameters of the clay is constructed, and the research is conducted by bringing microstructure into the macro mechanical calculation. The innovation of the study is to find new analysis ideas and methods to predict the change trend and range of some properties by the relationship between macro properties and microstructure of soil, which is helpful to explaining the mechanical behavior of soil.
2 Research Progress of Soft Soil
Among 137 papers in the field of soil mechanics and engineering in the early 20th century, there are 53 on the deformation of the soft soil base (including embankments, dams and airports), accounting for the largest proportion of 39% of the total. The studies on the deformation of the sand case take up 20%. Those on the deformation of the pile foundation account for 15%. The number of the studies on the deformation of the construction base is 12, accounting for 9%. From the academic conference and the studies on the deformation of the soil base in recent years, the characteristics of the research on the deformation of soil are summarized as follows: (1) Although the problem of base deformation and differential settlement is from the 1990s, more and more attention has been paid, and a lot of manpower and material resources have been invested in research. (2) Settlement calculation is conducted by various methods, which not only process and utilize the observed data, but also the research on advanced prediction methods; (3) With the development of science and technology, new methods of treating the deformation of the soil base are emerging. In addition, some old methods are updated, like the vacuum preloading method.
Li et al. [7] comprehensively and systematically studied the rheological deformation mechanism of soil. On the basis of studying the physical nature of deformation, various forms of creep are analyzed in detail, and a comprehensive equation describing deformation is proposed. The processing method and equation application method are illustrated by examples, and the rheological properties of soil are simply revealed. Gao et al. [8] systematically summarized the experience of treating the problem of soft soil, including the deformation, strength and permeability characteristics of soft clay. Zhai et al. [9] discussed the characteristics of soft clay in coastal areas and the engineering problems caused by it, the shear strength and deformation characteristics of soft clay, and the calculation method that has a significant impact on the study of the engineering properties of soft clay. Zhang et al. [10] studied the basic theory and analysis method of rheological mechanics in geotechnical engineering, and promoted the development and popularization of soil rheology. Cała et al. [11] summarized the characteristics and laws of deformation displacement and stress of rock and soil under external forces, such as the construction and excavation according to the system of soft clay, and described the rheological test of rock and soil, the rheological theory and method of rock and soil, the numerical method of rheological analysis of rock and soil, and the application of rheological analysis in various geotechnical engineering field. Hu et al. [12] obtained several numerical solutions of soil consolidation and rheology by studying the consolidation rheological theory of soft soil, and the influence of consolidation and rheology on the stability of soil. In recent years, with the rapid development of urban construction, the research on rheological properties of soft soil is more extensive and profound.
3 Methods of Microstructure Analysis and Macro-Mechanics
3.1 Characteristics of the Microstructure of Soft Soil
3.1.1 Micro-Porosity of Soft Soil
The soft clay is cut into small pieces and dried in the oven, and the dried soil samples are crushed and sieved, and then placed in a sealed bucket [13]. The microstructure of the low-temperature treated soil sample remains unchanged, and it is dried by a high-speed pump. The groove in the middle of the small sample keeps its original structure. The soil sample is separated at the groove and the flat section is selected for gold spraying. Finally, the SEM electron microscope is used to do scanning. The density is measured by sealing and the porosity of the sample is calculated.
The volume of holes is calculated by calculus, that is, the volume is obtained by multiplying the area of each section by the corresponding height [14]. The image pixel represents the plane direction, and the threshold represents the height. In the SEM image, different threshold values correspond to the area of holes in different sections. The gray values corresponding to the threshold values
The volume of the irregular body is obtained by infinitely reducing
The equation of the three-dimensional porosity of soil at any threshold gray level is as follows:
In Eq. (3),
3.1.2 Average Contact Area Ratio of Soft Soil
The macro-porosity obtained by the indoor geotechnical test is compared with the statistical method combined with the three-dimensional porosity of microscopic images. When the three-dimensional porosity calculated by statistics is equal to the macro-porosity in numerical value, the contact area is defined as the corresponding pixel in the threshold gray analysis of IPP images. The average contact area rate is the ratio of the pixel area to the total pixel area, and it is expressed by
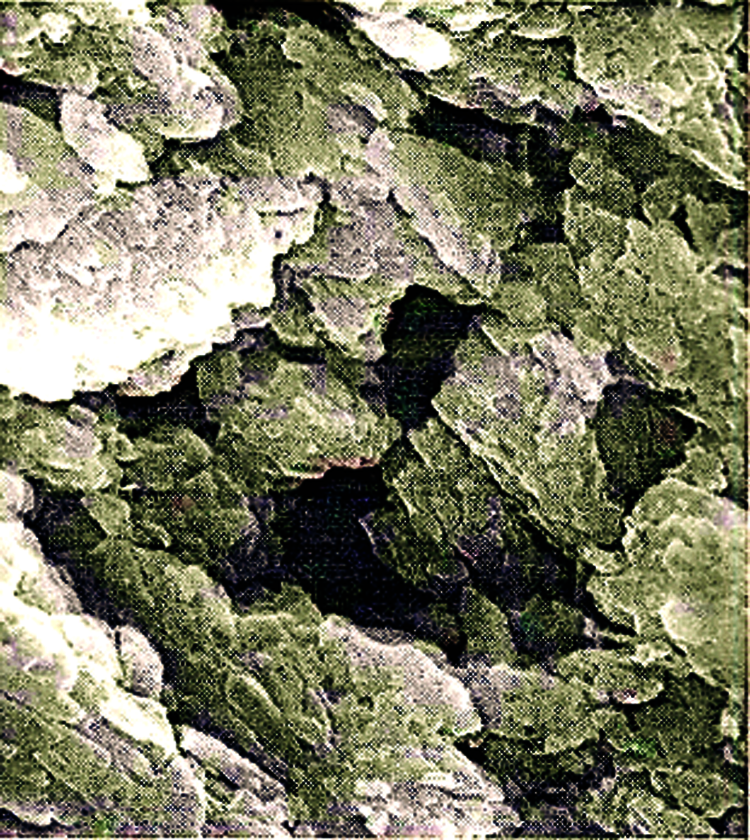
Figure 1: The SEM image of a soft soil hole magnified 1600 times
According to the statistical method of the average contact area ratio, 200 SEM images obtained by the scanning electron microscope are analyzed and counted. The average contact area ratio is used to express the samples with different porosity by the statistical mean of five SEM images. The contact area on the soil section is
Since porosity
The statistical results of porosity and average contact area ratio of soft soil in the three regions are fitted by OriginPro 9.1 software. Annular area
According to the above equation, the relationship between porosity and the average pore area rate of soft soil is calculated by the statistical method. Since the thickness of water film changes with the change of the quality of soil, the relationship between porosity
The values of
According to the above equation, average contact area ratio
3.2 Macroscopic Permeable Fluid Dynamics
The viscoelastic deformation of soil under the action of external force generally occurs. When the stress exceeds a certain finite value, the plastic flow deformation of soil will arise with time instead of the flow deformation under the action of any small shear force. The finite value is the yield stress of soft clay, and this kind of flow is a plastic fluid. The rheology of soft clay can be expressed by the plastic fluid. When the shear stress is less than the yield stress, the soil will not flow and it is solid. When the shear stress exceeds the yield stress, the plastic flow appears like the Newtonian fluid, which is called the Bingham fluid. The plastic rheological model of soft clay can be divided into the Newtonian fluid model and the non-Newtonian fluid model. The non-Newtonian fluid model includes the Bingham fluid model and the generalized Bingham fluid model. The soil has both viscous and plastic properties, and it is called viscoelasticity. When the stress of the viscoelastic body reaches a critical value under load, yield and flow occur and its deformation rate is related to the viscosity of the body. The important engineering properties of soil include its permeability. The parameters needed to analyze the stability of geotechnical structures under rainfall, water level changes, and the dynamic water pressure in soil are permeability coefficients. Soil particle skeleton and fluid properties are two factors affecting the permeability coefficients of soil [16].
3.2.1 Permeability Coefficient Equations
It is generally concluded that there is a proportional relationship between the square and size of the characteristic particle and the permeability coefficient of non-viscous soil. For example, when
There are many empirical equations about the permeability coefficient of coarse-grained soil in the field of geotechnical science, which can reflect the main factors affecting the permeability coefficient. First, the Terzaghi permeability coefficient equation is expressed as:
The effective particle size
Second, the permeability coefficient equation of China’s Academy of Water Resources and Hydropower Research is expressed as:
The effective particle size
Third, the Coson-Carmen permeability coefficient equation is expressed as:
Fourth, the consolidation degree equation is expressed as:
Fifth, the Darcy permeability coefficient equation is expressed as:
Sixth, Stokes established a more classical capillary model by using capillary instead of pore channel to derive the Darcy flow theory, which is expressed as:
3.2.2 Equations of Modified Permeability Coefficients
Total void ratio
The empirical equation applicable to the permeability coefficient of cohesive soil is obtained by using the effective void ratio to modify the equation of the permeability coefficient of a large sand base:
The effective particle size
The modified equation expressed by the permeability coefficient of the China’s Academy of Water Resources and Hydropower Research is:
The effective particle size
The above equation is modified when it is expressed by the Cusson Carmen permeability coefficient equation, and the empirical equation of the permeability coefficient of cohesive soil is as follows:
After it is simplified, the equation is expressed as:
The empirical equation for the permeability coefficient of cohesive soil expressed by consolidation degree equation is modified as:
The empirical equation of the permeability coefficient of clay expressed by the Darcy permeability coefficient equation is modified as:
Average pore area ratio
4 Analysis of the Results of Microstructure and Macro-Mechanics
4.1 Relationship between the Average Contact Area Ratio and Macro-Porosity
The relationship between the porosity and the threshold is shown in Fig. 2.
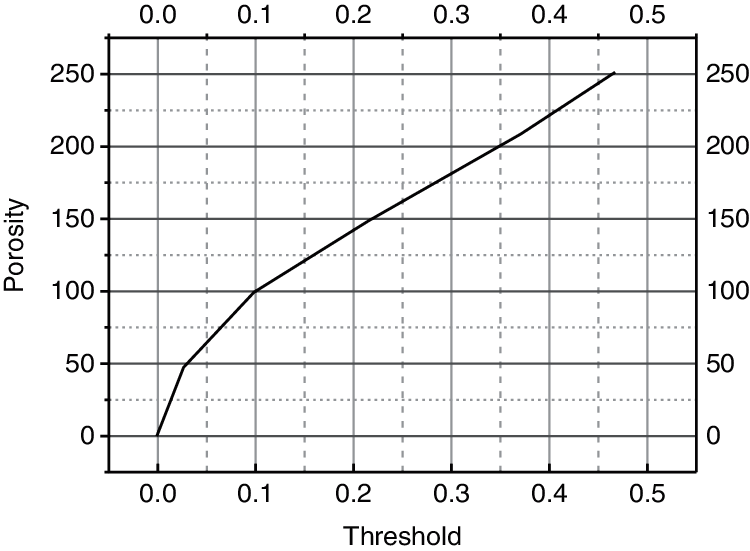
Figure 2: Relationship between the porosity and the threshold
The above figure shows the relationship between the three-dimensional porosity of the SEM image and the threshold when the magnification of the soil sample is 1600. The macro-porosity of the soil sample is 0.369, and the binary gray pixel is 100300. The average contact area of the soil sample is
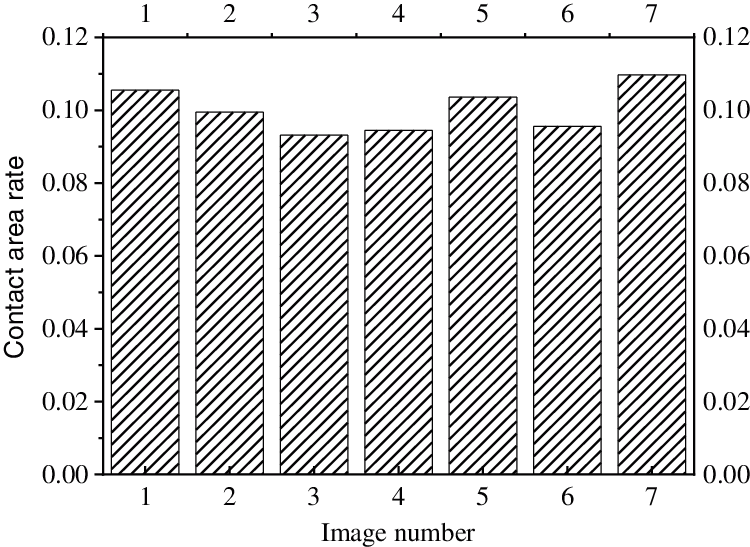
Figure 3: Analysis of contact area ratio at 800 magnification
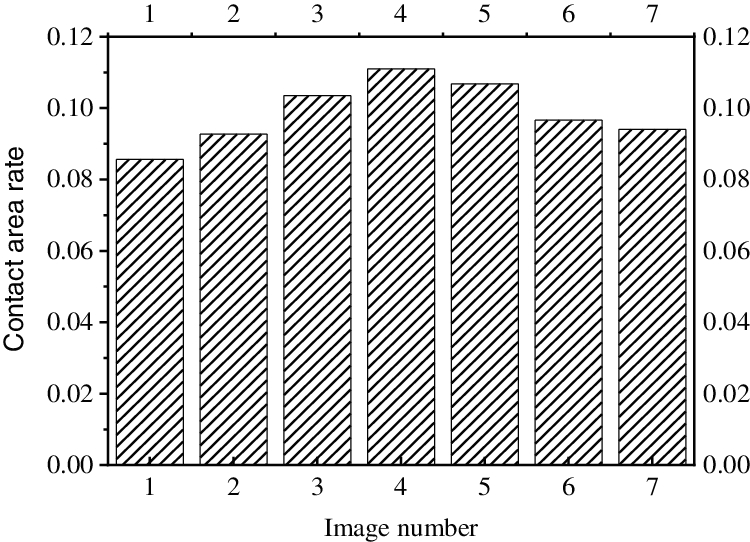
Figure 4: Analysis of contact area ratio at 1600 magnification
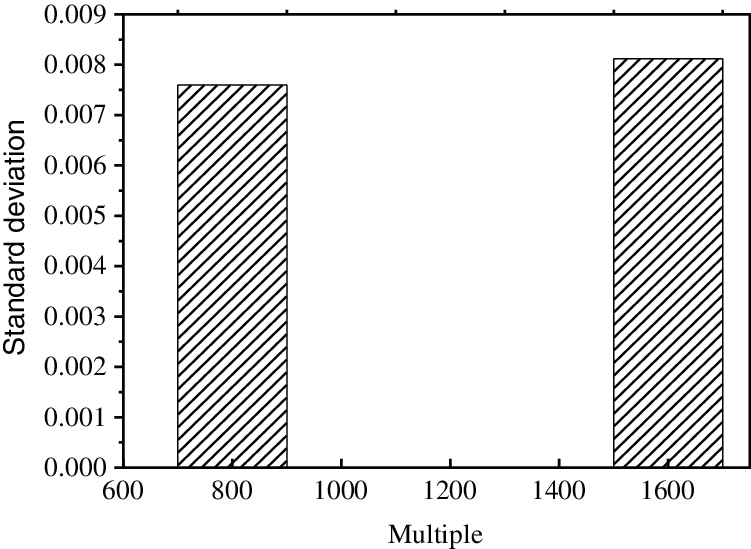
Figure 5: Analysis of contact area ratio of standard deviation
The data in the figure show that the standard deviation is very small, and the contact area rate is about 10%, which is obtained based on the equality of the three-dimensional porosity and macro-porosity. The relationship between the average contact area ratio and the porosity of soil under different porosity is shown in Fig. 6.
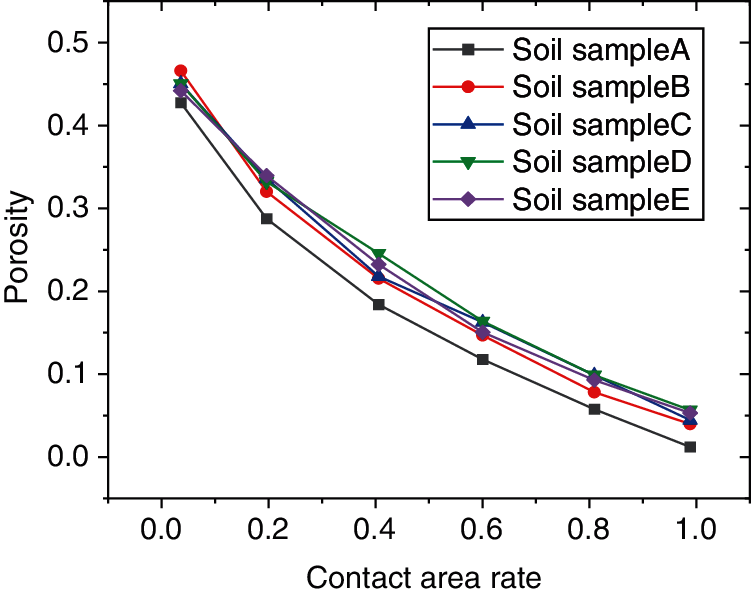
Figure 6: Relationship between porosity and the average contact area ratio
The above figure shows that the average contact area ratio increases with the decrease of porosity. The porosity obtained in this experiment is between 0.372 and 0.541, because the structure of the soil sample with macro-pores is relatively loose, and it is impossible to carry out the electron microscope test. The small porosity is hindered by adhesive water and limited by compressive work, so it is difficult to compact. When the porosity increases to a certain value, the contact area ratio decreases. The final result should be that the porosity tends to 1 when the average contact area ratio tends to zero, and the average contact area ratio tends to 1 when the statistical porosity approaches zero. This phenomenon conforms to the objective law between porosity and the contact area ratio.
The physical indexes of soft soil obtained from indoor geotechnical tests are shown in Figs. 7–9.
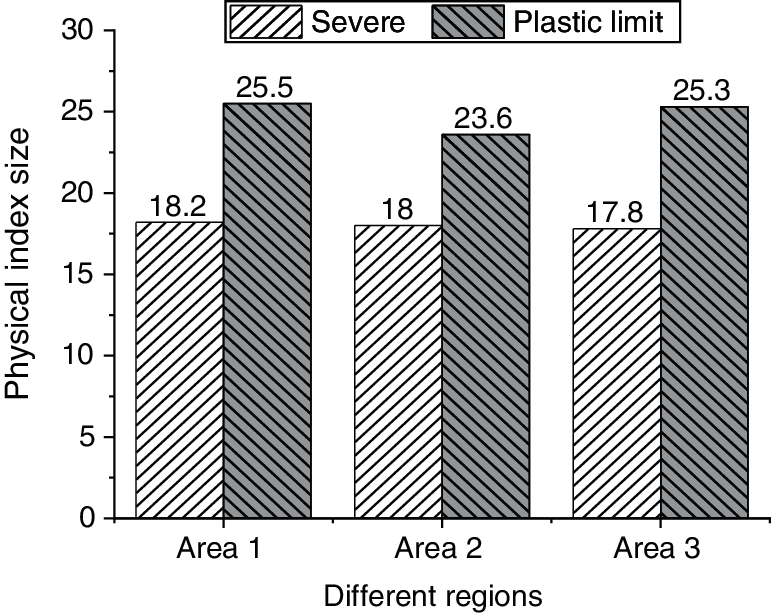
Figure 7: Severe and plastic limit of soft soil
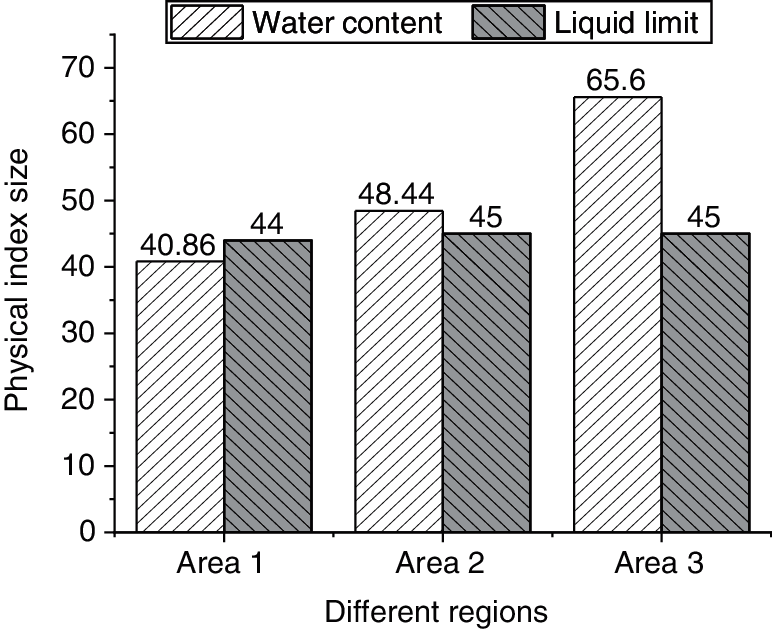
Figure 8: Water content and liquid limit of soft soil
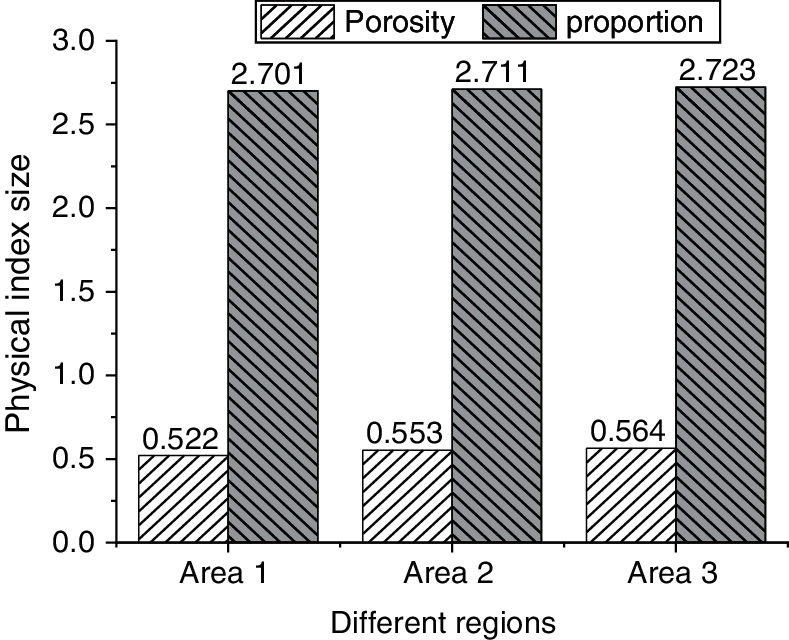
Figure 9: Porosity and proportion of soft soil
The layers of soft soil are extended in the coastal areas. The soil used here is the soft soil in the selected study areas and is not limited to a certain area. Three different kinds of soft soil are collected to be tested and have made some achievements. These kinds of soil belong to the typical soft soil in coastal areas and have the general engineering characteristics, such as high content of natural water, large void ratios, high compressibility, low strength, and poor permeability. The minerals of the soil are mainly illite. And then, the fitting curve is obtained. It is known from the law of mathematical statistics that the fitting effect of the curve is good. The fitting of soft soil in different regions shows that the relationship between
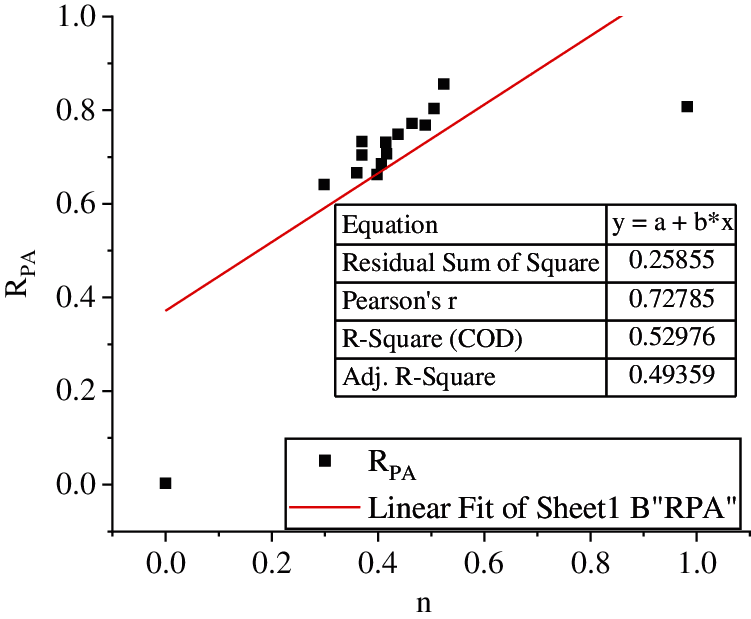
Figure 10: Results of regression analysis 1
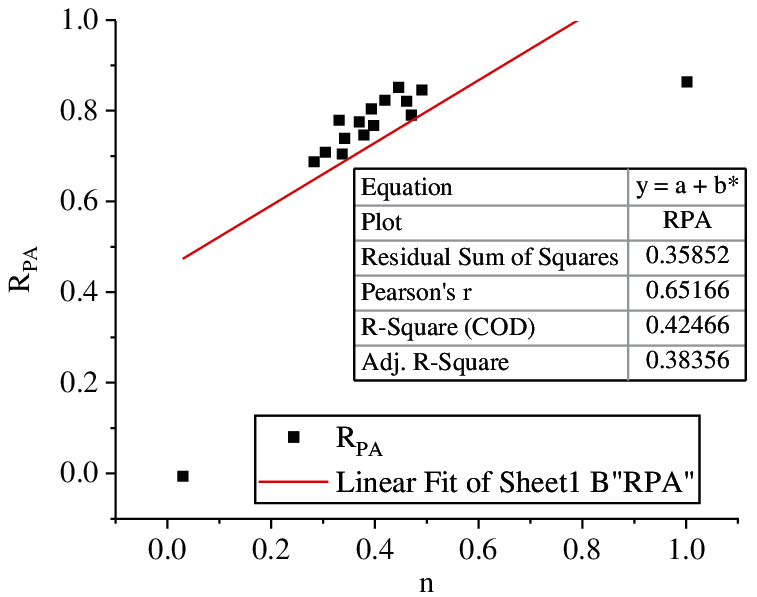
Figure 11: Results of regression analysis 2
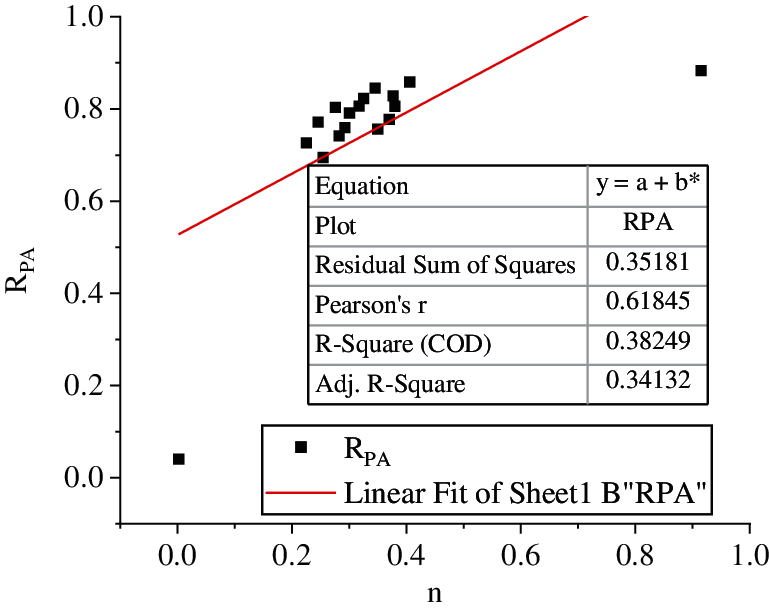
Figure 12: Results of regression analysis 3
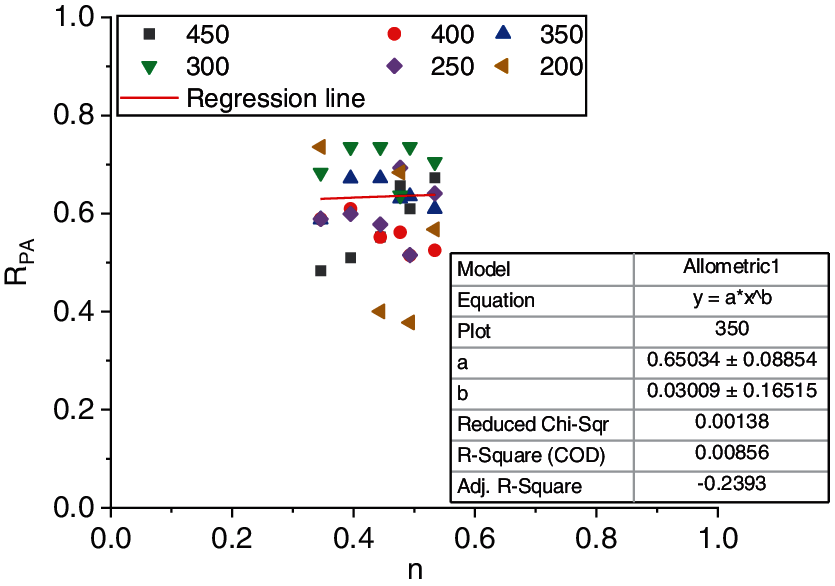
Figure 13: Results of regression analysis of the thickness of bound water film in Region 1
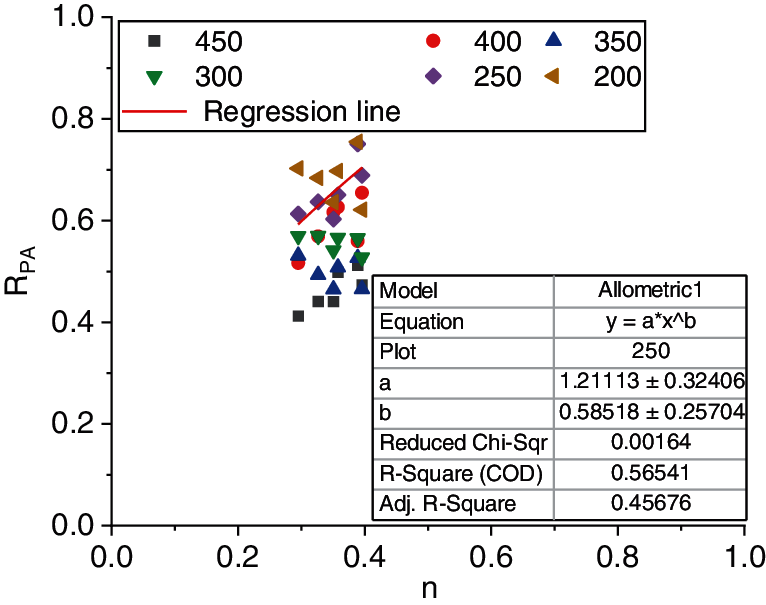
Figure 14: Results of regression analysis of the thickness of bound water film in Region 2
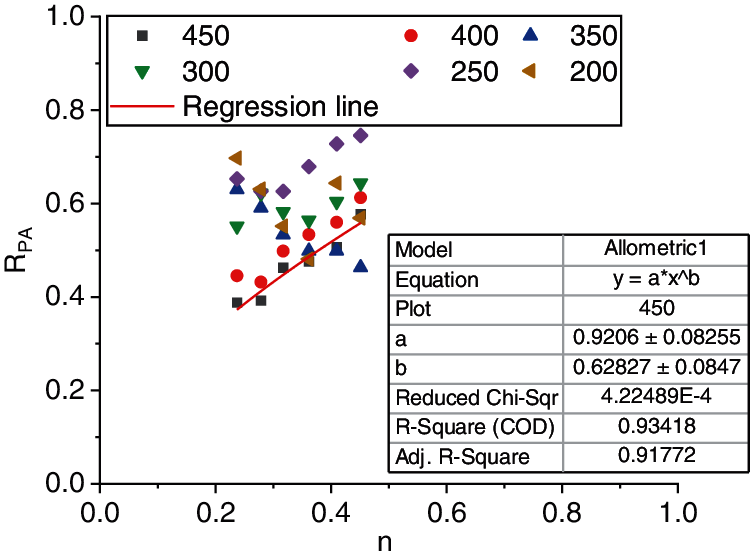
Figure 15: Results of regression analysis of the thickness of bound water film in Region 3
The figure shows that after the thickness of soil particles is combined with the bound water film, the basic trend of the relationship between the average pore area rate and porosity of soft soil is roughly the same, and the curtain function relationship between the two is well fitted. In the study area, the main components of soft soil are illite, montmorillonite, kaolinite, and chlorite. The results show that illite is the main mineral in the most of the soft soil, because illite can exist in alkaline, neutral, or weak acid environments, as well as in soft soil with various phases. For the soft soil in Area A, the main mineral is illite, with a small amount of kaolinite, chlorite, and illite montmorillonite mixed layer; The clay minerals of B and C are mainly illite, with little kaolinite and montmorillonite. Due to the different materials and soil quality, the thickness of the combined water film is set as 300 Å, and then the ranges of
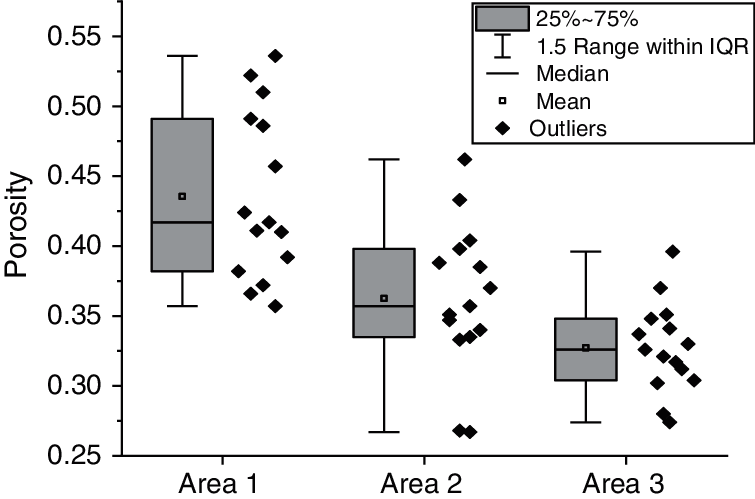
Figure 16: Calculation results of soil values in Region 1 when the thickness of the bound water film is 300 Å
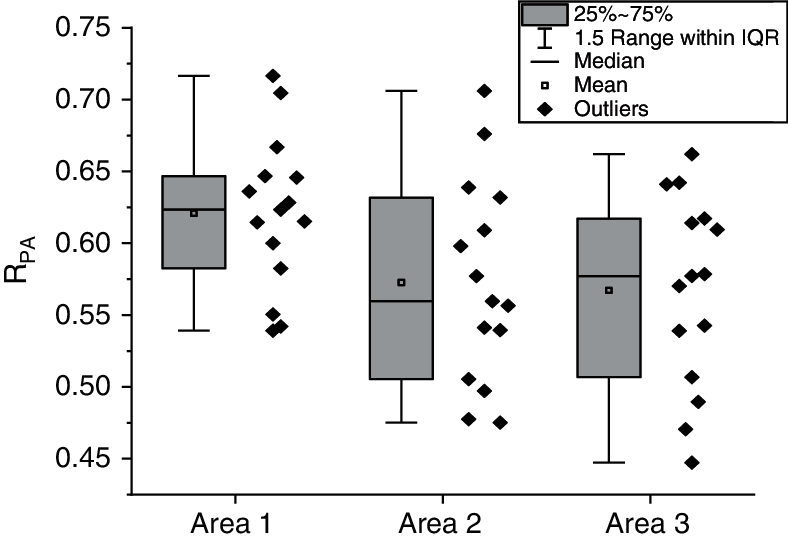
Figure 17: Calculation results of soil values in Region 2 when the thickness of the bound water film is 300 Å
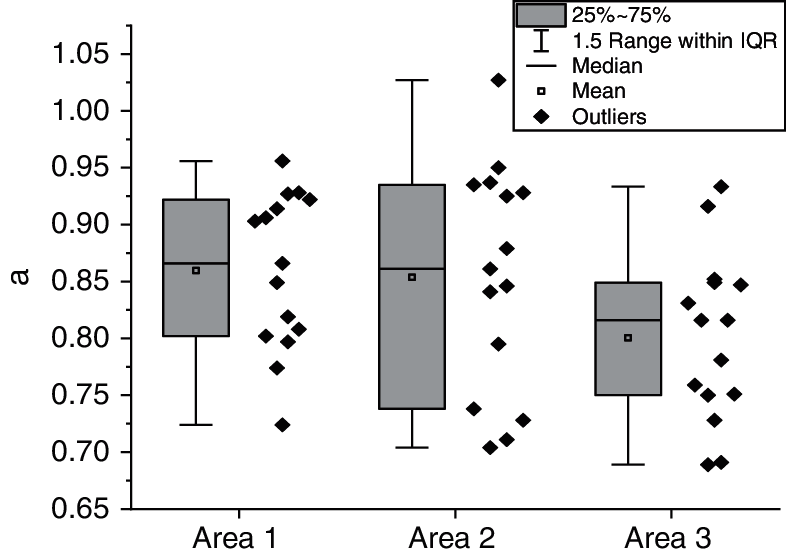
Figure 18: Calculation results of soil values in Region 3 when the thickness of the bound water film is 300 Å
The figure shows that the value of
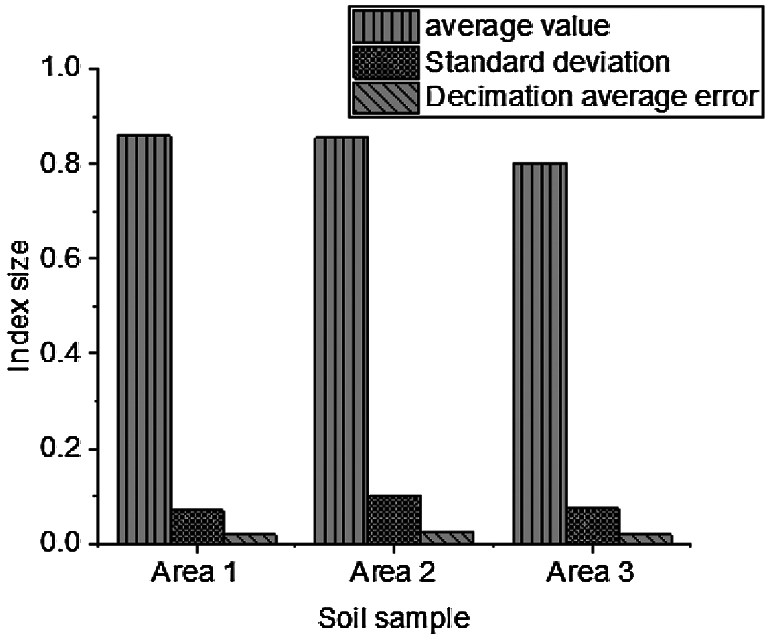
Figure 19: Distribution of parameter estimation (mean, standard deviation, sampling average error)
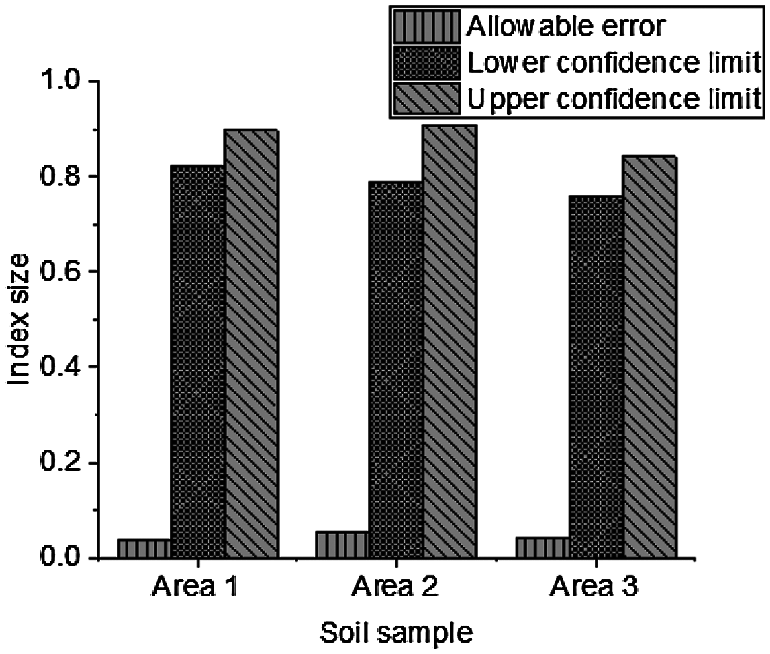
Figure 20: Distribution of parameter estimation (allowable error, upper and lower limits of the confidence)
The results of parameter estimation show that the range of
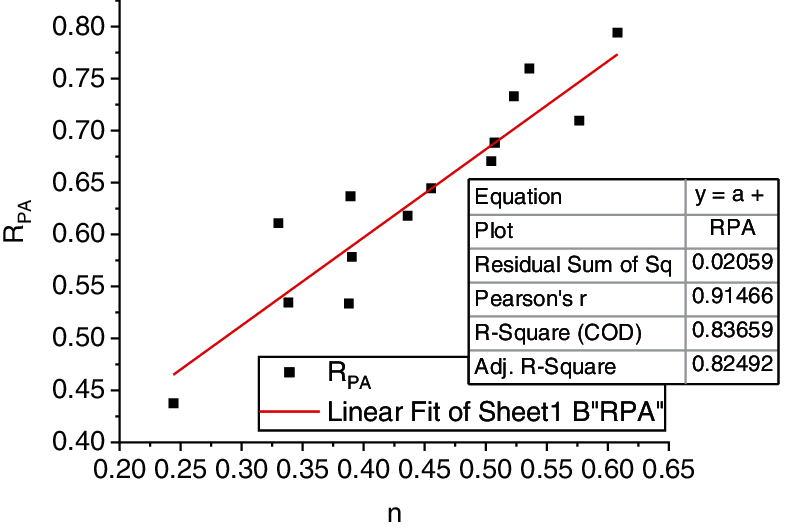
Figure 21: Results of statistics and theoretical analysis of soft soil in Region 1
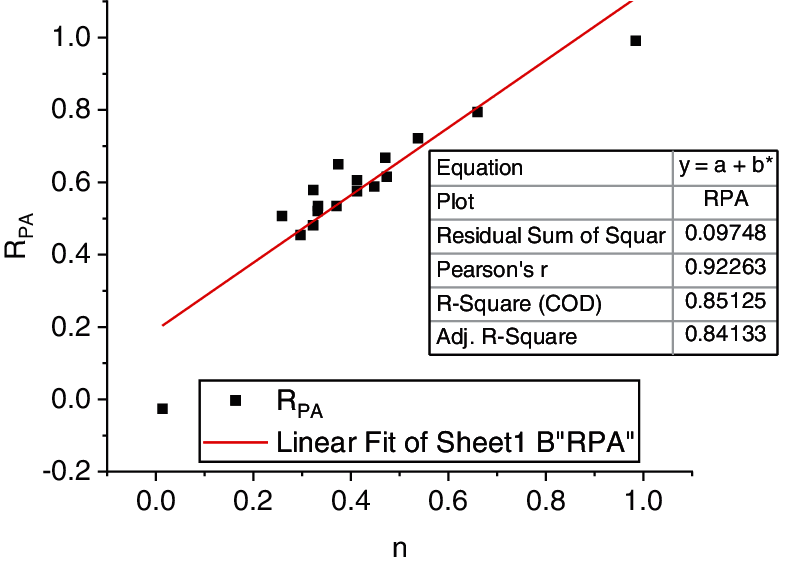
Figure 22: Results of statistics and theoretical analysis of soft soil in Region 2
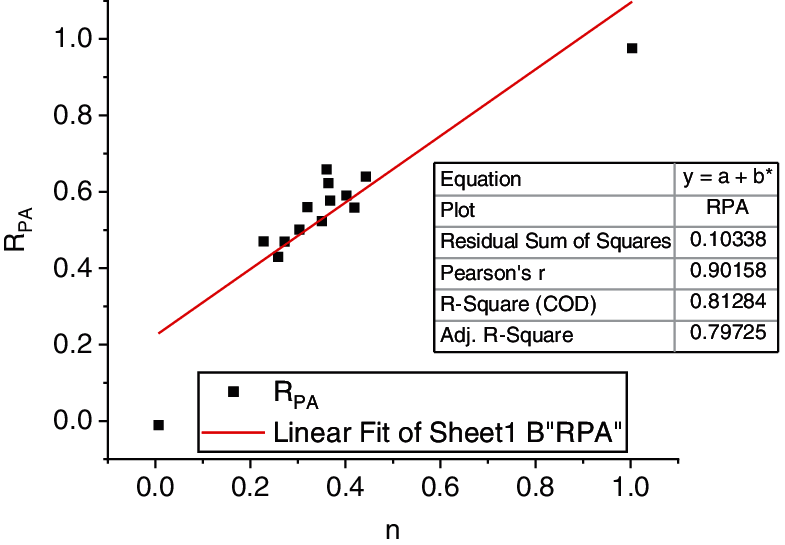
Figure 23: Results of statistics and theoretical analysis of soft soil in Region 3
The above figure shows that the statistical value is distributed in the vicinity of the theoretical curve. It is concluded that the fitting condition is better in Regions 1 and 2, and
After the micro test results of soft soil in area A and surrounding areas under different porosity are analyzed, the data show that there is a certain relationship between the porosity of soft soil and the average contact area ratio, and the average contact area ratio decreases with the increase of the porosity of soil. With the help of the analysis software, the relationship between porosity and average pore area ratio is fitted, and the equation of the relationship is obtained.
4.2 Results of the Permeability Coefficient of Macroscopic Fluid
The physical indexes of the soft soil in the three regions obtained by indoor geotechnical tests are shown in Fig. 24.
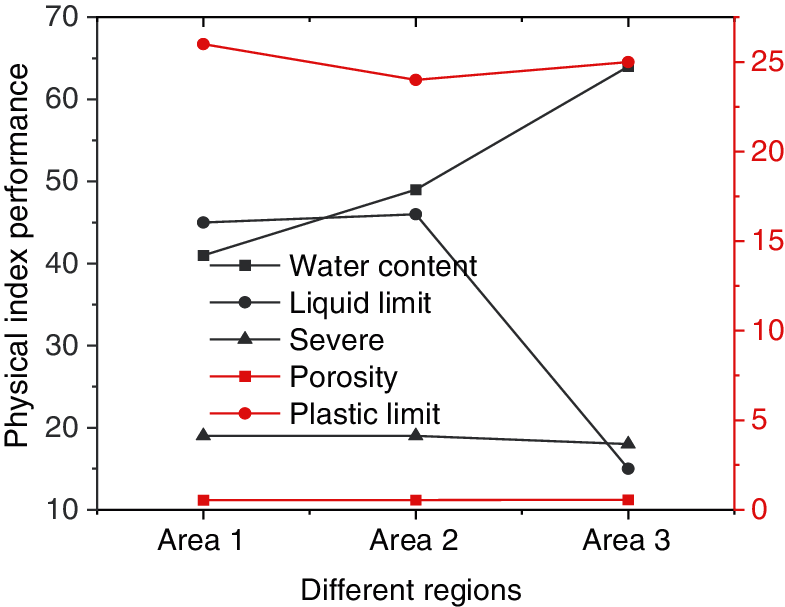
Figure 24: The performance of physical indexes of soft soil
The Figure shows that the soft soil in the three regions in the test is similar in weight and different in porosity. About
The permeability coefficients of the three kinds of soil are calculated, and the results are shown in Figs. 25–27.
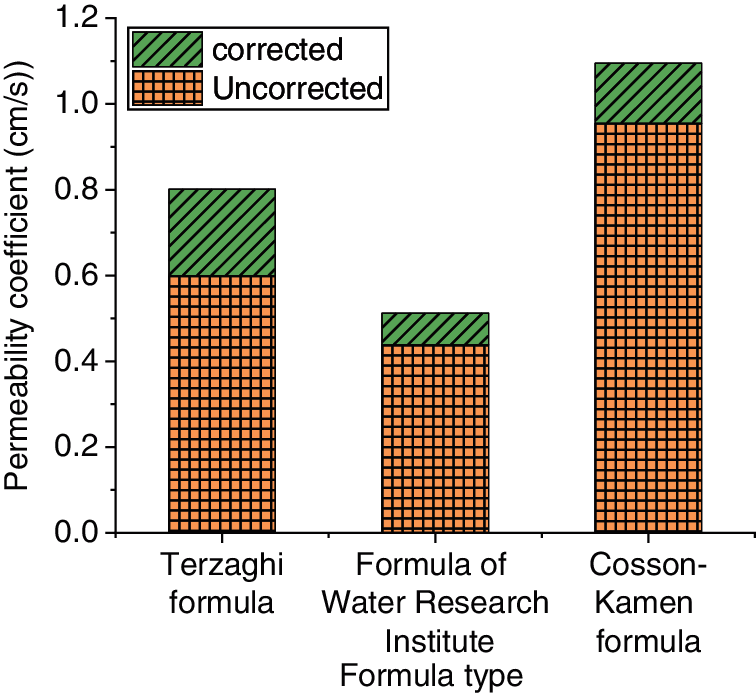
Figure 25: Results of the relationship between the equation and permeability coefficient in Region 1
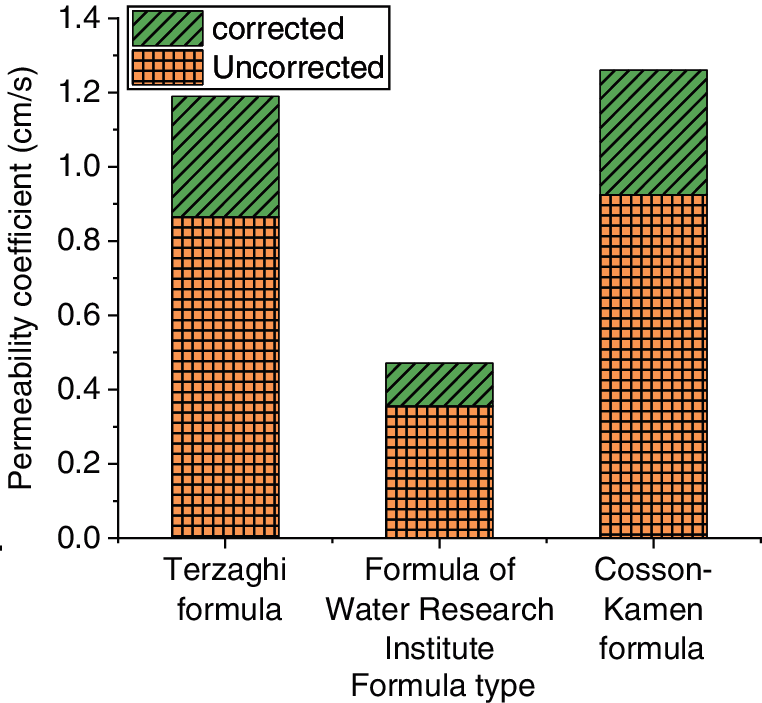
Figure 26: Results of the relationship between the equation and permeability coefficient in Region 2
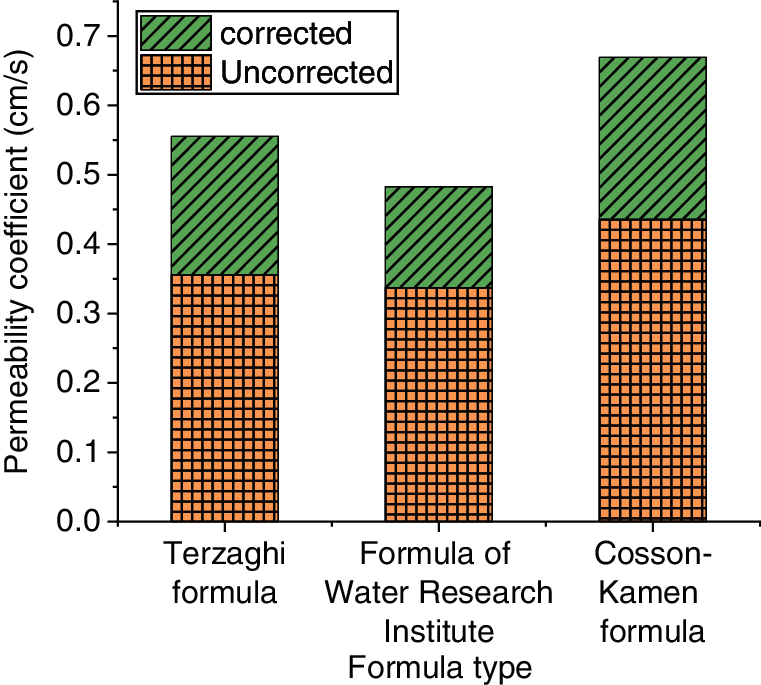
Figure 27: Results of the relationship between the equation and permeability coefficient in Region 3
According to the measured values and the calculated results, it is found that: 1. The natural void ratio is directly put into the three empirical equations without considering the influence of the microstructure of soil, and the calculated results of the permeability coefficient of soft soil in each region are 21.66, 16.51 and 31.23 times, 20.09, 8.79 and 21.12 times, and 13.21, 10.31 and 15.92 times of the experimental results. This proves that the empirical equation for calculating the permeability coefficient of coarse-grained soil without modification produces large errors. 2. After the empirical equation of the permeability coefficient of coarse-grained soil is modified into the empirical equation of the clay permeability coefficient by using the average contact area ratio theory, the calculated values of permeability coefficients of the three kinds of soil are not significantly different from the measured values in laboratory tests. This reduces the errors and the calculated results are closer to the measured values, and the applicability of the modified empirical equation to the permeability coefficient of clay soil is verified.
The microstructure of cohesive soil is analyzed by SEM. The results of microscopic research are used to analyze of the permeability of soil. Because of the influence of soil particle contact area on permeability, the permeability of cohesive soil is studied from the perspective of the microstructure of soft clay, and the permeability theory of cohesive soil with the contact area ratio is established. The empirical equation of the permeability coefficient of cohesive soil based on the particle contact area is given. Finally, the results of the unmodified, modified, and measured permeability coefficient are compared through calculation. The results show that the modified empirical equation of the permeability coefficient is also suitable for describing the seepage of cohesive soil.
The calculation method of the soil contact area ratio is obtained by comparing with that of macro-porosity. Through the analysis and calculation of specific data, the relationship between the soft soil contact area and porosity is further clarified, and the physical behavior characteristics of soil are explained from micro and macro perspectives. According to the particle shape of the clay image, the specific situation of porosity is quantitatively analyzed, and the calculation process of void in soft soil is described by using the binary gray method. This study provides an important reference for promoting the development of soil physics. Although the internal mechanism of soil is analyzed, there are still many shortcomings: (1) The scope of the samples is only in a single area, and the type of the soft soil in these areas is relatively single, so the research scope cannot be effectively extended. (2) In the analysis of the microstructure of soil, the relationship between the contact area and the macro-porosity is established, and the value is introduced. However, this mechanism does not only exist in soft soil, so it is necessary to expand the range of values. In the future, the calculation method should be constantly improved and the more critical internal mechanism should be analyzed.
Funding Statement: This work was supported by a key research projects of Henan higher schools (No. 21B560006).
Conflicts of Interest: The authors declare that they have no conflicts of interest to report regarding the present study.
1. Amuda, A. G., Hasan, A., Unoi, D. N. D., Linda, S. N. (2019). Strength and compressibility characteristics of amorphous tropical peat. Journal of GeoEngineering, 14(2), 85–96. DOI 10.6310/jog.201906_14(2). 4. [Google Scholar] [CrossRef]
2. Cuisinier, O., Sezer, A., Graziano, S. F., Russo, G. (2020). Mechanical properties and microstructure of soils treated with a vinyl-based copolymer. E3S Web of Conferences, 195(1), 6009. DOI 10.1051/e3sconf/202019506009. [Google Scholar] [CrossRef]
3. Pan, L., Xia, J. H., Han, H. X. (2020). Microscopic simulation of expansive soils and evolution laws. Fluid Dynamics & Materials Processing, 16(6), 1219–1228. DOI 10.32604/fdmp.2020.010545. [Google Scholar] [CrossRef]
4. Geiss, C. E., Towner, N. E. (2020). A history of fire at hitchcock nature center, western iowa, reconstructed through an analysis of macroscopic charcoal and soil-magnetic properties. The Journal of the Iowa Academy of Science, 127(1–4), 13–22. DOI 10.17833/0896-8381-127.1.13. [Google Scholar] [CrossRef]
5. Parvathy, C., Janis, K., Andreas, S., Thomas, W., Stefan, J. et al. (2019). Modeling the evolution of soil structural pore space in agricultural soils following tillage. Geoderma, 353, 401–414. DOI 10.1016/j.geoderma.2019.07.017. [Google Scholar] [CrossRef]
6. Chenari, R. J., Fatahi, B., Ghoreishi, M., Taleb, A. (2019). Physical and numerical modelling of the inherent variability of shear strength in soil mechanics. Geomechanics and Engineering, 17(1), 31–45. DOI 10.12989/gae.2019.17.1.031. [Google Scholar] [CrossRef]
7. Li, C., Tang, H. M., Wang, Y. K. (2020). Study on the deformation mechanism of reservoir landslides considering rheological properties of the slip zone soil: A case study in the three gorges reservoir region. Sustainability, 12(16), 1721. DOI 10.3390/su12166427. [Google Scholar] [CrossRef]
8. Gao, W. J., Yang, Y., Xi, L. Z. (2021). Research on numerical simulation of soft soil foundation reinforcement during the process of under-crossing subway shield tunnel. Journal of Physics: Conference Series, 2012(1), 29–32. DOI 10.1088/1742-6596/2012/1/012021. [Google Scholar] [CrossRef]
9. Zhai, Y., Wang, Y. Z., Dong, Y. H. (2017). Modified mesri creep modelling of soft clays in the coastal area of Tianjin (China). Technical Gazette, 24(4), 1113–1121. DOI 10.17559/TV-20160525123742. [Google Scholar] [CrossRef]
10. Zhang, Z. G., Huang, M. S., Pan, Y. T., Jiang, K. M., Li, Z. B. et al. (2021). Analytical prediction of time-dependent behavior for tunneling-induced ground movements and stresses subjected to surcharge loading based on rheological mechanics. Computers and Geotechnics, 129(2), 103858. DOI 10.1016/j.compgeo.2020.103858. [Google Scholar] [CrossRef]
11. Cała, M., Jakóbczyk, J., Cyran, K. (2017). Application of geotechnical monitoring tools for deformation analysis in the vicinity of the Dębina salt dome (Bełchatów mine, Poland). Engineering Geology, 230(4), 130–141. DOI 10.1016/j.enggeo.2017.09.027. [Google Scholar] [CrossRef]
12. Hu, W., Rostami, J. (2020). A new method to quantify rheology of conditioned soil for application in EPB TBM tunneling. Tunnelling and Underground Space Technology, 96(C), 103192. DOI 10.1016/j.tust.2019.103192. [Google Scholar] [CrossRef]
13. Zhang, Z. L., Zhen, D. C. (2017). Analysis of microscopic pore structures of the silty clay before and after freezing-thawing under the subway vibration loading. Environmental Earth Sciences, 76(15), 1–17. DOI 10.1007/s12665-017-6879-z. [Google Scholar] [CrossRef]
14. Cai, J. C., Jin, T. X., Kou, J. S., Zou, S. M., Xiao, J. F. et al. (2021). Lucas-washburn equation-based modeling of capillary-driven flow in porous systems. Langmuir, 37(5), 1623–1636. DOI 10.1021/acs.langmuir.0c03134. [Google Scholar] [CrossRef]
15. Zhao, C. H., Zhao, D. J. (2021). Application of construction waste in the reinforcement of soft soil foundation in coastal cities. Environmental Technology & Innovation, 21(21), 101195–101206. DOI 10.1016/j.eti.2020.101195. [Google Scholar] [CrossRef]
16. Brendan O’Kelly, C. (2020). Determination of soil permeability coefficient following an updated grading entropy approach. Geotechnical Research, 7(1), 1–10. DOI 10.1680/jgere.19.00036. [Google Scholar] [CrossRef]
17. Lyu, X. Z., Zhao, Z. H., Wang, X. J., Wang, W. M., Sarmadivaleh, M. (2019). Study on the permeability of weakly cemented sandstones. Geofluids, 2019(4), 1–14. DOI 10.1155/2019/8310128. [Google Scholar] [CrossRef]
18. Zhou, H. M., Gao, H. Z., Fang, Z., Yang, J. X., Wu, M. G. (2020). Analysis of gas-solid flow characteristics in a spouted fluidized bed dryer by means of computational particle fluid dynamics. Fluid Dynamics & Materials Processing, 16(4), 813–826. DOI 10.32604/fdmp.2020.010150. [Google Scholar] [CrossRef]
19. Nguyen, T. N., Nguyen, T. D., Bui, T. S., Phi, H. T. (2020). Investigation of salt, alum content in soft soils and their effects on soil properties: Case study in coastal areas of Vietnam. The Iraqi Geological Journal, 53(2A), 19–34. DOI 10.46717/igj.53.2A.2Rw-2020-08-02. [Google Scholar] [CrossRef]
20. Zhou, D., Tan, Z. Y. (2020). On the application of the lattice Boltzmann method to predict soil meso seepage characteristics. Fluid Dynamics & Materials Processing, 16(5), 903–917. DOI 10.32604/fdmp.2020.010363. [Google Scholar] [CrossRef]
 | This work is licensed under a Creative Commons Attribution 4.0 International License, which permits unrestricted use, distribution, and reproduction in any medium, provided the original work is properly cited. |