| Fluid Dynamics & Materials Processing |
DOI: 10.32604/fdmp.2022.017861
ARTICLE
Numerical Simulation of Proppant Dynamics in a Rough Inclined Fracture
1College of Petroleum Engineering, China University of Petroleum (East China), Qingdao, 266580, China
2Xinjiang Zhengtong Petroleum and Natural Gas Co., Ltd., Karamay, 834000, China
3Dongxin Oil Production Plant, Shengli Oil Field Branch, SINOPEC, Dongying, 257100, China
4Research Institute of Exploration and Development, Xinjiang Oilfield Company, Karamay, 457001, China
*Corresponding Author: Tiankui Guo. Email: guotiankui@126.com
Received: 11 June 2021; Accepted: 12 August 2021
Abstract: Although the dynamics of proppant (small ceramic balls used to prevent opened fractures from closing on the release of pressure) have been the subject of several numerical studies over recent years, large-scale inclined fractures exist in unconventional reservoirs for which relevant information is still missing. In the present study, this problem is investigated numerically considering the influence of several relevant factors such as the fracture roughness, inclination, the proppant particle size, the injection rate and the fluid viscosity. The results show that a rough wall enables the proppant to travel farther and cover larger areas. The inclination angle has little effect on the dune but a significant influence on the suspension zone. The area of this zone increases with a decrease in the inclination angle, and its value for an inclination of 15° is 20 times that at 90°. Small particle size, high injection rate, and high fracturing fluid viscosity have a beneficial influence on proppant transport; vice versa they hinder settling phenomena.
Keywords: Rough wall surface; inclined fracture; proppant transport and placement; solid-liquid two-phase flow; computational fluid dynamics
Hydraulic fracturing is an important technology of the development of unconventional reservoirs reservoir, after the construction, in-situ stress can lead to fractures gradually closed, early with the fracturing fluid pumping proppant is in order to prevent fracture closure, keep fractures higher diverting capacity, to provide high-speed channel for oil and gas flow to the wellbore, proppant migration pave setting behavior directly decides the fill fracture diverting capacity [1–4]. Therefore, it is necessary to explore the transportation and placement of proppant in the fracture to guide the field fracturing operation.
Dayan et al. [5] conducted experiments on a small one-dimensional fracture model with branching fractures to study the proppant transport and placement in the model. Sahai [6] developed a complex fracture model using a plexiglass panel, the effects of multiple engineering parameters on proppant transport and settlement in complex fractures were simulated. Wen et al. [7] studied the settlement and transport rules of proppant in six complex fracture networks of “one” type, “T” type, “H” type, “TF” type, “double T” type, and “ten” type in the volume fracturing process. Li et al. [8] studied the rules of proppant transport and placement in complex fractures by using physical experiments as the main method and numerical simulation as the auxiliary method, and proposed two characterization parameters, “the distance between the dune front and the fracture entrance” and “the slope of the dune front”. Msalli et al. [9] conducted relevant experiments in rough wall flume using slippery water as fracturing fluid and explored the situation of proppant entering secondary and tertiary fractures and its transport mechanism. Chun et al. [10] conducted a series of indoor proppant migration simulations with a home-made fracture device with adjustable tilt angles. The results showed that the effect of wall friction resulted in more proppant placement and fewer sand dike in an inclined fracture. Wang et al. [11] used the coupling method of EDEM and Fluent software to study the transport and distribution characteristics of proppant in fractures and fracture networks. Gong et al. [12] used CFD to study proppant transport in natural fractures and secondary fractures. The results show that the direction of the secondary fracture controls the proppant transportation efficiency and movement mode, which directly determines the proppant placement in the secondary fracture. Lu et al. [13] studied the effects of variable fracturing fluid viscosity and proppant density on uneven proppant placement in fractures and low proppant efficiency based on the coupled method of CFD-DEM, and clarified the related influencing mechanism. Studies have shown that an increase in fracturing fluid viscosity can significantly increase proppant transport distances, resulting in an increase in the length of the sand-free zone near the wellbore. Kou et al. [14] simulated and studied the migration and settlement of proppant in fractures by means of CFD-DEM. The results show that the interaction between proppant particles and fracture sidewalls is the dominant role in proppant migration and placement.
Most previous studies have focused on proppant transport and settlement in vertical branch fractures. However, large-scale inclined fractures exist after volume fracturing in unconventional reservoirs with natural fractures such as shale, and there are few reports on proppant transport and settlement in this type of fracture. Based on computational fluid dynamics method, considering the influence of the fracture roughness, conducted a tilt proppant transport of rough fracture numerical simulation research on pave setting, has been clear about the roughness, inclined angle, proppant size, injection rate, the fracturing fluid viscosity influence on proppant transport pave setting mechanism, can provide certain theoretical support for the follow-up research and fracturing operation.
2 Simulation Methods and Establishment of Rough Fracture Model
The Euler-Euler method carried out the numerical simulation of proppant migration and placement in inclined rough fractures using Fluent software. In this method, both solid proppant and liquid fracturing fluid are treated as a continuum, the movement of fluid particles and flow field as well as the movement of solid particles are described and solved by the Euler method. Only the respective volume fractions of different phase media are calculated [15]. On this basis, the RNG k-ε model is introduced to calculate the flow turbulence caused by the rough wall. RNG k-ε model is similar to the standard k-ε model in form, but it adds a term to the ε equation and takes into account the swirl effect, which makes it’s calculation function stronger than the latter.
(1) Volume fraction
To define multiphase flow as a continuous phase permeating each other, the concept of phase volume fraction needs to be introduced, the volume fraction is expressed as α. The volume fraction represents the volume of space occupied by each phase, each phase must satisfy the law of conservation of momentum and mass.
where, V is the volume of phase q; α is the volume fraction of phase q.
(2) Mass conservation equation
where, ρ is the density of q phase; u is the velocity of phase q.
(3) Momentum conservation equation
where, p is pressure of all the phases; μ is viscosity of q phase; τij is Reynolds stress; Si is source item.
where, μt is turbulent viscosity; k is turbulent kinetic energy; δij is “Kronecker delta” symbol.
where,
(4) RNG k-ε turbulence model
where, K is turbulent kinetic energy; ε is the dissipation rate of turbulent entrapment, αk and αε the derivatives of the effective turbulent Prandtl number of turbulent kinetic energy and turbulent dissipation rate respectively; Gk is the turbulent kinetic energy caused by the average velocity gradient; μeff is the viscosity of fluidization,
A pressure-based solver was selected and gravity acceleration was set at 9.8 m/s2 in the direction of fracture height. The Eulerian model in multiphase flow is selected with a phase number of 2. k-ε was selected as the turbulence model, the near-wall function as the standard wall function, and the default model constants were selected. Both the fracturing fluid and proppant are set as fluid phases. The inlet is the velocity inlet and the outlet is the pressure outlet. The turbulent kinetic energy intensity of the backflow at the inlet and outlet can be calculated according to the empirical formula. The wall surface is the static wall surface. A simple algorithm with good stability was selected as the solution method, and the first-order upwind format was adopted. The slack factor is left as default and is adjusted by the software itself. The time step was 0.001 s.
2.2 Creation of Rough Wall Inclined Fracture Model
Ogilvie proposed a method for synthesizing numerically rough rock fracture walls [16]. In this method, a series of parameters related to rock characteristics are input to control the matching between the final numerical model and the real rock wall. The Fractal Dimension (FD) is used to represent the roughness of the fracture wall. At the same time, Paul Glover created a software package “SYNFRAC” based on this theory, making this method more acceptable and easier to use. This method has been widely used. Briggs et al. [17] used this method to synthesize a series of numerical rough fracture models to study the flow patterns of fluids in them. Using this method, Suri et al. [18] explored the influence of fracture roughness on the hydrodynamics of proppant transport in hydraulic fractures. This method is accurate and reliable through the demonstration of predecessors. In this method, the characterization of rock roughness depends largely on the fractal dimension. To make the synthesized numerical fracture model more close to the real rock fracture, we have calculated the fractal dimension of the real rock rough surface. Four unconventional rock samples were scanned using a laser profilometer (jointly developed with Tianjin University, with an accuracy of 0.1 mm and a range of 300 mm), the results are shown in Fig. 1.
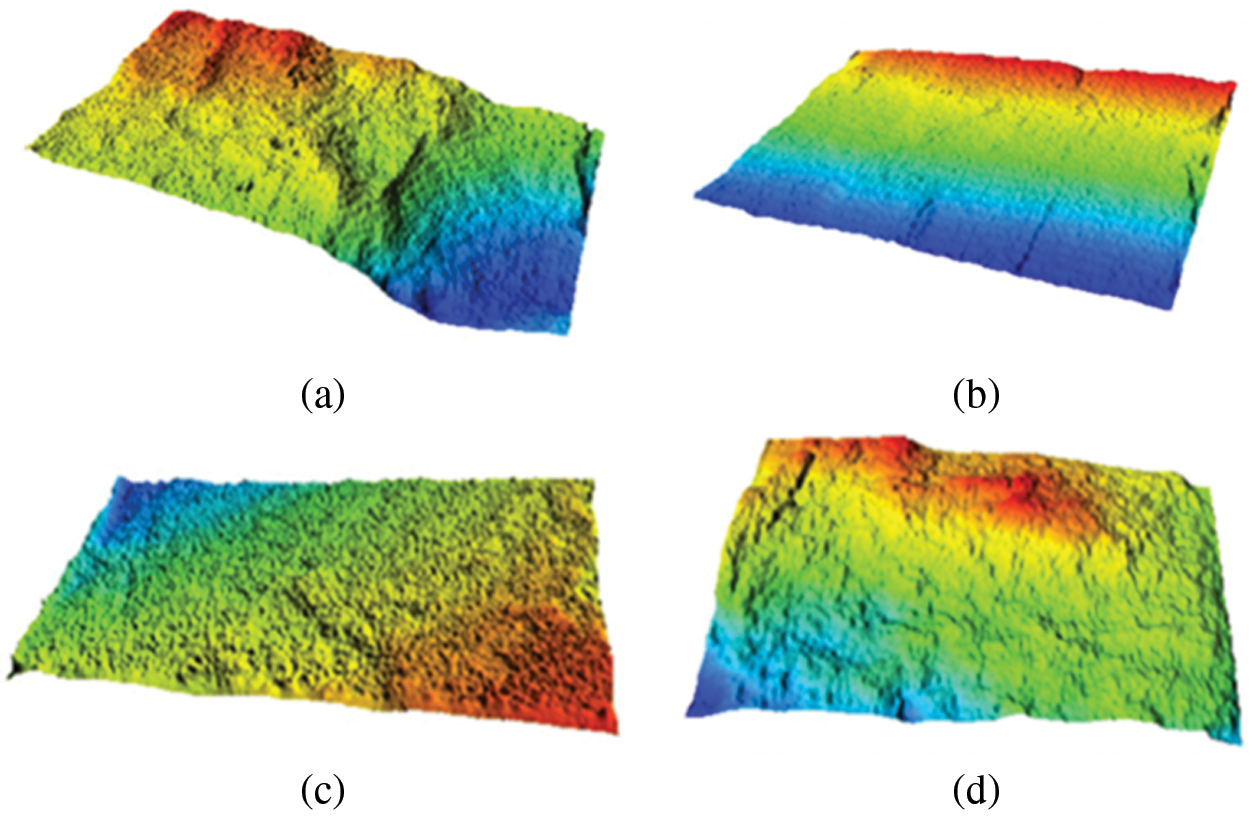
Figure 1: Surface morphology of rock sample
The cube projection covering method can be used to calculate the fractal dimension close to the real one. The operation process is as follows:
There is a square grid on plane XOY, and the size of each grid in the grid is δ, 4 corners of the square correspond to 4 heights respectively h(i, j) h(i, j + 1) h(i + 1, j) h(i + 1, j + 1). The rough surface is covered with cubes of side length is δ, and the number of cubes in the covered area is δ × δ calculated, that is, in the (i, j) grid, the number of cubes covering the rough surface is Ni,j [19].
Then the total number of cubes needed to cover the entire rough surface is N(δ):
Change the observation scale to cover again, and then calculate the total number of cubes required to cover the whole rough surface. Suppose the rough surface has a fractal property, according to the fractal theory. In that case, there should be the following relationship between the total number of cubes N(δ) and the scale δ:
where FD is the fractal dimension of self-similarity of the rough surface.
The fractal dimension values of rock samples were obtained after calculating the scanning data with the cube covering method (Table 1).
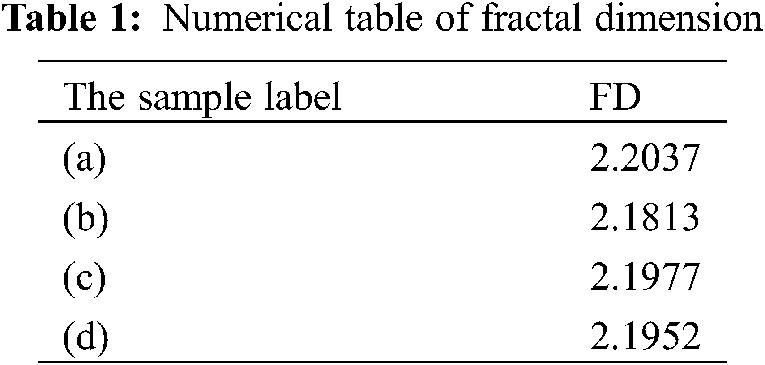
Referring to the fractal dimension range of natural fractures and considering the convenience of subsequent studies, the fractal dimension is set as 2.2 in this study. Synfrac obtained the initial data of the rough fracture wall, and a rough wall fracture model with a fractal dimension of 2.2 was obtained by Solid Works (Fig. 2a), whose dimension length × height × width is 2 m × 0.4 m × 0.005 m (where the fracture width is the average of the entire fracture width). Then a series of rough fracture models with different inclined angles were obtained through Angle adjustment (Fig. 2b).
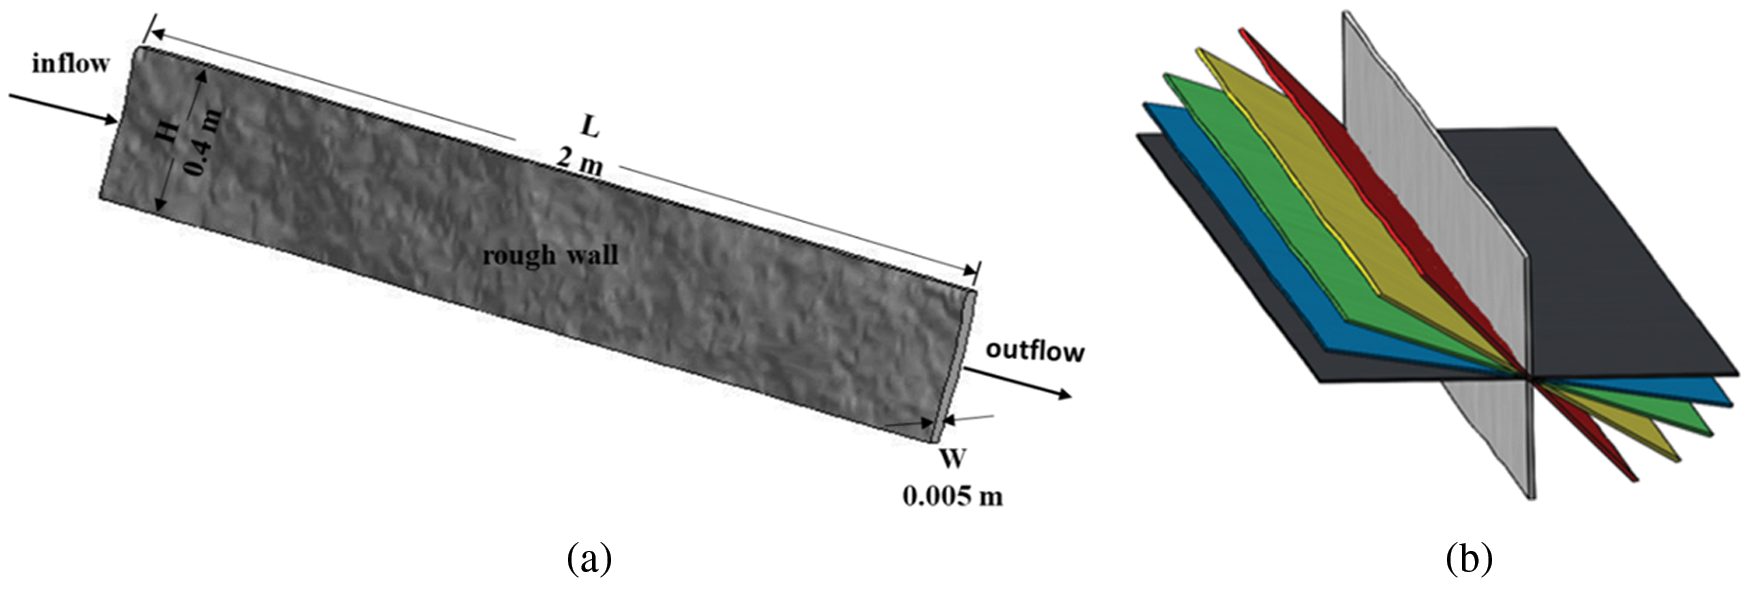
Figure 2: Rough fracture model (90° (vertical) (white);60° (red);45° (yellow);30° (green);15° (blue);0° (horizontal) (black)
The division of model mesh directly affects the speed and precision of calculation. We want to obtain the optimal number of grids, the proppant transport and placement in 45° fractures with different grids were simulated under the same parameter condition (Table 2). Finally, the optimal number of grids was obtained by comparing the dune and suspension zone distribution patterns in fractures. The simulation results are shown in Fig. 3.
Figure 3: Proppant distribution in 45° rough fracture with different mesh numbers
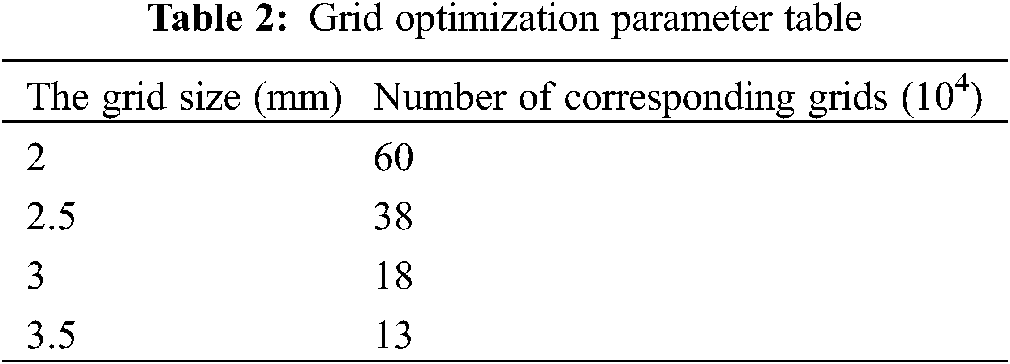
As can be seen from Fig. 3, the distribution patterns of dunes in fractures with the number of grids of 600,000, 380,000, and 180,000 are the same as those of suspended zones. However, the distribution patterns of dunes in fractures with the number of grids of 130,000 are significantly different from those of suspended zones, which does not satisfy the stability of the calculation. On the other hand, considering the calculation time cost and calculation workload, the mesh number of the optimized fracture model is 180,000.
2.4 Numerical Simulation Scheme
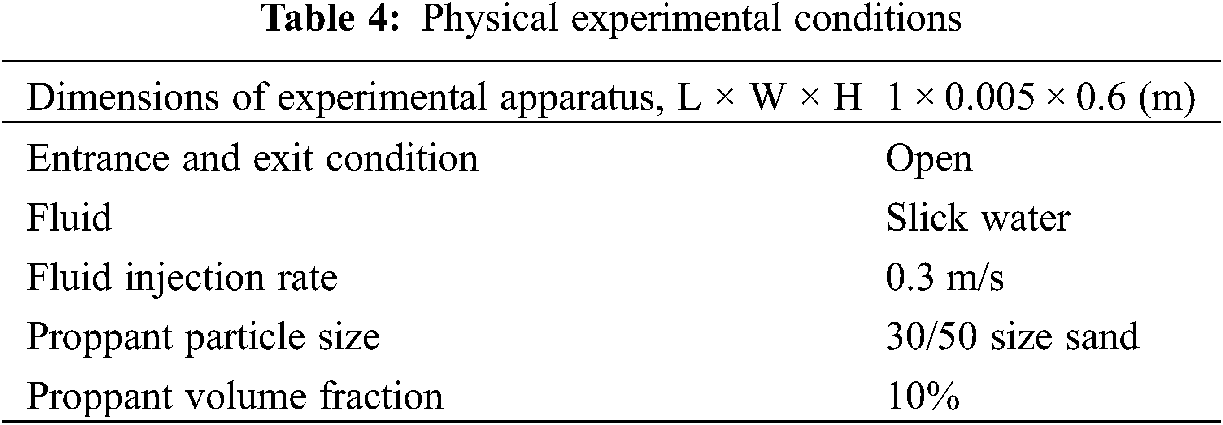
The size of the fracture model used in Section 3.1 is adjusted accordingly according to the specific characteristics of the experimental equipment. In addition, the fracture model as shown in Fig. 2 is used. To investigate the effect of roughness on proppant placement, another smooth fracture of the same size was created for comparison. The proppant density used in the experiment is 2500 kg/m3, the sand ratio is 10%, the hydraulic diameter is calculated as 0.01 m, and the turbulence intensity is calculated as 8.5% according to the empirical formula (Eq. (13)).
where I is turbulence intensity;
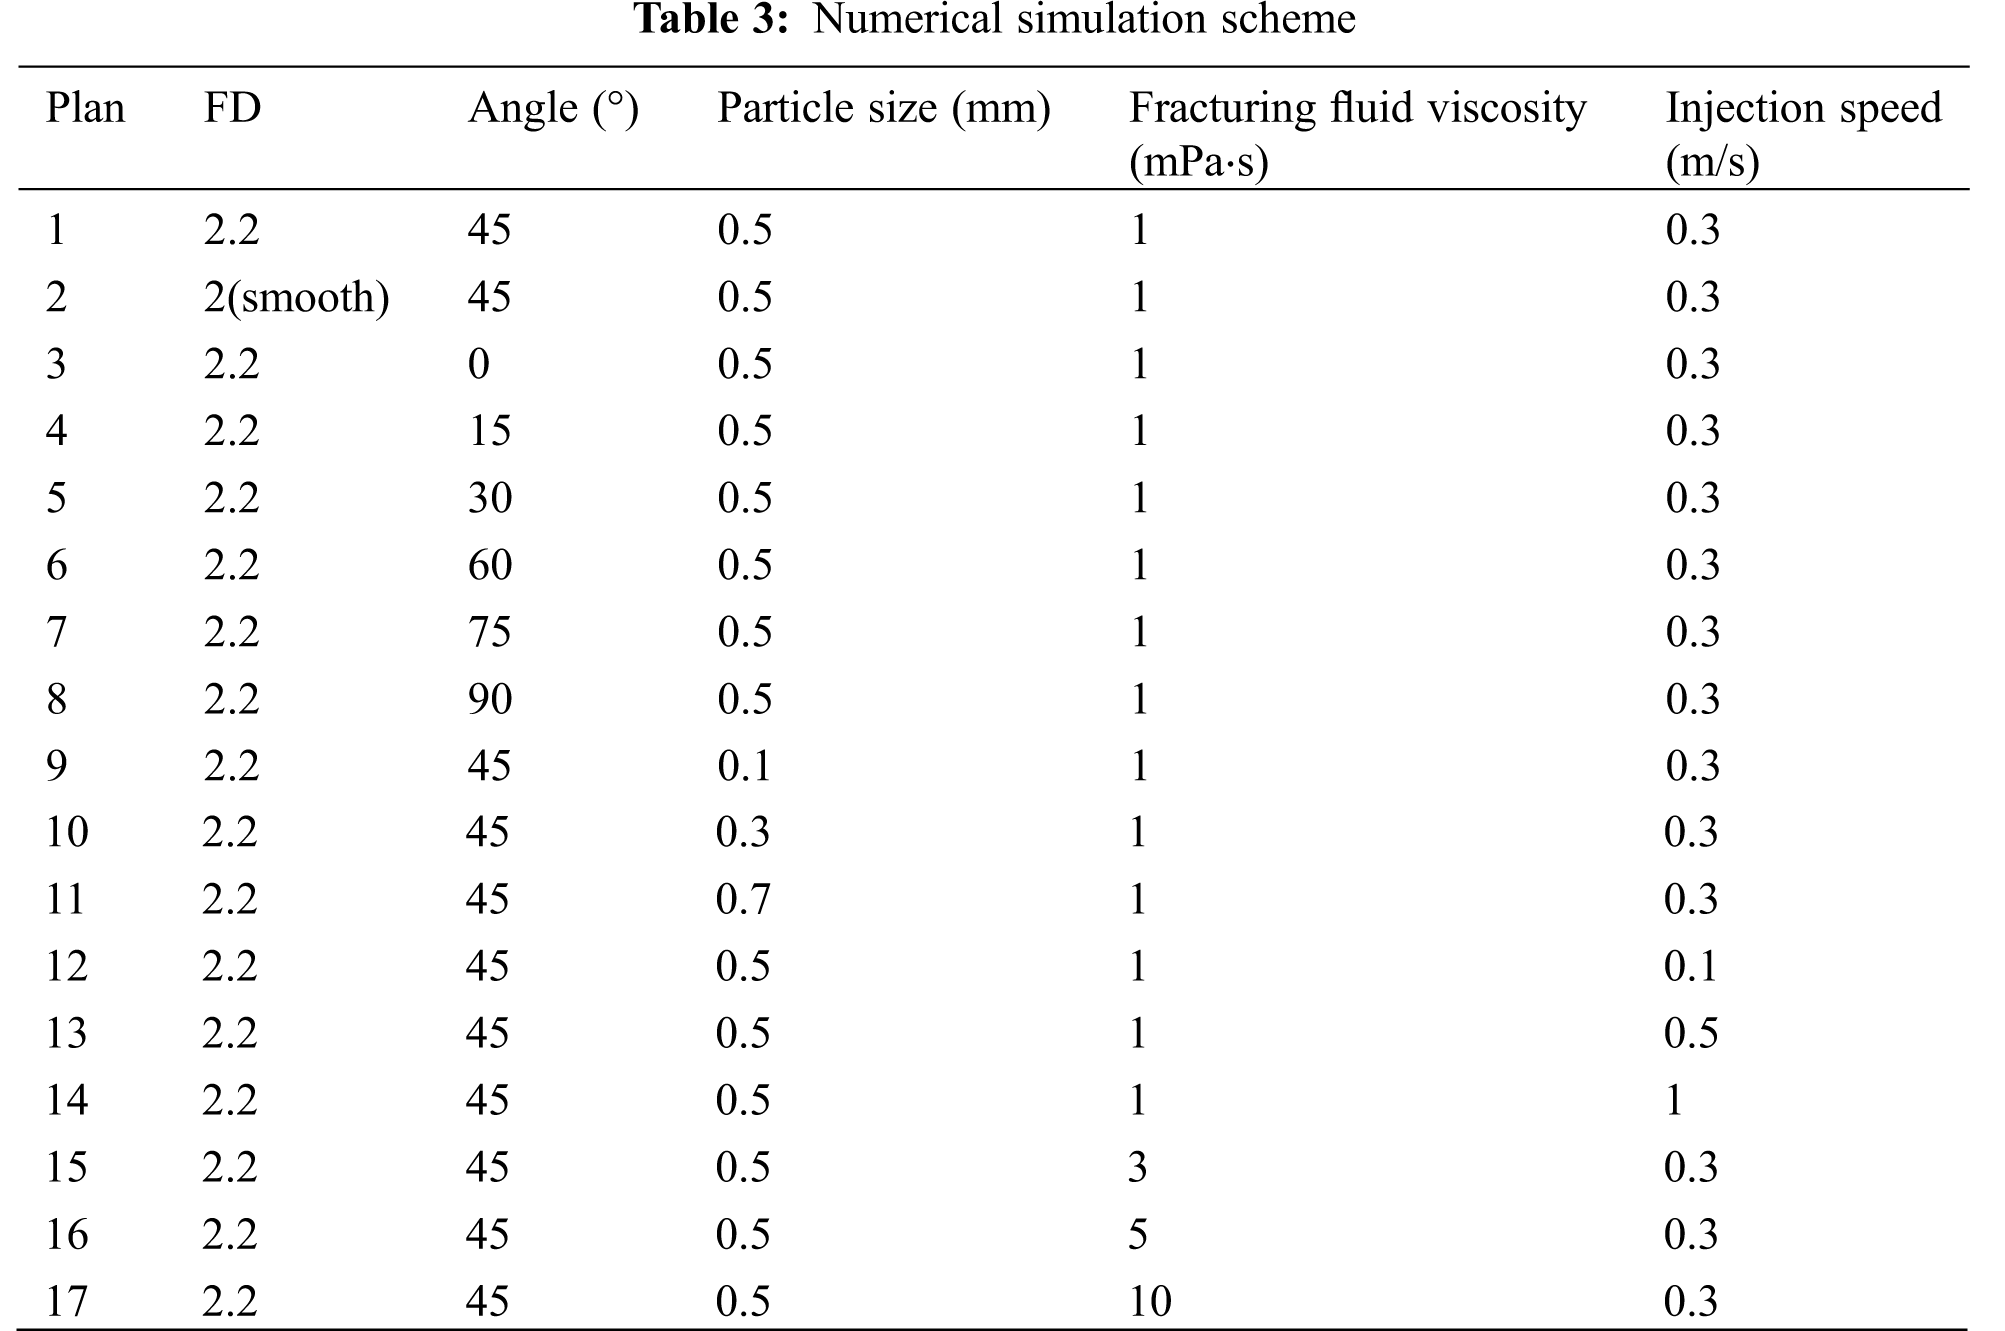
Other relevant parameter Settings are given in Section 2.1. In the experiment, the control variable method was used to study the transport and placement of proppant in the rough inclined fracture with the change of a single factor. Finally, the proppant distribution cloud map was cut off from the Angle perpendicular to the inclined plane to provide evidence. The proppant distribution cloud map qualitatively analyzed the proppant transport distance, dune area, and suspended zone area. Then, GetData and GraphPad software were used to calculate the dune area and suspended zone area in the fracture, and the curve of the percentage of the two in the fracture area changing with each research factor was obtained. Further quantitative analysis was made on proppant transport and placement rules according to the curves. According to the research content, a numerical simulation scheme is made (Table 3).
3.1 Verification of Accuracy of Numerical Simulation Method
Guo et al. [20] developed a virtual simulation device for proppant transport and placement in large and complex fractures, which can simulate different fracture wall roughness, different inclined angles, and different filtration loss. To verify the accuracy of the numerical method, a plexiglass plate flume with a roughness similar to that of the fracture model was selected, and the experiment was carried out on this equipment according to the experimental conditions in Table 4. Finally, the size of the rough fracture model was changed following the experimental equipment for numerical simulation. Fig. 4 shows the comparison between the experimental results and the simulation results. It can be seen from the figure that the experimental results are consistent with the simulation results in the distribution shape of a dune, which can be judged that the numerical simulation method is accurate and reliable.
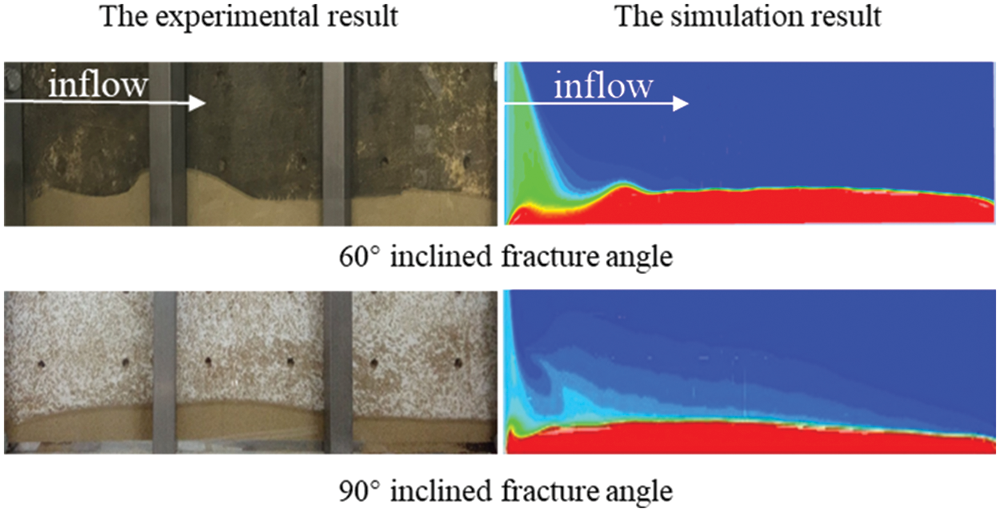
Figure 4: Comparison of experimental and simulated proppant distribution
The real rock fracture wall surface is rough and uneven. Many studies have been conducted on the effect of vertical fracture roughness on proppant transport and placement, and it has been found that fracture roughness has a significant effect on the flow dynamics of the fluid in the fracture. However, the effect of roughness in inclined fractures on proppant transport and placement has rarely been reported. To investigate this effect, two fracture models with a fractal dimension of 2.2, rough and smooth, were created with a fixed fracture inclination of 45°. The simulation of Scheme 1 and Scheme 2 is carried out. Finally, two kinds of proppant distribution and turbulence distribution in fractures are obtained (Fig. 5).
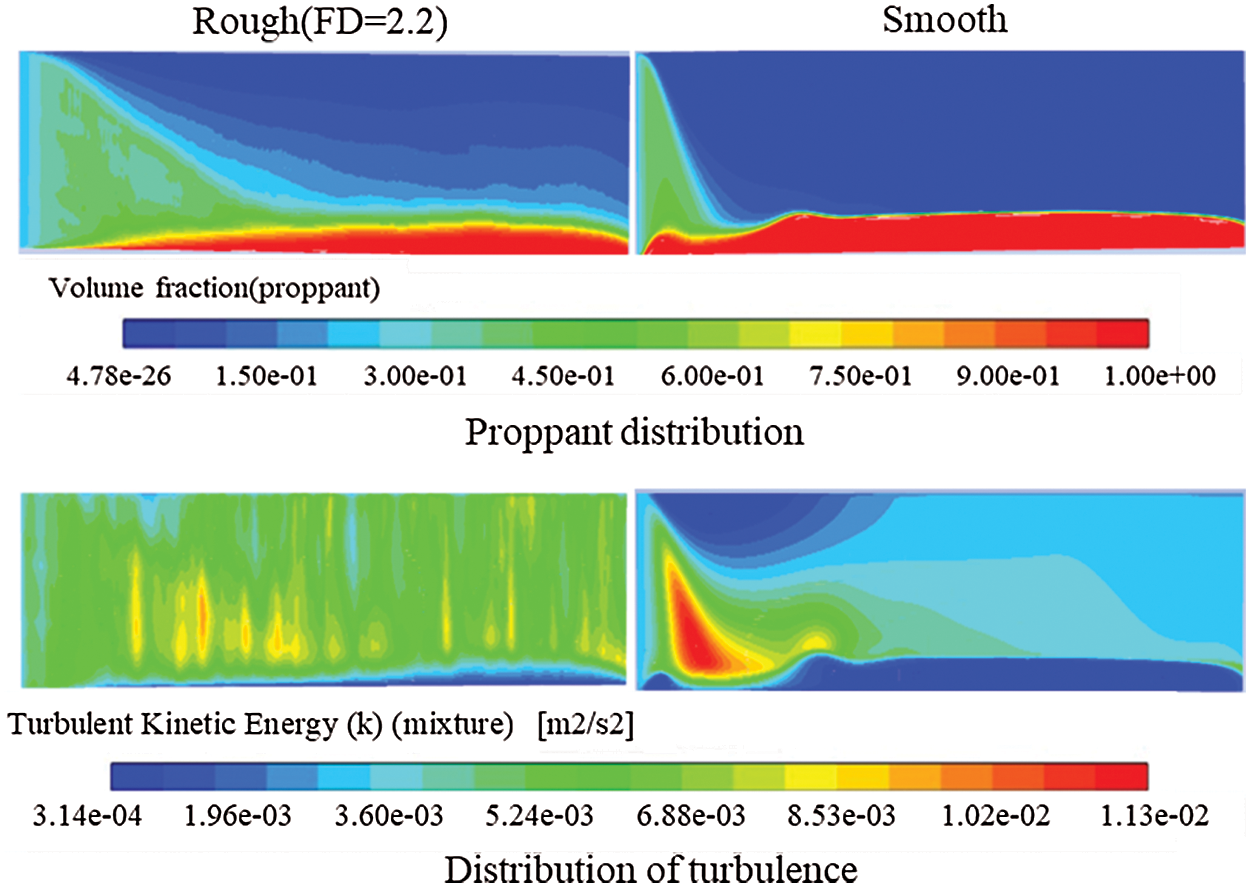
Figure 5: Proppant and turbulence distribution in 45° rough and smooth fractures
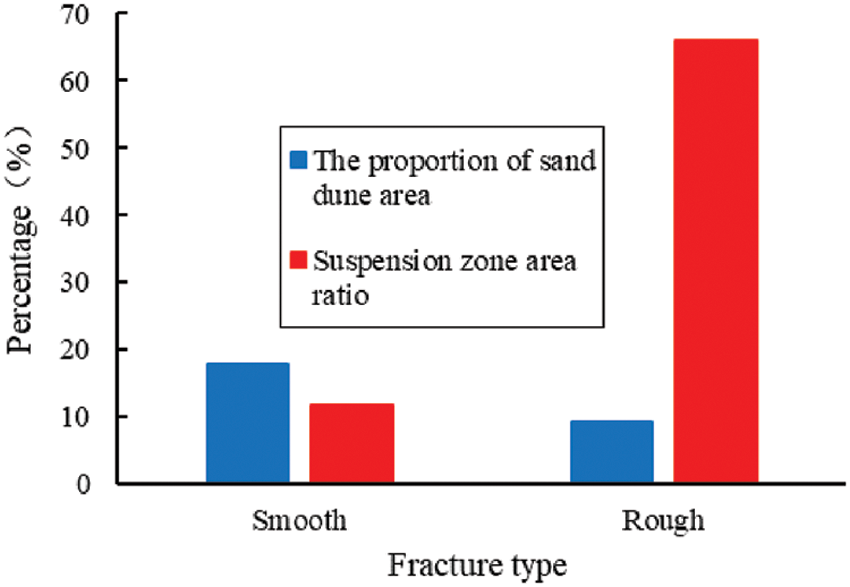
Figure 6: Ratio of dune and suspension zone in different types of fractures
According to the proppant distribution map, the rough fracture has a wider distribution of the suspension zone, which is calculated to be about six times larger than the smooth fracture, the transport distance of the suspension zone is longer. The proppant will begin to settle further away from the injection port. The height of the dune is lower than the smooth fracture, and its area is only half that of the smooth fracture (from Fig. 6). The reason for this phenomenon is that the friction of the proppant on the inclined plane in the rough inclined fracture weakens the component of gravity along the inclined plane, slowing down the settlement and moving to the further settlement. On the other hand, frequent collisions between the fluid, proppant, and the rough wall create a lot of turbulence, which pushes the proppant to travel farther and cover a larger area. Phenomenon is because the proppant in the smooth fracture is only affected by the component force of gravity and will settle rapidly at the injection port. As the fracturing fluid continues to be injected, this area becomes a high-speed scour zone, resulting in local high turbulence, which develops backward. However, on the whole, the turbulence intensity in the smooth fracture is much lower than that in rough fracture.
There are a lot of natural fractures and horizontal bedding in unconventional reservoir rocks, and the main fractures after hydraulic fracturing often communicate with them at a non-vertical Angle. To explore the effect of inclined angle on proppant transport and placement plans 1, 3, 4, 5, 6, 7, and 8 were simulated to obtain the proppant distribution in fractures with different inclined angles (Fig. 7).
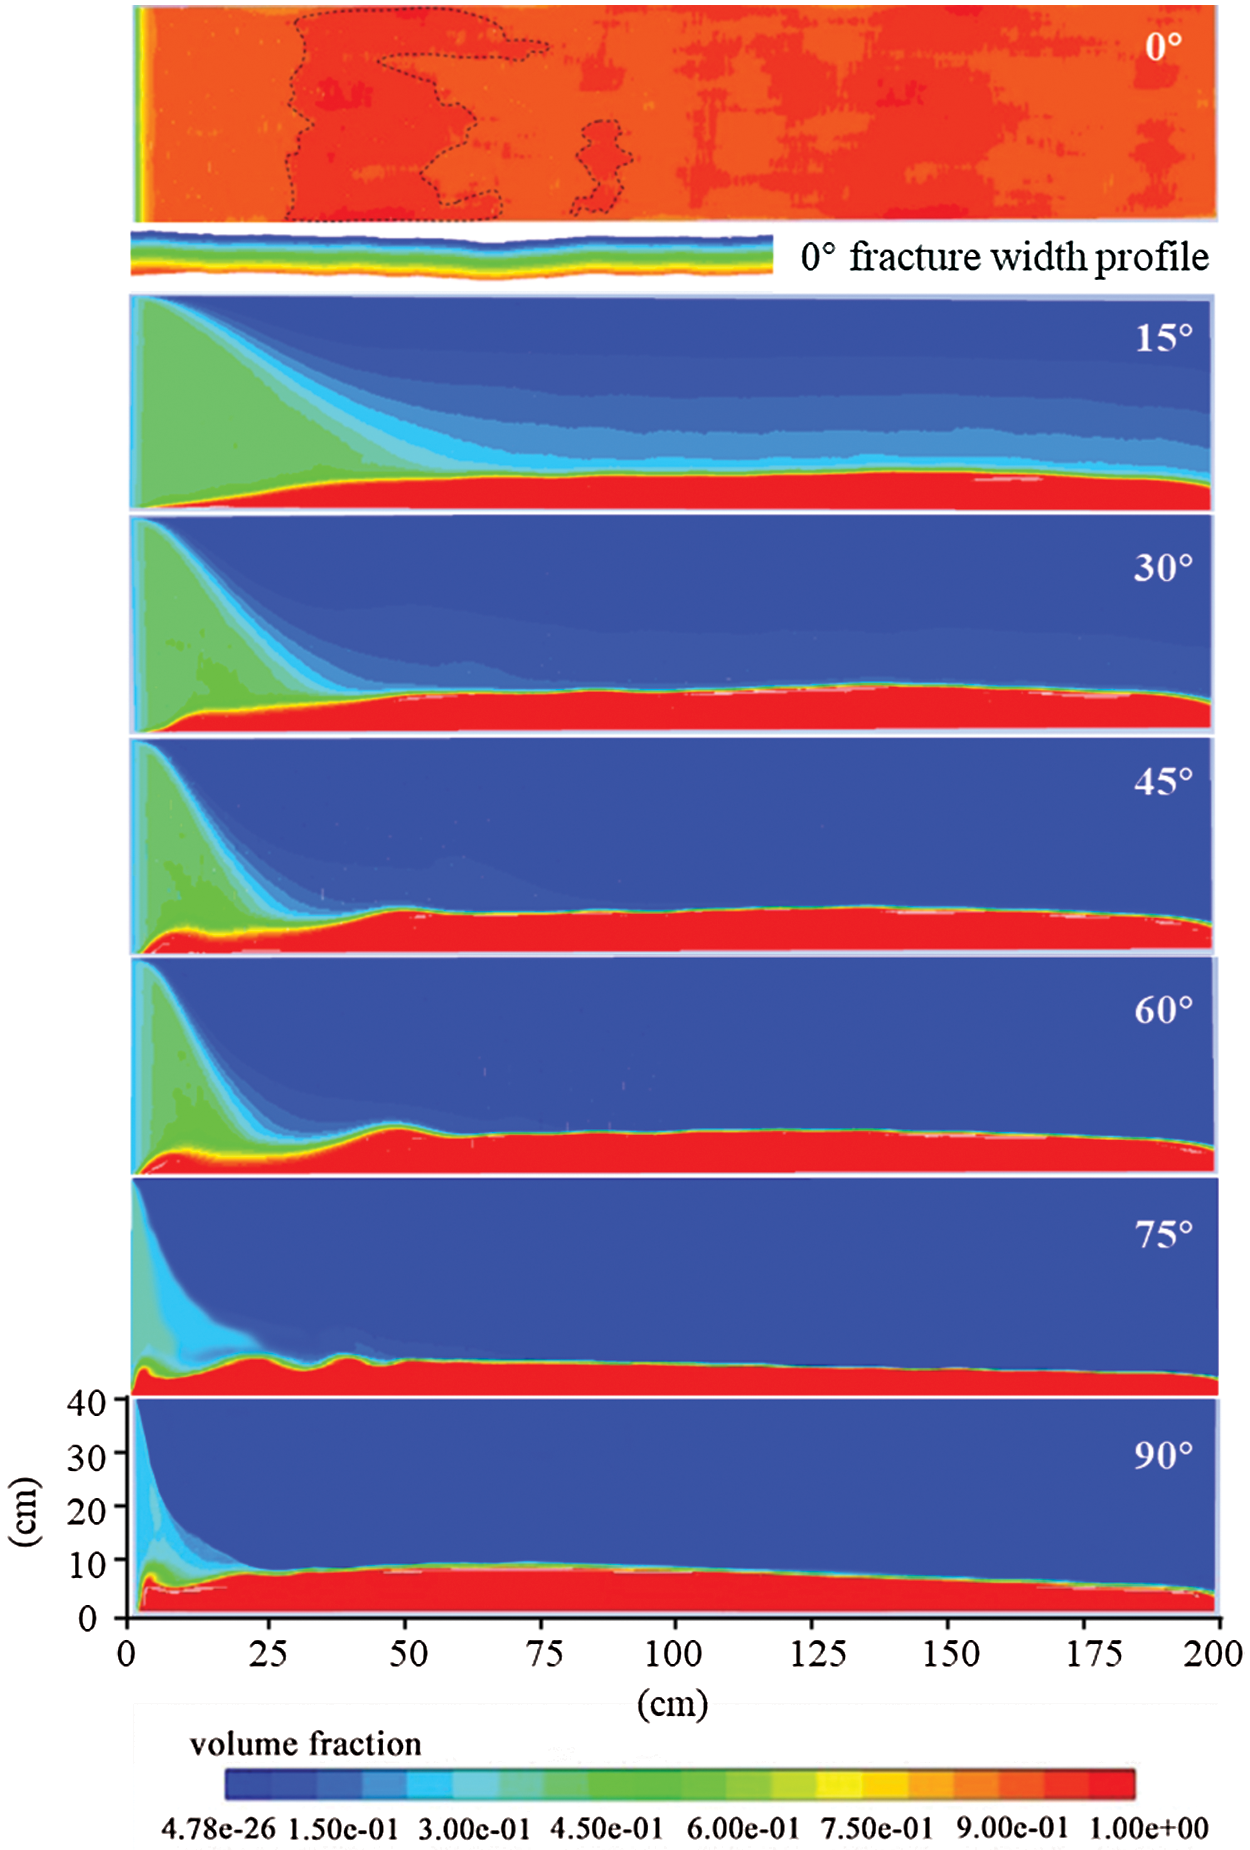
Figure 7: Proppant distribution in rough fractures with different inclined angles
For analyzing the proppant distribution in the inclined fracture, the stress of the proppant on the rough wall was first analyzed. As shown in Fig. 8, the proppant is subjected to gravity, and the component of gravity downward and friction upward along the slope.
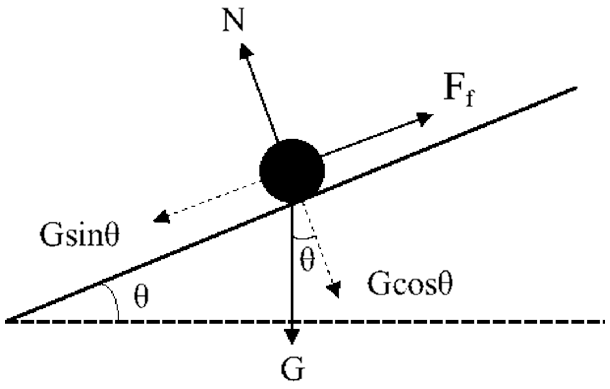
Figure 8: Schematic diagram of proppant stress on a rough inclined surface
The friction force Ff is expressed as
where Ff is the friction force received by the proppant; μ is the friction coefficient; N is the normal force; G is gravity.
It can be seen from Eq. (14) that both fracture roughness and inclined angle play a decisive role in proppant stress. This will affect the proppant transport and placement in the fracture. When the fracture inclination is 0° (horizontal), the proppant will experience maximum friction and gravity along the width of the fracture. When the fracture inclination is 90° (vertical), the proppant is not affected by friction but only by downward gravity.
Because 0° (horizontal) fractures are special, they are analyzed individually and then compared with the remaining fractures with other dips. From the 0° (horizontal) proppant profile, it is difficult to push the proppant evenly because of the maximum friction and gravity in the width direction. The uneven roughness of the fracture surface results in a “patchy” distribution of the dune (as shown in the dotted area in the 0° figure). Different from other Angle fractures, the horizontal fractures do not appear in the direction of fracture height, but the direction of fracture width. It can be seen from the local profile of horizontal fracture width that the fluid and solid are divided into three layers, the upper layer is a pure liquid layer, the middle zone is the suspension zone, and the lower layer is the dune layer.
Besides 0°, the distribution patterns of dune and suspension zone in the remaining 5 kinds of dip fractures are compared and analyzed. It can be qualitatively seen from Fig. 9 that the inclination Angle has little influence on the height and area of the dune; The distance from the front of the embankment to the injector increases with the decrease of the inclination Angle. The distribution area and transport distance of the suspension zone increase with the decrease of the inclined angle.
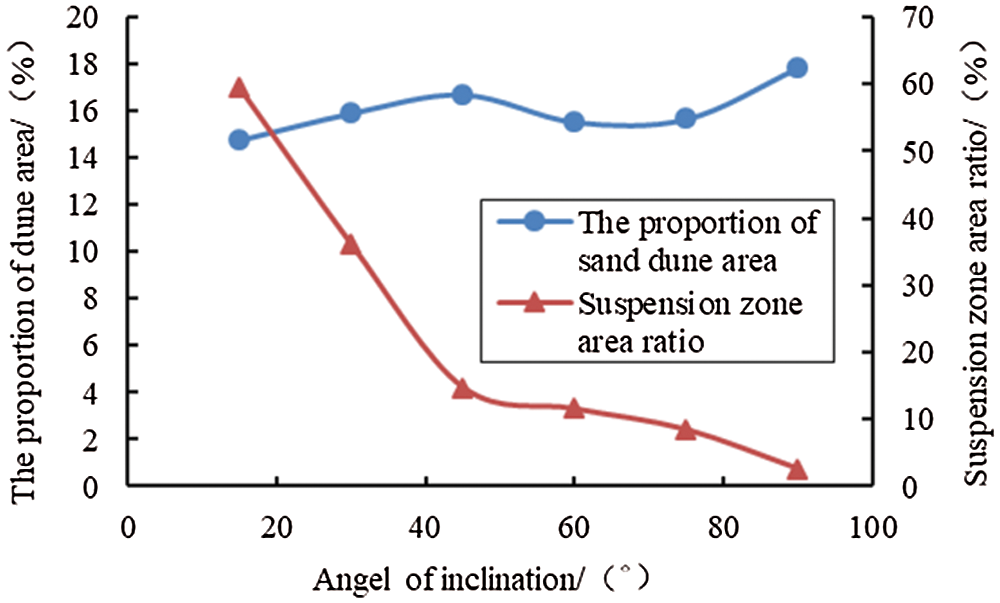
Figure 9: Curve of area proportion of dune and suspension zone changing with inclined angle
It can be seen from the figure that the inclined angle has little influence on the area proportion of the dune, and the range is only about 3%. On the contrary, the inclined angle has a great effect on the proportion of the suspended zone. At 15°, the proportion reaches the maximum, up to 60%, and decreases sharply with the increase of inclination Angle, and slows down when it reaches 45°, and reaches the minimum, up to 90°, of 3%. The maximum ratio is 20 times the minimum ratio.
In fracturing, different particle sizes of proppant are selected for different conditions. We would like to study the influence of particle size on proppant transport and placement in the rough inclined fracture, simulation calculations were performed on Plans 1, 9, 10, and 11 to obtain the proppant distribution in the 45° rough fracture with different particle sizes. According to the information in Fig. 10, the variation curve of the percentage of the area of dune and suspension zone to the fracture area with different particle sizes as a function of the proppant particle size was made (Fig. 11).
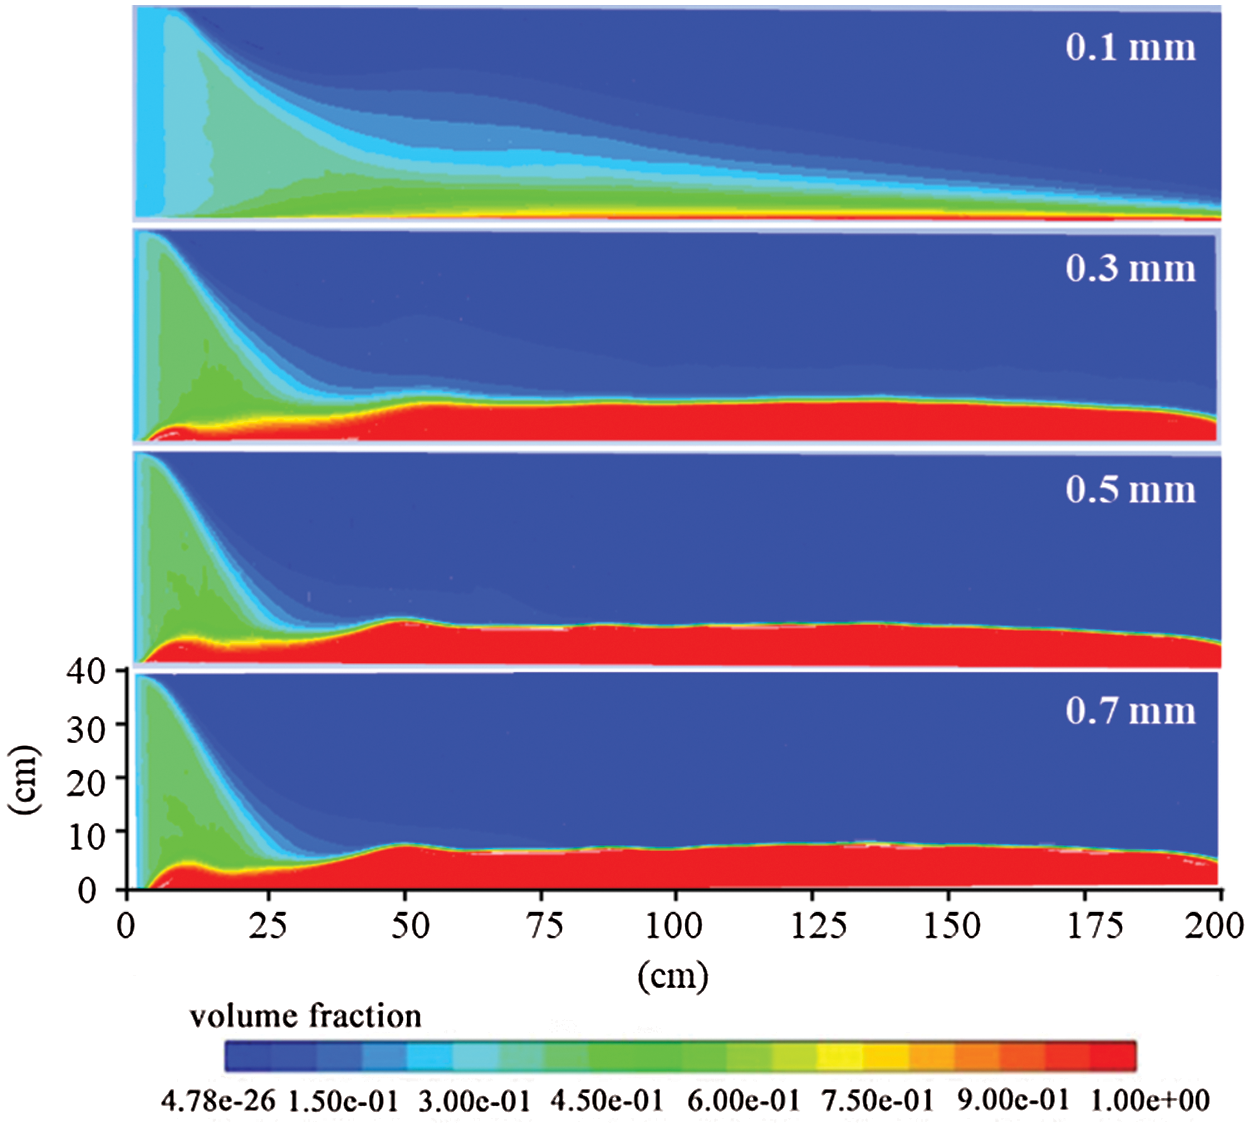
Figure 10: Proppant distribution in 45° rough fracture with different particle sizes
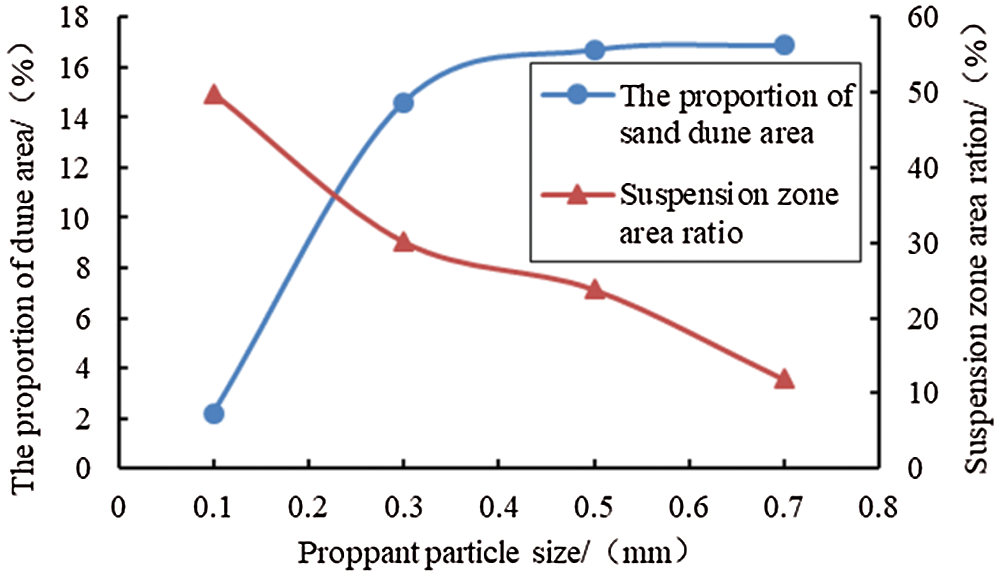
Figure 11: Variation curve of the area ratio of embankment and suspension zone with proppant particle size
It can be qualitatively seen from Fig. 10 that 0.1 mm particle size has a great influence on the distribution form of dune, while other particle sizes have a minor influence on the distribution form of the dune. On the whole, the height of the dune increases with the increase of particle size. The particle size greatly influences on the distribution pattern of the suspension zone, and the transport distance and distribution range of the suspension zone increase with the decrease of particle size.
It can be seen that when the proppant particle size is 0.1 mm, the proportion of dune is 2.19%, and then increases sharply with the increase of particle size. When the particle size increases to 0.3 mm, it slows down and finally increases to 16.89% corresponding to 0.7 mm. Compared with the dune proportion, the proppant particle size significantly affects the proportion of the suspended zone. The suspension zone corresponding to 0.7 mm was the smallest, which was 11.86%. It then increased with the decrease of particle size, finally reaching 49.81% corresponding to 0.1 mm, and the range reached 38%.The maximum ratio is four times the minimum ratio.
It can be seen from the Stokes settlement formula (Eq. (15)) that the proppant settlement rate is proportional to the square of the proppant particle size. As the particle size increases, the proppant settles at an exponential rate, so the proppant with large particle size is more likely to settle, resulting in more dunes and fewer suspension zones.
Here, Vs is proppant settling velocity; g is the acceleration of gravity; ρp is proppant density. ρf is the fluid density.
The injection rate is a critical parameter in the fracturing field, especially in unconventional fracturing with low viscosity and high speed. To explore the effect of velocity on proppant transport, we have performed simulation calculations on plans 1, 12, 13, and 14 to obtain the following proppant distribution map.
As can be seen from Fig. 12, using a high injection rate, proppant transport distance is enlarged, settlement is reduced, the distribution of suspension zone is increased, and the front edge of the dune is further away from the injector.
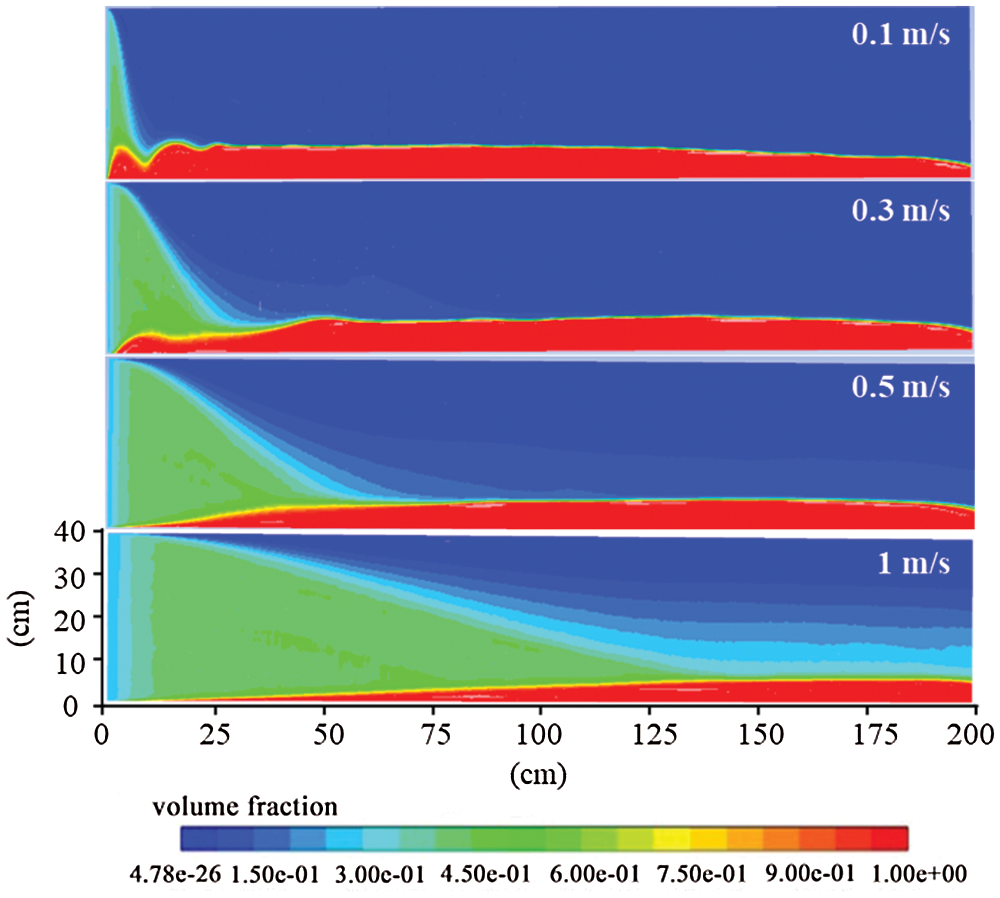
Figure 12: Proppant distribution in 45° rough fracture at different injection rates
As can be seen from Fig. 13, with the increase of injection velocity, the proportion of dune gradually decreases, and the proportion of suspended zone gradually increases. When the injection speed is 0.1 m/s, the dune accounts for the largest area (18.21%), and the suspension zone accounts for the smallest area (17.36%). When the injection speed is 1 m/s, dune area is the smallest, accounting for 8.07%, and the proportion of suspended zone is the largest, accounting for 71.43%. The maximum area of the dune is about two times the minimum area, and the maximum area of the suspension zone is four times the minimum area.
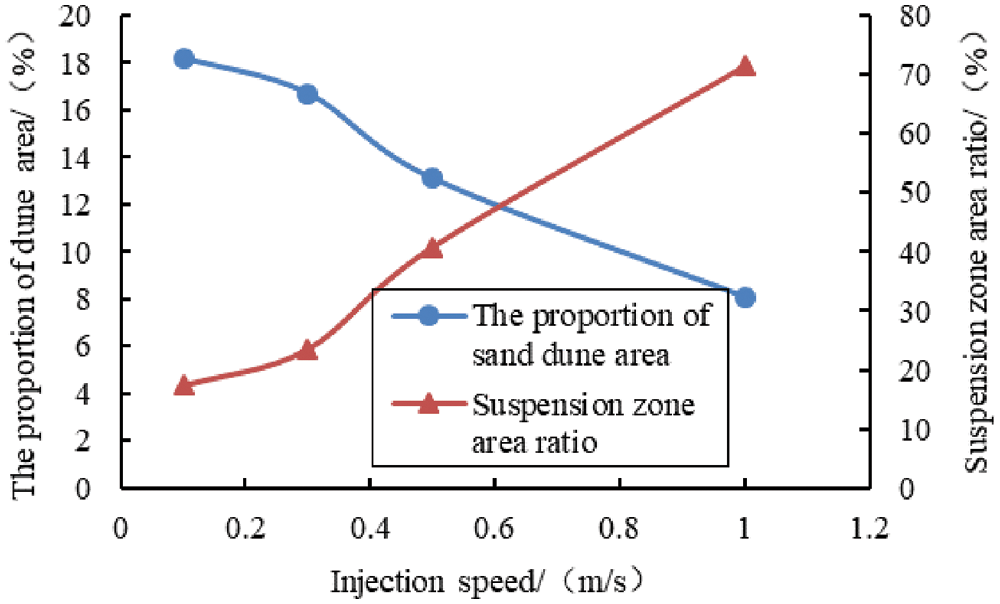
Figure 13: Variation curve of the area ratio of dune and suspension zone with injection rate
It can be indicated that as the injection rate increases, the proppant and fracturing fluid will gain more kinetic energy, so that the proppant will migrate further away from the injection port and settle further. Moreover, more kinetic energy gained by the proppant and fracturing fluid increases the chance of collision with the rough wall, resulting in more turbulence, which slows proppant settlement and enlarges the distribution of the suspension zone.
The viscosity of fracturing fluid is another important parameter in a fracturing operation. To explore the influence of this parameter on proppant transport and settlement in inclined fracture, the idea of the control variable method is continued. Schemes 1, 15, 16, and 17 were conducted to obtain the proppant distribution under different viscosities.
As can be qualitatively seen from the proppant distribution (Fig. 14), with the increase of viscosity, the height and area of the dune decrease, and the distance from the leading edge of the dune to the injector increases, to further proppant transport and larger suspension zone area.
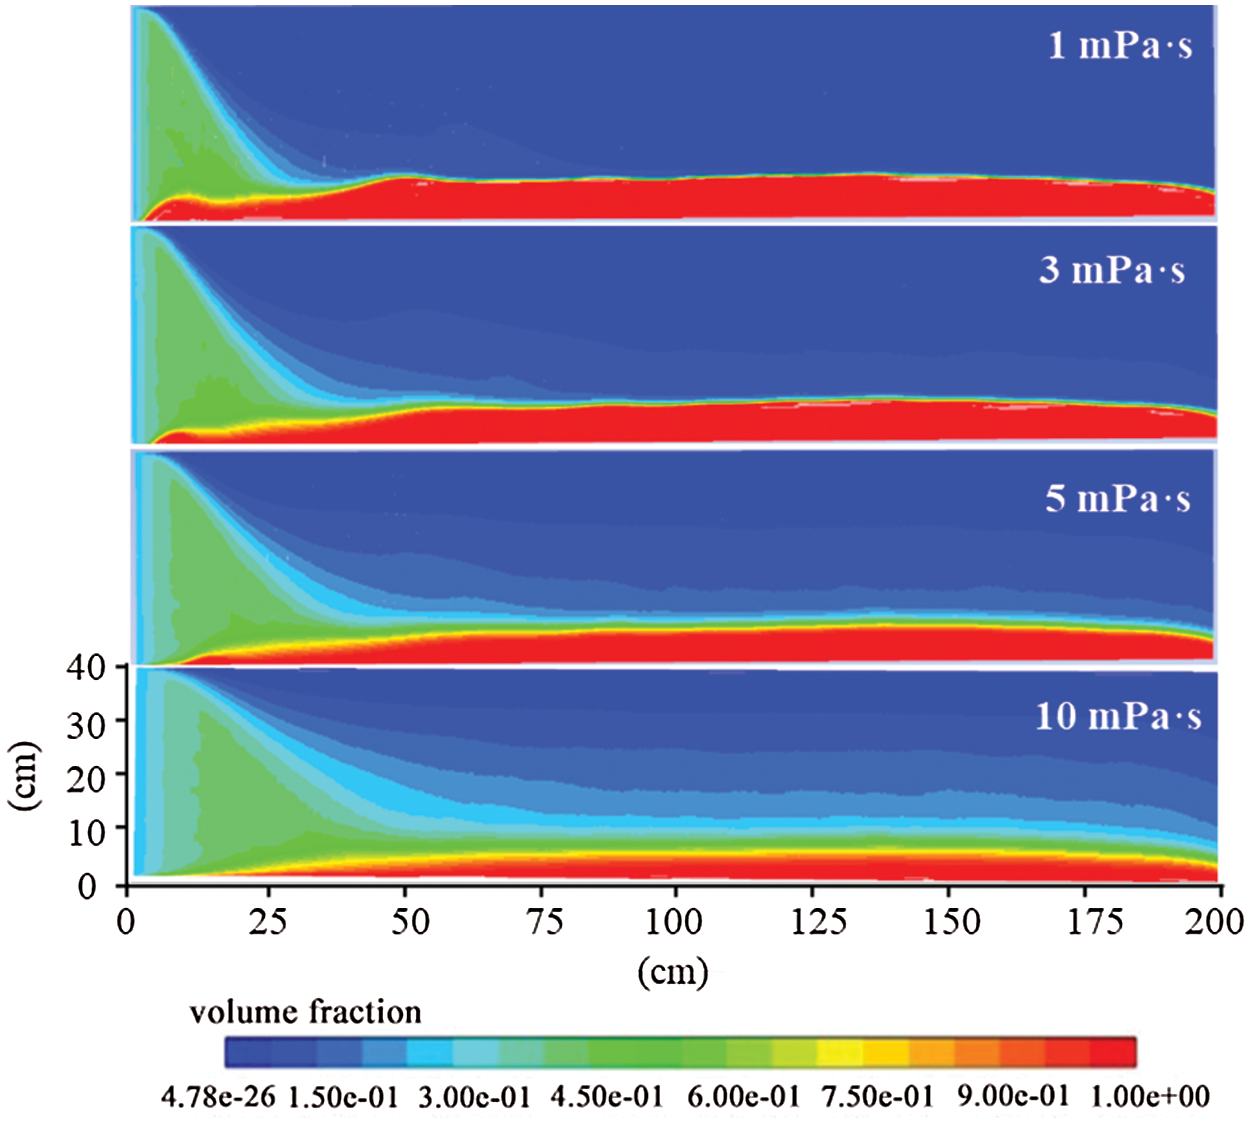
Figure 14: Proppant distribution in 45° rough fracture with different fracturing fluid viscosities
It can be quantitatively observed from Fig. 15 that when the fracturing fluid viscosity is 1 mPa.s, the area ratio of dune and the area ratio of suspension zone reach the maximum and minimum, respectively. When the viscosity is 10 mPa.s, they reach the minimum and maximum, respectively. The proportion of dune decreases gradually with the increase of fracturing fluid viscosity, and the range is about 8%. On the contrary, the proportion of the suspension zone increased gradually, the range was about 57%, and the maximum proportion was 4.9 times that of the minimum proportion. This is because the fracturing fluid’s increased viscosity increases the fracturing fluid’s sand-carrying and suspension capacity, and the proppant is carried farther away from the fracture, which also reduces the proppant’s settling capacity.
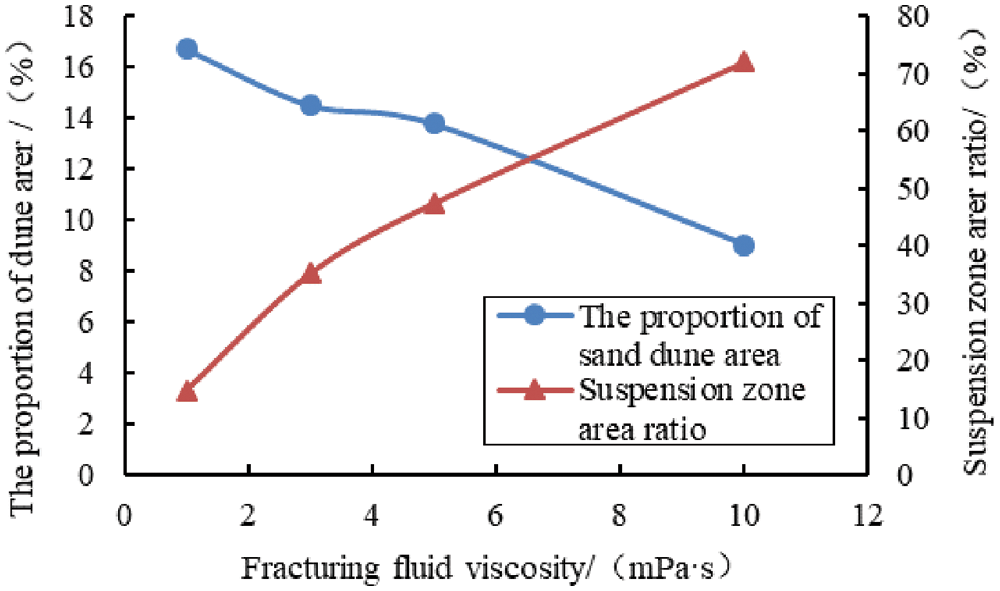
Figure 15: The proportion of dune and suspended zone area varies with fracturing fluid viscosity
(1) Fracture roughness can significantly affect proppant placement and migration, and proppant migration is farther in rough fractures and the distance between the front edge of the dune and the fracture entrance is longer. The inclined angle has little effect on the dune, however the area of the suspended zone increases with the decrease of the inclined angle, and the area of the suspended zone at 15° is 20 times that of 90°. Suspension zones and dunes are most widely distributed in 0° (horizontal) rough fractures.
(2) Proppant particle size has a significant effect on the suspension zone. 0.1 mm corresponds to the maximum area of the suspension zone, 0.7 mm corresponds to the minimum area, the maximum is four times the minimum. The dune area will decrease with the increase of injection velocity, and the minimum is 50%. The area of the suspension zone will increase with the increase of the injection speed, and the maximum is four times that of the minimum. As the injection rate increases, the proppant moves farther and the embankment front is farther away from the injector. The area of the dune decreases with the increase of fracturing fluid viscosity. On the contrary, the area of the suspension zone increases gradually, and the maximum area is 4.9 times the minimum area.
(3) To achieve an ideal proppant placement effect, it is recommended to use a proppant with small particle size, high injection rate, and high fracturing fluid viscosity at the early stage of construction. Large particle size, low injection rate and low fracturing fluid viscosity were used in the later stage of construction.
Funding Statement: The authors would like to acknowledge the financial support of the National Natural Science Foundation of China (Grant No. 52074332), and express their gratitude to project ZR2020YQ36 supported by Shandong Provincial Science Fund for Excellent Young Scholars.
Conflicts of Interest: The authors declare that they have no conflicts of interest to report regarding the present study.
1. Raki, S., Moghanloo, R. G. (2019). Proppant transport in complex fracture networks–A review. Journal of Petroleum Science and Engineering, 182, 106199. DOI 10.1016/j.petrol.2019.106199. [Google Scholar] [CrossRef]
2. Huang, H., Babadagli, T., Li, H. Z., Develi, K., Zhou, D. S. (2020). A visual experimental study on proppants transport in rough vertical fractures. International Journal of Rock Mechanics and Mining Sciences, 134, 104446. DOI 10.1016/j.ijrmms.2020.104446. [Google Scholar] [CrossRef]
3. Pan, L. H., Zhang, Y., Lu, C. H. (2016). Research on complex fracture propagation in shale reservoirs. Fault-block Oil and Gas Field, 23(1), 90–94. DOI 10.6056/dkyqt201601020. [Google Scholar] [CrossRef]
4. Wang, J., Elsworth, D. (2020). Fracture penetration and proppant transport in gas- and foam-fracturing. Journal of Natural Gas Science and Engineering, 77, 103–269. DOI 10.1016/j.jngse.2020.103269. [Google Scholar] [CrossRef]
5. Dayan, A., Stracener, S. M., Peter, E. C. (2009). Proppant transport in slickwater fracturing of shale Gas formations. SPE Annual Technical Conference and Exhibition, New Orleans, Louisiana. DOI 10.2118/125068-MS. [Google Scholar] [CrossRef]
6. Sahai, R. (2012). Laboratory evaluation of proppant transport in complex fracture systems (MS Thesis). Colorado School of Mines, Golden, Colorado, October 10. [Google Scholar]
7. Wen, Q. Z., Duan, X. F., Zhan, Y. P., Liu, H., Li, Y. et al. (2016). Study on settlement and migration of proppant in complex fracture network. Journal of Xi ‘an Petroleum University (Natural Science Edition), 31(1), 79–84. DOI 10.3969 /j.issn.1673-064X.2016.01.013. [Google Scholar]
8. Li, L. (2014). Experimental study on the settlement and transport of proppant in compression fractures (MA Thesis). Southwest Petroleum University. [Google Scholar]
9. Msalli, A. A., Jennifer, L. M. (2015). Slickwater proppant transport in complex fractures: New experimental findings & scalable correlation. SPE-174828-MS. [Google Scholar]
10. Chun, T., Li, Y., Wu, K. (2020). Comprehensive experimental study of proppant transport in an inclined fracture. Journal of Petroleum Science and Engineering, 184, 106523. DOI 10.1016/j.petrol.2019.106523. [Google Scholar] [CrossRef]
11. Wang, X. Y., Yao, J., Gong, L., Sun, H., Yang, Y. F. et al. (2019). Numerical simulations of proppant deposition and transport characteristics in hydraulic fractures and fracture networks. Journal of Petroleum Science and Engineering, 183, 106401. DOI 10.1016/j.petrol.2019.106401. [Google Scholar] [CrossRef]
12. Gong, Y., Mehana, M., El-Monier, I., Hari, V. (2020). Proppant placement in complex fracture geometries: A computational fluid dynamics study. Journal of Natural Gas Science and Engineering, 79, 103295. DOI 10.1016/j.jngse.2020.103295. [Google Scholar] [CrossRef]
13. Lu, C., Ma, L., Li, Z., Huang, F., Huang, C. et al. (2020). A novel hydraulic fracturing method based on the coupled CFD-dEM numerical simulation study. Applied Sciences, 10(9), 3027. DOI 10.3390/app10093027. [Google Scholar] [CrossRef]
14. Kou, R., Moridis, G. J., Blasingame, T. A. (2018). Analysis and modeling of proppant transport in inclined hydraulic fractures. SPE Hydraulic Fracturing Technology Conference and Exhibition, The Woodlands, Texas, USA. [Google Scholar]
15. Xu, N. Z., Xu, N. (2013). Proppant fracture transport settlement simulation based on FLUENT. Natural Gas and Petroleum, 31(3), 46–49. DOI 10.3969/j.issn.1006-5539.2013.03.013. [Google Scholar] [CrossRef]
16. Ogilvie, S. R., Isakov, E., Glover, P. W. J. (2006). Fluid flow through rough fractures in rocks. II: A new matching model for rough rock fractures. Earth and Planetary Science Letters, 241(3–4), 454–465. DOI 10.1016/j.epsl.2005.11.041. [Google Scholar] [CrossRef]
17. Briggs, S., Karney, B. W., Sleep, B. E. (2017). Numerical modeling of the effects of roughness on flow and eddy formation in fractures. Journal of Rock Mechanics and Geotechnical Engineering, 9(1), 105–115. DOI 10.1016/j.jrmge.2016.08.004. [Google Scholar] [CrossRef]
18. Suri, Y., Islam, S. Z., Hossain, M. (2019). A new CFD approach for proppant transport in unconventional hydraulic fractures. Journal of Natural Gas Science and Engineering, 70, 102951. DOI 10.1016/j.jngse.2019.102951. [Google Scholar] [CrossRef]
19. Zeng, J. S., Li, H., Zhang, D. X. (2016). Numerical simulation of proppant transport in hydraulic fracture with the upscaling CFD-dEM method. Journal of Natural Gas Science and Engineering, 33, 264–277. DOI 10.1016/j.jngse.2016.05.030. [Google Scholar] [CrossRef]
20. Guo, T. K., Qu, Z. Q., Li, M. Z., Chen, D. C., Dong, C. Y. et al. (2018). Development of a virtual simulation device for proppant transport of large and complex fractures. Laboratory Research and Exploration, 37(10), 242–246. DOI 1006-7167( 2018)10-0242-05. [Google Scholar]
 | This work is licensed under a Creative Commons Attribution 4.0 International License, which permits unrestricted use, distribution, and reproduction in any medium, provided the original work is properly cited. |