| Fluid Dynamics & Materials Processing |
DOI: 10.32604/fdmp.2022.018141
ARTICLE
Simulation of the Pressure-Sensitive Seepage Fracture Network in Oil Reservoirs with Multi-Group Fractures
1State Key Laboratory of Petroleum Resources and Prospecting, China University of Petroleum (Beijing), Beijing, 102249, China
2College of Petroleum Engineering, China University of Petroleum (Beijing), Beijing, 102249, China
*Corresponding Author: Yuetian Liu. Email: Liuyts2020@163.com
Received: 01 July 2021; Accepted: 03 October 2021
Abstract: Stress sensitivity is a very important index to understand the seepage characteristics of a reservoir. In this study, dedicated experiments and theoretical arguments based on the visualization of porous media are used to assess the effects of the fracture angle, spacing, and relevant elastic parameters on the principal value of the permeability tensor. The fracture apertures at different angles show different change rates, which influence the relative permeability for different sets of fractures. Furthermore, under the same pressure condition, the fractures with different angles show different degrees of deformation so that the principal value direction of permeability rotates. This phenomenon leads to a variation in the water seepage direction in typical water-injection applications, thereby hindering the expected exploitation effect of the original well network. Overall, the research findings in this paper can be used as guidance to improve the effectiveness of water injection exploitation in the oil field industry.
Keywords: Pressure sensitive; fracture network; physical simulation; seepage laws
The study on reservoir stress sensitivity has a long history. As early as 1957, Geertsma [1] defined the coefficient of volume compressibility of rock, which can quantitatively characterize the relationship between the changes of pore volume and pore fluid pressure. In 1993, Hubert et al. [2], according to the actual data on reservoir production, explained the anisotropic permeability and nonlinear deformation characteristics of fractures and their effects on production capacity. Regarding the characterization of stress-sensitive permeability of fractures, some scholars (Louis (1969), Snow (1969), Jones (1975), Gangi (1978), McKee et al. (1988)) put forward various empirical models [3–13]. However, in these models, the influence of fracture directivity on stress sensitivity characteristics was not taken into account.
Numerous researchers have studied the stress sensitivity characteristics of fractured reservoirs of different lithologies from different perspectives [14–38]. In 2000, Jiang et al. [14] studied the laws on the changes of hydraulic aperture and permeability with effective stress. In 2002, Qin [15], by analyzing the variation characteristics of rock permeability with the change of confining pressure, proposed using a linear combination of an exponential function to characterize the relation between confining pressure and permeability. Through experimental research, Wang et al. [16] pointed out that the deformation of the rock with pressure is very obvious when the permeability was less than 1 × 10⁻³ μm2, and thus a very significant fluid-solid coupling effect was generated. Liu et al. [17] found that the permeability and shear stress showed a linear relationship and that the permeability of fracture would decrease with the increase of shear load before shear action. In 2004, Zhang et al. [18] selected matrix rocks and fractured rock samples from three different layers in the Ordos Basin to conduct stress sensitivity tests. They found that matrix rocks with a higher content of rock debris between different layers showed strong deformation, while deformation of fractured rock in the same layer was greater than that of pure matrix rock samples. In 2005, Yang et al. [19] tested the stress sensitivity characteristics in the laboratory of rock samples taken from the Kela-2 gas reservoir and fitted the expression to a power function for permeability and stress. In 2006, Liang et al. [20] established a calculation model for meso-elastoplastic fracture surface deformation based on the B&S (Brown & Scholz) rough surface contact theory and found that a larger the fracture aperture typically was associated with a higher the stress sensitivity of fractured reservoirs. In 2007, Dai et al. [21] established the rock fracture judging criteria applicable to low-permeability sandstone reservoirs. The Griffith criterion was applied to tension fractures and the Mohr-Coulomb criterion was used for shear fractures. Yu et al. [22] proposed a stress sensitivity evaluation method with effective stress as the starting point. In 2008, Sun et al. [23] introduced permeability modulus to analyze the stress sensitivity characteristics of rock. Luo et al. [24], based on analyzing a large amount of experimental data, defined a new stress sensitivity evaluation index, which can easily characterize the variation between arbitrary initial permeability and the effective overburden pressure. In 2010, Du et al. [25], using the low-permeability reservoir in the Jiyuan Oilfield, conducted stress sensitivity tests on base-block rock samples and rock samples with artificially-formed fractures, and analyzed the dominant factor through experimental results. Ji et al. [26], based on the principle of micro-fracture formation, the relationship between stress and rock failure under the simultaneous action of triaxial compressive stress and tensile stress is studied. They proposed a calculation model, which can calculate parameters including fracture density, fracture aperture, fracture porosity, and fracture permeability. The directionality of vector parameters can be reflected in calculating the permeability. Zhu et al. [27] obtained the relationship between dynamic permeability and effective confining pressure through experiments, and established a two-dimensional gas-water dual-phase numerical model with artificial fractures for predicting coalbed methane production, which considers permeability changes. In 2011, Feng et al. [28], through physical simulation and theoretical derivation, established a mathematical model that included parameters such as the stress-strain relationship, fracture aperture, and fracture density. This model can quantitatively calculate the relationships among the stress field, energy, and fracture parameters. Chen et al. [29] summarized the progress in research on the experimental methods of stress sensitivity in low permeability reservoirs, fluid-solid coupling model considering pressure sensitivity, and the related deliverability equation. In 2013, Zhao et al. [30] studied the pressure sensitivity characteristics of fractured rock samples in a pure matrix, unfilling fracture, semi-filling fracture, and full-filling fracture states using the gas measurement method. In 2014, Wang et al. [31], with Keshen Gas Field taken as the background reservoir, based on the numerical method, the stress sensitive deformation law and the sensitive factors of the fractured rock medium are analyzed.
At present, there is no physical simulation experiment of fractures in different directions that can achieve fracture control. Moreover, the influence of directional fracture pressure-sensitive effect on the water injection in development has not been analyzed and reported mature. Based on the superposition principle of permeability tensor, this paper studies the directional pressure-sensitive deformation characteristics of multiple groups of fractures through physical simulation experiments with controllable fractures in different directions.The principle value and direction of permeability in porous media containing multiple groups of fractures are studied by tensor analysis theory. These conclusion is helpful for reservoir engineers to have a deep understanding of the seepage law during water injection in fractured reservoirs and provide guidance for the development of water injection in similar reservoirs.
2 Permeability Tensor Characterization
In an elastic porous seepage media containing multiple groups of fractures, the comprehensive effect of all fractures on fluid flow can be regarded as equivalent to the superposition of the effect of each group of fractures on the microelement, which conforms to the superposition principle. Assuming that two groups of fractures in different directions develop in an element, and the coordinate system xy is established in the direction of the main line between the injection and production ends as x-axis (Fig. 1), then tensor in this coordinate system is as follows:
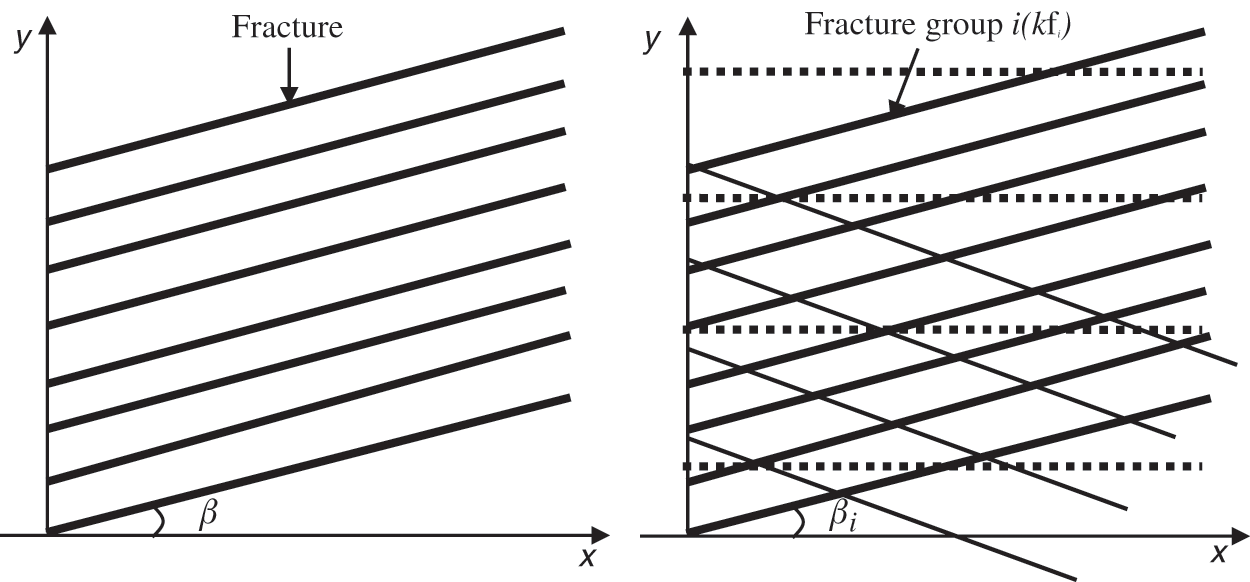
Figure 1: Schematic of fracture distribution in i groups
Fracture Group 1:
where,
Fracture Group 2:
where,
The overall permeability tensor of the characteristic microelement with two groups of fractures developed simultaneously can then be expressed as
where,
2.2 Dynamic Permeability Model for Pressure Sensitivity in Two-Dimensional Direction of Fractures
Fig. 2 shows the schematic diagram for the two groups of fractures developed in a microelement. According to the superposition principle above, the full tensor expression for equivalent permeability of pressure sensitivity in the two-dimensional direction of fractures obtained follows:
where, kxx, kxy, kyx, kyy—Components of the permeability tensor in xx, xy, yx, yy directions, μm2; Kf —fracture permeability, which is calculated by a new pressure sensitivity equation considering fracture directivity [33].
where, kfi—equivalent permeability of fracture group i, μm2; k0i—The permeability of group i fracture system at p0 pore fluid pressure, μm2; Em—Elastic modulus of matrix system, MPa; Ef—Elastic modulus of fracture system, MPa; ν—Poisson’s ratio; d0i—Initial fracture spacing, mm; b0i—Initial fracture spacing, mm; αm and αf are the effective stress coefficients of matrix system and fracture system respectively, 0 < αm < 1, 0 < αf < 1, and αf > αm in fractured porous media; αf = αm may occur only when fractures do not develop in porous media; Δp is the change of average pore fluid pressure, Δp = p−p0, P0 is the initial average pore fluid pressure, P is the current average pore fluid pressure, MPa; βi—the included angle between the group i fracture direction and x-axis direction.
Subscript i in Eq. (4) denotes the ith group of fractures.
Figure 2: Schematic of fracture distribution in two groups
2.3 3D Dynamic Permeability Model for Pressure Sensitivity of Fractures
Similarly, assuming that fracture anisotropy exists in all directions, permeability tensor should be expressed in the form of a three-dimensional tensor, and the fracture dip and azimuth are denoted by α and β, respectively, with subscript i denoting the ith group of fractures. Then the three-dimensional dynamic permeability tensor model considering the pressure sensitivity effect of fracture directivity can be expressed as
where, αi—Fracture dip angle of group i fracture, °.
Each component of the overall permeability tensor for the seepage media above containing M groups of fractures, calculating using the following system of equations:
In the formula above, kf—denotes fracture system permeability on direction parallel to the fracture, which is calculated by a new pressure sensitivity equation considering fracture directivity [32].
kzz, kxz, kyz—Components of the permeability tensor in zz, xz, yz directions, μm2.
M—Number of fracture groups, integer.
3 Principal Value and Direction of Permeability Tensor of Multiple Groups of Fractured Media
When multiple groups of fractures develop in any typical microelement in an ultra-low permeability reservoir, the contribution of all fractures developed in the microelement to the total permeability tensor ellipse can be equivalent to the contribution of a set of corresponding fractures. However, it is generally not the same as the principal value of permeability in magnitude and direction for any group of fractures involved in the superposition. For example, when two groups of fractures are distributed in an orthogonal manner, the maximum principal value direction of permeability after superposition may be parallel to one group of fractures.
Different groups of fractures have different angles. The length and direction of the long axis and short axis of the tensor permeability ellipse under the comprehensive action of multiple fractures to be obtained by superposition principle, it is necessary to first convert the permeability tensor of each group of fractures to the same reference coordinate system xy. The corresponding components are then added, thus obtaining the permeability tensor of the media under the comprehensive action of multiple groups of fractures. The included angle β can be obtained through this tensor. Using the included angle, the tensor is converted to the fracture coordinate system, thus obtaining the principal value of permeability. As shown in Fig. 3, the x′y′ and xy coordinate systems are established along the principal value direction of permeability and the direction of the main line between the injection and production ends, respectively.
Then, the tensor in coordinate system for principal value of permeability is
and in coordinate system for macroscopic pressure gradient, it is expressed as
The included angle is β, then, using the superposition principle, tensor-theory, and coordinate-transformation theory, transformation relation of tensor in the two coordinate systems can be obtained as follows:
In the formula above, k′—Components of the permeability tensor in x′y′, where xx, xy, yy denotes directions in coordinate systems, μm2.
Among them β can be calculated as
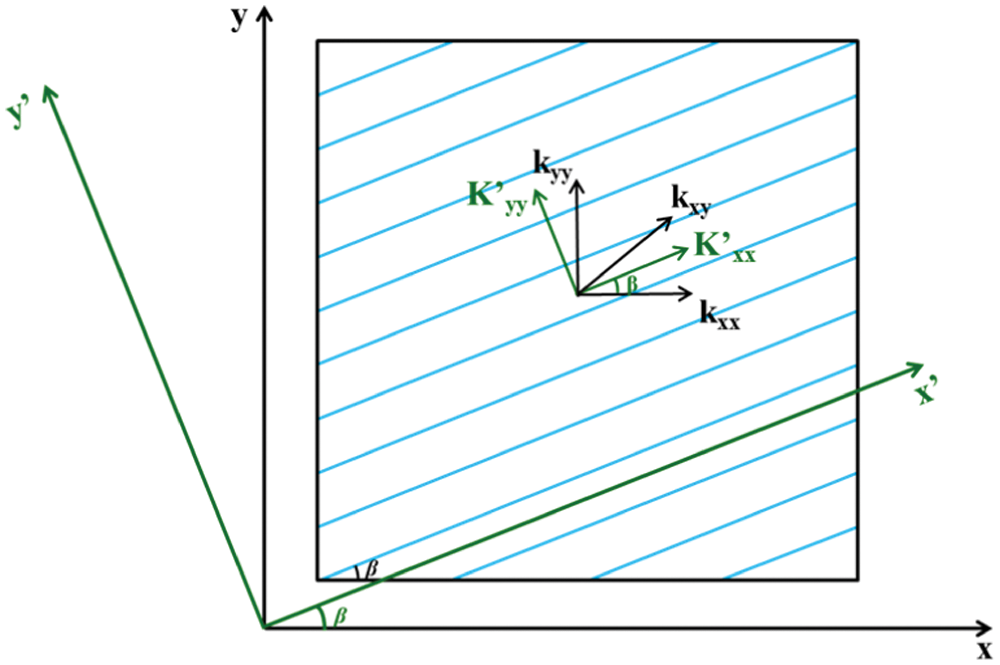
Figure 3: Relationship between the anisotropic permeability tensor at different coordinates
4 Physical Simulation Experiments on Seepage of Multiple Groups of Fractures
4.1 Experimental Objective and Experimental Device Design
Two groups of cross fracture models combined at different angles were designed and tested to measure the flow rate of each model, under different average pore fluid pressure and pressure gradient conditions. Deformation law of fracture network with different dip angles and azimuth angles and its influence on seepage field when fractures show pressure sensitivity effect were designed and analyzed.
As shown in Fig. 4, the direction of the mainstream line at the parallel injection and production end is taken as the x-axis to establish the Cartesian coordinate system. The outer boundary condition of the experimental model is the constant volume boundary, and the left boundary of the model is the injection boundary and the right boundary is the production boundary. Matrix isotropic. The experimental fluid is distilled water. Fig. 5 shows a mock-up of the physical simulation, and Fig. 6 shows the experimental flow chart.
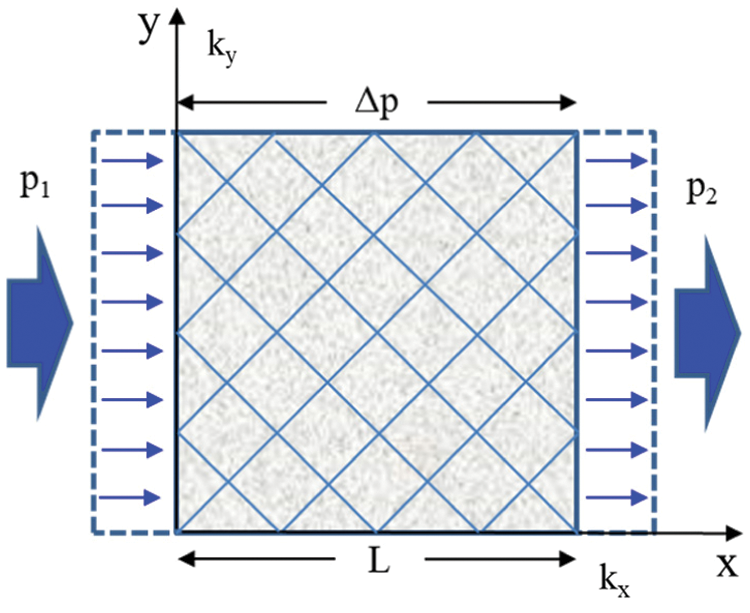
Figure 4: Theoretical diagram for experimental model of multiple groups of fractures
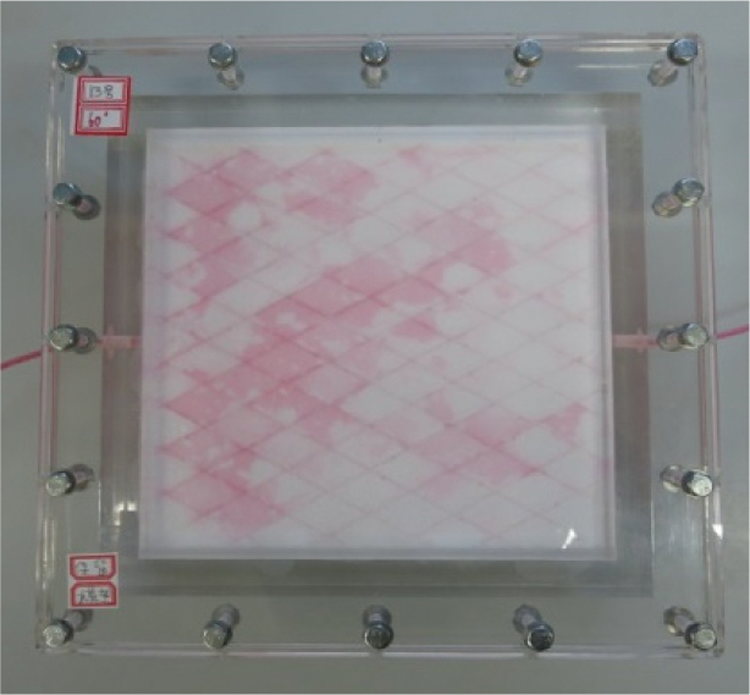
Figure 5: Physical drawing for the experimental model of two groups of fractures

Figure 6: Experimental flow chart
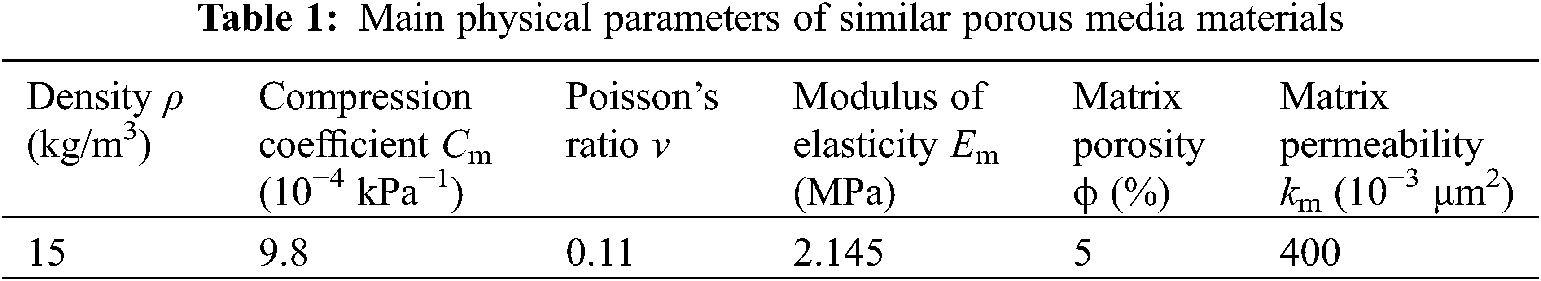
The experimental materials
Polystyrene foam board (EPS), a porous material similar to the actual reservoir core, is selected to produce fractured seepage media. The elastic parameters of EPS foam board with different densities are different. The density of the material selected in this experiment is 15 kg/m3 and the elastic modulus is 2.145 MPa. See Table 1 for other relevant parameters. Compared with the actual core, the experimental material is less difficult to make fractures, and the properties of all fractures can be guaranteed.
Laboratory equipment
Conventional pressure-sensitive testing devices can only indirectly reflect the deformation process of seepage media through experimental test data. In order to intuitively observe the dynamic change process of crack opening when fluid pressure changes, transparent plexiglass tank is used as the container of the experimental model (Fig. 5). The whole experimental device is mainly composed of three parts (Fig. 6). They are fluid injection system (constant pressure constant flow pump, intermediate vessel), fluid displacement system (six-way valve, fracture seepage model, back pressure valve) and measurement system (pressure gauge, electronic balance).
The modified content has been highlighted in yellow in the manuscript.
4.2 Main Experiment Contents and Experimental Procedures
Based on the optimal fracture spacing of 1.88 cm selected in the single-group fracture experiment, the same porous media material as in the physical simulation experiment of single-group fracture seepage was selected. As shown in Figs. 7a–7l, 12 types of fracture network models in total were designed for observation and measurement. The testing process mainly included the following two parts: ① under the condition with the constant pressure gradient, the pore fluid pressure was changed to measure the flow rate of the samples under different pore fluid pressures; ② the average pore fluid pressure is unchanged, and different pressure gradients are set to measure the flow rate of the samples under conditions with different pressure gradients, and the data was recorded. The primary experimental process consists primarily of the following five procedures: ① similar porous media materials that meet the experimental requirements were selected; ② several fracture networks with different fracture angles was designed and manufactured on the optimized similar porous media materials to form fractured seepage mediums, which was used as experimental models; ③ the experimental model was assembled and sealed, and the experimental facilities were successively connected according to the designed experimental procedures to form a complete test system; ④ the preparations before the test was completed: water was injected at a low speed and constant flow to achieve model exhaust saturated water, balance leveling, and pressure gauge zero calibration; ⑤ According to the designed experimental scheme, the inlet and outlet pressure were set, the data on the flow rates at the outlet end were tested and recorded, and the original experimental test data were saved and recorded.
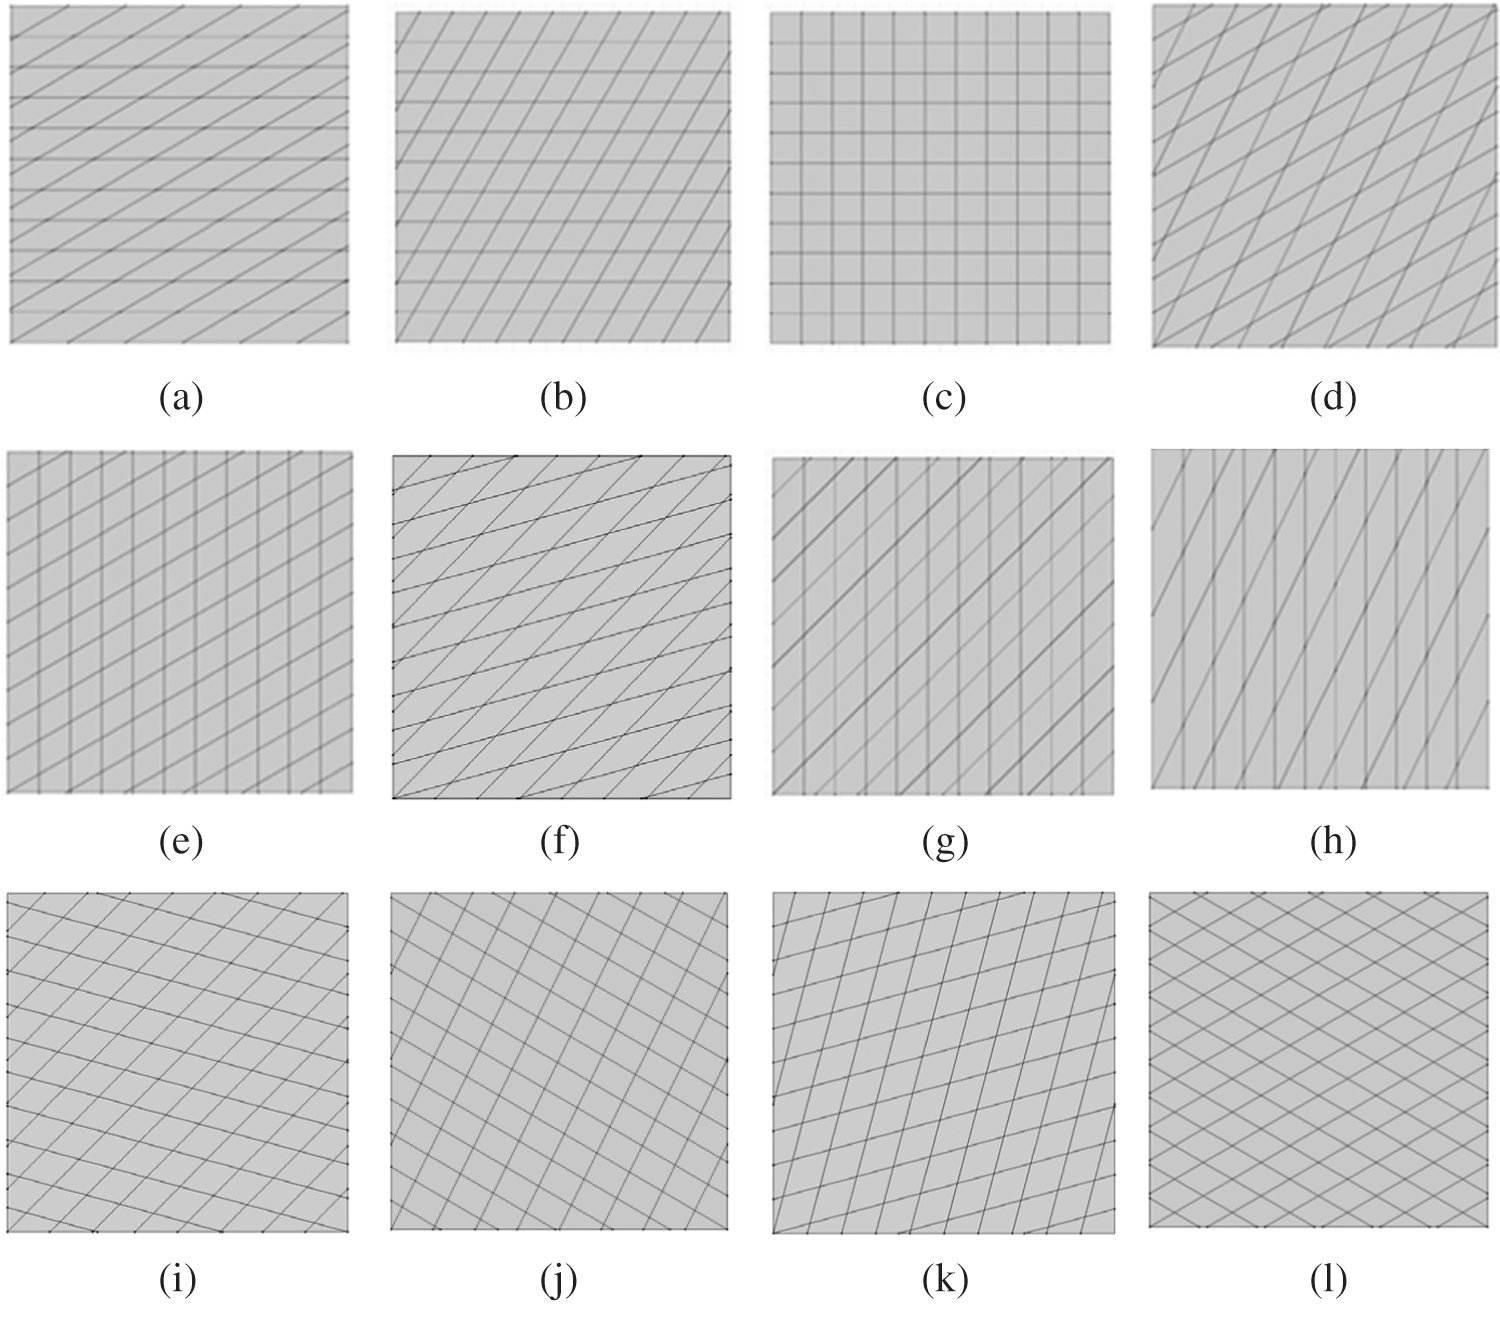
Figure 7: Schematic diagram of different fracture distribution in experimental models (a) 0°–30° combination (b) 0°–60° combination (c) 0°–90° combination (d) 30°–60° combination (e) 30°–90° combination (f) 45°–15° combination (g) 45°–90° combination (h) 60°–90° combination (i) 45°–(−15°) combination (j) 60°–(−30°) combination (k) 75°–15° combination (l) 30°–(−30°) combination
4.3 Experimental Results and Analysis
The dominant propagation direction of pressure was always parallel to the direction of fracture development. Pressure that is preferred to propagate in the fracture will gradually diffuse into the surrounding matrix over production time (Fig. 8). With the development of different fracture directions, different reservoir areas are preferentially affected by pressure (Fig. 9). In terms of the corresponding actual reservoir, oil and water are distributed differently across different areas, and the initial production capacity of a producing well dramatically differs.

Figure 8: Different stages of fluid flowing in the model (a) Fluid does not enter the model (b) The early stage for the fluid enters the model (c) Fluid flows steadily in the model

Figure 9: Pressure field plan for different stages of fluid flow in the model (a) At the initial stage (b) During production (c) Steady-state
(1) Flow variation laws
The pressure gradient of the model was kept constant at 0.01 MPa/m. Figs. 10a–10e show the variation curves of the flow rate with the pore fluid pressure in the combination model of fractures at different angles. It can be seen that with the angle of a group of fractures remaining unchanged, the larger the angle of the other group of fractures, and the smaller the flow at the production end of the model. The smaller the β is, the greater the flow at the production end of the whole model.
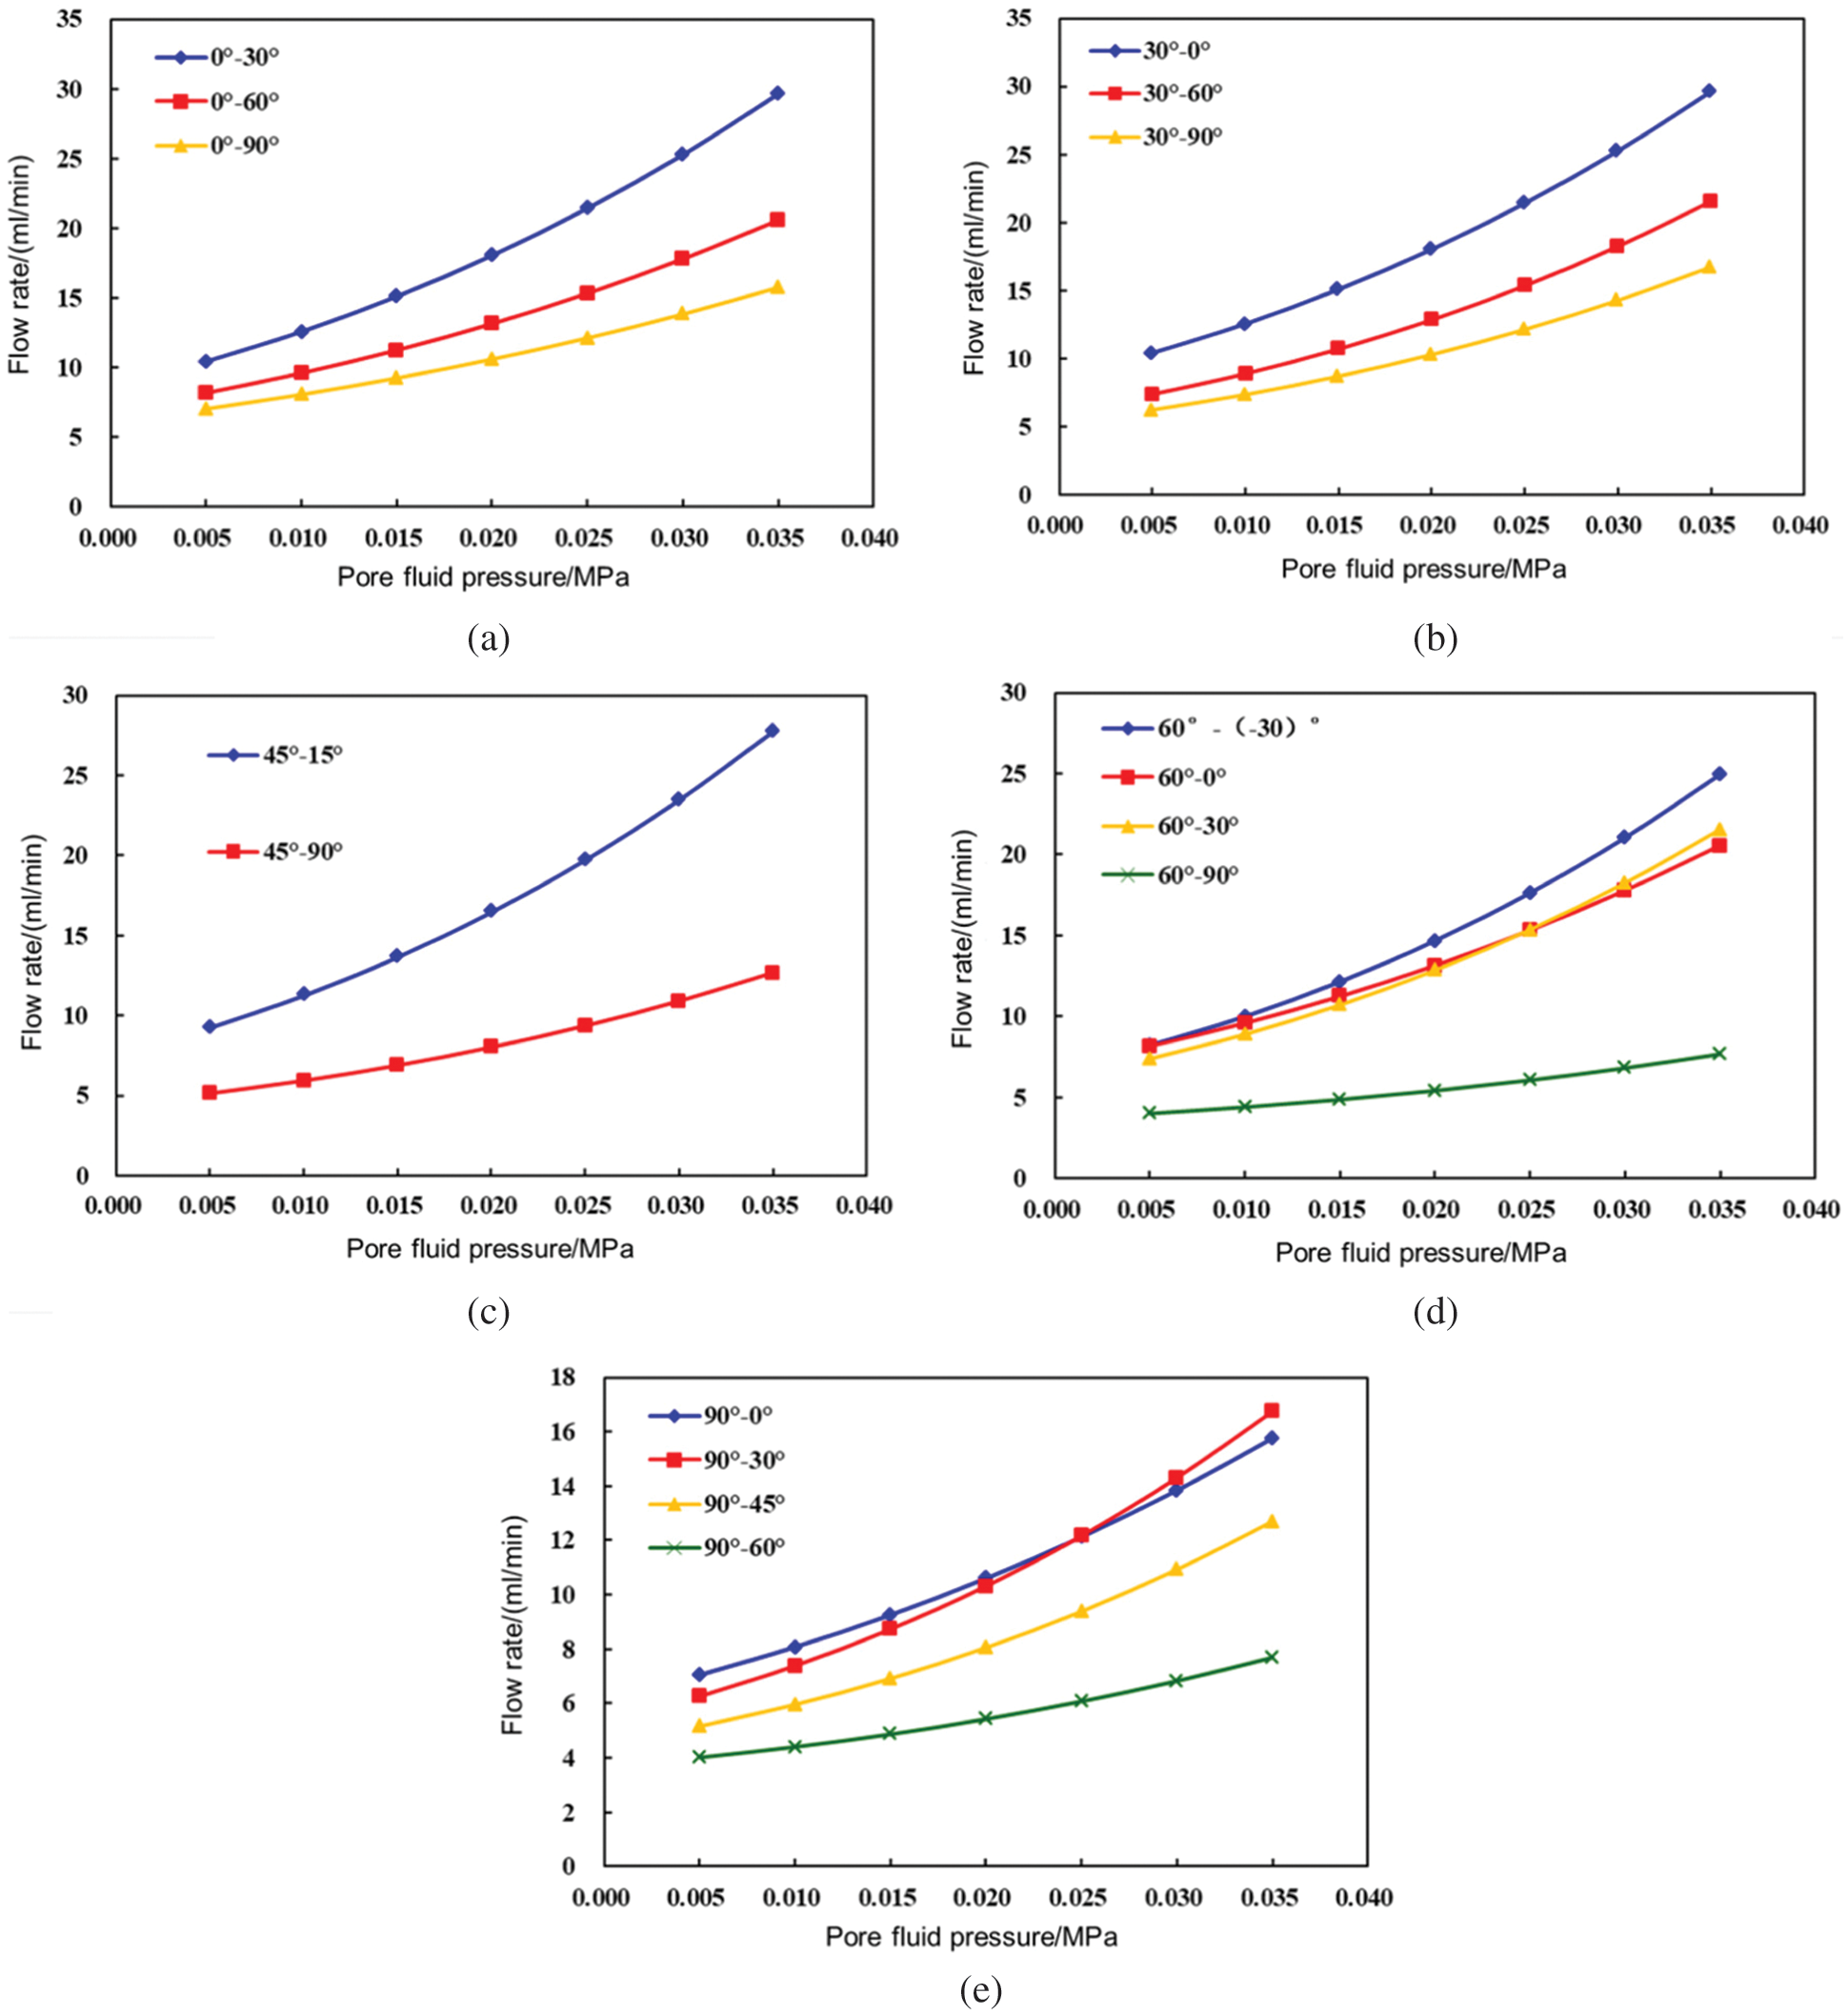
Figure 10: Flow curve of models at each angle (a) One group of fractures is at 0° (b) One group of fractures is at 30° (c) One group of fractures is at 45° (d) One group of fractures is at 60° (e) One group of fractures is at 90°
When the pore fluid pressure is less than 0.025 MPa, the flow rate of the fracture model at 60°~30° is less than that at 60°~0°. However, when the average pore fluid pressure exceeds 0.025 MPa, the liquid outflow at the outlet of the 60°~30° fracture model is greater than that of the 60°~0° fracture model. This is because when the change values of pore fluid pressure are the same, the change rate of aperture of 30° fracture is greater than that of 0° fracture. Therefore, the pore fluid pressure progressively increases, and the component of permeability tensor kxx of the 30° fractures changes from the component of less than 0° to that of greater than 0° (Fig. 11). The same phenomenon also occurs to the models at 90°~10° and 90°~30°, for the same reasons as above.
Based on the above experimental results, at the same time, combined with the new pressure sensitivity equation, the calculation equation of the fracture opening change rate (the opening change produced by the fracture system under the condition of unit pore fluid pressure change) can be obtained as:
Therefore, the calculation results of the rate of change of crack opening at different angles are shown in Table 2:
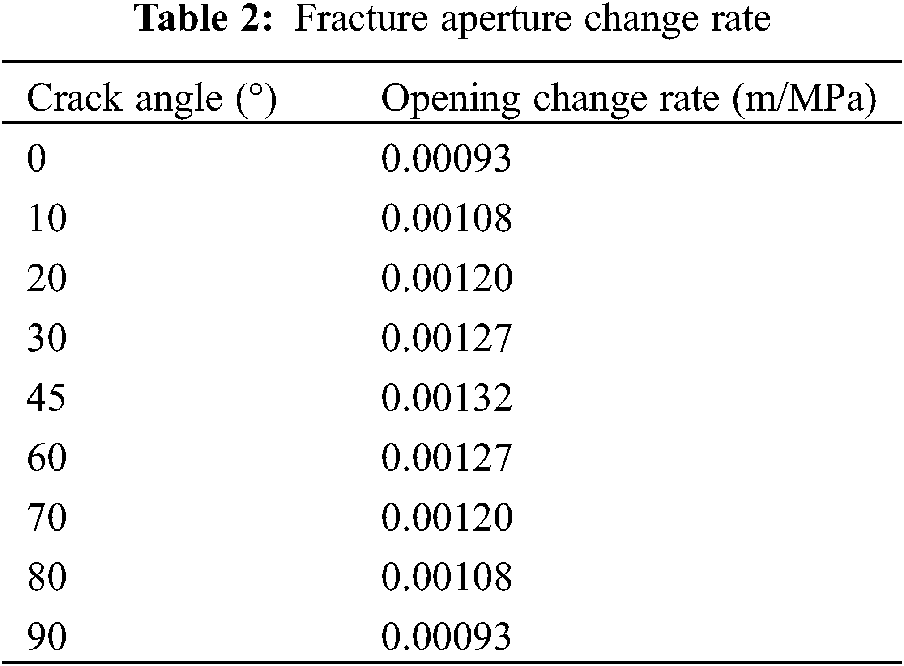
It can be concluded that under the constant volume boundary condition, the fracture aperture change rate is different with different dip angles and azimuth angles.
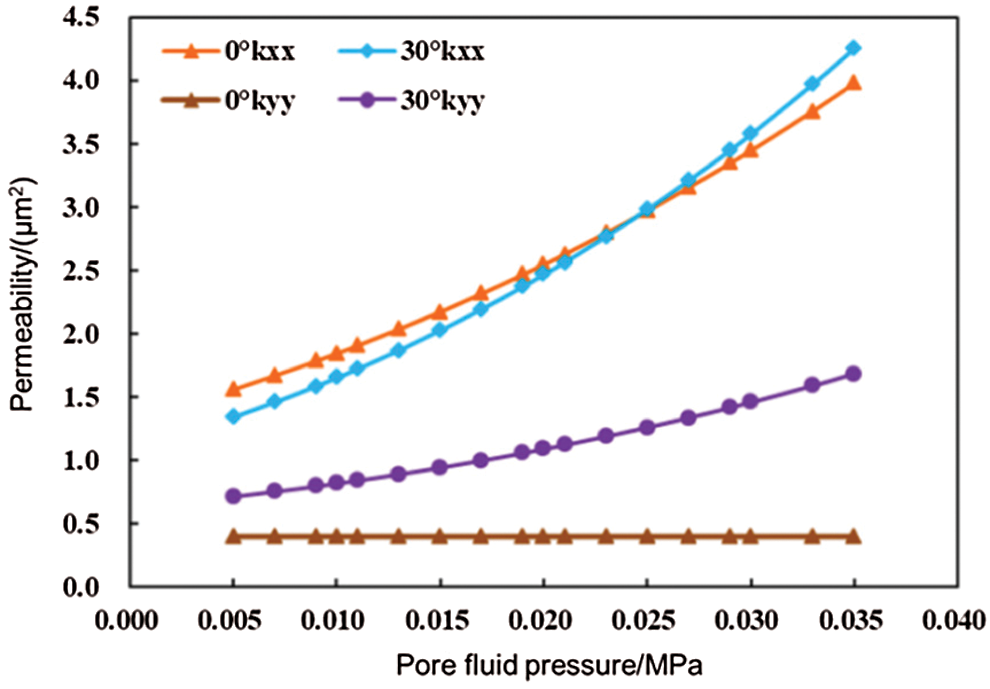
Figure 11: Variation curves of permeability tensor component when the fractures are set to 0° and 30°
(2) Principle value direction of maximum permeability
When two groups of fractures develop simultaneously in a seepage medium, under the joint action of the two groups of fractures, the long axis of the permeability tensor ellipse is always inclined to the development direction of the group of fractures with higher permeability. When the permeability values of two groups of fractures are the same, the principal direction of maximum permeability is located at the angular bisector for the included angle between the two groups of fractures (Fig. 12).
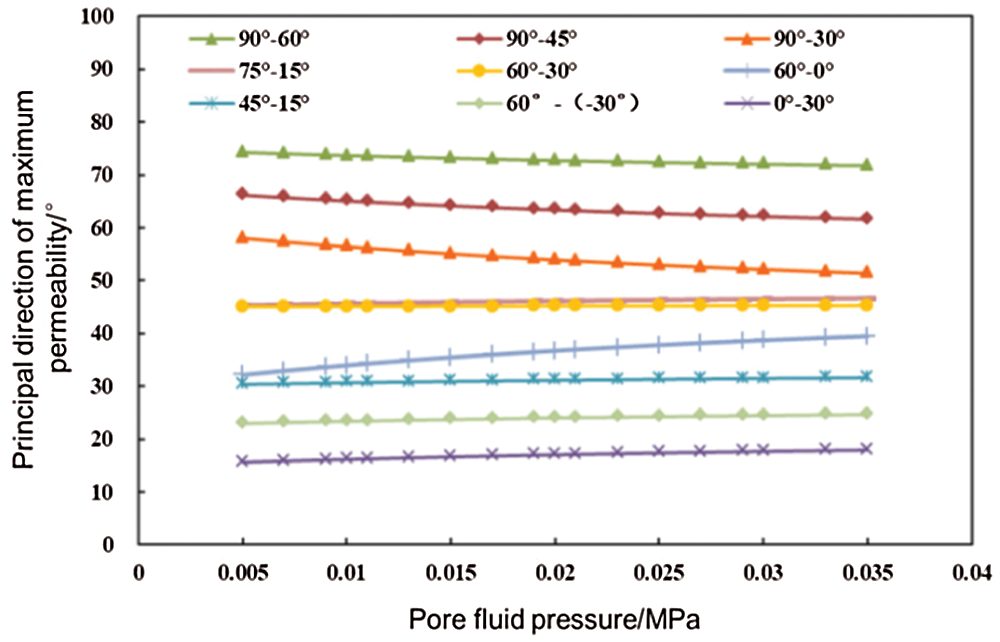
Figure 12: Variation curve of the principal value direction of the maximum permeability with pore fluid pressure
5 Fracture Network Anisotropic Permeability
Based on physical simulation and seepage theory analysis, numerous factors can affect the anisotropic permeability tensor. In this section, the single-factor analysis method was adopted to study the variation laws on permeability tensor of the seepage media involving two groups of fractures employing MATLAB software.
(1) Symmetrically distributed fractures
As shown in Fig. 7I, the model for when two groups of fractures are symmetrically distributed in the direction of the main streamline at the injection and production end was taken as an example. The matrix was isotropic, and the variation laws on the full tensor permeability field for the seepage medium were obtained according to the superposition principle described above.
Fig. 13 shows the variation rule of the principal value and direction of permeability when the pressure gradient was 0.01 MPa/m. As shown in the figure, when two groups of fractures are symmetrically distributed, the long-axis direction of the permeability tensor ellipse was always parallel to the x-axis. When the average pore fluid pressure changes, the length of the long axis of the permeability tensor ellipse will also change in the same direction (Fig. 13a), but the direction of the principal value remains unchanged (Fig. 13b).

Figure 13: Variation in the principal value of permeability when two groups of fractures are symmetrically distributed (a) Principal value of permeability (b) Principal value direction of permeability
(2) Orthogonal distributed fractures
Taking the model for the orthogonal distribution of fractures in Fig. 7c as an example, Fig. 14 shows the variation rule of the principal value and direction of permeability when the pressure gradient is 0.01 MPa/m. As is shown in the figure, when two groups of fractures are distributed in an orthogonal manner, the long axis and the short axis of the permeability tensor ellipse are the same length, seepage medium isotropic. However, with an increase in pore fluid pressure, the principal value for permeability increases, and the permeability of the seepage medium increases.

Figure 14: Principal permeability value when two group of fractures are orthogonally distributed
(3) Asymmetric and non-orthogonally distributed fractures
Taking the fracture model shown in Fig. 7a as an example, Fig. 15 shows the variation curve of the principal value of permeability with pore fluid pressure when the pressure gradient was 0.01 MPa/m. The figure shows that the length of the long axis of the permeability tensor ellipse changes with the change of the average pore fluid pressure in the same direction (Fig. 15a). And the principal value direction of permeability rotates by 2.04° (Fig. 15b). This is due to the different deformation rates of the two groups of fractures.

Figure 15: Variation in the principal values of permeability when the two groups of fractures are obliquely distributed (a) Principal value of permeability (b) Principal direction of permeability
Taking the fracture distribution pattern shown in Fig. 7f as an example, research was conducted on the variation laws of the permeability tensor under the conditions of equal and unequal fracture spacing, respectively.
(1) Equal fracture spacings
In the model, the angles of the two groups of fractures were 45° and 15°, respectively; the fracture spacing was 20 mm, and the number of fractures in the two groups were also different. Fig. 14 shows the variation rule of the principal value and direction of permeability when the pressure gradient is 0.01 MPa/m. The length of the long axis of the permeability tensor ellipse changes with the change of the average pore fluid pressure in the same direction (Fig. 16a), and the permeability of the media increases as well. Furthermore, the principal value direction also deflects, the initial value of β is 30.37° (0.005 MPa). When the average pore fluid pressure increases from 0.005 to 0.030 MPa, β changes to 31.50° after the principal value direction of permeability is rotated by 1.13° (Fig. 16b).
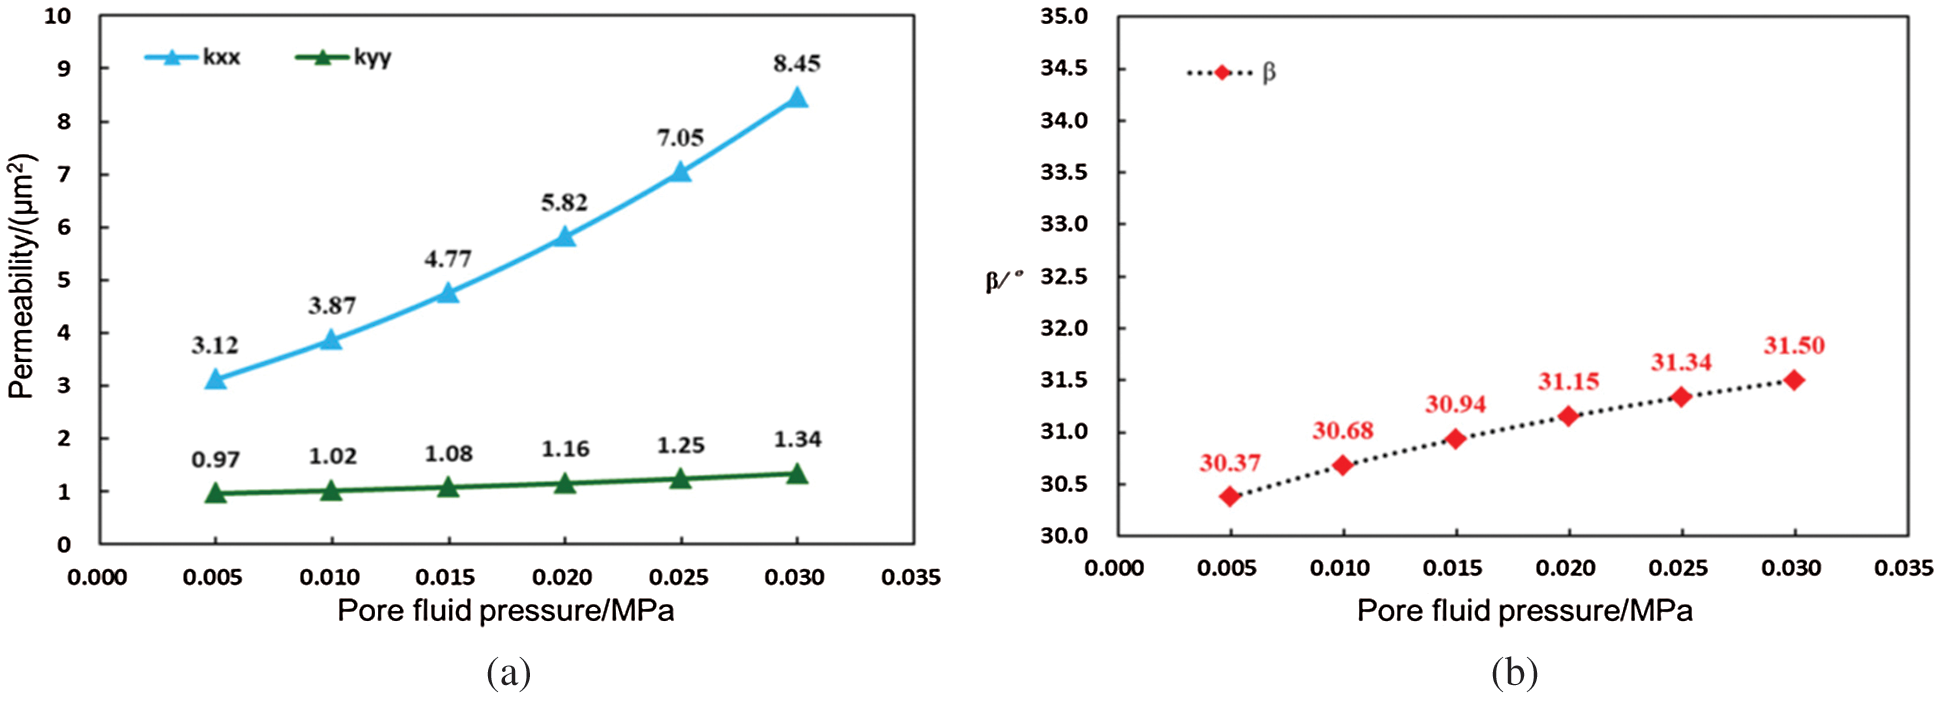
Figure 16: Variation in the principal value of permeability for two groups of fractures with equal spacing (a) Principal value of permeability (b) Principal direction of permeability
(2) Unequal fracture spacings with same number of fractures
The next model used two groups of fracture that had uneqal fracture spaces with the same number of fractures within each group, with the angles of the groups of fractures at 45° and 15°. As shown in Fig. 17, when the pressure gradient was 0.01 MPa/m, the length of the long axis of the permeability tensor ellipse changes with the change of the average pore fluid pressure in the same direction (Fig. 17a), the initial value of β is 30.03° (pore fluid pressure = 0.005 MPa) and final value of β is 30.13° (pore fluid pressure = 0.030 MPa) with a change of 0.1° (Fig. 17b). Thus, there is essentially no rotation.

Figure 17: Variation of principal value of permeability for two group of fractures with unequal spacing (the numbers of fractures are the same) (a) Principal value of permeability (b) Principal direction of permeability
(3) Unequal fracture spacings with varying number of fractures
Two contrast models were set: contrast model I consisting of two groups with a 45° fracture angle with a spacing of 10 mm and the second at 15° and 20 mm; contrast model II consisting of two groups with at 45° and 20 mm and the second at 15° and 10 mm spacing.

Figure 18: Variation in principal value of permeability for two groups of fractures with unequal spacing (a) Principal value of permeability (d45 < d15) (b) Principal direction of permeability (d45 < d15) (c) Principal value of permeability (d45 > d15) (d) Principal direction of permeability (d45 > d15)
The linear densities of the two groups of fractures in the model are different. As shown in Fig. 18 (where d15 and d45 in the figure denote the spacing of fractures at 15° and 45°, respectively), the principal value of permeability increases when the pressure gradient was 0.01 MPa/m with an increase of pore fluid pressure. Compared to Model I, the principal value direction of permeability rotates from 32.53° to 38.13°, and the principal value direction gradually approaches 45°. Compared to Model II, β goes from 28.51° to 24.79°, and the principal value direction gradually approaches 15°. This indicates that the direction of the principal value of the tensor always inclines towards fractures with higher fracture permeability.
According to the analysis results from the three cases above, when the numbers of fractures at different angles in the microelement are equal, the deformation rates between the two groups of fractures show a smaller difference, and the principal value direction for permeability of fractured media does not rotate easily. The degree of deformation of the fractures with equal spacing at different angles show a relatively significant difference, and the direction of the principal value of the tensor in fractured media rotates, but at a smaller angle. When the two groups of fractures are different in both spacing between the fractures and the number of fractures, the degree of deformation between the two sets of fractures shows a significant difference. The principal direction of permeability of the fractured media could easily be changed during the water injection process.
5.3 Effect of Fractures Elasticity Parameters on the Fractures Permeability Principal Values
Taking the fracture distribution pattern shown in Fig. 6d as an example, the variation laws of the permeability tensor of the two groups of fractures with the same and different elasticity modulus at varying angles were studied, respectively.
(1) Constant elasticity modulus
It was assumed that the elastic modulus values of the fractures at 60° and 30° were both 0.2 MPa, and the other parameters (spacing, number of fractures in a group) of the two groups of fractures were set the same. As is shown in Fig. 19, when the pressure gradient was 0.01 MPa/m, the length of the long axis of the permeability tensor ellipse changes with the change of the average pore fluid pressure in the same direction (Fig. 19a). The initial value of β is 45.08° (pore fluid pressure = 0.005 MPa) and final value of β is 45.3° (pore fluid pressure = 0.030 MPa) (Fig. 19b), essentially no rotation occurring.

Figure 19: Variation in the principal values of permeability for the two groups of fractures with the same elastic modulus (a) Principal value of permeability (b) Principal direction of permeability
(2) Varying elastic moduli
It was assumed that the elastic modulus of fractures at 60° was 0.5 MPa, and that of the fractures at 30° was 0.2 MPa. The other parameters for the two groups of fractures were kept constant. As shown in Fig. 20, when the pressure gradient was 0.01 MPa/m, the length of the long axis of the permeability tensor ellipse changes with the change of the average pore fluid pressure in the same direction (Fig. 20a), and the principal value direction rotates by 4.72° (Fig. 20b). The variation in the principal value direction is far greater than when the two groups of fractures have the same elastic modulus. This is because of the difference in elastic modulus, which influences the difference in the aperture variation between the two groups of fractures at different angles.

Figure 20: Two group of fractures permeability principal values with different elastic modulus (a) Principal value of permeability (b) Principal direction of permeability
Based on the research results, when the two groups of fractures have the same and different elastic moduli, the closer the elastic parameters, the closer the deformation degrees of the two groups of fractures. Furthermore, principal direction of fracture medium permeability tensor is less likely to rotate during the water-injection process.
For the first time, the fracture deformation mechanism of several groups of fractures is clarified by physical simulation of similar porous media based on fracture control. The main influencing factors of permeability tensor are analyzed. Then the following conclusions and understandings have been reached:
(1) Physical simulation experiments were conducted on the permeability of several groups of fractures in different directions at constant volumes. The 12 types of experimental models with different fracture angles were designed to study the seepage characteristics when two groups of pressure-sensitive fractures were included in the characteristic elements. Regarding the water-injection reservoir, during the early stage of water injection, pressure always prefers to propagate in the direction of fracture development. With the continued development of the fractures, the matrix surrounding fractures is gradually utilized. For different directions of fracture development, the areas affected by water injection vary, affecting the initial production capacity of a producing significantly. The directional pressure sensitivity effect of fractures can further influence such differences.
(2) When the two groups of fractures had different variation rates of fracture aperture changes in the fluid pressure resulted in relative magnitudes of fracture permeability changes. When the fluid pressure varies widely enough, the permeability of the fracture with small permeability and large aperture change rate under the initial condition will be greater than that of the fracture with large permeability and small aperture change rate under the initial condition. In the physical simulation experiment at a constant volume for multiple groups of fractures, when the pore fluid pressure was less than 0.025 MPa, the flow rate of the fracture models at 60°~30° was less than that at 60°~0°. However, when the pore fluid pressure exceeds 0.025 MPa, the liquid outflow at the outlet of the 60°~30° fracture model is greater than that of the 60°~0° fracture model. This is caused by the rate of change of permeability for fractures at 30° being much greater than that at 0°.
(3) When two groups of fractures simultaneously developed in the seepage medium, under the joint action of the two groups, when the fluid pressure changes, the long axis of the permeability tensor ellipse always tends to the direction of the development of the group of fractures with higher permeability. However, when the permeabilities of the two groups of fractures are the same, the long axis of the permeability tensor ellipse is located on the angular bisector of the angle between the two groups of fractures.
(4) When the two groups of fractures were symmetrically distributed along the direction of the linear connection between the injection end and the production end, the direction of the maximum principal value direction of permeability was always parallel to the direction of the linear connection between the injection end and the production end (the positive direction is from the injection end to the production end). When the fluid pressure changes, the fractured percolation medium will be deformed, which will lead to the change of the percolation ability of the medium, but the main direction of permeability will not change. When the two groups of fractures were distributed in an orthogonal manner, the maximum and minimum principal permeability values were equal, and the seepage media presented isotropic permeability. When the two groups of fractures were distributed obliquely, The magnitude of the principal value (the length of the permeability tensor ellipse) changes with the fluid pressure, and the direction of the value changes is the same. Due to different deformation rates of the two groups of fractures, the principal value direction of permeability rotated. During reservoir water injection, the principal value direction of permeability can change, leading to a change in the flow direction of the injected water.
(5) Under a constant volume boundary condition, when two groups of fractures in different directions have the same spacing, the principal value and direction of permeability changed with increased pore fluid pressure. When the two groups of fractures at different angles had different spacing with the same number of fractures in each group, with an increase in pore fluid pressure, the principal value of permeability increased, while the principal value direction remained unchanged.
(6) When the elastic moduli of two groups of fractures at different angles were constant, with the fluid pressure changes, the value size of the principal value has changed, while the principal value direction essentially remained constant. However, when the elastic moduli of two groups of fractures differed, the pore fluid pressure increasing, principal value of permeability increased, and the principal value rotated significantly. This indicated that different elastic moduli increased the difference in the aperture variation between two groups of fractures at different angles.
(7) The seepage law of fractured reservoir is complex. Moreover, with fracture directional stress-sensitive effect on permeability, the seepage law becomes more complicated. The direction of injected fluid flow through the reservoir is also more difficult to predict. The research of this thesis is helpful to analyze and control the flow direction and flow law of fluid in the percolation unit with multiple groups of fractures. The experimental method is innovative compared with the previous research. The law analysis is carried out from the principal value and principal value direction of permeability tensor, which is more scientific and clear. It can provide some theoretical support for efficient production and development of fractured reservoirs.
Funding Statement: This work is financially supported by the National Natural Science Foundation Project (No. 51374222), National Major Project (No. 2017ZX05032004-002), the National Key Basic Research & Development Program (No. 2015CB250905), CNPC’s Major Scientific and Technological Project (No. 2017E-0405), and SINOPEC Major Scientific Research Project (No. P18049-1).
Conflicts of Interest: The authors declare that they have no conflicts of interest to report regarding the present study.
1. Geertsma, J. (1957). The effect of fluid pressure decline on volumetric changes of porous rocks. Transactions of the AIME, 210(1), 331–340. DOI 10.2118/728-G. [Google Scholar] [CrossRef]
2. Hubert, B., Mining, U. L., Warpinski, N. R. (1993). Stress-induced permeability reduction in fissured reservoirs. Society of Petroleum Engineers, SPE Annual Technical Conference and Exhibition, SPE 26513. DOI 10.2118/26513-MS. [Google Scholar] [CrossRef]
3. Louis, C. (1974). Rock hydroulics. In: Muller, L. (Ed.Rock mechanics. SPE Annual Technical Conference and Exhibition, Houston, Texas. [Google Scholar]
4. Snow, D. T. (1968). Rock fracture spacings, openings, and porosities. ASCE Soil Mechanics and Foundation Division Journal, 94(1), 73–91. DOI 10.1061/JSFEAQ.0001097. [Google Scholar] [CrossRef]
5. Jones, F. O. (1975). A laboratory study of the effects of confining pressure on fracture flow and storage capacity in carbonate tocks. Journal of Petroleum Technology, 27(1), 21–27. DOI 10.2118/4569-PA. [Google Scholar] [CrossRef]
6. Gangi, A. (1978). Variation of whole and fractured porous rock permeability with confining pressure. International Journal of Rock Mechanics and Mining Sciences & Geomechanics Abstracts, 15(5), 249–257. DOI 10.1016/0148-9062(78)90957-9. [Google Scholar] [CrossRef]
7. Kranzz, R. L., Frankel, A. D., Engelder, T. (1976). The permeability of whole and jointed Barre granite. International Journal of Rock Mechanics and Mining Sciences, 16(4), 225–234. DOI 10.1016/0148-9062(79)91197-5. [Google Scholar] [CrossRef]
8. Walsh, J. B. (1981). Effect of pore pressure and confining pressure on fracture permeability. International Journal of Rock Mechanics and Mining Sciences & Geomechanics Abstracts, 18(5), 429–435. DOI 10.1016/0148-9062(81)90006-1. [Google Scholar] [CrossRef]
9. Gale, J. E. (1982). The effects of fracture type (indeed vs. natural) on the stress-fracture closure permeabity relationships. American Rock Mechanics Association. The 23rd U.S. Symposium on Rock Mechanics, Berkeley, California. [Google Scholar]
10. Barton, N., Bandis, S., Bakhta, K. (1985). Strength, deformationed conductivity coupling of rock joints. International Journal of Rock Mechanics & Mining Sciences & Geomechanics Abstracts, 22(3), 121–140. [Google Scholar]
11. Bernabe, Y. (1986). The effective pressure law for permeability in Chelmsford granite and Barre granite. International Journal of Rock Mechanics and Mining Sciences & Geomechanics Abstracts, 23(3), 267–275. DOI 10.1016/0148-9062(86)90972-1. [Google Scholar] [CrossRef]
12. McKee, C. R., Bumb, A. C., Koenig, R. A. (1988). Stress-dependent permeability and porosity of coal and other geologic formations. SPE Formation Evaluation, 3(1), 81–91. DOI 10.2118/12858-PA. [Google Scholar] [CrossRef]
13. Liu, X., Civan, F. (1995). Formation damage by fines migration including effects of filter cake, pore compressibility, and non-darcy flow–A modeling approach to scaling from core to field. Formation Damage During Improved Oil Recovery, 69–175. DOI 10.2118/28980-MS. [Google Scholar] [CrossRef]
14. Jiang, H. J., Yan, J. N. (2000). Experimental study on stress sensitivity of fractured reservoirs. Special Oil and Gas Reservoirs, 3, 39–41+46–53. [Google Scholar]
15. Qin, J. S. (2002). Variation of the permeability of the low-permeability sandstone reservoir under variable confined pressure. Journal of Xi, an Petroleum Institute (Natural Science Edition), 4, 28–31,35. [Google Scholar]
16. Wang, X. J., Zhao, Y. S., Wen, W., Chi, B., Sun, Y. (2003). Stress sensitivity and lower limit of productivity of low permeability reservoir. Oil & Gas Geology, 2, 162–166. [Google Scholar]
17. Liu, H. T., Zeng, L. B. (2004). Characteristics of Himalayan movement in Kuqa depression, Tarim Basin: Evidence from rock acoustic emission experiments. Geological Bulletin of China, 7, 676–679. [Google Scholar]
18. Zhang, H., Kang, Y. L., Chen, Y. J., You, L. J., Li, Q. G. et al. (2004). Influence of the rock composnents and fractures on tight sandstone stress sensitivity. Natural Gas Industry, 7, 55–57+136–137. [Google Scholar]
19. Yang, S. L., Xiao, X. J., Wang, X. Q., Yang, Q. L. (2005). Stree sensitivity of rock and its influence on productivity for gas reservoirs with abnormal high pressure. Natural Gas Industry, 5, 94–95+13. [Google Scholar]
20. Liang, L. X., Liu, X. J., Xu, Q., Li, M., Chen, H. F. (2006). Research of fractured reservoir stress sensitivity based on contacting theory. Special Oil and Gas Reservoirs, 4, 14–16+104. [Google Scholar]
21. Dai, J. S., Wang, B. F., Ma, Z. R. (2007). Research on cracking principles of brittle low-permeability sandstone. Xinjiang Petroleum Geology, 4, 393–395. [Google Scholar]
22. Yu, Z. L., Xiong, W., Gao, S. S., Liu, J. P. (2007). Stress sensitivity of tight reservoir and its influence on oilfield development. Acta Petrolei Sinica, 4, 95–98. [Google Scholar]
23. Sun, H. D., Han, Y. X., Xiao, X. J., Yang, J. P., Zhang, F. (2008). Numerical well test analysis of stress-sensitive fractured gas reservoirs. Acta Petrolei Sinica, 2, 270–273. [Google Scholar]
24. Luo, R. L., Feng, J. D., Tang, M. L., Xiao, X. J., Yang, J. P. (2008). Probe into evaluation methods for stress sensitivity of low permeability reservoirs. Journal of Southwest Petroleum University (Science & Technology Edition), 5, 161–164+2. [Google Scholar]
25. Du, X. L., Kang, Y. L., You, L. J., Yang, B., Li, J. M. et al. (2010). Controlling factors of stress sensitivity of low permeability reservoirs. Natural Gas Geoscience, 2, 295–299. [Google Scholar]
26. Ji, Z. Z., Dai, J. S., Wang, B. F. (2010). Quantitative relationship between crustal stress and parameters of tectonic fracture. Acta Petrolei Sinica, 1, 68–72. [Google Scholar]
27. Zhu, W. P., Guo, D. L., Zeng, X. H., Zhu, K., Peng, S. T. (2010). Impact of coal-bed stress sensitivity on CBM output prediction. Coal Geology of China, 4, 28–30+64. [Google Scholar]
28. Feng, J. W., Dai, J. S., Ma, Z. R., Zhang, Y. J., Wang, Z. K. (2011). The theoretical model between fracture parameters and stress field of low-permeability sandstones. Acta Petrolei Sinica, 4, 664–671. [Google Scholar]
29. Chen, J. H., Kang, Y. L., You, L. J., Fang, J. W. (2011). Review and prospect about study on stress-sensitivity of low-permeability reservoir. Natural Gas Geoscience, 1, 182–189. [Google Scholar]
30. Zhao, L., Chen, Y. F., Ning, Z. F., Fan, Z. F., Wu, X. L. et al. (2013). Stress sensitivity experiments for abnormally overpressure carbonate reservoirs: A case from the Kenkiyak low-permeability fractured-porous oilfield in the littoral Caspian Basin. Petroleum Exploration and Development, 2, 194–200. [Google Scholar]
31. Wang, K., Dai, J. S., Zhang, H. G., Zhang, D. D., Zhao, L. B. (2014). Numerical simulation of stress sensitivity of fractured reservoir: a case study of Keshen gas field in Kuqa depression. Acta Petrolei Sinica, 1, 123–133. [Google Scholar]
32. Wu, J. L., Liu, Y. T., Luo, J. (2014). Numerical simulation of fluid-structure interaction in fractured stress-sensitive reservoir. Chinese Journal of Computational Physics, 4, 455–464. [Google Scholar]
33. Feng, Y. L., Liu, Y. T., Ding, Z. P., Chen, J., Mao, X. L. et al. (2018). Deformation characteristics of a set of parallel fractures and dynamic permeability model. Fault-Block Oil & Gas Field, 25(6), 736–741. [Google Scholar]
34. Chen, A. (2020). The efficient finite element methods for time-fractional oldroyd-B fluid model involving two caputo derivatives. Computer Modeling in Engineering & Sciences, 125(1), 173–195. DOI 10.32604/cmes.2020.011871. [Google Scholar] [CrossRef]
35. Abdo, M. S., Panchal, S. K. (2019). Fractional integro-differential equations involving ψ-Hilfer fractional derivative. Advances in Applied Mathematics and Mechanics, 11(1), 1–22. DOI 10.4208/aamm.OA-2018-0143. [Google Scholar] [CrossRef]
36. Yang, X. J. (2019). General fractional derivatives: Theory, methods and applications. Boca Raton, Florida, USA: CRC Press. [Google Scholar]
37. Ismail, F., Qayyum, M., Inayat, S. (2020). Fractional analysis of thin film flow of non-Newtonian fluid. Computer Modeling in Engineering & Sciences, 124(3), 825–845. DOI 10.32604/cmes.2020.011073. [Google Scholar] [CrossRef]
38. Taha, M. H., Ramadan, M. A., Baleanu, D., Moatimid, G. M. (2020). A novel analytical technique of the fractional Bagley-Torvik equations for motion of a rigid plate in Newtonian fluids. Computer Modeling in Engineering & Sciences, 124(3), 969–983. DOI 10.32604/cmes.2020.010942. [Google Scholar] [CrossRef]
 | This work is licensed under a Creative Commons Attribution 4.0 International License, which permits unrestricted use, distribution, and reproduction in any medium, provided the original work is properly cited. |