| Fluid Dynamics & Materials Processing |
DOI: 10.32604/fdmp.2022.019609
ARTICLE
Simulation of Rock Complex Resistivity Using an Inversion Method
1School of Resources and Geosciences, China University of Mining and Technology, Xuzhou, 221116, China
2Faculty of Mechanical Engineering, Opole University of Technology, Opole, 45-758, Poland
3Key Laboratory of Coal Resources Exploration and Comprehensive Utilization, Ministry of Natural Resources, Xi’an, 710021, China
*Corresponding Author: Benyu Su. Email: subenyu@cumt.edu.cn
Received: 01 October 2021; Accepted: 15 November 2021
Abstract: The complex resistivity of coal and related rocks contains abundant physical property information, which can be indirectly used to study the lithology and microstructure of these materials. These aspects are closely related to the fluids inside the considered coal rocks, such as gas, water and coalbed methane. In the present analysis, considering different lithological structures, and using the Cole-Cole model, a forward simulation method is used to study different physical parameters such as the zero-frequency resistivity, the polarizability, the relaxation time, and the frequency correlation coefficient. Moreover, using a least square technique, a complex resistivity “inversion” algorithm is written. The comparison of the initial model parameters and those obtained after inversion is used to verify the stability and accuracy of such approach. The method is finally applied to primary-structure coal considered as the experimental sample for complex resistivity measurements.
Keywords: Complex resistivity; zero frequency resistivity; polarizability; frequency correlation coefficient; relaxation time; inversion fitting; least square method
Nomenclature
| ρ0 | Zero-frequency resistivity |
| m | Polarizability |
| τ | Relaxation time |
| c | Frequency correlation coefficient |
Nowadays, coal resources are still the world main energy source. However, with the continuous increase in mining depth, the problem of geological disasters in production is becoming more and more serious. Among them, coal and gas outburst accidents are called the “number one killer” of coal mine safety production, which seriously restricts coal mines security [1]. The complex resistivity method is an emerging electrical exploration technology, which uses the induced polarization effect of the rock under the excitation of an external electric field to achieve the purpose of geophysical exploration [2]. The most important significance is that the complex resistivity parameters are closely related to the lithology and micro-fracture structure of the rock. Therefore, the complex resistivity method is widely used in the evaluation of fluids in rock micro-fractures, such as soil pollutant monitoring [3–7], groundwater remediation Monitoring [8], and bacterial activity monitoring [9], etc., show the broad application prospects of the complex resistivity method. In recent years, many researchers have used complex resistivity to study the electrical characteristics of coal and rock, and analyzed the relationship between complex resistivity characteristics and parameters, gas content and coalbed methane content [10–12].
Pelton et al. proposed the Cole-Cole model, and proposed that different minerals can be distinguished by induced polarization effects at multiple frequencies, and then ex-tended it to the second-order Cole-Cole model to describe the low-frequency information of electromagnetic induction [13]. Then Zhu et al. studied the Cole-Cole model’s ex-tended model Dias model, combined with the damped least square method and the Monte Carlo method based simulated annealing method to reduce the uncertainty of the solution [14]. The research of Ke shizhen believes that the dispersion phenomenon of complex resistance is mainly caused by the polarization of the medium, and improved the Cole-Cole model to include multiple polarization points, and proposed a new interpretation method [15]. Fan focused on the relationship between rock polarizability and current size, cation exchange capacity, salinity of saturated solution, membrane potential and rock particle size under laboratory conditions [16]. Jiang et al. deduced the induced polarization potential response equation, gave a theoretical model of induced polarization potential, and proposed a model and interpretation method for quantitatively solving oil saturation and formation water resistivity [17]. Yin et al. studied the mechanism of rock dispersion and demonstrated that the rate-frequency dispersion char-acteristics of rock complex resistivity are affected by measurement frequency, properties of pore fluids, electrochemical properties of the surface of framework particles, and clay content [18]. Guo et al. conducted testing and research on four types of structural coals with different metamorphic degrees, and the results showed that: with the increasing frequency, the complex resistivity modulus of different metamorphic coals showed a decreasing trend, and the complex resistivity modulus at the low frequency stage showed obvious all directions [19]. The opposite sex, the reason for this is related to the length of time that the polarizable dielectric in the coal is polarized [20].
In this paper, a forward modeling study of Cole-Cole is carried out to study the difference in induced polarization properties of coal and rock, which is reflected in the model parameters ρ0, m, τ, c and the real part and imaginary part calculated from them. Change the values of different parameters of the model to study the changes of the spectrum curve. In the inversion process, amplitude individual inversion, phase individual inversion, and amplitude and phase combined inversion were carried out respectively. The effect of joint inversion is better than that of individual inversion.
2 Forward Simulation of Complex Resistivity Model
Pelton et al. [13] analyzed and summarized the data through a large number of rock and ore sample experiments and field exploration experiments, and finally obtained the complex resistivity spectrum expression of the excitation effect of rock and ore in the frequency domain:
Charge rate (polarizability) m, a parameter describing the strength of the polarization effect of the rock (ore); zero-frequency impedance ρ0 is the resistivity in a DC electric field; relaxation time τ, describing the amount of delay in the process of induced polarization, unit: s; frequency correlation coefficient c, dimensionless, indicating the shape of the attenuation curve, related to the size of the particles, and the value range is 0 < c < 1. The effects of different parameters on the complex resistivity of rocks are studied separately.
2.1 Zero Frequency Resistivity
As shown in Figs. 1 and 2, when the parameters m = 0.25, τ = 0.2 s, c = 0.5 remain unchanged; change ρ0 from 1ohm-m to 100000ohm-m.
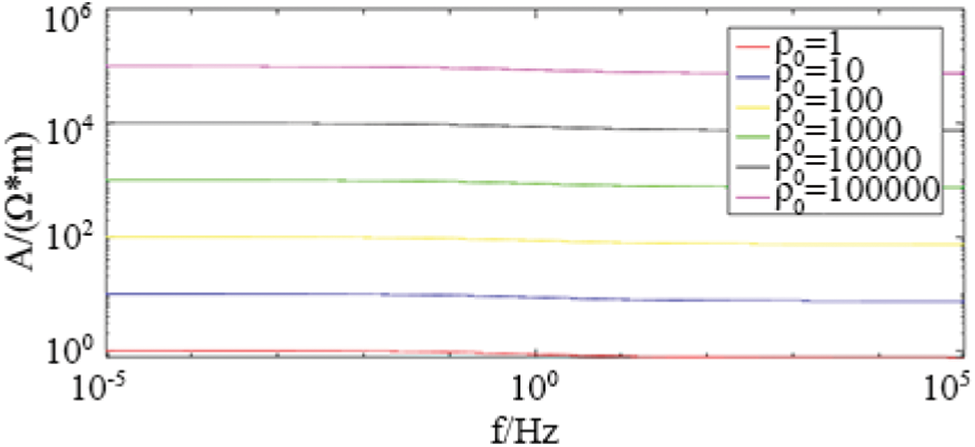
Figure 1: The influence of zero frequency resistivity ρ0 on amplitude in Cole-Cole model
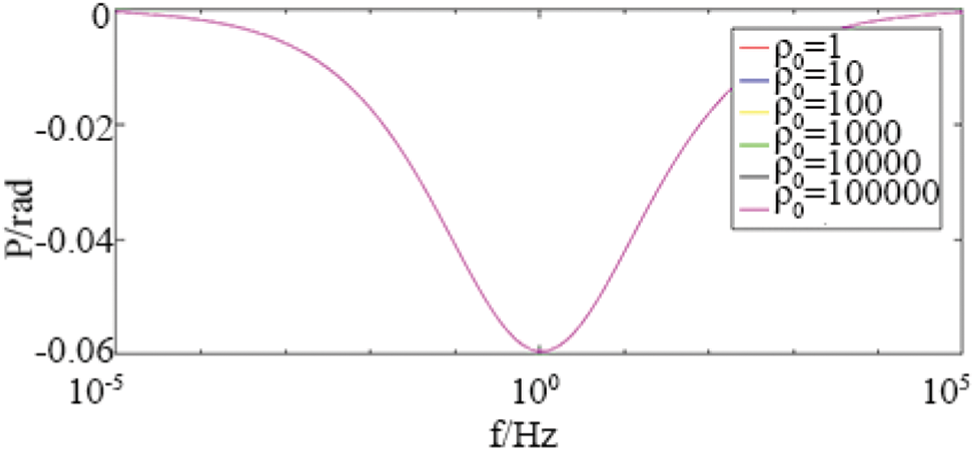
Figure 2: The influence of zero frequency resistivity ρ0 on phase in Cole-Cole model
As shown in Figs. 3 and 4, the parameter ρ0 = 100ohm-m, τ = 0.2 s, c = 0.5 unchanged; change m from 0.001 to 0.85.
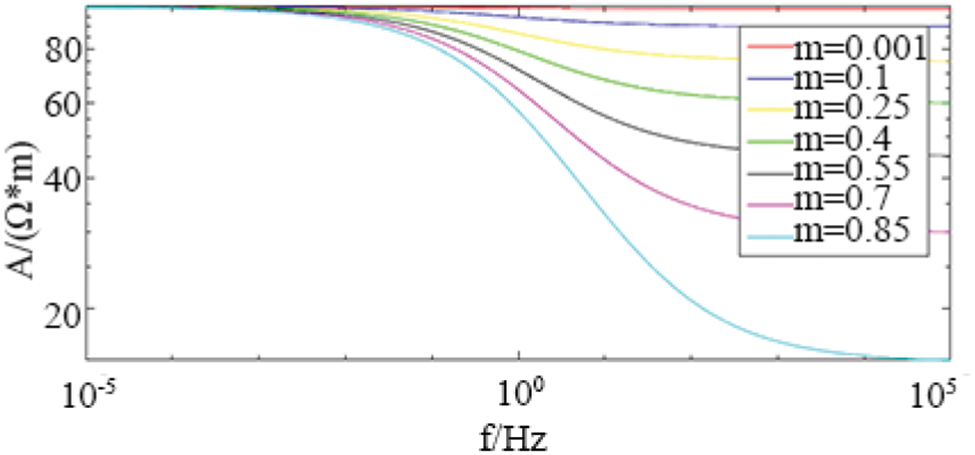
Figure 3: The influence of the polarizability m on the amplitude in the Cole-Cole model
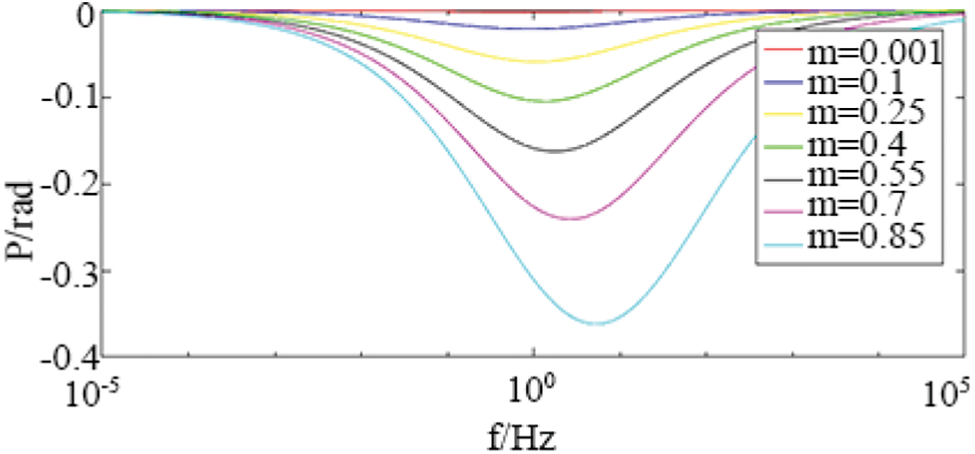
Figure 4: The influence of the polarizability m on the phase in the Cole-Cole model
Judging from the amplitude and phase curves, under different polarizability m, the amplitude approaches different values at high frequencies, and approaches the same value at low frequencies. The minimum value of the phase also changes with the polarizability. As m decreases, the approach value of the amplitude decreases at high frequencies, and the approach value decreases faster at high frequencies; the absolute value of the minimum phase value also decreases, which corresponds to, At the same time, the frequency gradually decreases.
As shown in Figs. 5 and 6, when the parameters ρ0 = 100ohm-m, m = 0.25, c = 0.5 remain unchanged; change τ from 0.002 to 2000.
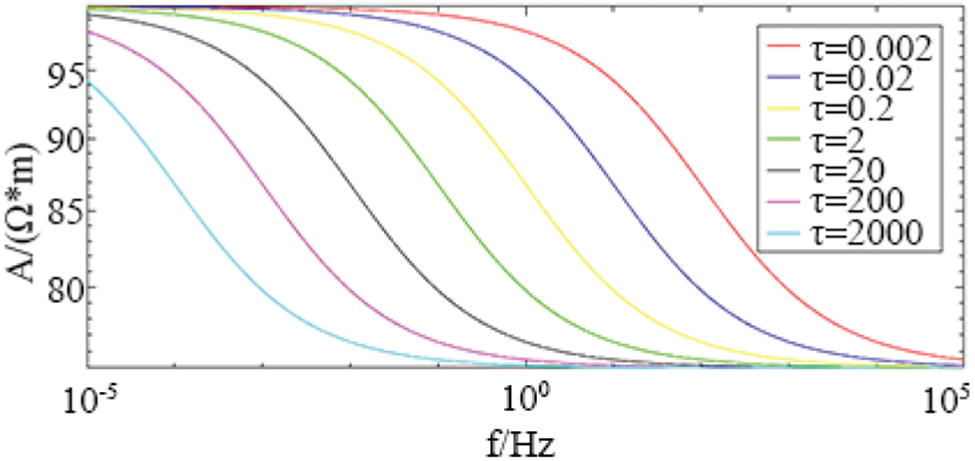
Figure 5: The influence of relaxation time τ on amplitude in Cole-Cole model
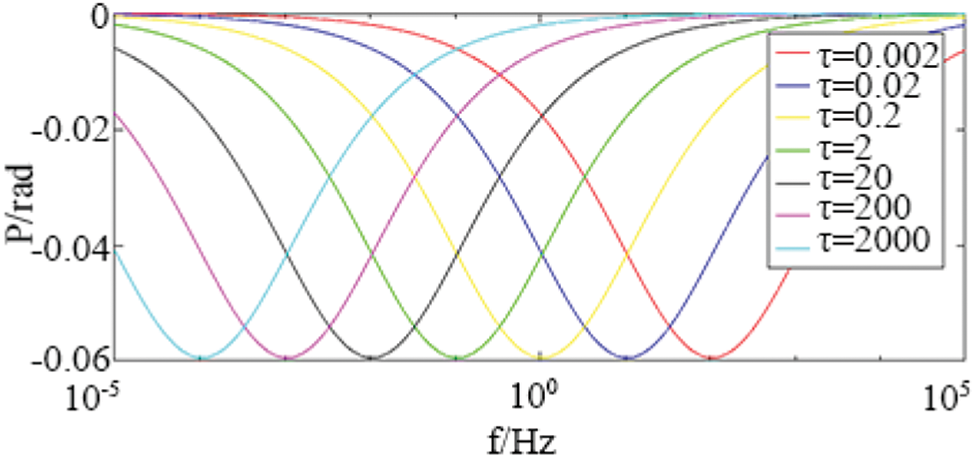
Figure 6: The influence of relaxation time τ on phase in Cole-Cole model
Judging from the amplitude and phase curves, under different relaxation times τ, the shapes of the amplitude and phase curves are basically the same. With the increase of τ, both the amplitude curve and the phase curve shift from high frequency to low frequency. Therefore, the change of τ mainly affects the position of the amplitude and phase curve, and does not affect its shape.
2.4 The Frequency Correlation Coefficient
As shown in Figs. 7 and 8. When the parameters ρ0 = 100ohm-m, m = 0.25, τ = 0.2 s remain unchanged; change c = 0.1 to 0.7.
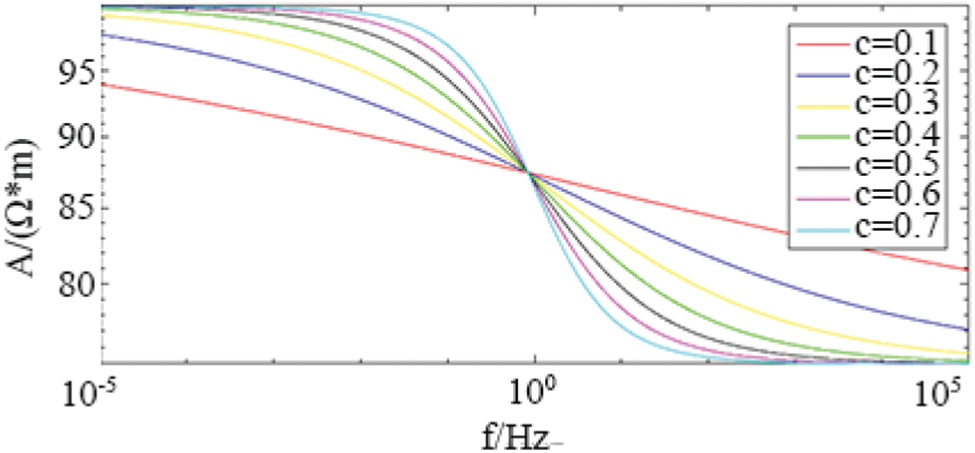
Figure 7: The influence of frequency correlation coefficient c on amplitude in Cole-Cole model
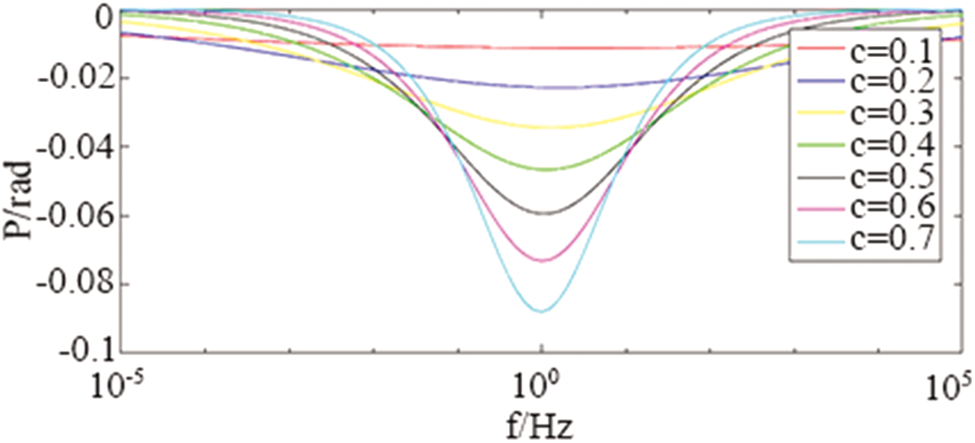
Figure 8: The influence of the frequency correlation coefficient c on the phase in Cole-Cole model
Judging from the amplitude and phase curves, under different frequency correlation coefficients c, the shape of the amplitude curves changes, but roughly intersects at f = 1 Hz; the minimum value of the phase also changes. As c decreases, the amplitude value decreases more slowly; the absolute value of the minimum value of the phase decreases continuously, and the corresponding frequency gradually increases.
The forward simulation results show that the zero-frequency resistivity affects the magnitude of the complex resistivity amplitude, but has no effect on its shape and does not affect the phase curve; the polarizability mainly affects the amplitude trend value and the phase minimum value; the relaxation time mainly affects the phase minimum value corresponds to the frequency level; the frequency correlation coefficient mainly affects the speed of amplitude attenuation and the size and position of the phase minimum value; the polarization volume percentage coefficient mainly affects the size and position of the phase minimum value, and also affects the amplitude curve The position and shape of the electrochemical parameters; the electrochemical parameters mainly affect the amplitude of the low frequency band and the shape of the phase spectrum. When the electrochemical parameters are less than 1, the phase is the minimum value of the bipolar value.
3 Inversion of Rock and Ore Complex Resistivity
The least square method (also known as the least square method) is a mathematical optimization technique. It finds the best function match of the data by minimizing the sum of squares of errors. In this paper, the damped least squares method is selected for inversion. The method was proposed by Marquardt in 1963 [21]. He perfected it on the basis of K. Levenbevg, adding the steepest descent method and the linearization method (Taylor series) comprehensive.
Among them:
Given the initial model mk, calculate the model modification
3.1 Examples of Theoretical Model Inversion
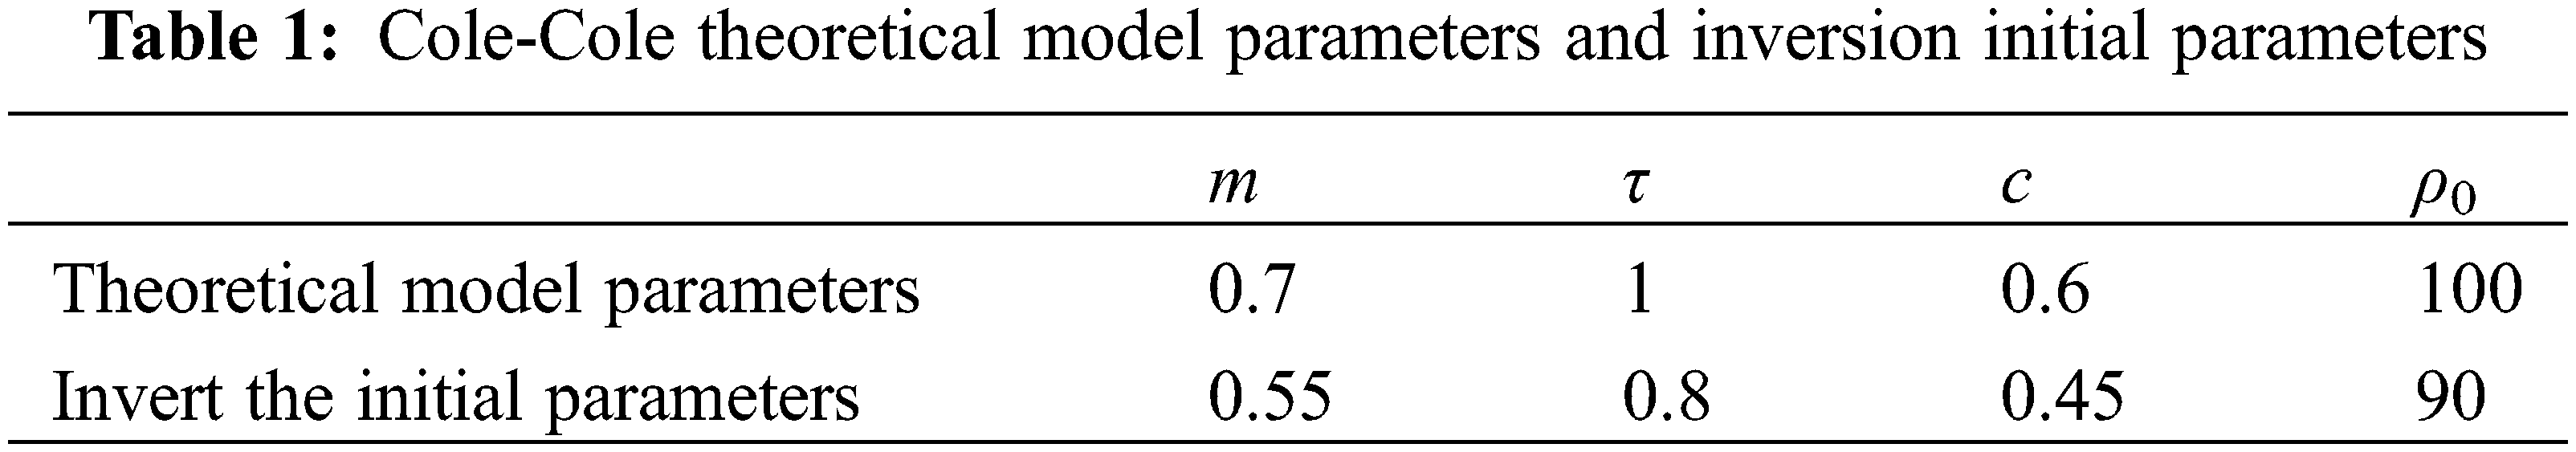
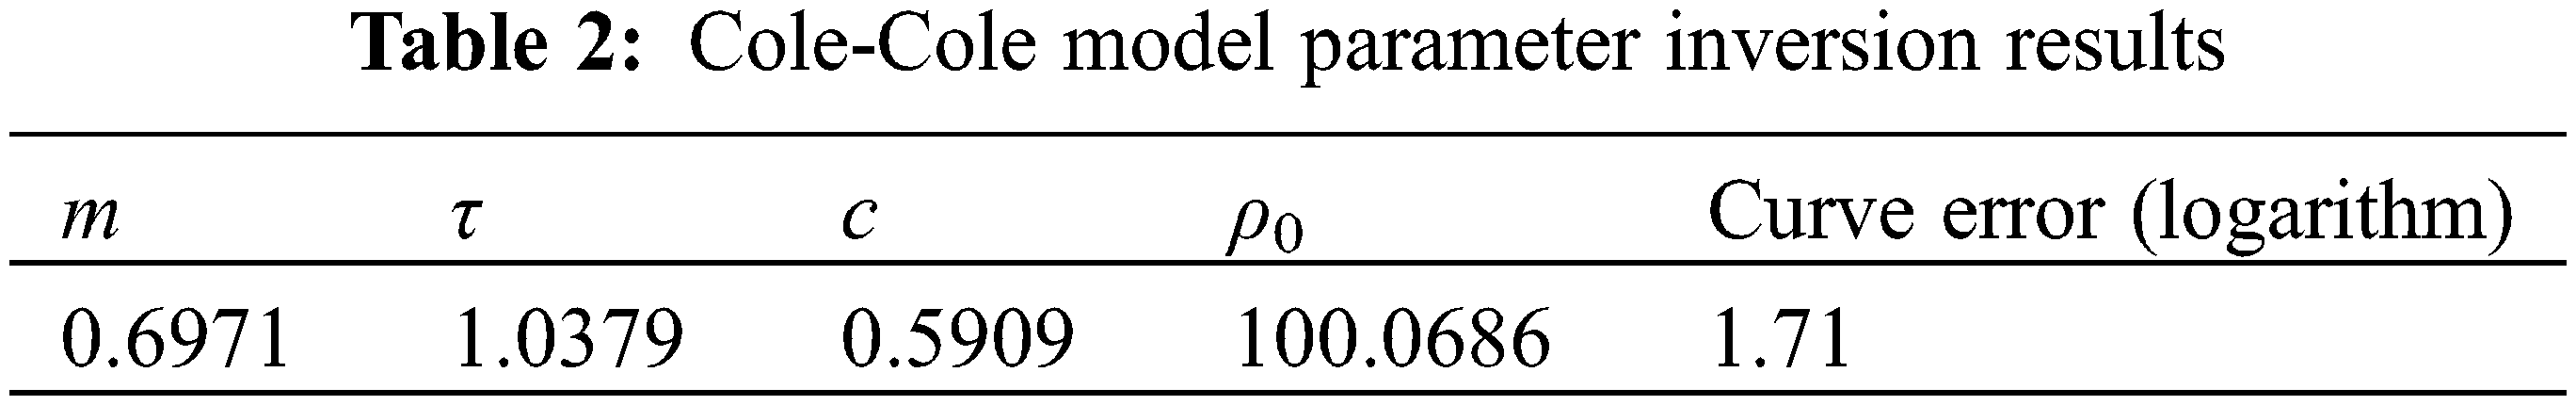
Table 1 shows the theoretical model parameters and inversion initial parameters of the Cole-Cole model. Fig. 9 is the spectrum curve obtained from the inversion. The theoretical model has been inverted 30 times, and the parameters and curve deviations obtained from the inversion are shown in Table 2.
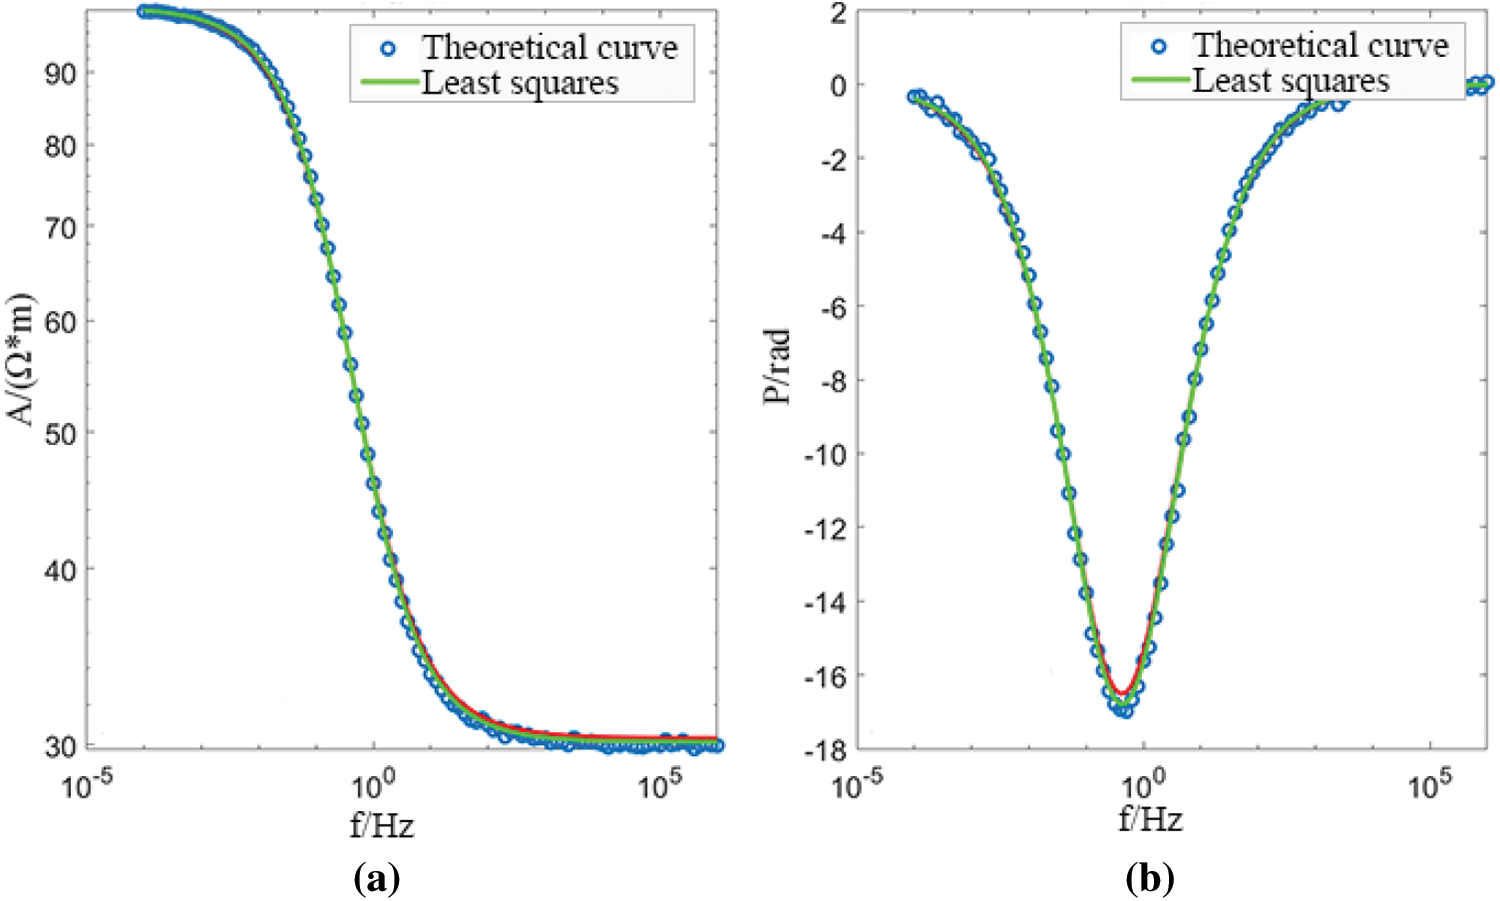
Figure 9: Cole-Cole model parameter inversion results (a) amplitude (b) phase
For the Cole-Cole model, the least squares method can inversely produce better results; from Fig. 9, it can be seen that the Cole-Cole model can better fit the original curve and meet the requirements. This time, random noise is added to the forward data as the original data for inversion, the influence of electromagnetic induction in the actual measurement is not considered, but this is objective. In the actual measured data, it is necessary to combine the characteristics of the data itself and select the appropriate frequency band for comprehensive inversion.
4 Inversion and Fitting of Spectrum Curve of Measured Specimen
4.1 Introduction of Experimental Specimens
The test specimens for the complex resistivity measurement of rock ores and tectonic coal include 1 type of primary tectonic coal. The complex resistivity spectrum curve is shown in the figure below, as shown in Fig. 10.
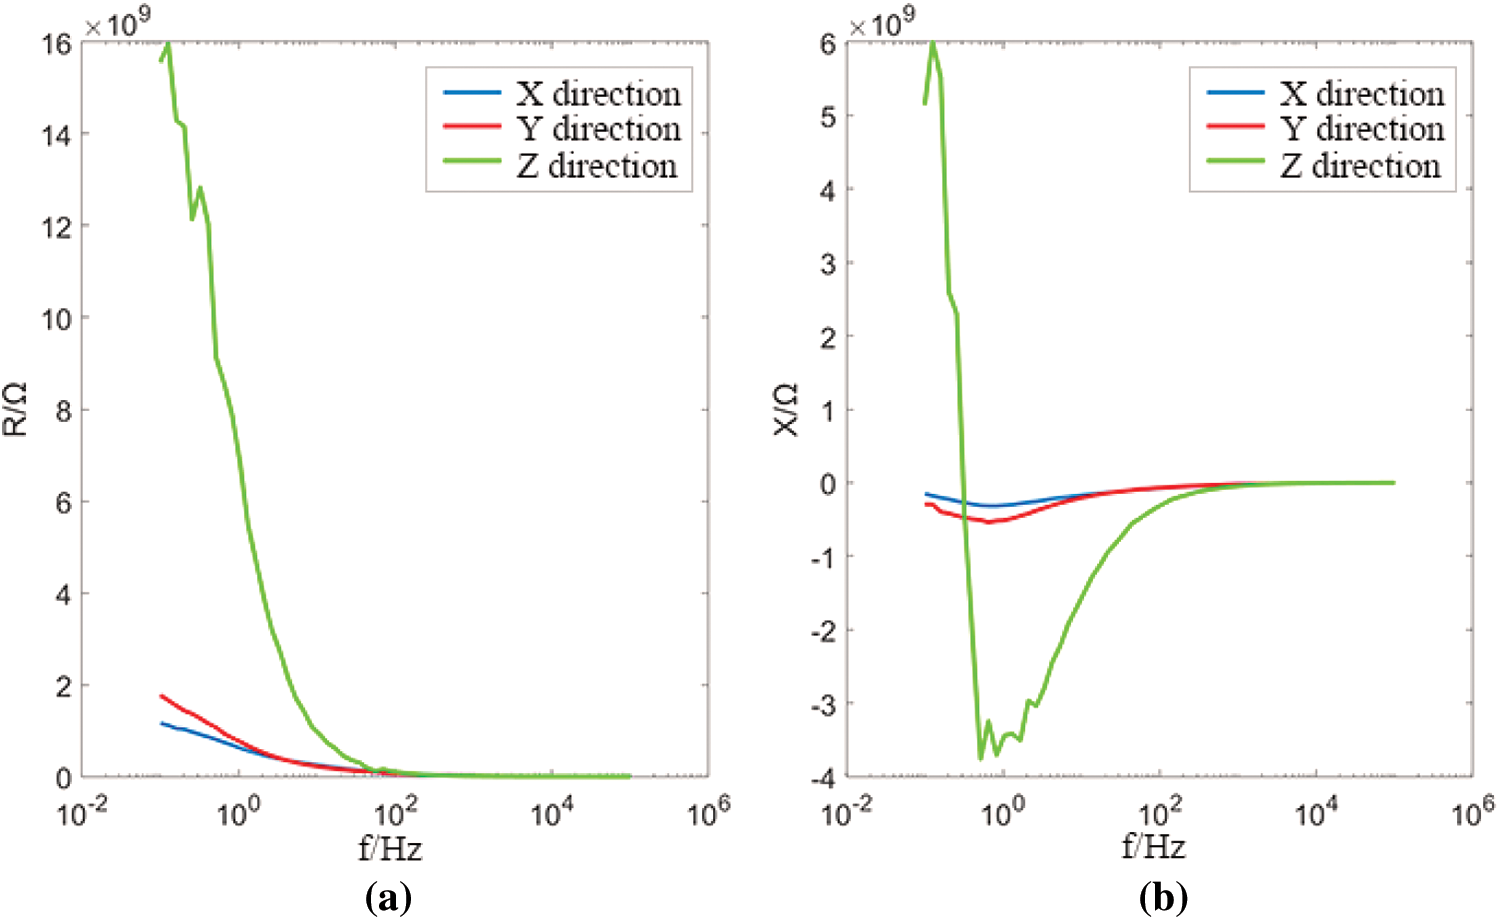
Figure 10: Complex resistivity spectrum curve of primary structure coal (a) real part (b) imaginary part
4.2.1 Primary Structure Coal as shown in Table 3
It can be seen from the fitting results that the Cole-Cole model can fit better for the X and Y directions of the primary structure coal, as shown in Figs. 11 and 12, respectively. for the Z direction as shown in Fig. 13, the fitting effect is better in the high frequency range, and in the low frequency range, due to the virtual the sudden change of the partial curve results in poor fitting effect. In general, the Cole-Cole model can fit the complex resistivity spectrum curve of structured coal well.
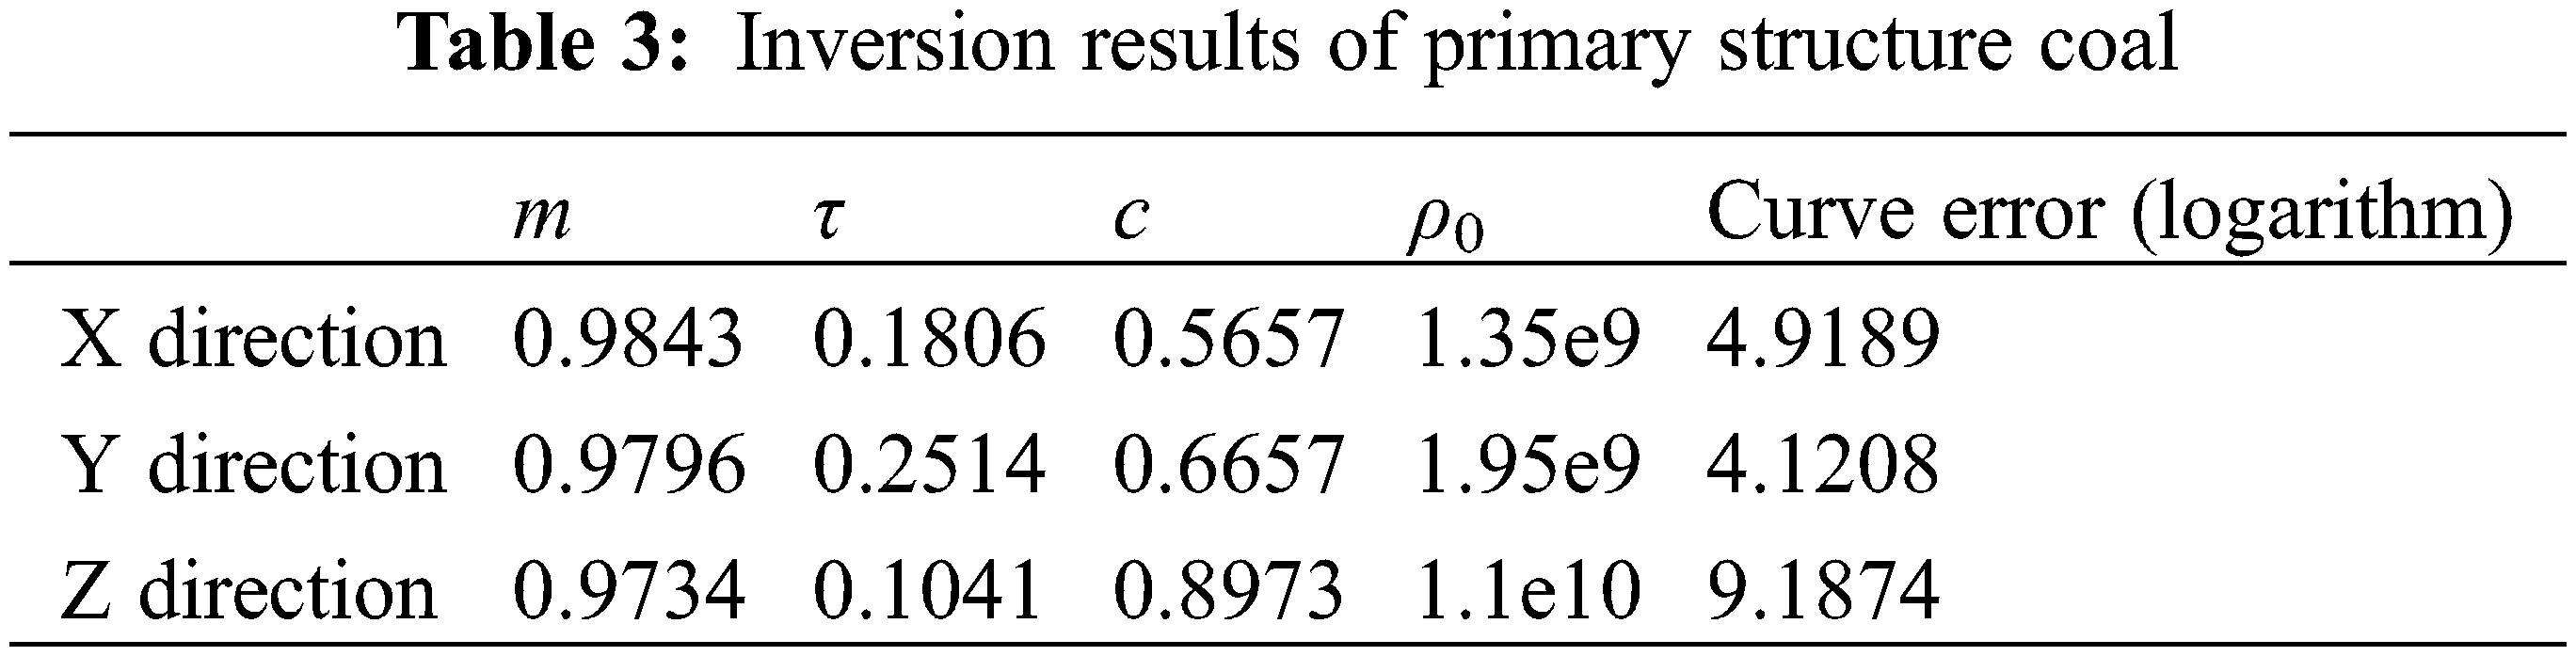
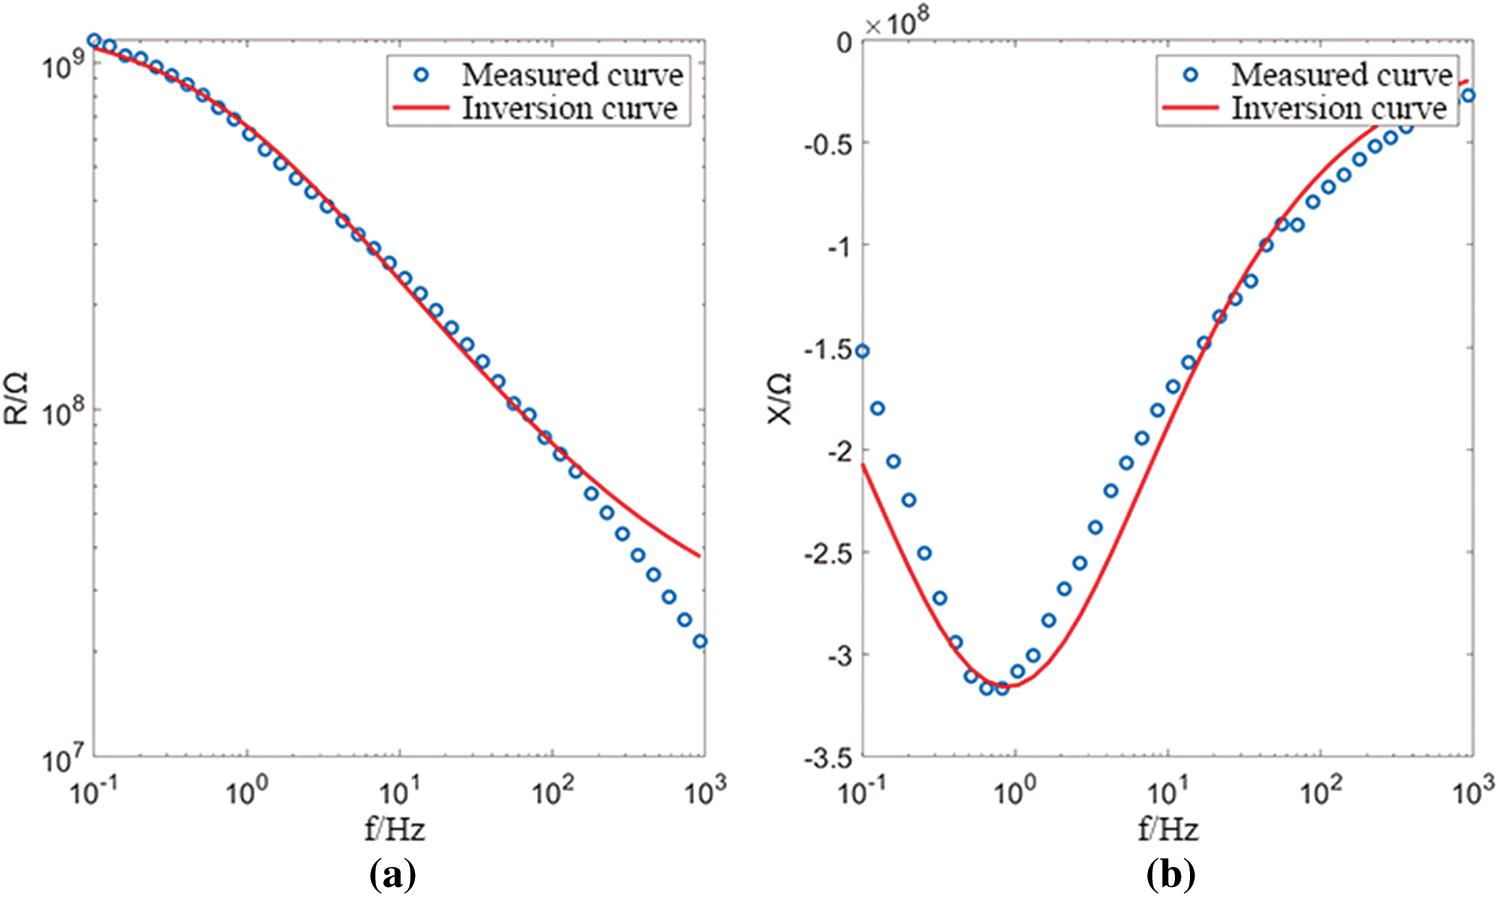
Figure 11: X direction fitting diagram of primary structure coal (a) real part (b) imaginary part
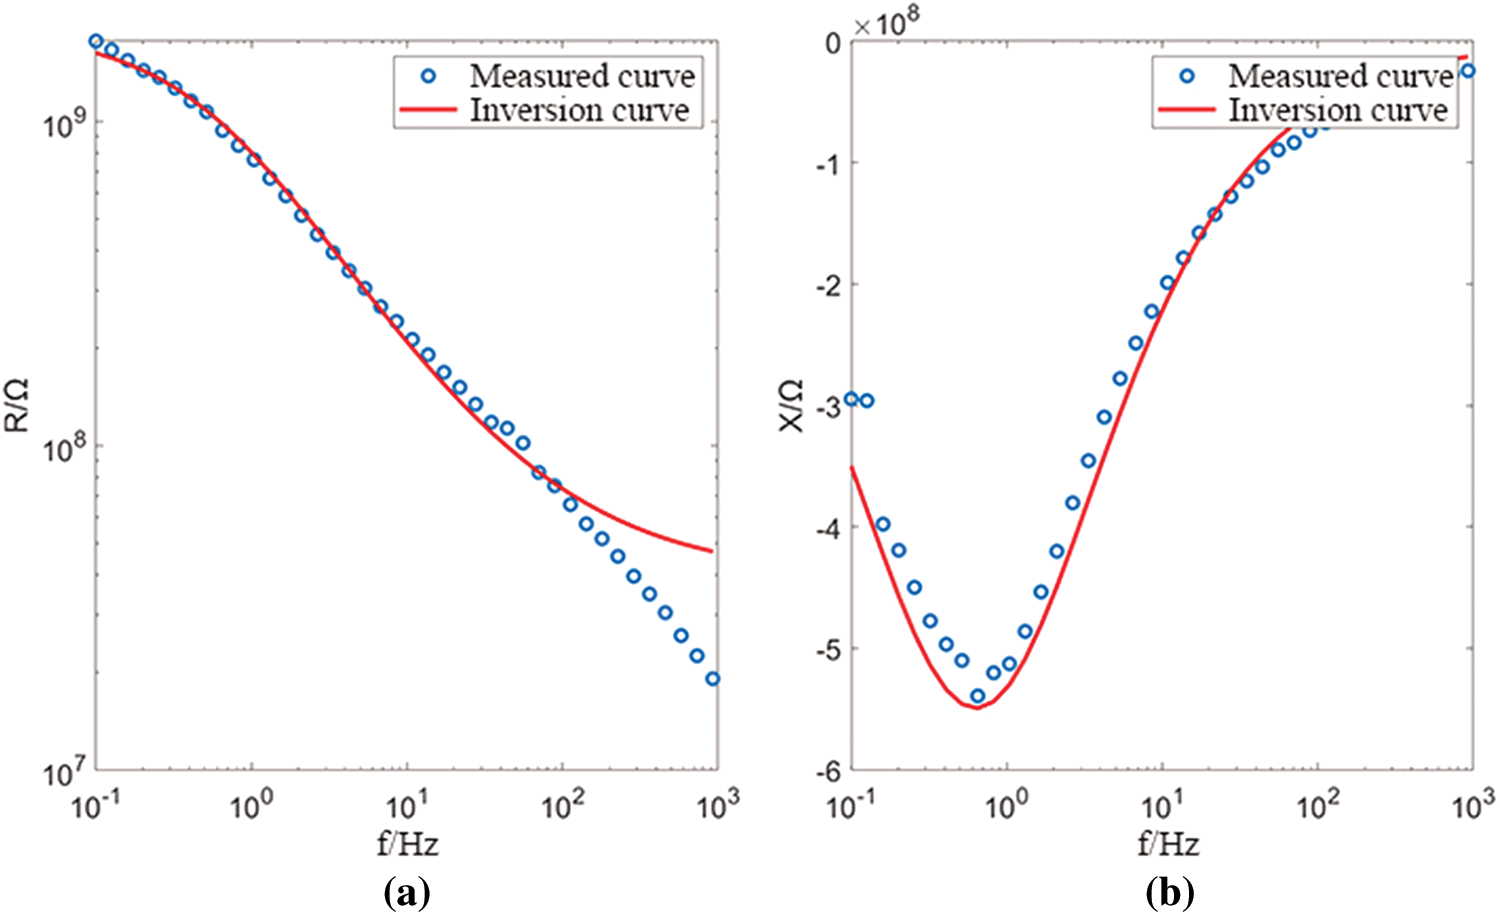
Figure 12: Y direction fitting diagram of primary structure coal (a) real part (b) imaginary part
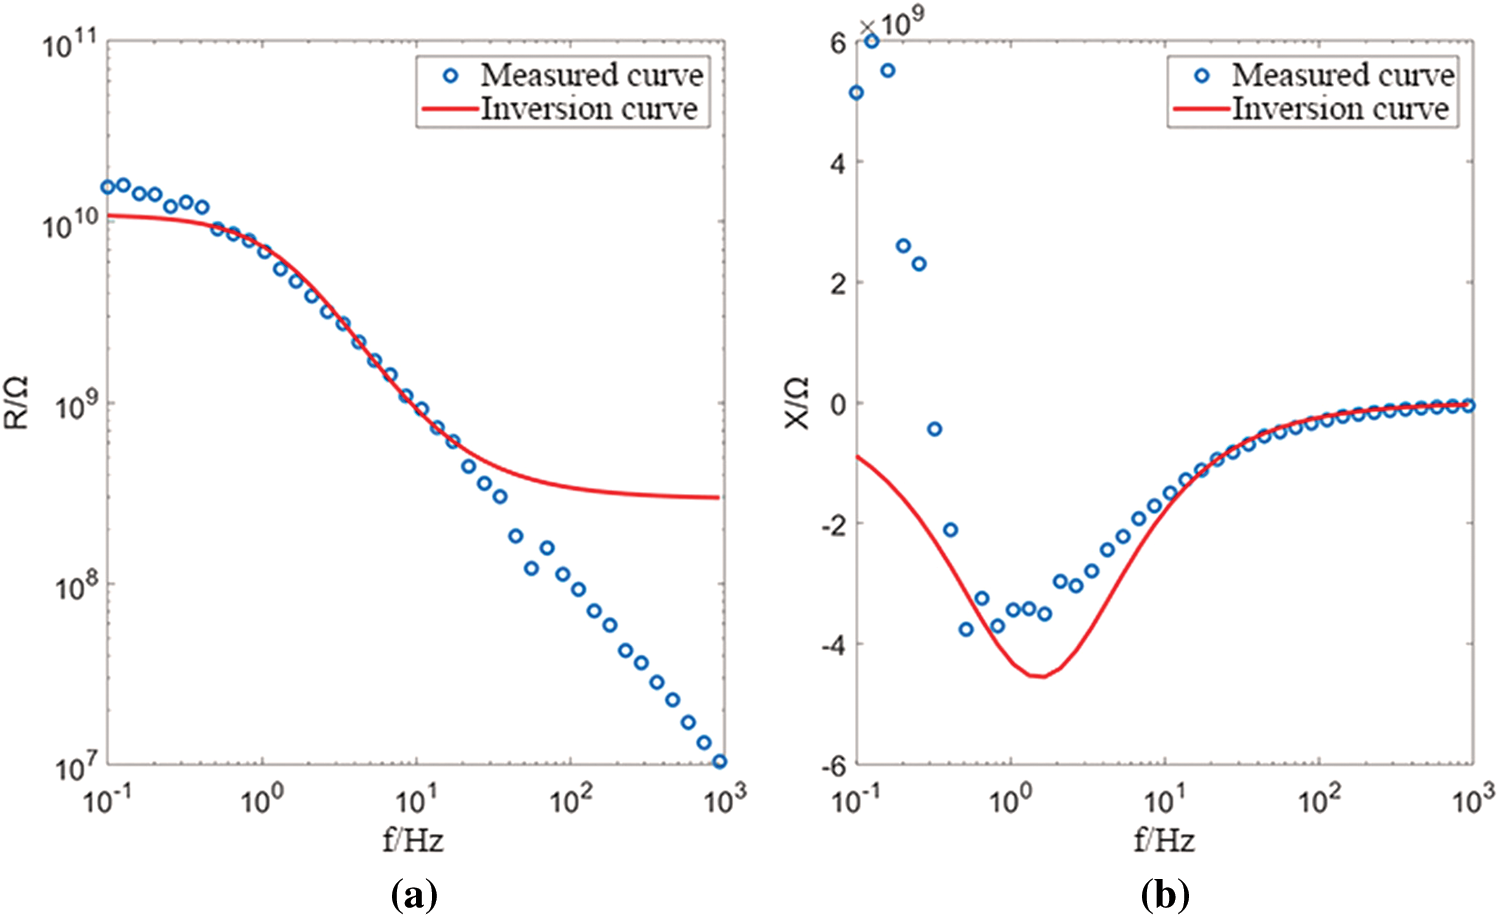
Figure 13: Z direction fitting diagram of primary structure coal (a) real part (b) imaginary part
The zero-frequency resistivity ρ0 affects the amplitude of the complex resistivity, but has no effect on its shape and does not affect the phase curve; the polarizability m mainly affects the amplitude trend and the phase minimum; the time constant τ mainly affects the phase minimum Corresponding frequency; frequency correlation coefficient c mainly affects the speed of amplitude attenuation and the size and position of the phase mini-mum.
Availability of Data and Materials: All data used in this study can be provided by asking the corresponding author.
Funding Statement: This research was funded by the National Natural Science Foundation under Grant No. [41974151], by the Jiangsu Province Natural Science Foundation under Grant No. [BK20181360], by the Major Scientific and Technological Innovation Project of Shandong Province of China under Grant No. [2019JZZY010820], by the Shaanxi Province Science and Technology Innovation Guidance Special No. [2020CGHJ-005].
Conflicts of Interest: The authors declare that they have no conflicts of interest to report regarding the present study.
1. Nie, B. S., He, X. Q., Wang, E. Y. (2003). Research status and development trend of coal and gas outburst prediction technology. China Safety Science Journal, 13(6), 41–43. DOI 10.3969/j.issn.1003-3033.2003.06.012. [Google Scholar] [CrossRef]
2. Kruschwitz, S., Yaramanci, U. (2004). Detection and characterization of the disturbed rock zone in claystone with the complex resistivity method. Journal of Applied Geophysics, 57(1), 63–79. DOI 10.1016/j.jappgeo.2004.09.003. [Google Scholar] [CrossRef]
3. Liu, H., Yang, H., Yi, F. (2016). Experimental study of the complex resistivity and dielectric constant of chrome-contaminated soil. Journal of Applied Geophysics, 131, 109–116. DOI 10.1016/j.jappgeo.2016.05.001. [Google Scholar] [CrossRef]
4. Weger, M., Kaveh, M., Gutfreund, H. (1978). Anharmonic properties of TTF–TCNQ. Solid State Communications, 37(5), 421–423. DOI 10.1016/0038-1098(78)91050-5. [Google Scholar] [CrossRef]
5. Lee, J. H., Oh, M. H., Park, J., Lee, S. H., Ahn, K. H. (2003). Dielectric dispersion characteristics of sand contaminated by heavy metal, landfill leachate and BTEX (02–104b). Journal of Hazardous Materials, 105(1–3), 83–102. DOI 10.1016/j.jhazmat.2003.07.004. [Google Scholar] [CrossRef]
6. Personna, Y. R., Slater, L., Ntarlagiannis, D., Werkema, D., Szabo, Z. (2013). Complex resistivity signatures of ethanol in sand–clay mixtures. Journal of Contaminant Hydrology, 149, 76–87. DOI 10.1016/j.jconhyd.2013.03.005. [Google Scholar] [CrossRef]
7. Du, M. G., Jing, J. G., Xiong, X. Q. (2022). Experimental study on heavy oil drag reduction in horizontal pipelines by water annular conveying. Fluid Dynamics & Materials Processing, 18(2), 81–91. DOI 10.32604/fdmp.2022.016640. [Google Scholar] [CrossRef]
8. Flores Orozco, A., Velimirovic, M., Tosco, T., Kemna, A., Sapion, H. et al. (2015). Monitoring the injection of microscale zerovalent iron particles for groundwater remediation by means of complex electrical conductivity imaging. Environmental Science & Technology, 49(9), 5593–5600. DOI 10.1021/acs.est.5b00208. [Google Scholar] [CrossRef]
9. Mori, Y., Suetsugu, A., Matsumoto, Y., Fujihara, A., Suyama, K. (2013). Enhancing bioremediation of oil-contaminated soils by controlling nutrient dispersion using dual characteristics of soil pore structure. Ecological Engineering, 51, 237–243. DOI 10.1016/j.ecoleng.2012.12.009. [Google Scholar] [CrossRef]
10. Diersch, H. J., Bauer, D., Heidemann, W., Rühaak, W., Schätzl, P. (2011). Finite element modeling of borehole heat exchanger systems: Part 2. Numerical simulation. Computers & Geosciences, 37(8), 1136–1147. DOI 10.1016/j.cageo.2010.08.002. [Google Scholar] [CrossRef]
11. Adetoyinbo, A. A. (2009). Assessment of groundwater quality in unconsolidated sedimentary coastal aquifer in lagos state. Nigeria. Scientific Research and Essays, 4(4), 314–319. [Google Scholar]
12. Mellage, A., Smeaton, C. M., Furman, A., Atekwana, E. A., Rezanezhad, F. et al. (2018). Linking spectral induced polarization (SIP) and subsurface microbial processes: Results from sand column incubation experiments. Environmental Science & Technology, 52(4), 2081–2090. DOI 10.1021/acs.est.7b04420. [Google Scholar] [CrossRef]
13. Pelton, W. H., Ward, S. H., Hallof, P. G., Sill, W. R., Nelson, P. H. (1978). Mineral discrimination and removal of inductive coupling with multifrequency IP. Geophysics, 43(3), 588–609. DOI 10.1190/1.1440839. [Google Scholar] [CrossRef]
14. Li, J., Ke, S., Yin, C., Kang, Z., Jia, J. et al. (2019). A laboratory study of complex resistivity spectra for predictions of reservoir properties in clear sands and shaly sands. Journal of Petroleum Science and Engineering, 177, 983–994. DOI 10.1016/j.petrol.2019.01.061. [Google Scholar] [CrossRef]
15. Tong, M., Tao, H. (2008). Permeability estimating from complex resistivity measurement of shaly sand reservoir. Geophysical Journal International, 173(2), 733–739. DOI 10.1111/j.1365-246X.2008.03730.x. [Google Scholar] [CrossRef]
16. Titov, K., Komarov, V., Tarasov, V., Levitski, A. (2002). Theoretical and experimental study of time domain-induced polarization in water-saturated sands. Journal of Applied Geophysics, 50(4), 417–433. DOI 10.1016/S0926-9851(02)00168-4. [Google Scholar] [CrossRef]
17. Zhao, Y. C., Li, L., Yu, G. Y. (2003). Electro-chemical property of source rock and its significance in Log evaluation. Well Logging Technology, 27(1), 1–5. DOI 10.16489/j.issn.1004-1338.2020.04.016. [Google Scholar] [CrossRef]
18. Jiang, Y., Moradi, R., Abusorrah, A. M., Hajizadeh, M. R., Li, Z. (2021). Effect of downstream sinusoidal wall on mixing performance of hydrogen multi-jets at supersonic flow: Numerical study. Aerospace Science and Technology, 1–8, 106410. DOI 10.1016/j.ast.2020.106410. [Google Scholar] [CrossRef]
19. Guo, X. J., Huan, X., Gong, W. D., Zhang, Y. (2017). Study on coal complex resistivity anisotropy and characteristics of frequency response. Coal Science and Technology, 45(4), 167–170. [Google Scholar]
20. Jiang, Y., Hajivand, M., Sadeghi, H., Gerdroodbary, M. B., Li, Z. (2021). Influence of trapezoidal lobe strut on fuel mixing and combustion in supersonic combustion chamber. Aerospace Science and Technology, 1–10, 106841. DOI 10.1016/j.ast.2021.106841. [Google Scholar] [CrossRef]
21. Jiang, Y., Abu-Hamdeh, N. H., Bantan, R. A., Moradi, R. (2021). Mixing efficiency of hydrogen and air co-flow jets via wedge shock generator in dual-combustor ramjet. Aerospace Science and Technology, 1–8, 106846. DOI 10.1016/j.ast.2021.106846. [Google Scholar] [CrossRef]
 | This work is licensed under a Creative Commons Attribution 4.0 International License, which permits unrestricted use, distribution, and reproduction in any medium, provided the original work is properly cited. |