| Fluid Dynamics & Materials Processing |
DOI: 10.32604/fdmp.2022.019486
ARTICLE
Application of New Water Flooding Characteristic Curve in the High Water-Cut Stage of an Oilfield
1School of Petroleum Engineering, Yangtze University, Wuhan, 430100, China
2Exploration and Development Research Institute of Jianghan Oilfield Company of Sinopec, Wuhan, 430223, China
*Corresponding Author: Changquan Wang. Email: wonque@163.com
Received: 27 September 2021; Accepted: 25 October 2021
Abstract: The oil production predicted by means of the conventional water-drive characteristic curve is typically affected by large deviations with respect to the actual value when the so-called high water-cut stage is entered. In order to solve this problem, a new characteristic relationship between the relative permeability ratio and the average water saturation is proposed. By comparing the outcomes of different matching methods, it is verified that it can well reflect the variation characteristics of the relative permeability ratio curve. Combining the new formula with a reservoir engineering method, two new formulas are derived for the water flooding characteristic curve in the high water-cut stage. Their practicability is verified by using the production data of Mawangmiao and Xijiakou blocks. The results show that the error between the predicted cumulative oil production and production data of the two new water drive characteristic curves is less than the error between the B-type water drive characteristic curve and the other two water drive characteristic curves. It is concluded that the two new characteristic curves can be used to estimate more accurately the recoverable reserves, the final recovery and to estimate the effects of water flooding.
Keywords: Water flooding characteristic curve; high water cut period; production dynamic prediction; recoverable reserves; water flooding
Nomenclature
| WOR | Water-oil ratio; |
| Qw | Water production, t/day; |
| Qo | Oil production, t/day; |
| Krw, Kro | Relative permeability of water phase and oil phase; |
| μw, μo | Water, oil viscosity, mPa⋅s; |
| Bw, Bo | Water and oil volume coefficient, m3/m3; |
| a, b, c | Constants influenced by reservoir and fluid properties; |
| A, B, C, C1 | Constants; |
| Sw | Water saturation, %; |
| | Average water saturation, %; |
| Swe | Outlet end water saturation; |
| Swd | Normalized water saturation, %; |
| Swc | Irreducible brine saturation; |
| Sor | Interstitial-oil saturation; |
| γw, γo | The relative density of water and oil; |
| R | The degree of geological reserves recovery; |
| N | Geological reserves, 104t; |
| Np | Accumulated oil production, 104t; |
| Nom | Movable oil reserves, 104t; |
| Ed | Ultimate oil displacement efficiency; |
| m, n | Matching parameters. |
Calculating the formulas for the traditional water flooding characteristic curves A and B is straightforward, as is understanding the physical significance of the essential quantities [1]. It is universally applicable to oil field development including water flooding. It is the most often utilized technique for anticipating production in the development of water flooding. It is frequently used to determine the effect of flood development on recoverable reserves and final recovery efficiency. The standard water flooding characteristic curve accurately predicts the dynamic index of the development of the oil field during the middle-middle and high water cut periods, but not once the oil field enters the high water cut period [2,3]. Following the commencement of the high water cut period, it is observed in laboratory experiments and on-site manufacturing procedures. Conventional water flooding’s typical curve will deflect, leading to phenomena such as downward bending and upward warping [4–6]. At the moment, the straight-line section of the traditional water flooding characteristic curve is still utilized to estimate that the target reservoir’s development index and recoverable reserves will have bigger inaccuracies. As a result, a new form of water flooding characteristic curve that is consistent with the actual production condition during the high water cut time is required [7].
In theory, the characteristic curve of the water drive will curve towards the period of maximum water cut. Because the linear representation relationship between the oil-water relative permeability ratio and water saturation in the semi-logarithmic coordinate used to generate the standard water drive characteristic curve is no longer established after the high water cut period begins [8]. Numerous researchers have undertaken considerable research on this subject, examining the establishment of a high-permeability water phase channel during the manufacture of field water injection and the transformation of the oil-water continuous phase [9,10]. They designed a variety of water drive characteristic curves to address this issue. The water drive characteristic curves obtained in this work can be utilized to fit production data from oilfields during (extra) high water cut periods [11]. However, the bulk of matching expressions are worthless due to their complexity, and the prediction error is large [12,13]. Wang suggested a linear water drive characteristic curve in logarithmic coordinates that may more accurately estimate the oil production law during a period of severe water cut [14]. However, the forecast error continues to be substantial. It is important to suggest a new water drive characteristic curve to estimate development performance more precisely during times of extreme water scarcity [15,16].
Based on Liu’s [17] proposed [17] expression for the relative permeability ratio and the matching of the curved part of the rear section of the normalized oil-water relative permeability ratio curve in multiple blocks of the JH oilfield. This study presents a new relative permeability ratio characterization relationship that is highly correlated with the curved region of the rear section of the normalized relative permeability ratio curve. It may correctly depict the change law of the relative permeability ratio curve after bending and deducing the formula to create two new water drive characteristic curve formulas. By comparing the prediction error for the new curve against the prediction error for other waterflood characteristic curves. The new water driving characteristic curve is proved to be capable of forecasting an oil field’s development performance under periods of extreme water scarcity, as well as recoverable reserves and recovery factors. It may provide a more dependable basis for accurately forecasting the development performance of the JH oil field during a period of high water cut.
2 Characterization of New Phase Permeability Mathematical Model
The following formula is used to establish the traditional water flooding characteristic curves of A and B:
The linear representation in semi-logarithmic coordinates is given by formula (1), which is as follows:
Numerous researchers [18,19] discovered the formula (1) the approximate exponential relationship between Krw/Kro and Sw exists only when Sw is near the center of the oil-water two-phase infiltration zone (single well or Oilfield block production to medium-high water cut period). Non-exponential bending, on the other hand, will occur during the early and late stages of production in waterflooding oil fields. As a result, this formula does not apply to periods of low, high, or ultra-high water cut. Now, formula (2) is used to compare this conclusion to the normalized phase permeability data for the actual block of the JH oilfield (Fig. 1).
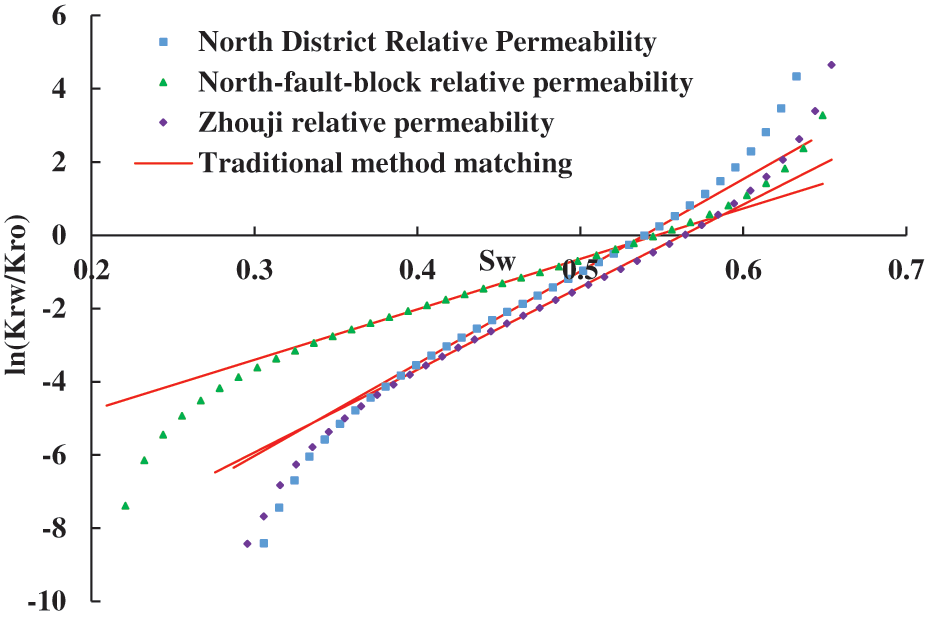
Figure 1: Traditional matching diagram of the JH Oilfield Block’s normalized relative permeability ratio curve
As illustrated in Fig. 1, the normalized relative permeability ratio curve is inverted when Sw is near 0.55 and concave after inversions. At this point (2), the linear relative permeability ratio formula expressed cannot reflect the actual curve’s change characteristics. As a result, a new relative permeability ratio formula must be proposed. It may reflect the change in the relative permeability ratio curve’s characteristics when the water saturation level is high.
The experimental data for oil-water permeability in multiple blocks of the JH oilfield are analyzed to select core permeability data samples from multiple main production wells in the block. It encompasses the three most frequently encountered types of oil-water permeability curves in waterflood oil fields: linear water phase, concave water phase, and concave water phase. It generates a normalized oil-water relative permeability ratio curve that can be used to characterize the physical properties of oilfield blocks. By conducting matching analyses and conducting research on the inverted portion of the relative permeability ratio curve in the later period, as well as conducting literature searches. This article proposes a new characterization relation that more accurately describes the characteristics of the relative permeability ratio curve’s latter section:
Then:
Note: According to the literature [18], when the oil field is in high water cut Stage.
Determination method of a, b, c: Let y =
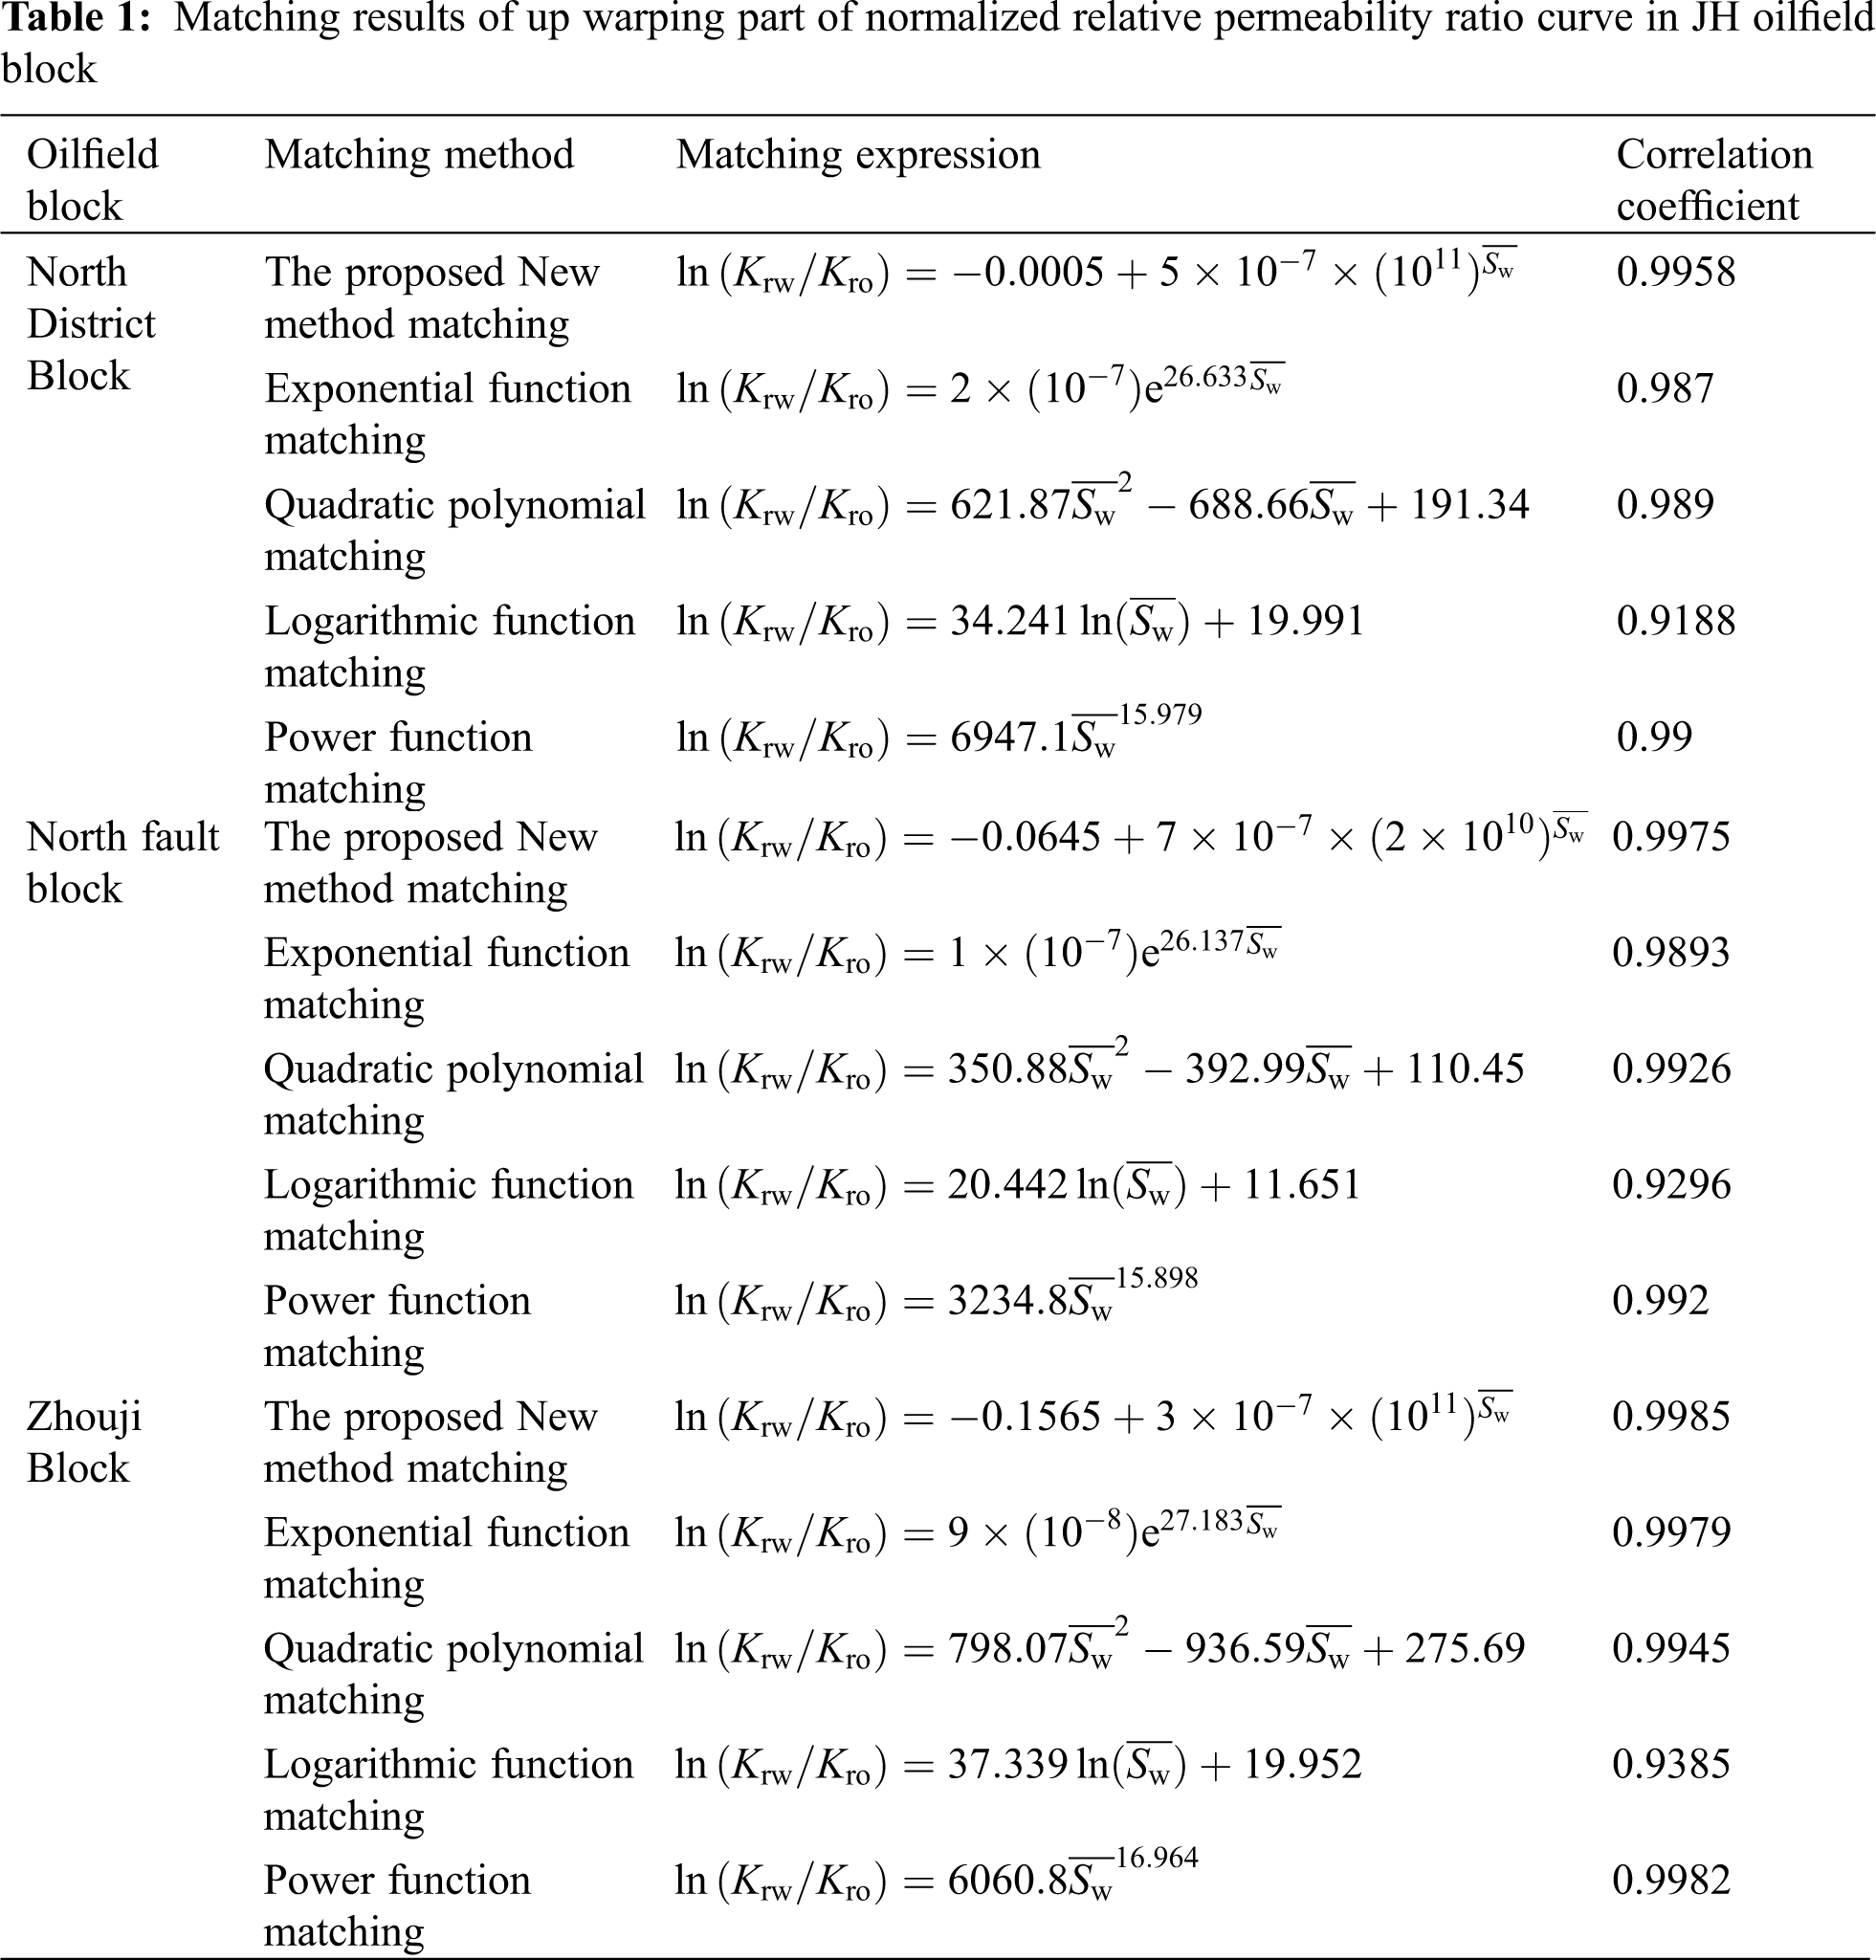
Calculate the bending part of the back section of the normalized oil-water relative permeability ratio curve for the North District, North fault block, Zhouji, and the remaining three blocks of the JH oilfield using the formula (4). Its applicability is established through comparison to the matching results obtained using the other four methods.
Figs. 2–4 illustrate the matching analysis of five distinct methods. As can be seen, the new characterization relation is well suited to the upward portion of the relative permeability ratio curve’s rear section. The matching expressions and correlation coefficients for the later upturned part of the curve are shown in Table 1. The table indicates that the correlation coefficients of the new methods’ matching expressions are greater than 0.995 and greater than the correlation coefficients of other matching methods. It can more accurately reflect the relative permeability ratio curve’s changing characteristics as it rises.
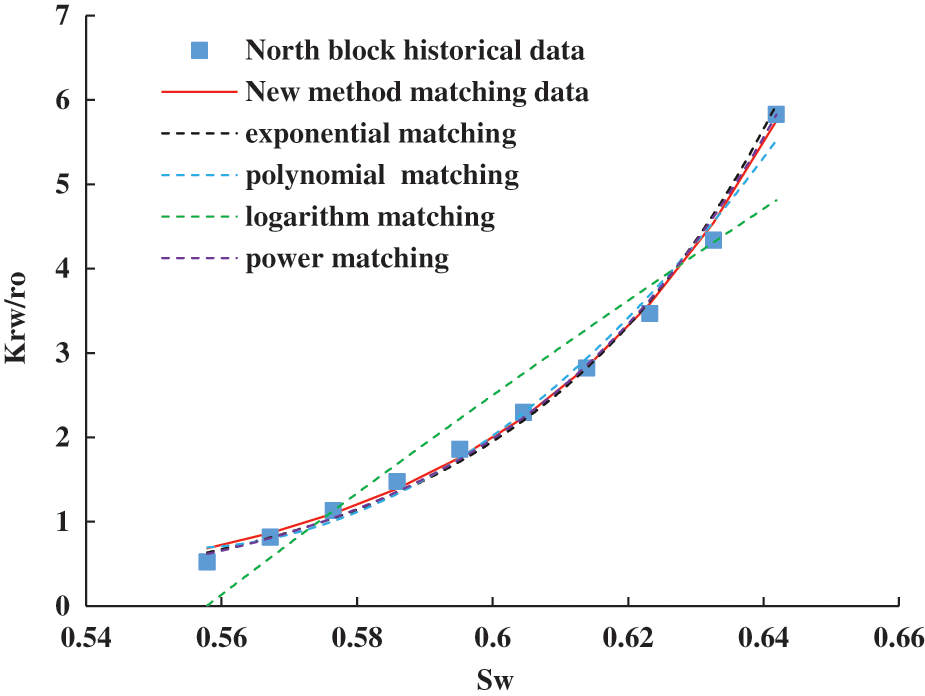
Figure 2: Matching analysis diagram of five different methods (North block of JH oilfield)
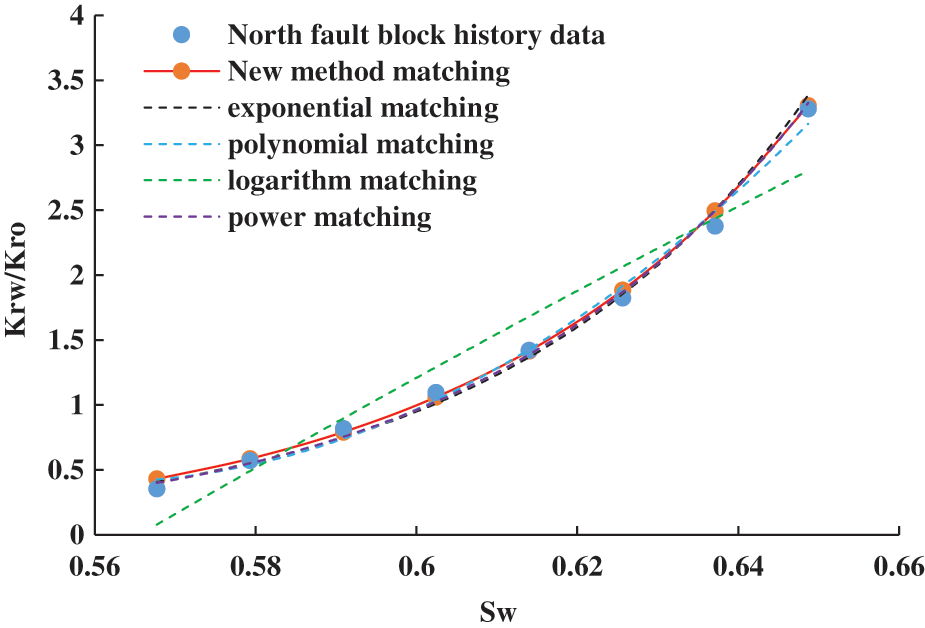
Figure 3: Matching analysis diagram of five different methods (North fault block of JH oilfield)
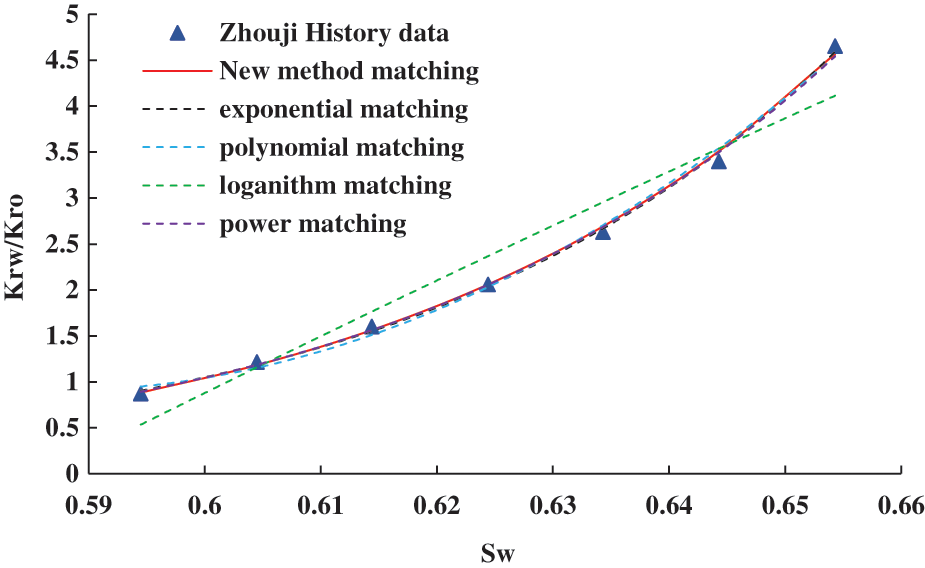
Figure 4: Matching analysis diagram of five different methods (Zhouji block of JH oilfield)
3 Derivation of New Water Flooding Characteristic Curve
3.1 Formula of New Water Flooding Characteristic Curve in High Water Cut Period
To precisely meet the demand for dynamic and recoverable production prediction during the later stages of oilfield water injection development. In this paper, the new Krw/Kro-Sw expression expressed by formula (3) is used. Referring to the process of derivation of the formulas for the water flooding characteristic curves A and B. The water flooding characteristic curve formula for a high water cut period is deduced using relevant reservoir engineering methods. The following is the derivation procedure:
Without regard for gravity or capillary force, the water-oil ratio WOR during steady seepage can be expressed as follows:
Replace formula (3) with formula (5) and obtain:
Take the logarithm on both sides of the formula, and obtain:
When the formation pressure of the water injection reservoir remains stable, the geological recovery R in one-dimensional displacement can be expressed as:
The preceding formula can be rewritten:
Replace formula (10) with formula (8) and obtain:
Namely:
Formula (12) can be abbreviated:
In formula (13), A, B, and C are constants, respectively:
Formula (13) is a novel type of water flooding characteristic curve formula for use in the presence of a prolonged period of high water cut. When it is used, it is necessary to match data that is close to the curve bending of the actual lgWOR-R during the high water cut period. Its physical significance is that the relationship between water-oil ratio and geological reserve recovery degree is exponential in a semi-logarithmic coordinate system during the high water cut stage.
Determination method of A, B, C: Make y = lgWOR, x = CR, formula (13) can be rewritten as y = A + Bx. This formula is used for linear matching of production data. The least-square method is used to determine the value of C. At this time, the intercept is A and the slope is B.
3.2 New Water Flooding Characteristic Curve Formula in Ultra-High Water Cut Period
The literature [1] demonstrates that development enters the ultra-high water cut period following water injection. The average water saturation
The characterization relationship of normalized water saturation Swd is as follows:
According to formula (19), the water saturation Swe at the outlet can be expressed:
The ultimate displacement efficiency Ed can be expressed:
Formula (18) and formula (21) can be rewritten:
The Nom of movable oil reserves is defined:
Replace formula (23) with formula (22):
From formula (24), formula (20) can be rewritten:
Replace formula (25) with formula (17) and obtain:
In formula (28), A, B, and C1 are all constants, A and B are shown in formulas (14) and (15), and C1 is as follows:
Formula (28) is a novel type of water flooding characteristic curve formula that is applicable in the presence of an extremely long water cut period. When this technique is used, it is necessary to match data near the bending of the actual lgWOR-Np/Nom curve during the ultra-high water cut period. In a semi-logarithmic coordinate system, the relationship between the water-oil ratio and the degree of recoverable reserve recovery in the ultra-high water cut stage is exponential.
3.3 Determination of Development Effect by New Water Flooding Characteristic Curve Parameters
The characteristic curve of water flooding often takes one of three shapes in semi-logarithmic coordinates: linear, up-ward, or down-ward. After entering the era of high water cut, a huge number of water flooding oil field lgWOR-R curves will get twisted. In the latter stages, a few oil fields with considerable water management techniques and a noticeable influence on the lgWOR-R curve will have a downward bending shape. The linear component of the lgWOR-R curve, on the other hand, is visible during the middle-middle and high water cut periods. lgWOR-R The growth rate of lgWOR is the mathematical basis for the curve upturned or down bending phenomena. If lgWOR rises monotonically with R and the growth rate remains constant, the curve seems inverted, exacerbating the water flooding effect. If lgWOR rises linearly as R increases. When the growth rate slows, the curve bends downward, improving the impact of water inundation. Thus, the influence of water flooding on development may be quantified in terms of a new water flooding characteristic curve.
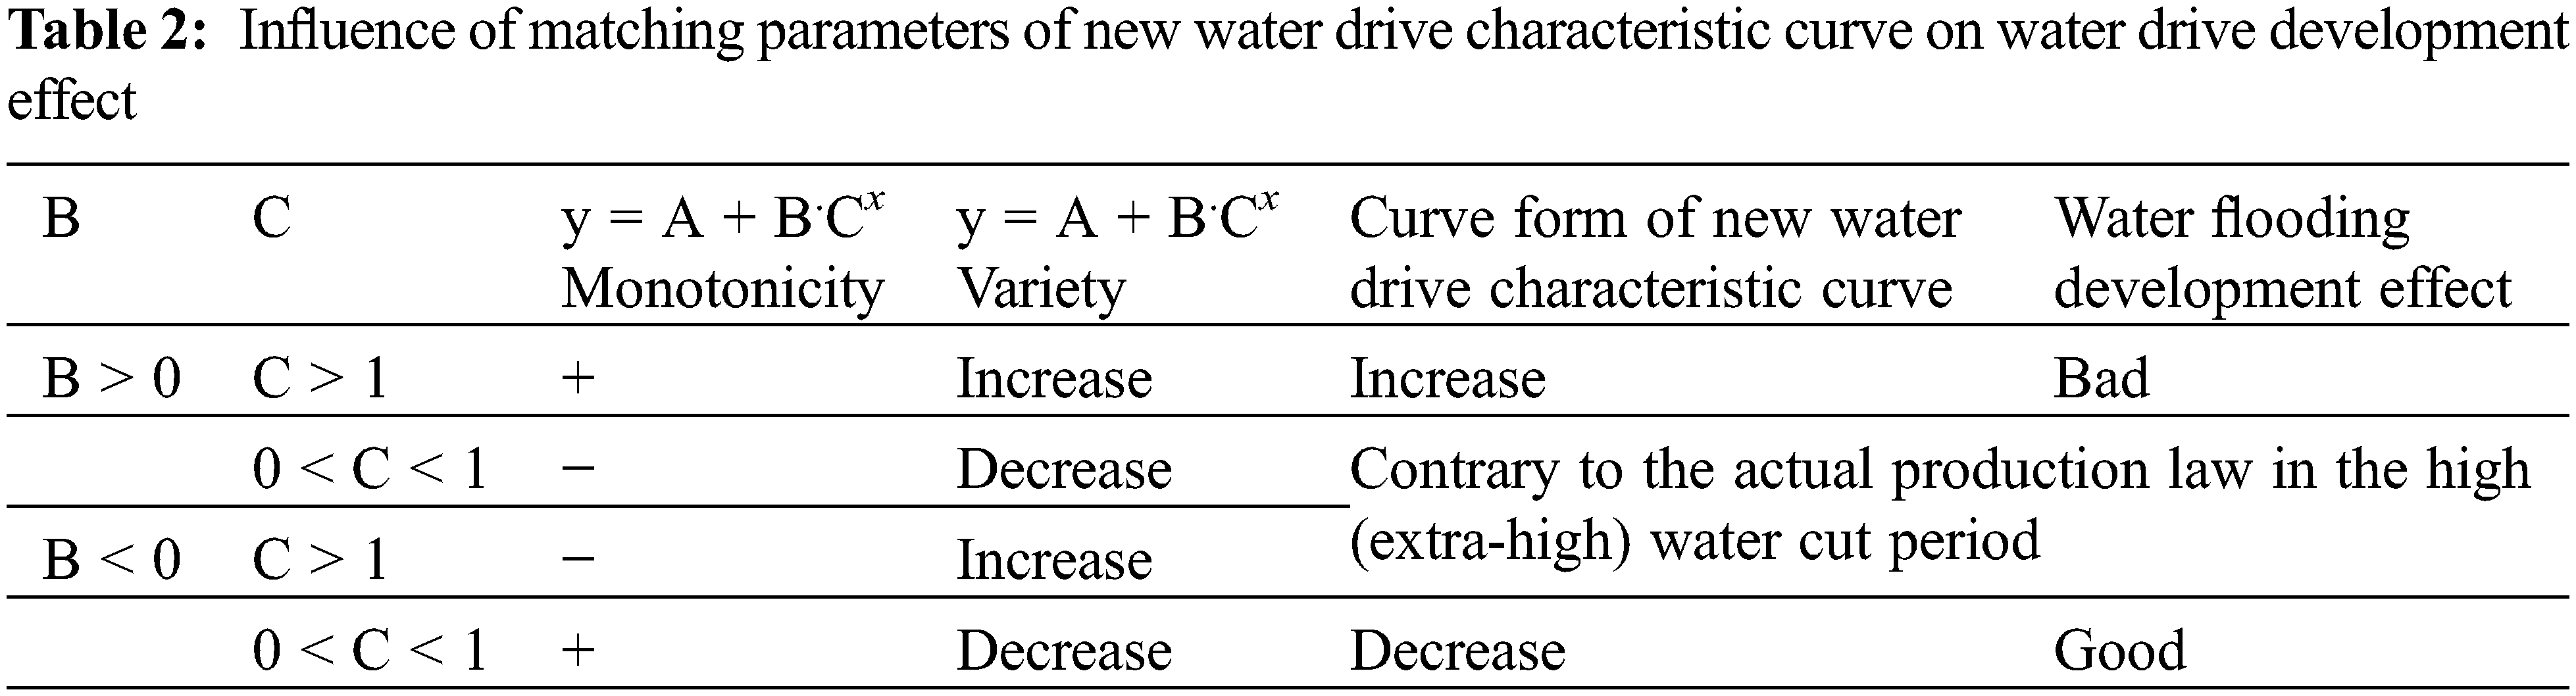
Let y = lgWOR, x = R, the new water flooding characteristic curve formula (13) can be expressed as y = A + BCx, the monotonicity of a function and curve form are only related to the values of B and C. The influence of the values of B and C on the development effect of water flooding is analyzed, and the analysis results are shown in Table 2.
If y = lgWOR and x = R, the new water flooding characteristic curve formula (13) may be represented as y = A + BCx, where the monotonicity of a function and its shape are solely dependent on the values of B and C. The impact of B and C values on the development effect of water flooding is investigated, and the resulting data are shown in Table 2.
As shown in Table 2, when B > 0 and C > 1, the characteristic curve of the newly flooded area exhibits an upward distorted trend. Water flooding has a negligible influence on development. The larger the values of B and C, the greater the growth rate of lgWOR and the worse the development effect; when B < 0, 0 < C < 1, the new water flooding characteristic curve exhibits a downward bend, indicating that the water flooding development effect is favorable; additionally, the larger the values of B and C, the smaller the growth rate of lgWOR and the better the development effect; additionally, the larger the values of B and C, the smaller the growth rate of lgWOR and the better As a result, only B and C values may be used to determine the development impact of water cut-off floods.
The representation form of the formula (28) is similar to that of formula (13), which can be expressed as y = A + B.C1x. The form of C1x, so the above conclusion is also applicable to formula (28), only C needs to be changed into C1.
4 Oilfield Instance Verification
The application study and research of novel water floodings characteristic curve formulae such as formula (13) and formula (28) are conducted using on-site production data from the JH oilfield. By comparing the forecast error of the new curve to the actual data points, as well as the characteristic curve of B-water flooding and the characteristic curve of other water type floods. It is shown that it may be used to forecast the dynamic evolution of high and ultra-high water cut stages.
4.1 Verification of Production Data in Mawangmiao Block of JH Oilfield
The actual development data of the Mawangmiao block in the JH oilfield is shown in Table 3.
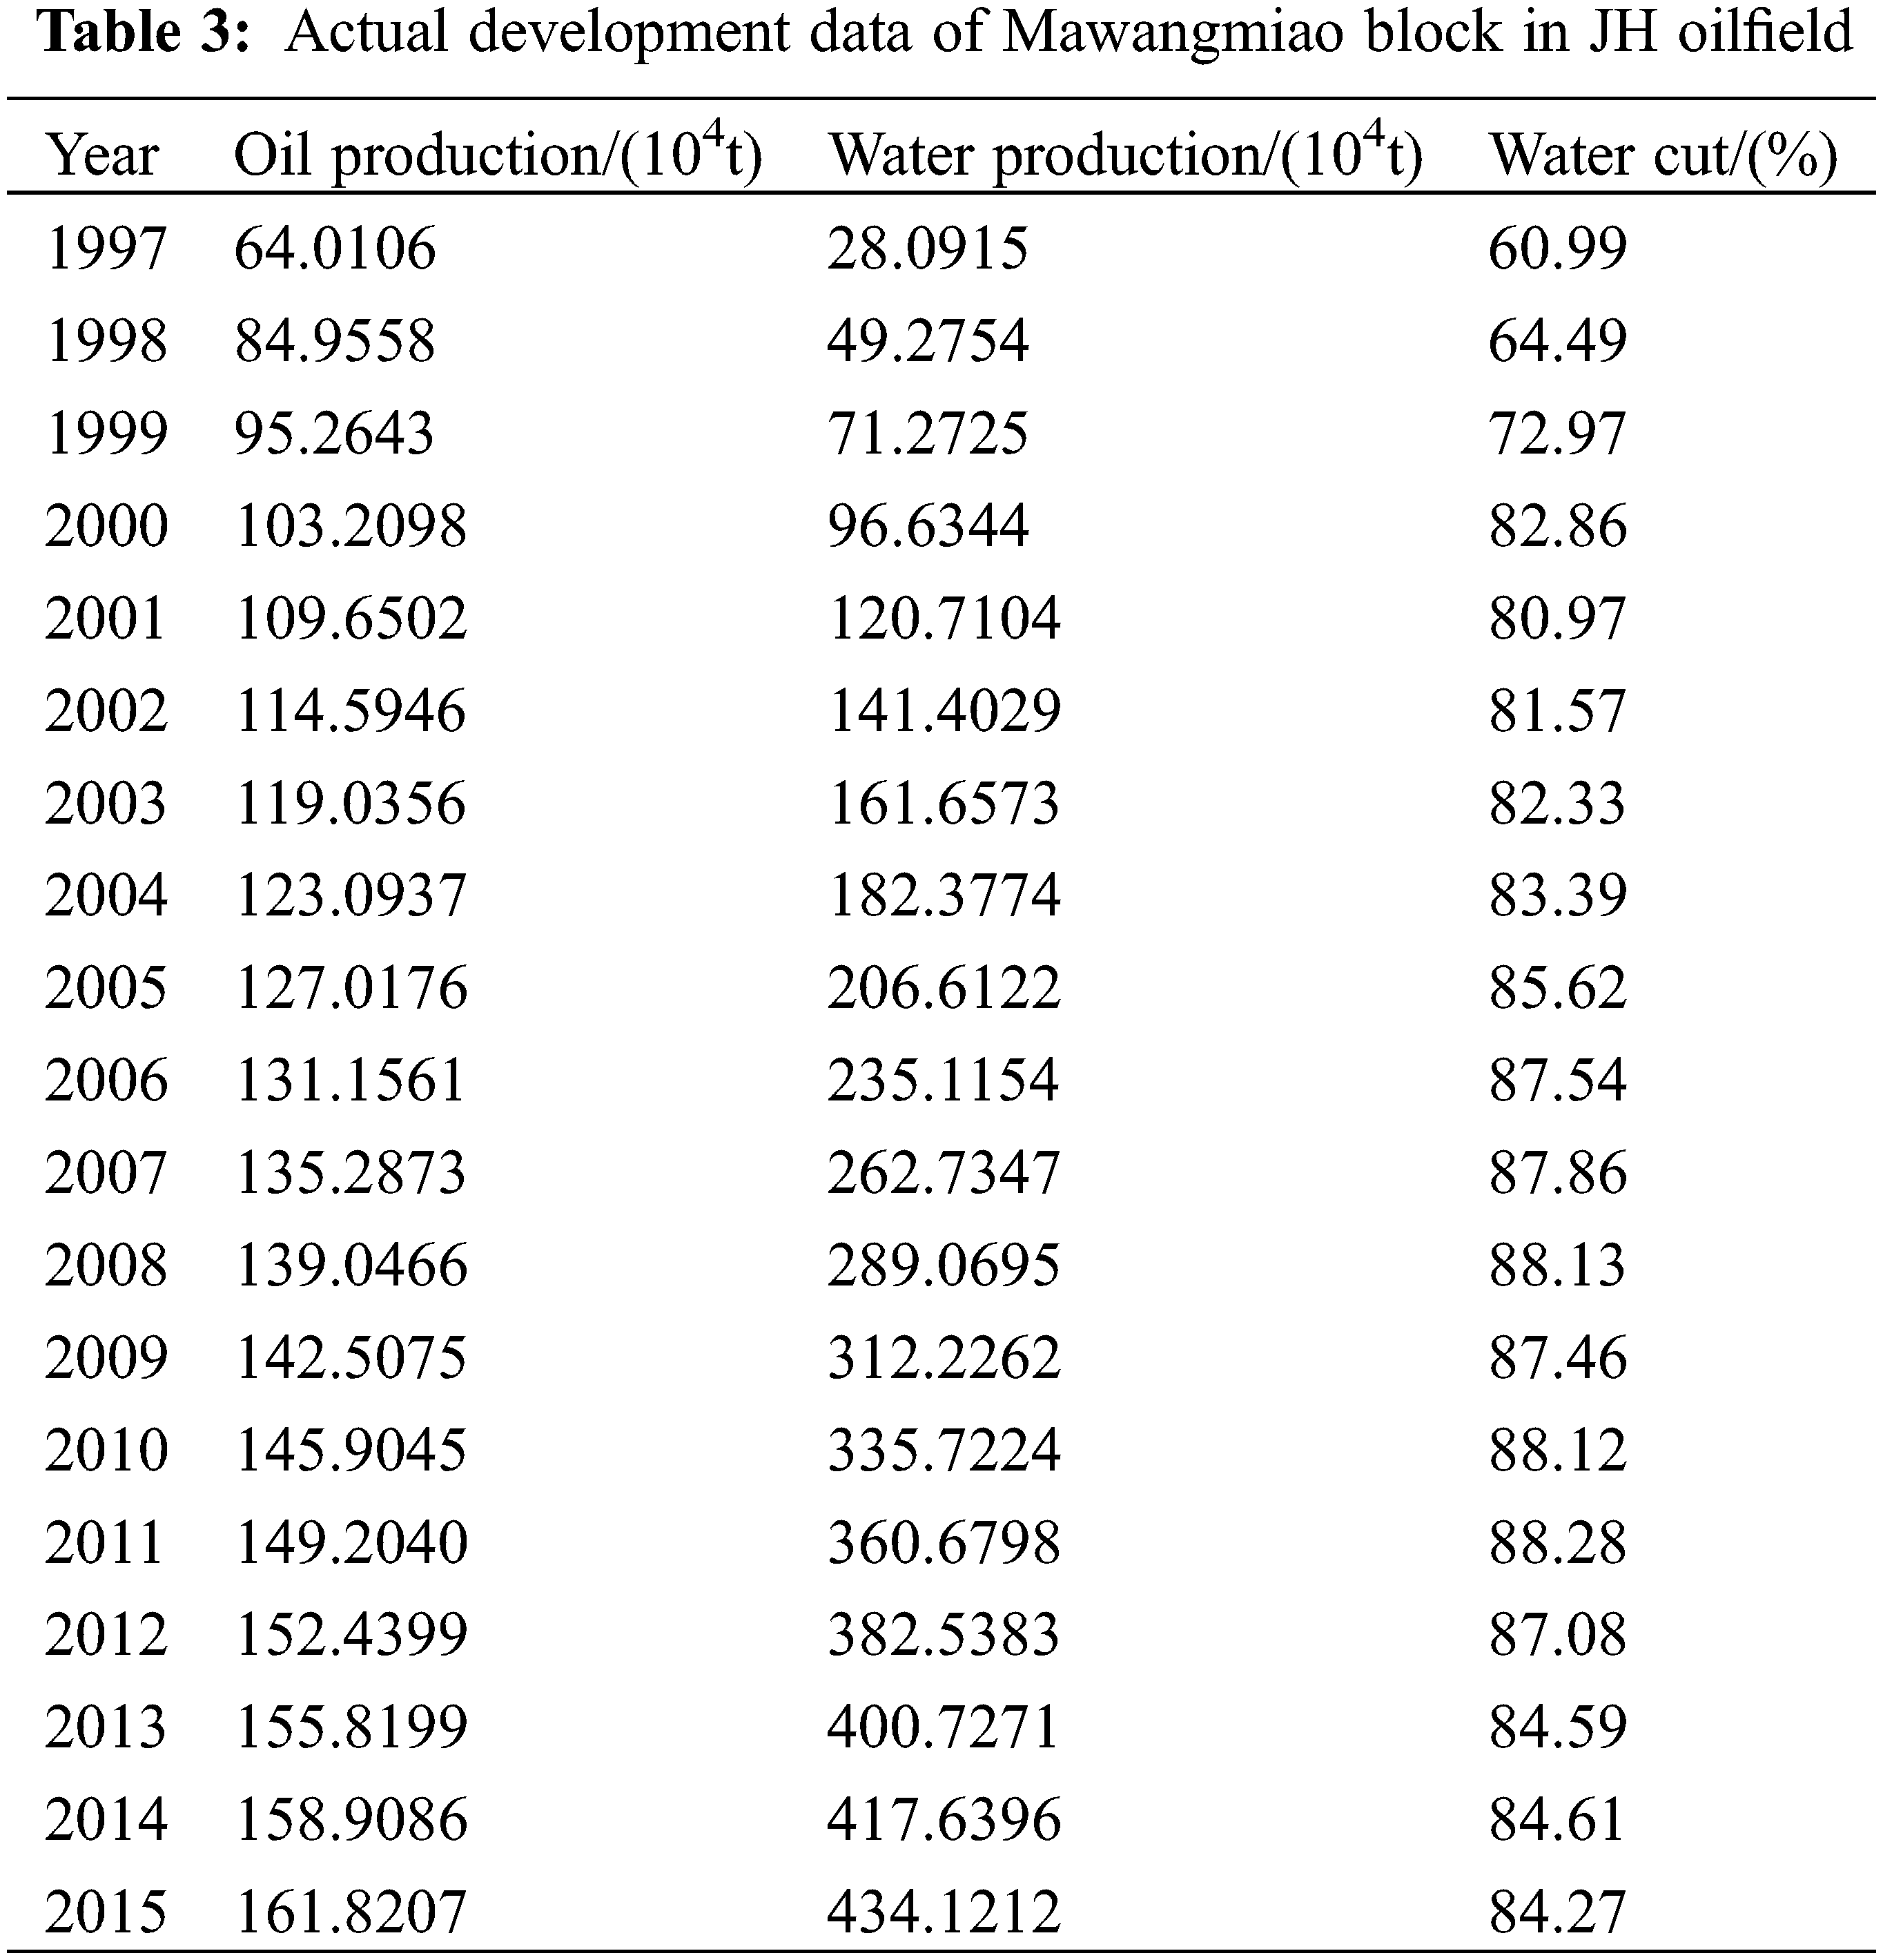
This block has geological reserves of 891.6531 T * 104 t. The association between lgWOR and R has been determined using the data in Table 3. This block implemented a variety of water management measures in 2006, with surprising results. The block’s oil well water production was regulated. The total water reduction remained constant at about 85 percent. When the water cut reached around 87.86 percent in 2007, the lgWOR-R curve curved downward.
At the moment, the characteristic curve of B-type water flooding is being utilized to match linear data points with a moisture content of 72.97 percent to 87.54 percent (1999–2006) before the MaWangMiao block measures (Fig. 5). The data points are matched using the new water flooding characteristic curve in the high water cut period [formula (13)] and the Fan-proposed water flooding characteristic curve in the high water cut period to determine the water cut after 87.54 percent and 84.27 percent (2006–2012) (Figs. 6 and 7).
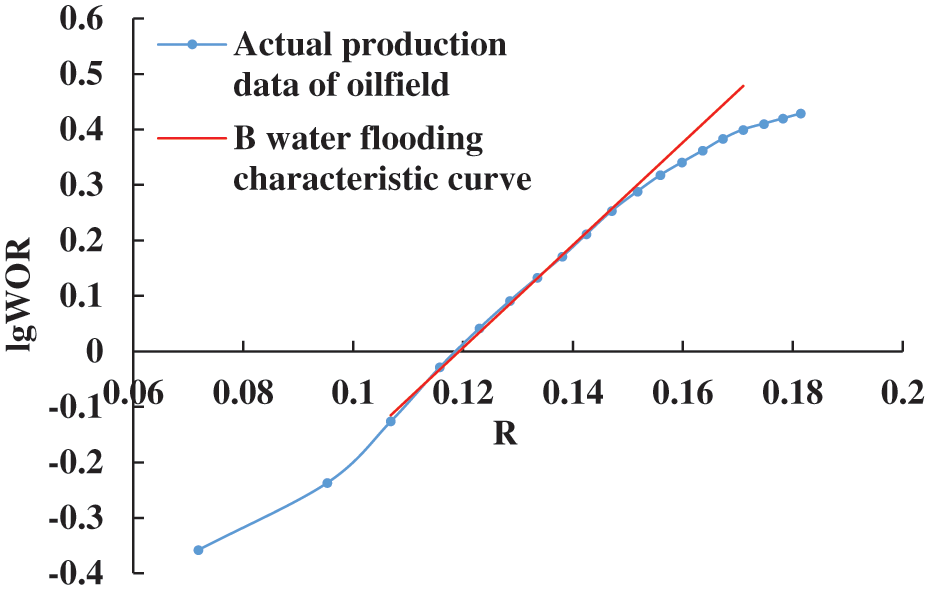
Figure 5: Type-B water drive characteristic curve of Mawangmiao block
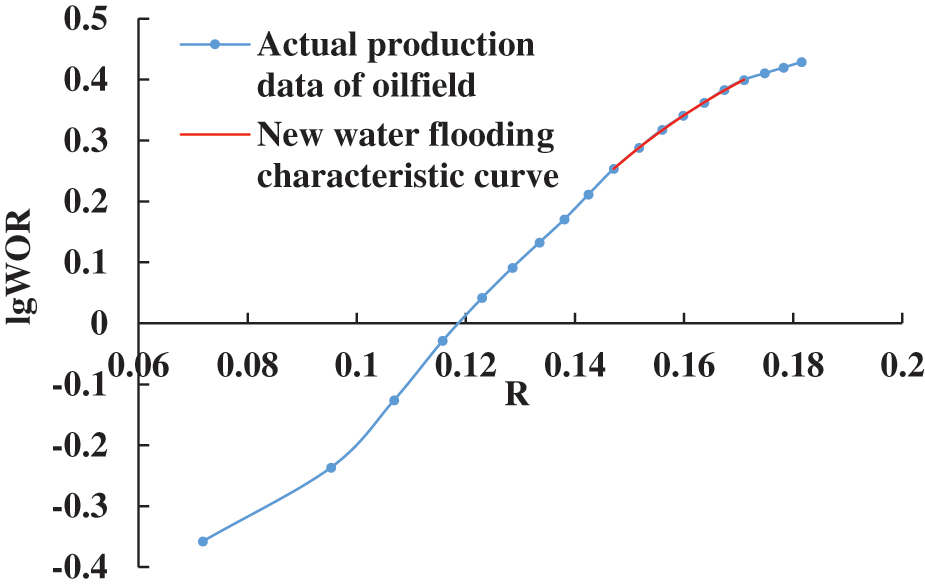
Figure 6: New water drive characteristic curve in Mawangmiao block
Figure 7: Fan’s water drive characteristic curve in high water cut stage
Fan [19] proposed the characteristic curve formula of water flooding in high water cut period is:
Indoor displacement experiments were conducted utilizing natural cores from a number of the MawangMiao block’s primary producing wells. The phase permeability curve obtained was normalized. The MawangMiao oil-water relative permeability curve has been normalized. This block has a 34.25 percent interstitial oil saturation and a 30.07 percent irreducible brine saturation. When the aforementioned data is entered into formula (21), the final displacement efficiency Ed is determined to be 0.5102.
As seen in Fig. 6, the suggested revised water flooding characteristic curve is very consistent with the actual curve after water management measures. It can more accurately represent the real curve’s fluctuation features after water management techniques. Three typical curves of water flooding are utilized to forecast the cumulative oil production from 2013 to 2015. Table 4 summarizes the predicted findings.
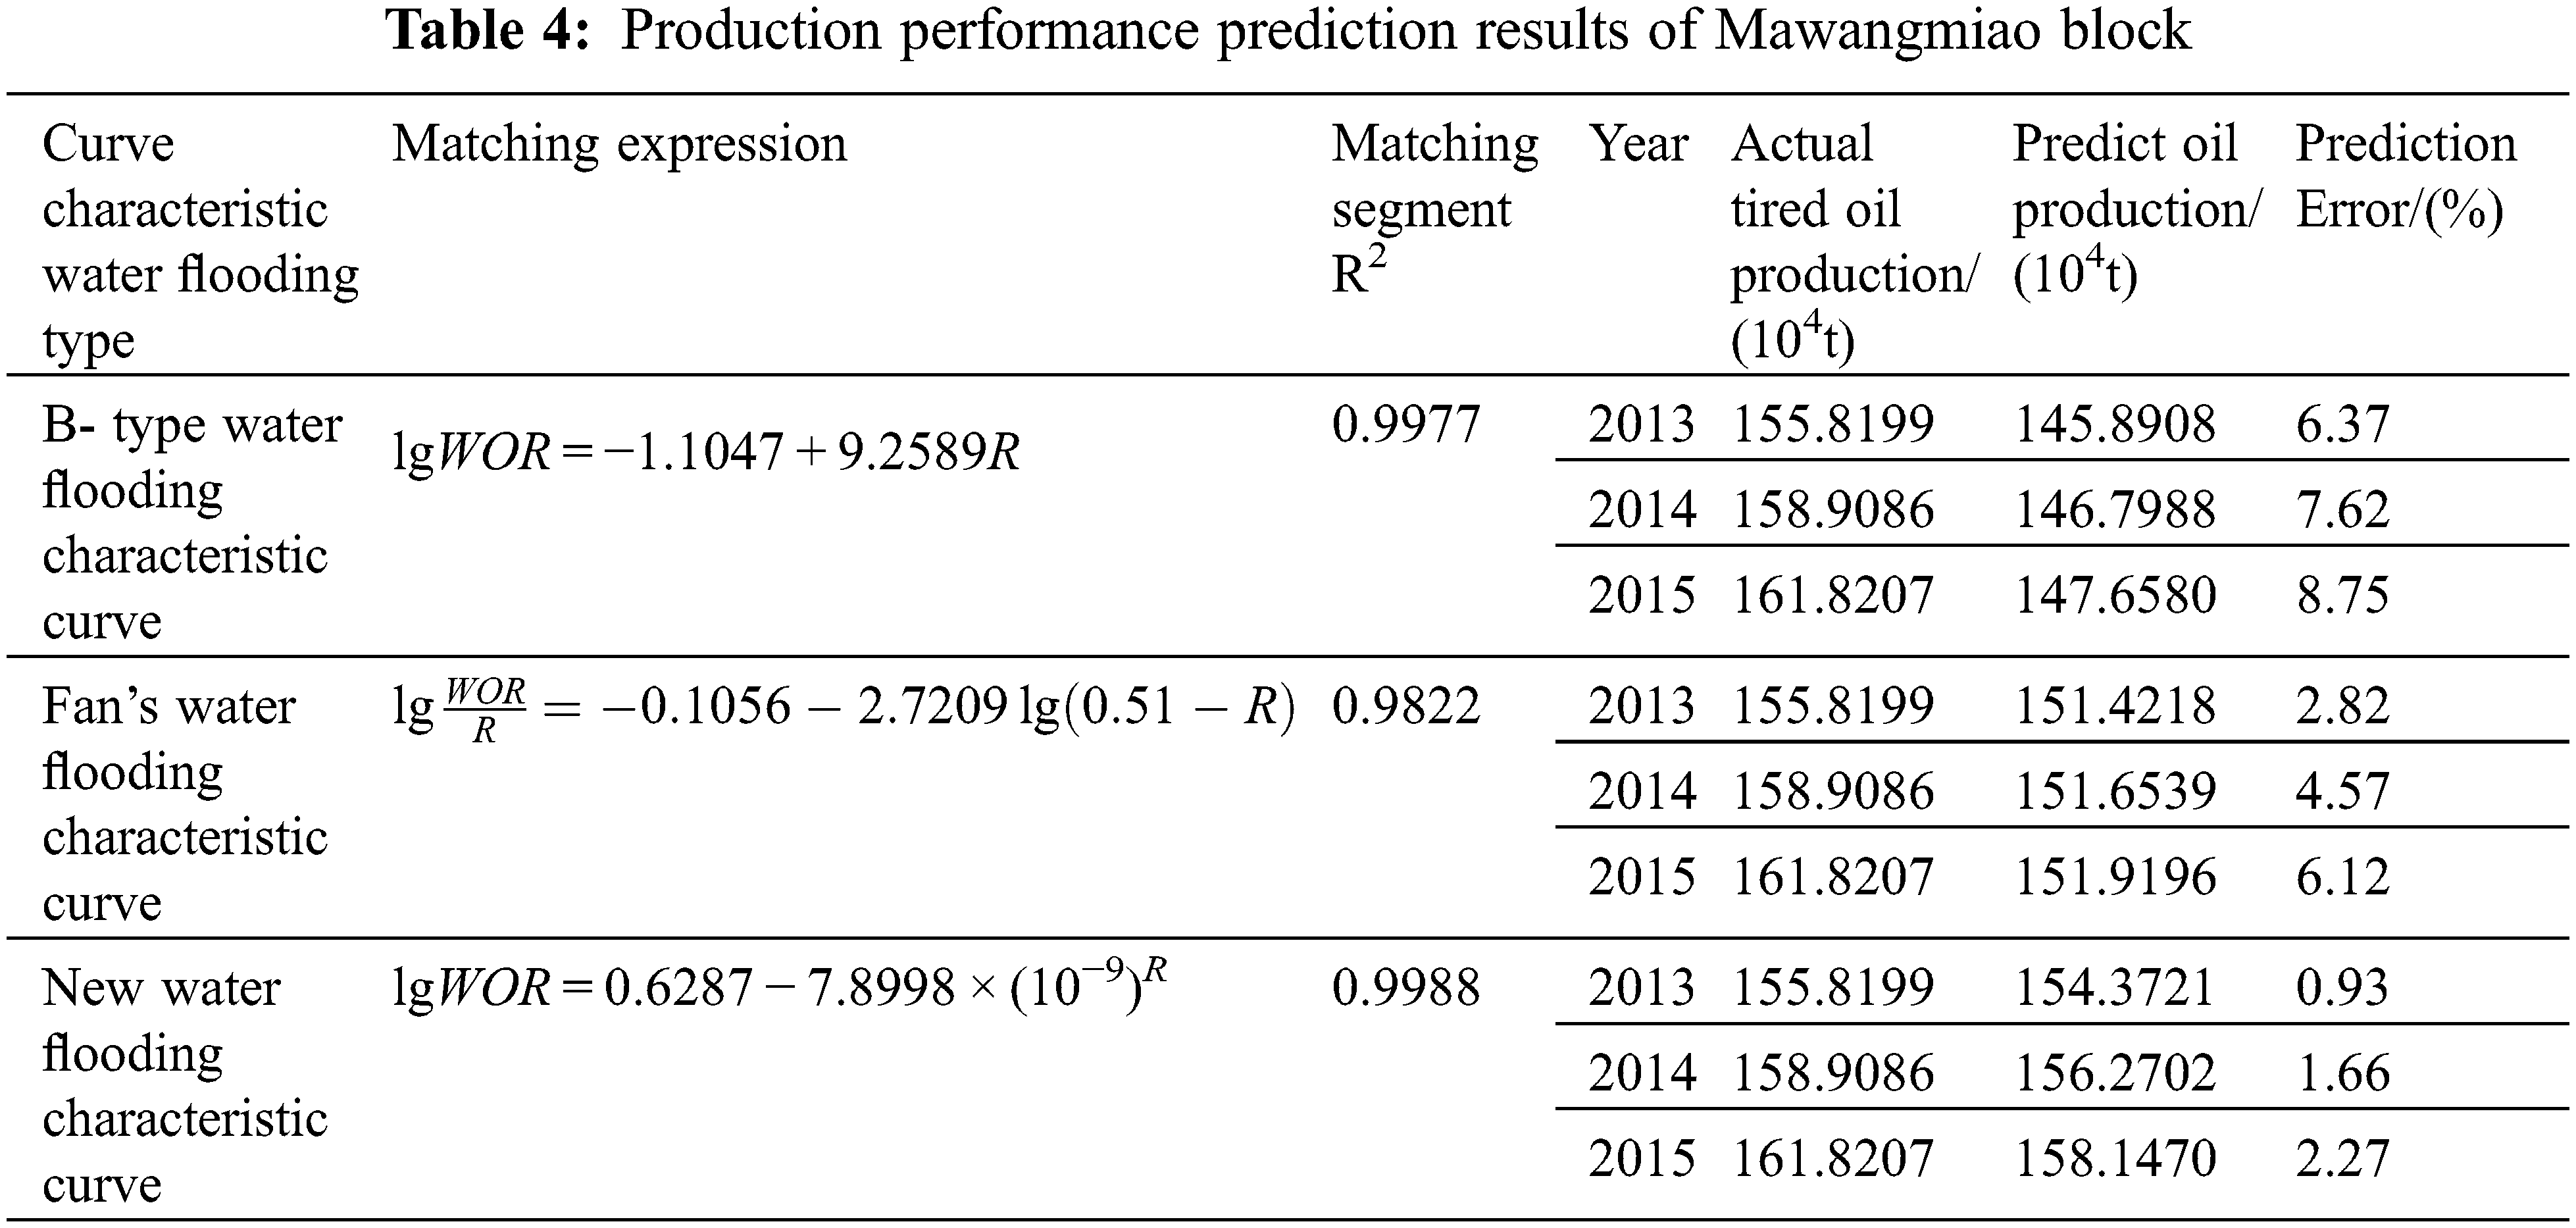
The prediction findings for the oilfield’s actual production data indicate that the relative error between the expected and actual values of the new water flooding characteristic curve is modest. Both of these values are less than the forecast error for the other two water flooding characteristic curves in the same year, indicating that the latter is better appropriate for production. As a result, the new water flooding characteristic curve described by formula (13) is more applicable at the high water cut stage. It is capable of making more accurate predictions of the waterflood development oilfield’s production dynamics after the implementation of appropriate water control measures during the high water cut phase.
4.2 Verification of Production Data in Xijiakou Block of JH Oilfield
The actual production data of the Xijiakou block in the JH oilfield is shown in Table 5.
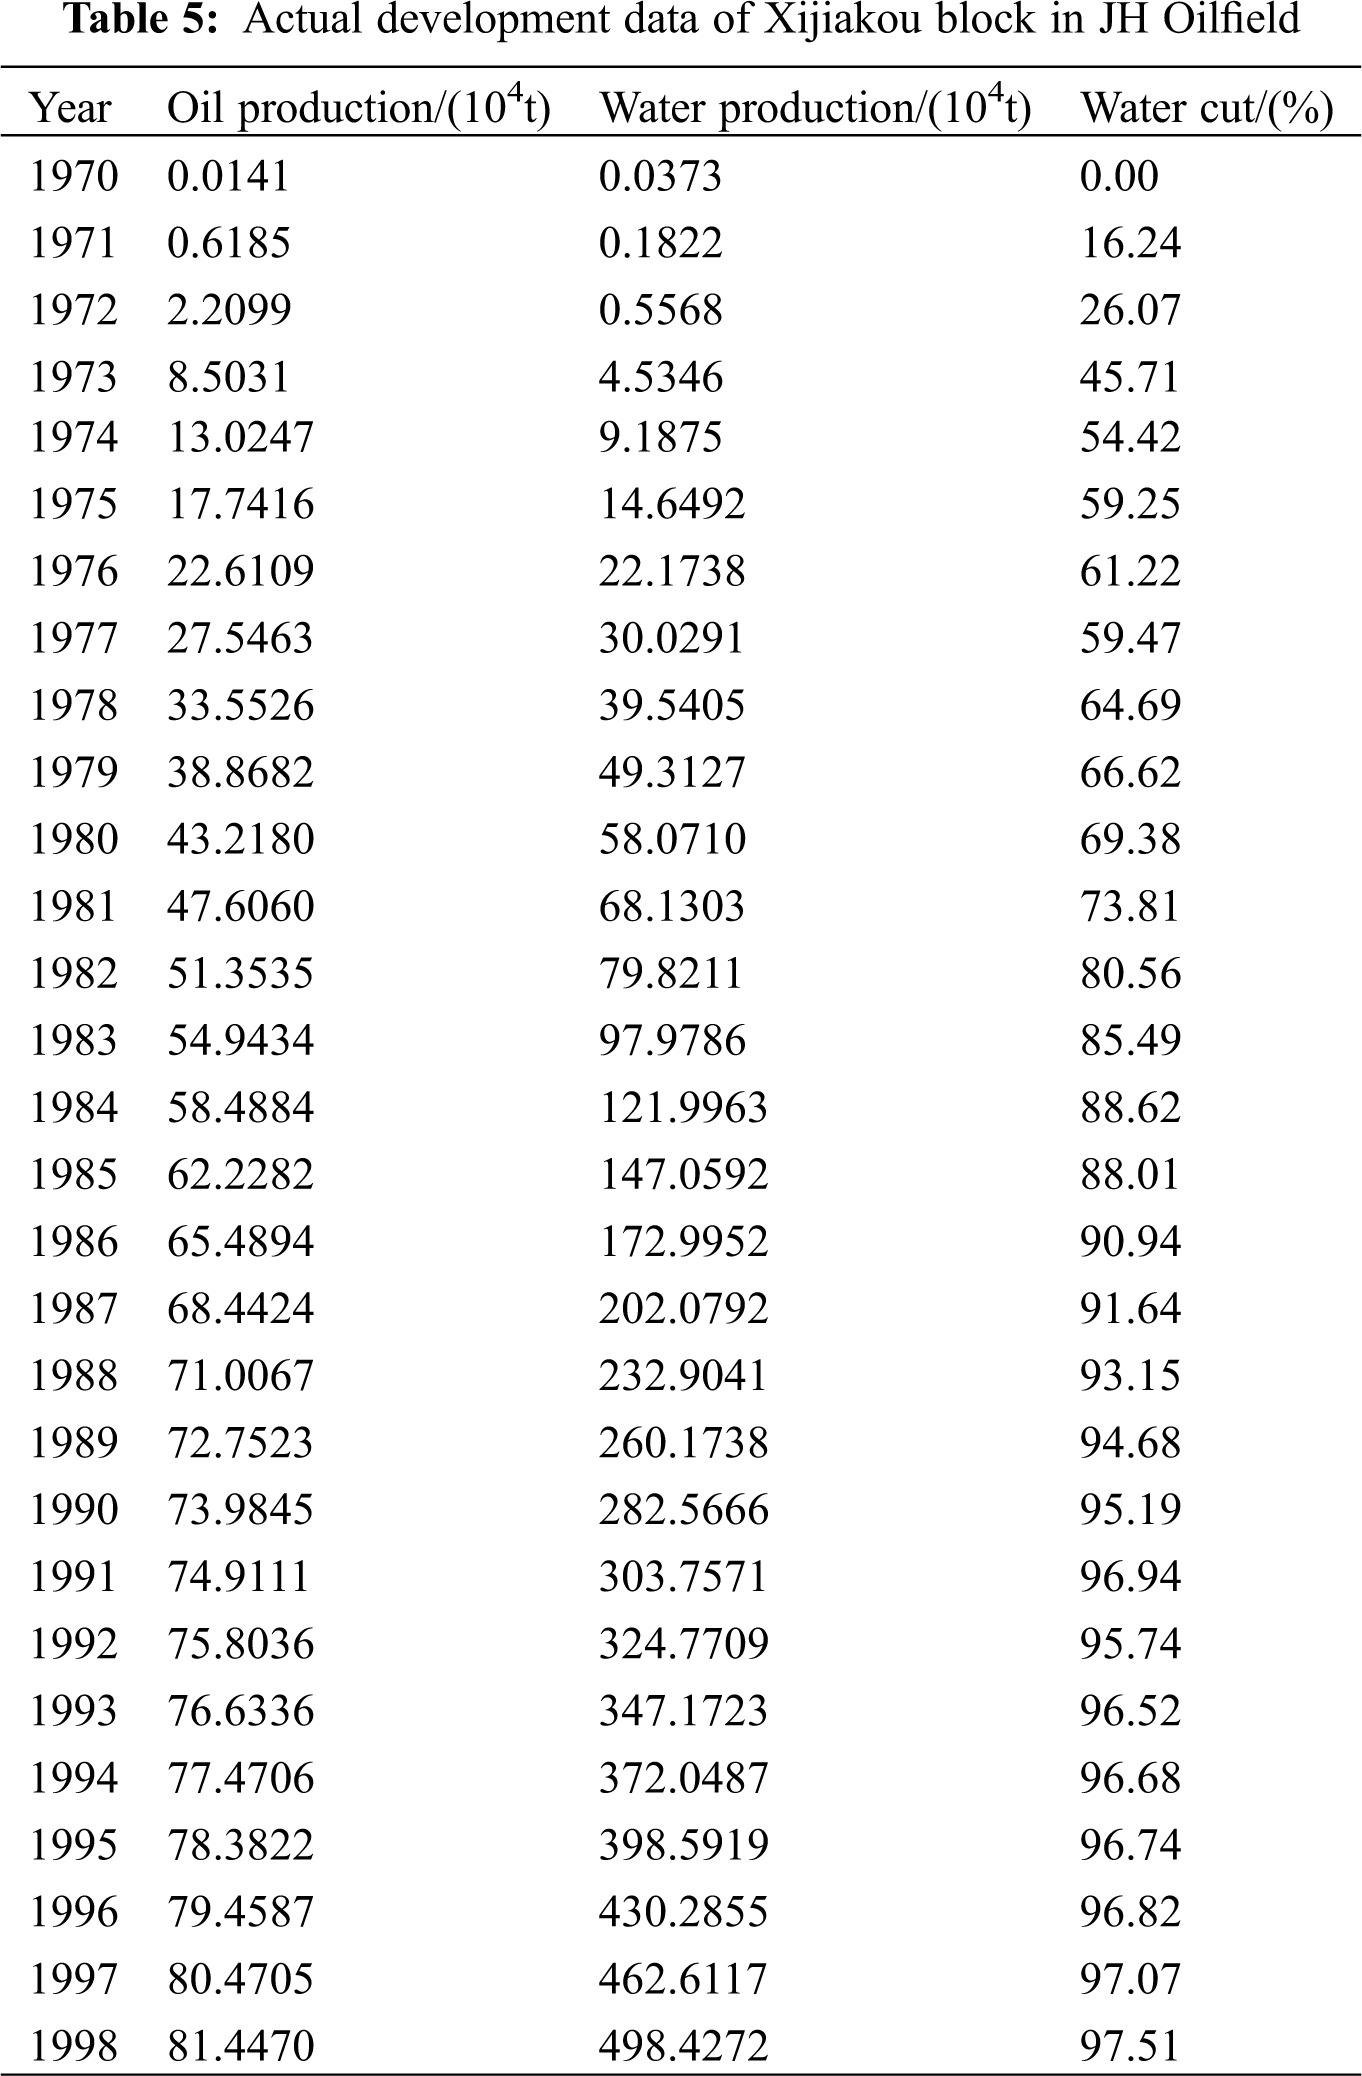
This block has a geological resource of 373.4947 * 104t, and the indoor displacement experiment is being conducted utilizing natural cores from many major production wells in the Xijiakou block. The phase permeability curve produced is normalized. According to the normalized relative permeability curve of Xijiakou oil-water, this block has a 24.5 percent interstitial oil saturation and a 30.5 percent irreducible brine saturation. When the following data is replaced into formulae (21) and (23) the moveable oil reserves are estimated to be 241.8311 *104 t.
From the data in Table 5, a relationship curve between lgWOR and Np/Nom is drawn. When cumulative oil production reaches 72.7523 * 104 t and the comprehensive water cut reaches 94.68 percent, the real lgWOR-Np/Nom curve goes upward. At the moment, the characteristic curve of B-type water flooding is utilized to match the linear data points to the 73.81 percent−94.68 percent (1981–1989) moisture content of the Xijiakou block (Fig. 8). The water cut ranges from 90.94 percent to 96.52 percent (1986–1993) when the new water flooding characteristic curve is used in the time of extreme water cut [formula (28)]. Wang [14] suggested the water flooding characteristic curve for the ultra-high water cut period. The data points are cross-referenced (Figs. 9 and 10).
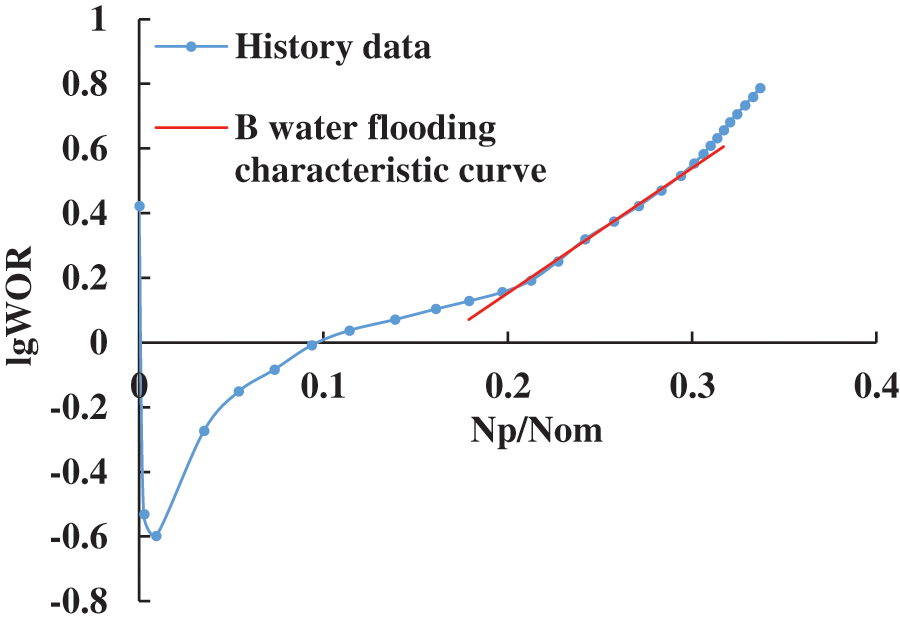
Figure 8: Type-B water drive characteristic curve of Xijiakou block
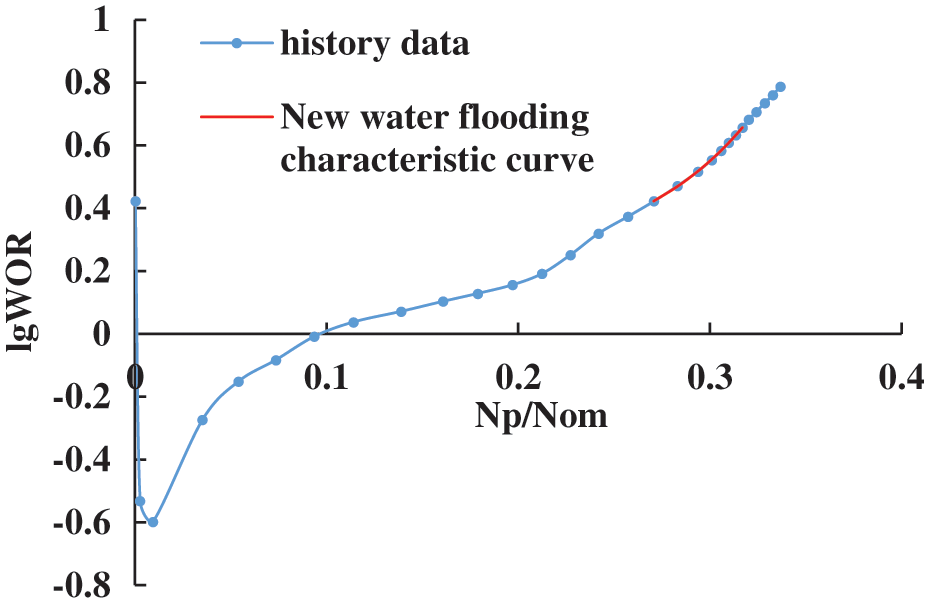
Figure 9: New water drive characteristic curve in Xijiakou block
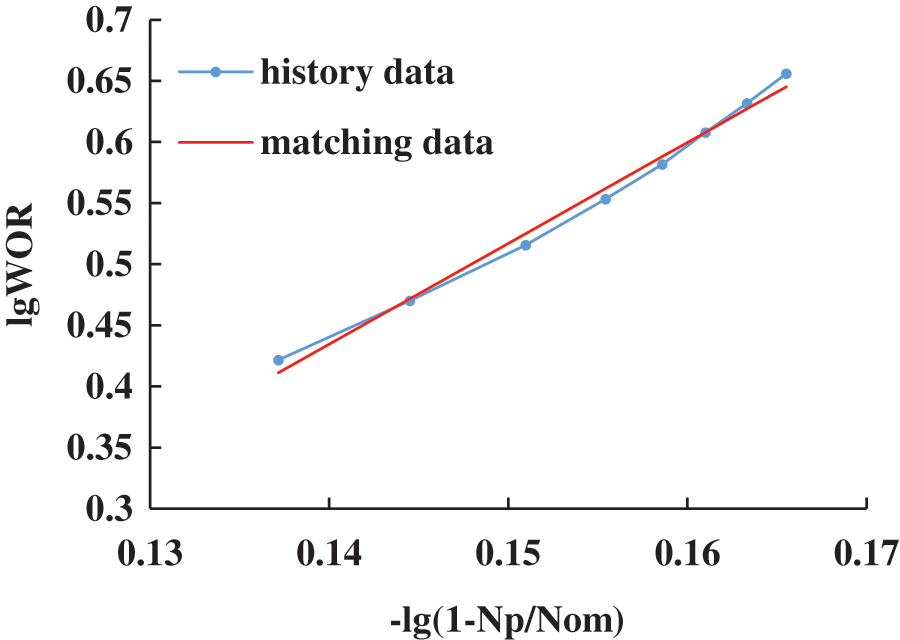
Figure 10: Wang’s [14] water drive characteristic curve in extra water cut stage
Wang provided the following formula for the typical curve of water flooding during an ultra-high water cut period:
As seen in Fig. 9, the new water flooding characteristic curve presented in this research exhibits a high degree of congruence with the upper portion of the real curve at the ultra-high water cut stage. It may more accurately portray the real curve’s variable features during the ultra-high water cut era. Three water flooding characteristic curves are used to forecast cumulative oil production from 1994 to 1998, with the resulting predictions given in Table 6.
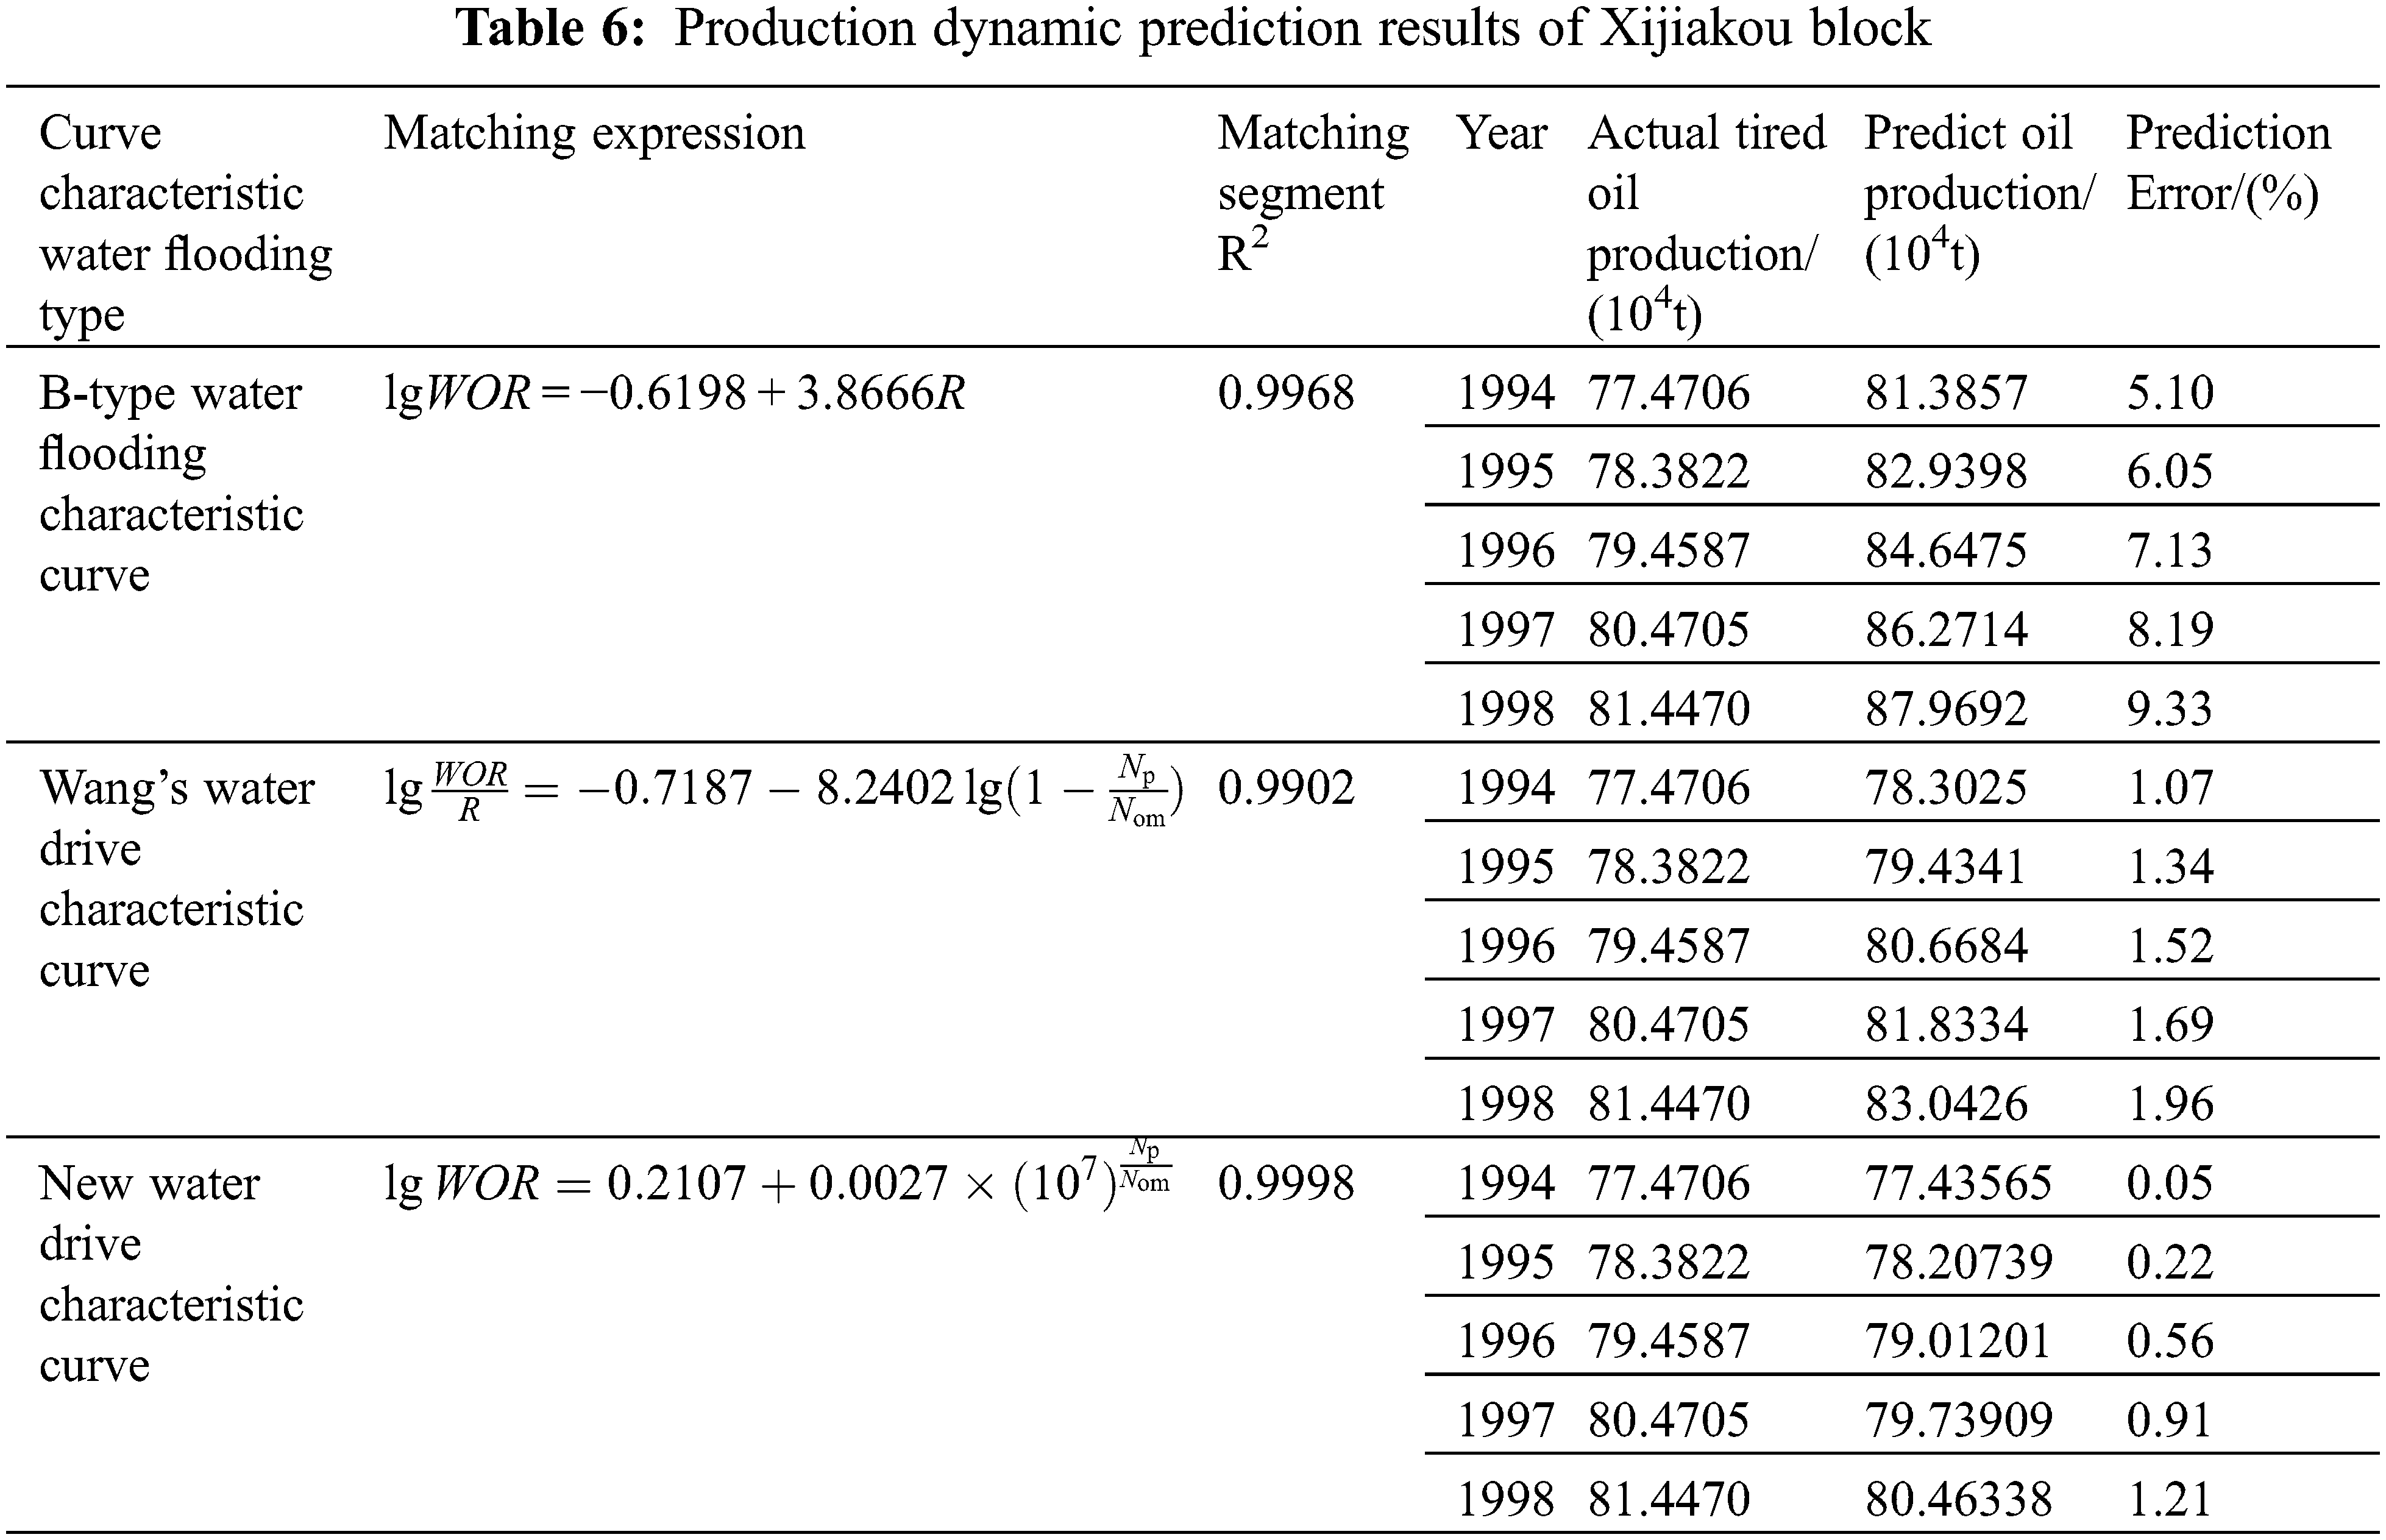
The prediction results for the oilfield’s actual production data indicate that the relative error between the expected and actual values of the new water flooding characteristic curve is modest. Both of these values are less than the forecast error for the other two water flooding characteristic curves in the same year, indicating that the latter is better appropriate for production. As a result, the revised water flooding characteristic curve given by formula (28) is more applicable at the ultra-high water cut stage. It enables more precise forecasting of the production dynamics associated with water flooding oil fields during the ultra-high water cut stage.
The recoverable reserves are projected using the matching formulas for three water flooding characteristic curves in Table 6 when fw = 98 percent and WOR = 49. The recoverable reserves anticipated by the characteristic curves of B water floods are 126.5562 * 104 t. The percentage of recovery is 33.88 percent. Wang’s water flooding characteristic curve predicts recoverable reserves of 118.4704 * 104 t. The percentage of recovery is 31.72 percent. The updated water flooding characteristic curve predicts that the recoverable reserves during the ultra-high water cut phase will be 94.6165 * 104 t. The percentage of recovery is 25.33 percent. The prediction error variation law for the three curves in Table 6 is as follows. In the ultra-high water cut phase, the recoverable reserves and recovery ratio predicted by the new water flooding characteristic curve are the most accurate. It is possible to forecast recoverable reserves and recovery ratios using this method.
(1) When the water saturation is high, the new oil-water relative permeability ratio’s characterization formula may more accurately depict the relative permeability ratio’s change rule as a function of the water saturation. The new formula for the relative permeability ratio is determined. Two novel water flooding characteristic curve formulae are developed and used for the high water cut period and the high water cut period, respectively.
(2) The form of the new characteristic curve for water flooding is dependent on the values of the matching parameters B, C, and C1. B, C, and C1 values may be used to determine the influence of water flooding development. When B > 0 and C(C1) > 1, the characteristic curve of the new water flooding exhibits an upward tendency, indicating that the water flooding has a negligible influence on development. When B > 0, C(C1) > 1, the new water flooding characteristic curve exhibits a downward bend, indicating a favorable influence on waterflooding development.
(3) Two novel water flooding characteristic curves show a strong correlation with data from oilfield production during the high water cut and ultra-high water cut periods. Correlation coefficients for the corresponding curved section are 0.9988 and 0.9998. The association is quite high, which may represent the changing rule for the distinctive curve of conventional water flooding after upward or downward bending throughout the latter stages of water injection development.
(4) Using two novel water flooding characteristic curves, we can forecast the cumulative oil production in the real JH oilfield block during high and ultra-high water cut phases. The percentage error between expected and actual oil production is smaller than the forecast error for B and the other two high water cut phases for the same year. The new water flooding characteristic curve is very applicable during situations of high water cut and extremely high water cut. It is capable of forecasting the dynamic production, recoverable reserves, and ultimate recovery efficiency of oilfields that have been flooded with water.
Funding Statement: It is supported by the National Natural Science Foundation of China (No. 51404037); supported by the Scientific and Technological Research Project of Sinopec Jianghan Oilfield Branch Company (No. ZKK0220006).
Conflicts of Interest: The authors declare that there are no conflicts of interest.
1. Dicks, E. M. (1993). Higher order godunov black-oil simulations for compressible flow in porous media. Citeseer. https://citeseerx.ist.psu.edu/viewdoc/download?doi=10.1.1.224.6132&rep=rep1&type=pdf. [Google Scholar]
2. Alwated, B., El-Amin, M. F. (2021). Enhanced oil recovery by nanoparticles flooding: from numerical modeling improvement to machine learning prediction. Advances in Geo-Energy Research, 5(3), 297–317. DOI 10.46690/ager. [Google Scholar] [CrossRef]
3. Behmanesh, H., Clarkson, C. R., Tabatabaie, S. H., Heidari Sureshjani, M. (2015). Impact of distance-of-investigation calculations on rate-transient analysis of unconventional gas and light-oil reservoirs: New formulations for linear flow. Journal of Canadian Petroleum Technology, 54(6), 509–519. DOI 10.2118/178928-PA. [Google Scholar] [CrossRef]
4. Lai, N., Tang, L., Jia, N., Qiao, D., Chen, J. et al. (2019). Feasibility study of applying modified nano-SiO2 hyperbranched copolymers for enhanced oil recovery in low-mid permeability reservoirs. Polymers, 11(9), 1483. DOI 10.3390/polym11091483. [Google Scholar] [CrossRef]
5. Mohammadi, S., Ehsani, M. R., Nikookar, M., Sahranavard, L., Soleimani Garakani, A. (2012). Study of steam injection in a fractured carbonate heavy oil reservoir in Iran. SPE Heavy Oil Conference CanadaCalgary, Alberta, Canada. DOI 10.2118/144943-MS. [Google Scholar] [CrossRef]
6. Zhu, L., Zhang, C., Zhang, Z., Zhou, X. (2020). High-precision calculation of gas saturation in organic shale pores using an intelligent fusion algorithm and a multi-mineral model. Advances in Geo-Energy Research, 4(2), 135–151. DOI 10.26804/ager. [Google Scholar] [CrossRef]
7. Shivanian, E. (2017). Local radial basis function interpolation method to simulate 2D fractional-time convection-diffusion-reaction equations with error analysis. Numerical Methods for Partial Differential Equations, 33(3), 974–994. DOI 10.1002/num.22135. [Google Scholar] [CrossRef]
8. Suri, Y., Islam, S. Z., Stephen, K., Donald, C., Thompson, M. et al. (2020). Numerical fluid flow modelling in multiple fractured porous reservoirs. Fluid Dynamics & Materials Processing, 16(2), 245–266. DOI 10.32604/fdmp.2020.06505. [Google Scholar] [CrossRef]
9. Zhao, H., Kang, Z., Zhang, Y., Sun, H., Li, Y. (2014). An interwell connectivity numerical method for geological parameter characterization and oil-water two-phase dynamic prediction. Acta Petrolei Sinica, 35(5), 922–927. DOI 10.7623/syxb201405012. [Google Scholar] [CrossRef]
10. Sayarpour, M. (2008). Development and application of capacitance-resistive models to water/carbon dioxide floods. The University of Texas at Austin. [Google Scholar]
11. Liu, P., Mu, Z., Wang, W., Liu, P., Hao, M. (2017). A new combined solution model to predict water cut in water flooding hydrocarbon reservoirs. International Journal of Hydrogen Energy, 42(29), 18685–18690. DOI 10.1016/j.ijhydene.2017.04.166. [Google Scholar] [CrossRef]
12. Sun, J., Liu, D., Zhu, X., Huang, W., Cheng, L. (2020). Experimental investigation on the pressure propagation mechanism of tight reservoirs. Fluid Dynamics & Materials Processing, 16(3), 425–-440. DOI 10.32604/fdmp.2020.08531. [Google Scholar] [CrossRef]
13. Rao, X., Zhan, W., Zhao, H., Xu, Y., Liu, D. et al. (2021). Application of the least-square meshless method to gas-water flow simulation of complex-shape shale gas reservoirs. Engineering Analysis with Boundary Elements, 129, 39–54. DOI 10.1016/j.enganabound.2021.04.018. [Google Scholar] [CrossRef]
14. Wang, J., Shi, C., Ji, S., Li, G., Chen Y. (2017). New water drive characteristic curves at ultra-high water cut stage. Petroleum Exploration and Development, 44(6), 1010–-1015. DOI 10.1016/S1876-3804(17)30113-1. [Google Scholar] [CrossRef]
15. van Doren, J. F., Markovinović, R., Jansen, J. D. (2006). Reduced-order optimal control of water flooding using proper orthogonal decomposition. Computational Geosciences, 10(1), 137–158. DOI 10.1007/s10596-005-9014-2. [Google Scholar] [CrossRef]
16. Freeze, R. A. (1980). A stochastic-conceptual analysis of rainfall-runoff processes on a hillslope. Water Resources Research, 16(2), 391–408. DOI 10.1029/WR016i002p00391. [Google Scholar] [CrossRef]
17. Liu, S., Gu, J., Yang, R., (2011). New water-flooding characteristic curve at high water-cut stage. Journal of Liaoning Technical University, 30(S1), 158–163. [Google Scholar]
18. Feng, Q., Zhang, J., Wang, S., Wang, X., Cui, R. et al. (2017). Unified relative permeability model and waterflooding type curves under different levels of water cut. Journal of Petroleum Science Engineering, 154, 204–216. DOI 10.1016/j.petrol.2017.04.031. [Google Scholar] [CrossRef]
19. Fan, H. J., Zhu, X. Q. (2016). Derivation and application of new water flooding characteristic curve in high water-cut oilfield. Fault-Block Oil & Gas Field, 23(1), 105–108. DOI 10.6056/dkyqt201601023. [Google Scholar] [CrossRef]
 | This work is licensed under a Creative Commons Attribution 4.0 International License, which permits unrestricted use, distribution, and reproduction in any medium, provided the original work is properly cited. |