| Fluid Dynamics & Materials Processing |
DOI: 10.32604/fdmp.2022.019007
ARTICLE
Simulation Analysis of Ammonia Leakage and Dispersion in a Large-Scale Refrigeration System
1Tianjin Key Laboratory of Refrigeration Technology, Tianjin University of Commerce, Tianjin, 300134, China
2International Trade Engineering Design Institute, Beijing, 100037, China
3Tianjin Tengsheng Technology Co., Ltd., Tianjin, 300380, China
*Corresponding Author: Kaiyong Hu. Email: hky422@tjcu.edu.cn
Received: 29 August 2021; Accepted: 09 November 2021
Abstract: The use of ammonia in large-scale refrigeration systems (such as those used for a stadium) requires adequate ammonia leakage prevention mechanisms are put in place. In the present study, numerical simulations have been conducted to study the dispersion law in the ammonia machinery room of the refrigeration system for the 2022 Beijing Winter Olympics. The wind speed, and release location have been varied to investigate their effects on the dispersion profile. Different positions of the leakage points in the ammonia storage tank have been found to lead to different areas affected accordingly. In general, the dangerous region area decreases with an increase in the wind speed. However, when the wind is aligned with the leakage direction, this trend is reverted. The study may offer an effective method to predict the impact of ammonia dispersion and implement the safe operation of such large-scale systems.
Keywords: Numerical simulation; ammonia diffusion; leakage location; ventilation
Nomenclature
| Latin symbols | |
| u | X direction speed |
| v | Y direction speed |
| w | Z direction speed |
| F1,2 | Model blending functions |
| μ | Dynamic viscosity |
| k | Total turbulent kinetic energy |
| | Rate of production of ω |
| PK | Rate of production of k |
| Yi | Local mass fraction of each species |
| Ji | The diffusion flux of species |
| Ri | The net rate of production of species |
| Si | The rate of creation by addition from the dispersed phase plus any user-defined sources |
| Greek symbols | |
| ρ | Density |
| β | Turbulent model constant |
| δij | Kronecker’s delta |
| κ | Von Karman constant |
| | Laminar and turbulent eddy viscosities |
| ω | Specific turbulent dissipation rate |
| σk,ω | Turbulent Schmidt number |
As a natural working fluid, ammonia has the advantages of large unit refrigeration capacity, low cost, and moderate pressure. The widespread use of ammonia includes its application in large refrigeration, food preservation, and chemical industries [1,2]. However, improper use of ammonia causes serious consequences because of its flammability, explosive capacity, and toxicity. According to statistics, 193 ammonia poisoning and explosion accidents occurred from 2007 to 2019 because of ammonia leakage, of which more than 200 people died, and more than 3,500 people were poisoned or injured. Ammonia poisoning accidents far outnumbered ammonia explosion accidents [3–5]. Therefore, protective measures need must be considered when designing ammonia refrigeration to ensure safety [6].
Rémy et al. [7] conducted experiments on ammonia leakage from a 6-ton liquid ammonia storage tank under different impact conditions. However, the diffusion behavior of ammonia remains difficult to predict because of the lack of experimental data on the passive diffusion of ammonia under different environments. Mark et al. [8] used two atmospheric dispersion models, ADMS and AERMOD, to predict the monthly and annual average concentrations within 1 km of the farm. The predicted values were compared with experimental values. The atmospheric concentration predicted by AERMOD is higher than that of ADMS (by 6–7 times on average). In addition, the predicted atmospheric concentrations in monthly and annual simulations by the former are more accurate than the latter. Galeev et al. [9] showed a mathematical model to analyze numerically the effects of wind speed and obstacles on evaporation characteristics and toxic dose distribution. Naserzadeh et al. [10] conducted a simulation study on the ammonia leakage accident at the South pars terminal in the Asalooge area of Iran for the first time. The results show that in the event of an ammonia leak, the area around the port will not be affected by the lethal concentration. Zhang et al. [11] showed a phase change model for evaporating liquid ammonia and found that diffusing ammonia is affected by its source conditions and atmospheric environment. Wu et al. [12] showed a physical model of the leakage of ammonia pipelines in the cold storage of food enterprises, performed a simulation analysis of the ammonia laser detection performance for the open optical path, and proposed the best detection distance.
The present study aims to assess the influence of ventilation on ammonia leakage at different locations, analyze the mixing degree and concentration changes of ammonia gas cloud after the leak, and provide recommendations on the emergency treatment in the event of ammonia storage tank leak in the snowmobile sled locations in 2022 Beijing Winter Olympics.
Based on the finite volume methods, the commercial CFD code Ansys Fluent 16.2 (hereafter referred to as Fluent) (Ansys, 2016) was used to solve the governing equations. In this study, we seek to solve the relationship between ammonia leakage flow and diffusion concentration, so we use the Euler method. We define this problem as a steady-state problem and use the semi-implicit method of the Pressure Relation Equation Solver (SIMPLE) to solve it.
The control volume of the fluid element is analyzed through the Euler Cartesian coordinate system. The mass conservation equation is as follows:
In the study, the ammonia gas is assumed to be an incompressible fluid. The continuity equation is as follows:
In the process of ammonia diffusion, it is assumed that the fluid viscosity is constant and incompressible. The momentum conservation equation is as follows:
San et al. [13] verified and compared different turbulence models, as shown in Fig. 1. After comparing the calculation results of each model with the experimental data, they determined that SST k-ω turbulence model can have relatively good calculation accuracy when the calculation cost is moderate. Therefore, this study uses SST k-ω model to simulate the diffusion of ammonia after a leak.
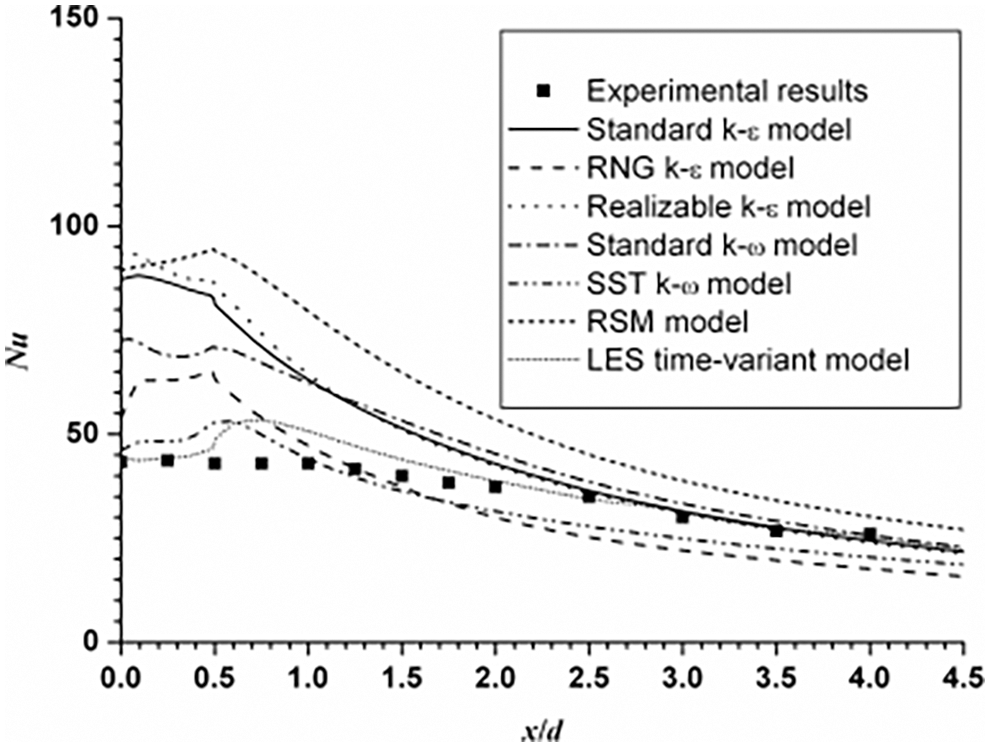
Figure 1: Nussel number distribution of different turbulence models along the flow direction
SST k − ω equation [14] of the turbulence model is as follows:
Among them, P is the turbulence generating term, and the expression is:
where δij is Kronecker’s delta. The kinematic eddy-viscosity νT is calculated as:
where a1 = 0.31 and
where ν is the kinematic viscosity. The model coefficients in Eqs. (6) and (7) are obtained from:
with the following values:
The coefficient γ is calculated from:
with the following values:
The component transport model uses species transport model provided by Fluent [15]:
In this study, we aim to analyze the influence factor of the diffusion of ammonia gas after it leaks from the liquid storage tank. The following conditions are set as the basic assumptions [16–18], which are convenient for analyzing the influence of wind speed and leak position on the diffusion:
1. The gases in the simulation are ideal gases.
2. Only the mixing and concentration distributions about the leaking gas and air are considered.
3. The average motion of air particles is regarded as the motion of incompressible fluid, which is a turbulent state.
4. The temperature is constant at 300 K, and ignoring the heat exchange that might occur during leakage.
5. Ammonia gas leakage is continuous and constant.
6. Wind speed remains uniform and constant.
7. The gravitational acceleration in the study area takes a constant value of g = 9.8 m/s2.
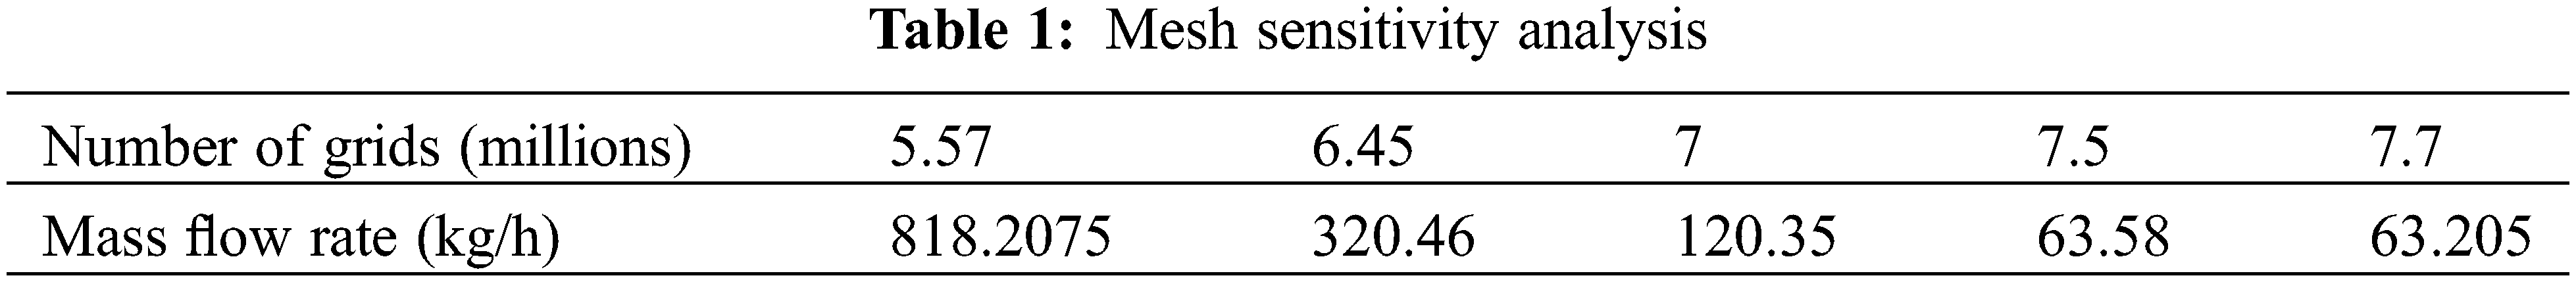
The size of the domain is 50 m × 20 m × 10 m. The storage tank is a cylinder with a length of 5 m and a radius of 1 m. The lower part is 1 m from the ground. The liquid ammonia storage tank is placed at the center of the refrigeration plant room. The leak locations of the liquid ammonia storage tank are located at the top, bottom, and left sides of the storage tank. Table 1 shows the mass flow rate of ammonia at the Y = 0 section under different grid numbers. After the grid independence is verified, the model in this study uses 7.5 million grids for calculation. Fig. 2 shows the computational model meshing.
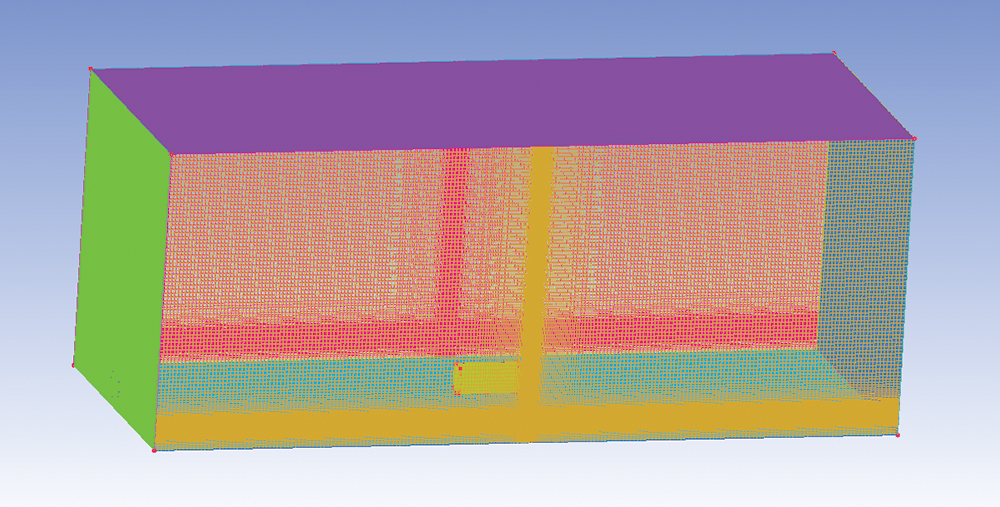
Figure 2: Computational model meshing
This study analyzes the bobsleigh place for the 2022 Beijing Winter Olympics. The core area of the Yanqing competition area for the 2022 Beijing Winter Olympics is located at the southern foot of Xiaohaituo, south of Jundu Mountain in the Yanshan Mountains. The National Snowmobile and Sled Center project site is located at the central ridge of the southern area of the core area of the Yanqing cluster of 2022 Beijing Winter Olympics. The ammonia refrigerating plant room of the track is located at the southern end of the lowest point of the track, and the training track igloo is set at the west side of the ammonia refrigerating machine room. Fig. 3 shows the plan view of the refrigerating plant room.
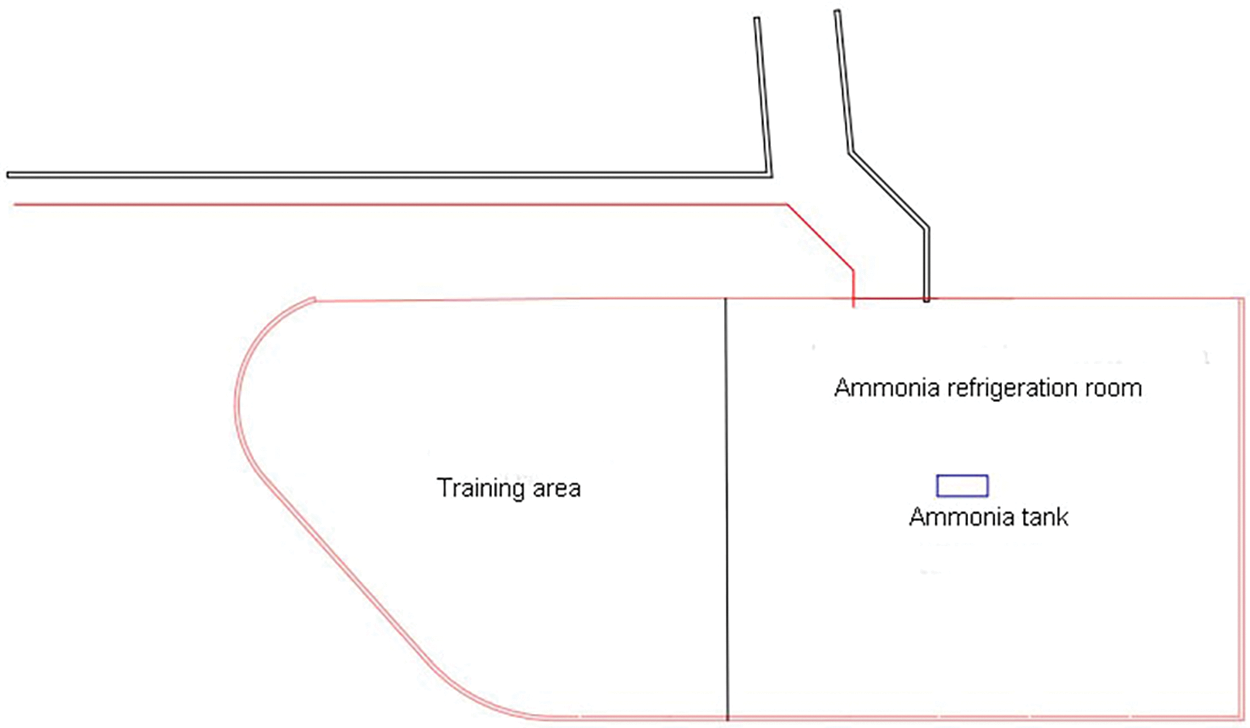
Figure 3: Plan view of the refrigerating plant room
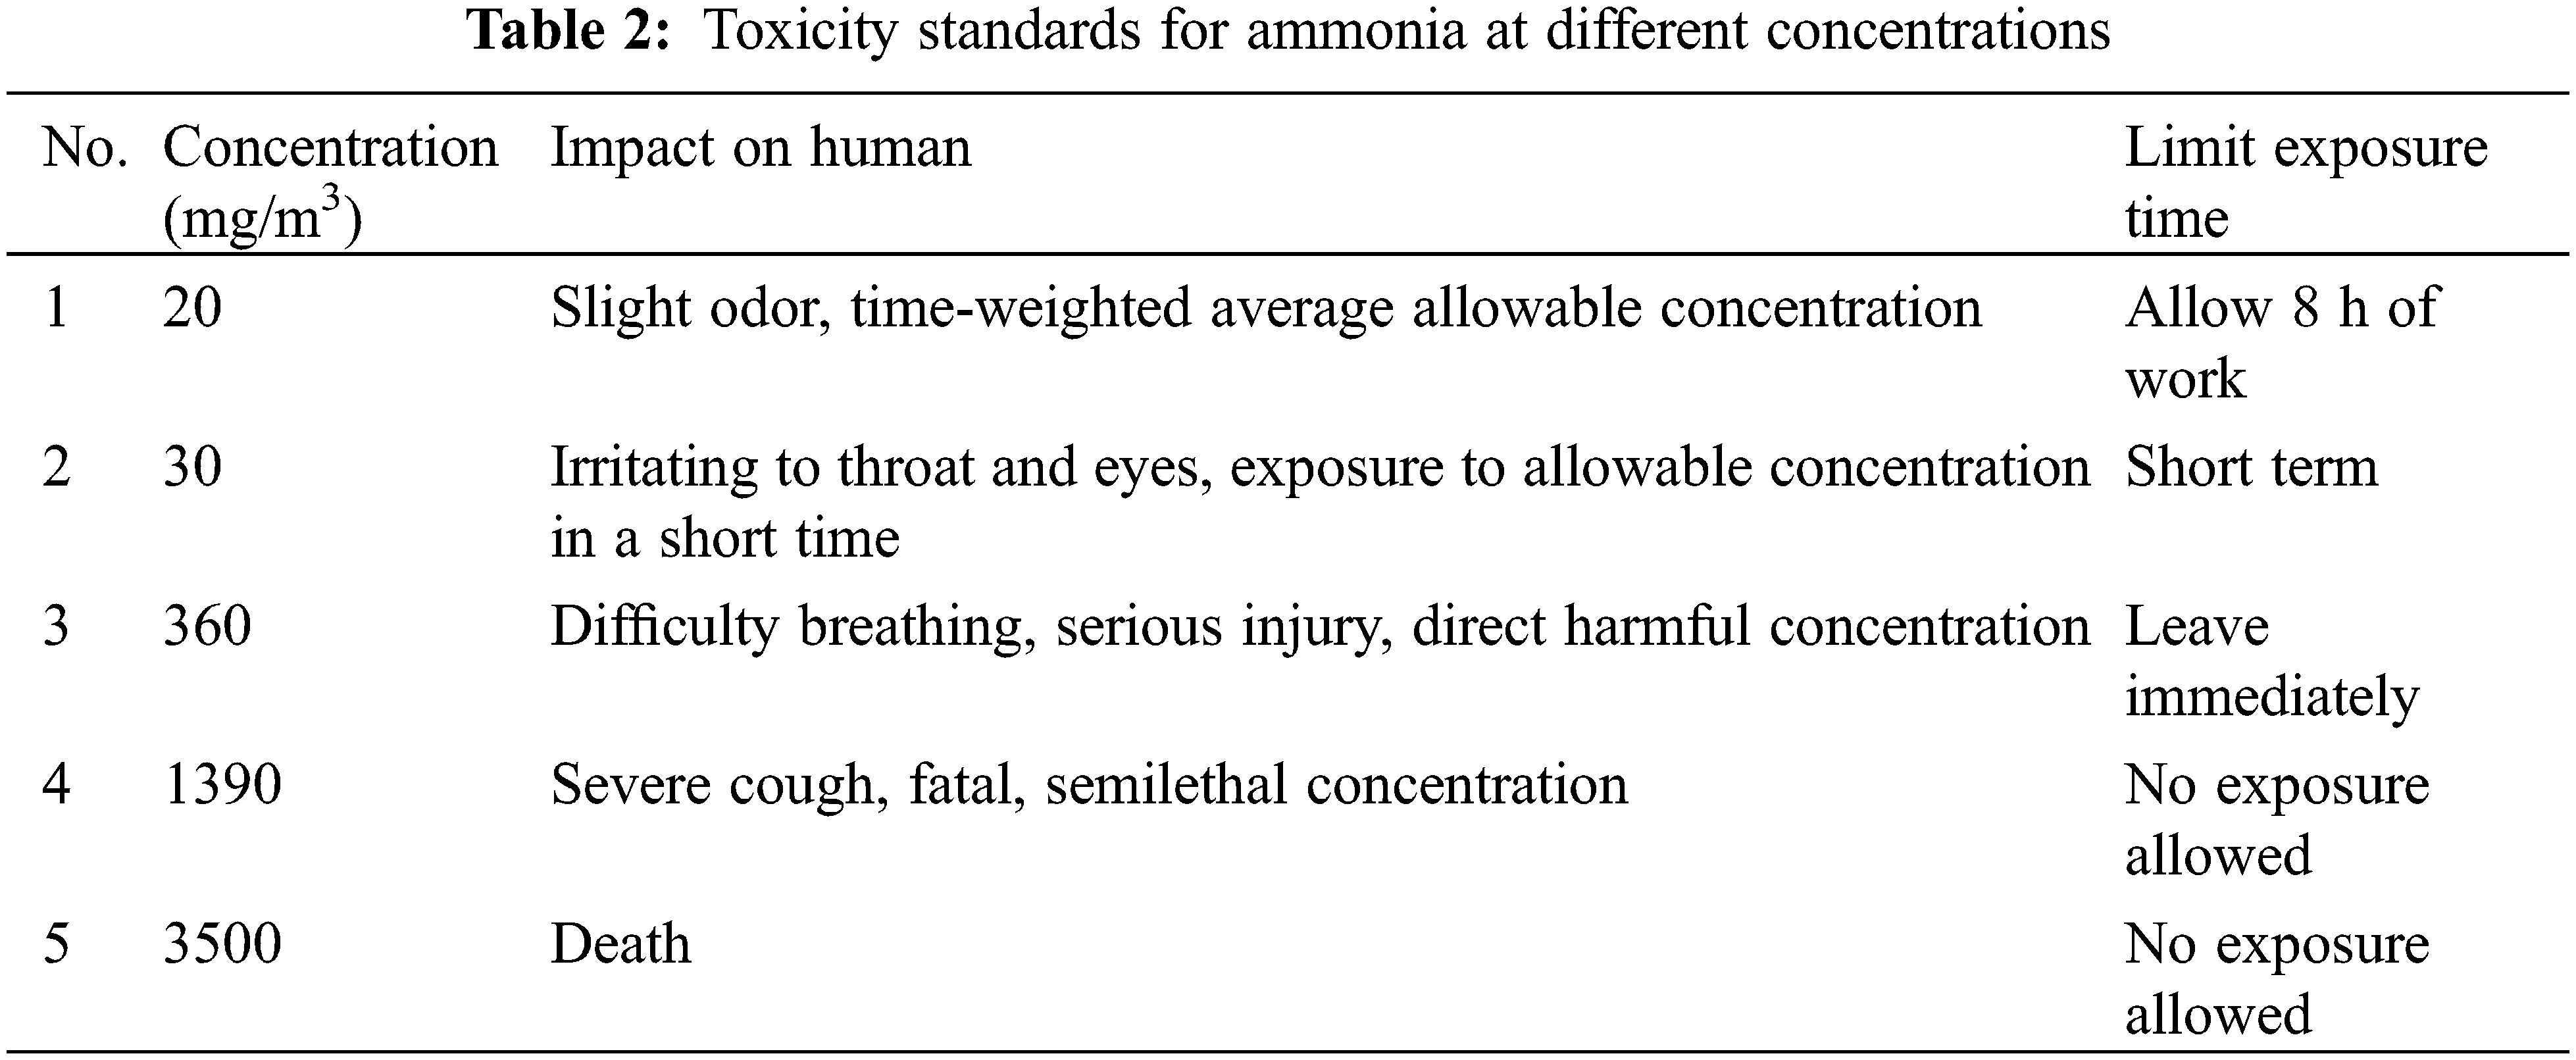
The explosive limit of ammonia is 15.7% to 27.4%. It dissolves easily in water and forms an alkaline solution of ammonium hydroxide [19]. According to the rules of the Occupational Exposure Limits for Hazardous Factors in the Workplace, the maximum allowable concentration of ammonia in the air in the workplace is 30 mg/m3, indicating that ammonia diffusion during work or the highest concentration value does not produce certain physiological conditions or pathological changes [20]. Table 2 shows the irritation degree and toxicity standards of different concentrations of ammonia on the health and safety of workers.
In this study, the ammonia leakage in the ammonia refrigeration of the sled locations for the 2022 Beijing Winter Olympics is simulated, and suggestions for disposal of the places after the ammonia leakage occurs are provided.
3.1 Comparison with Field Experiments
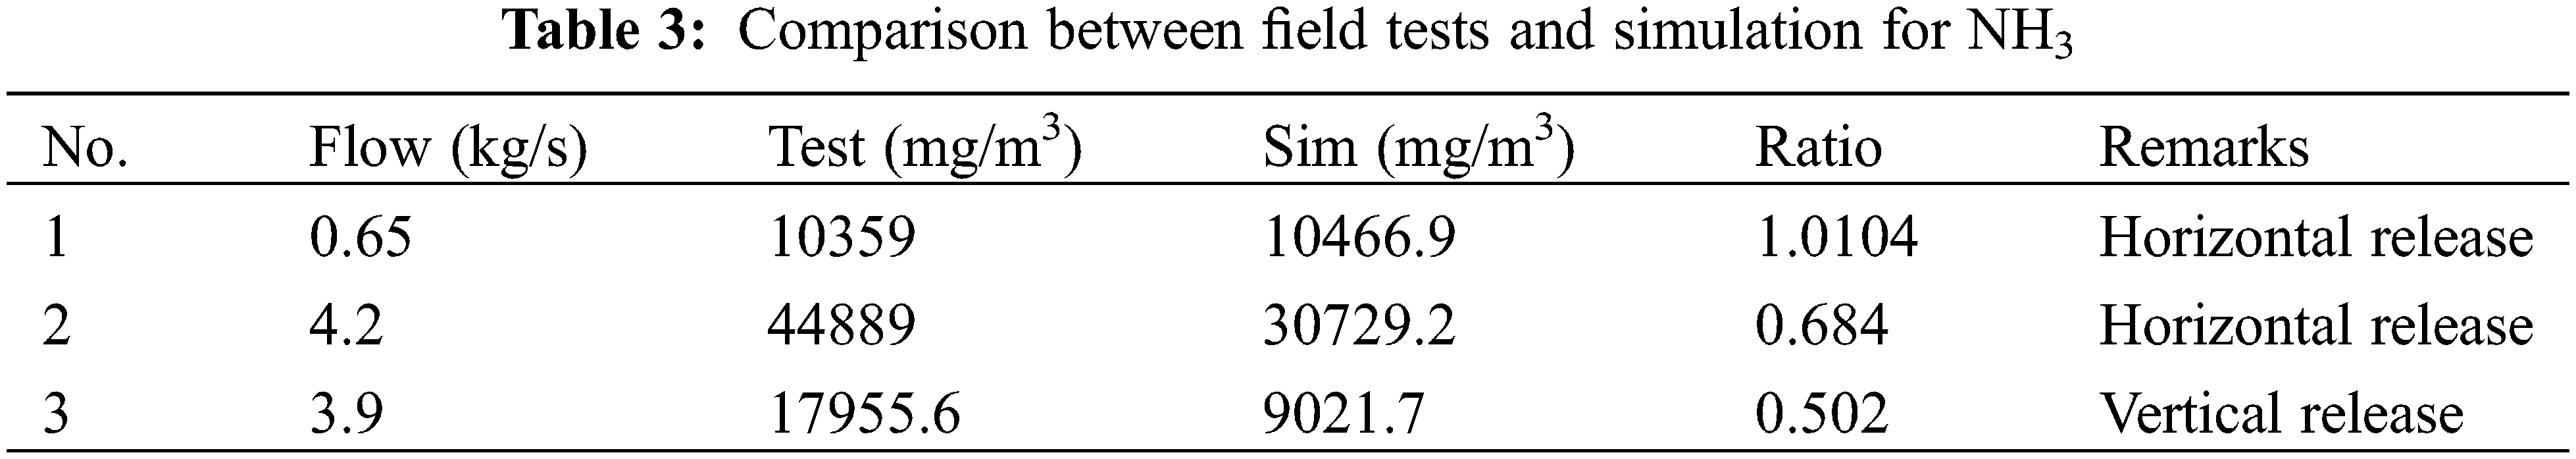
Table 3 shows the results of the field test [21] and the simulation for ammonia leaks. From the comparison of the concentrations at three locations at 1 m height, the ratios between Test and the simulation were 0.502–1.0104, which is reasonable.
In this study, the wind is set to blow horizontally along the positive direction of the X-axis, the leakage flow is m = 5 kg/s, and the surrounding wind speed, c, is 0, 3, 6, and 9 m/s, with Y = 0 m and X = −10, 2, 10, 18 m concentration distribution diagram for analysis.
3.2 Leak Located at the Top of the Tank
Fig. 4 shows the distribution diagram of ammonia diffusion concentration after it leaks from the top of the storage tank when the surrounding wind speed is 0 m/s. The overall ammonia diffusion is sprayed. The density of ammonia is lower than that of air. When no external force exists, the two intermix freely, and the leaked high-concentration ammonia cannot be diffused easily to low concentration.
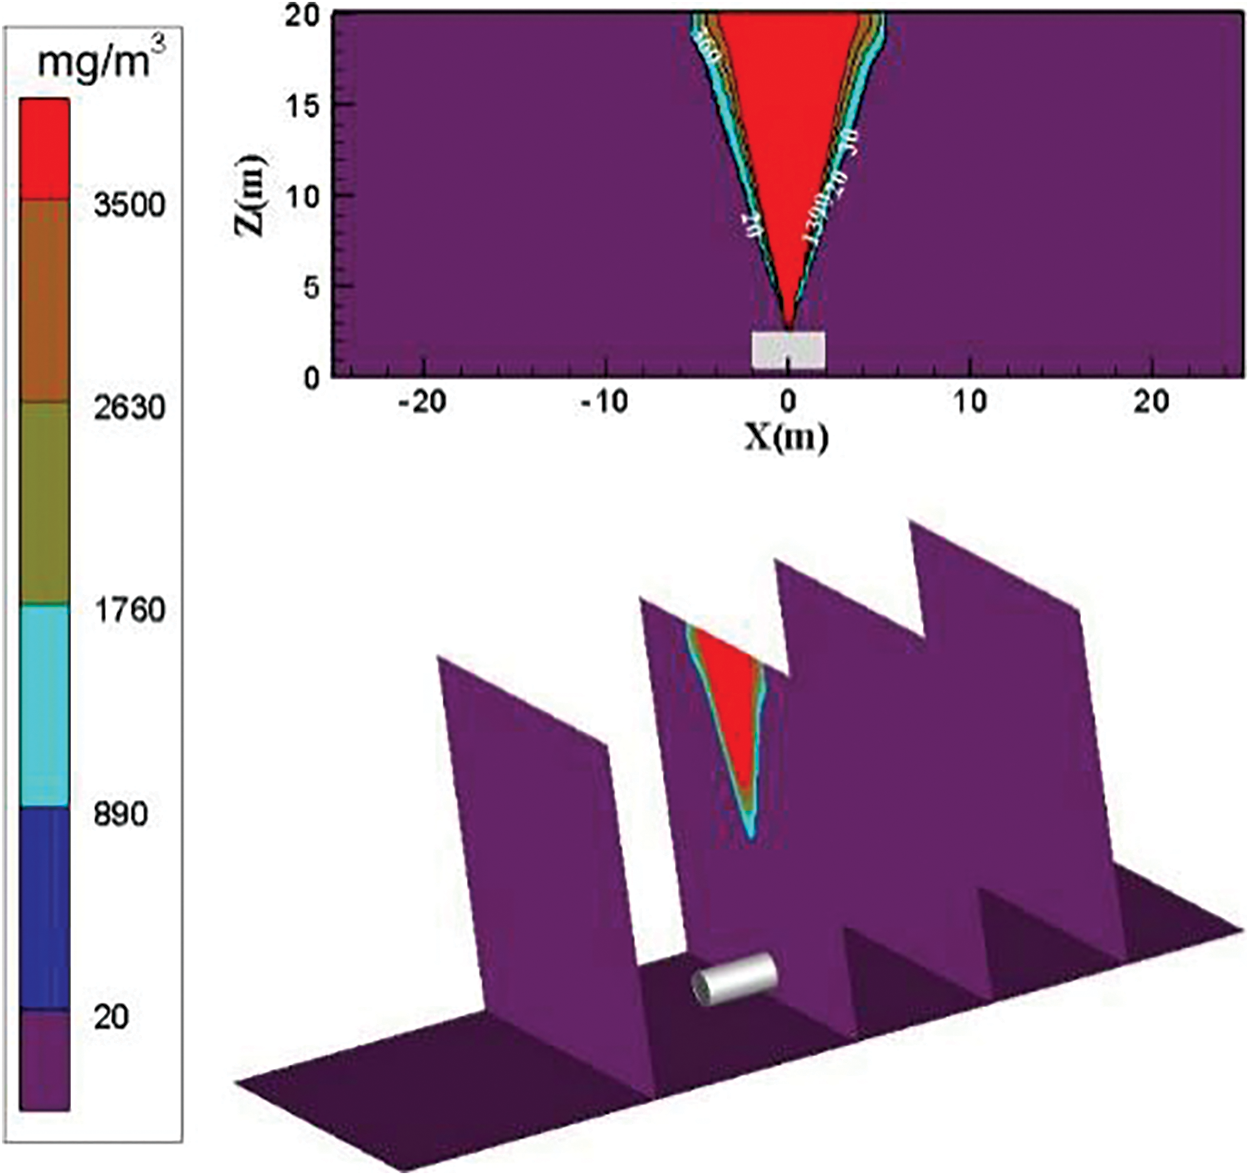
Figure 4: Distribution diagram of ammonia diffusion concentration; leak is located at the top of the tank; m = 5 kg/s, c = 0 m/s
The distribution diagram of ammonia diffusion concentration is reported in Fig. 5 when the surrounding wind speed increases to 3 m/s. No obvious change occurs in diffusing ammonia gas cloud above the concentration threshold of 3500 mg/m3. The diffusion area of low-concentration ammonia gas in the downwind direction increases substantially. As the diffusion distance increases, the diffusion area of low-concentration ammonia gas increases.
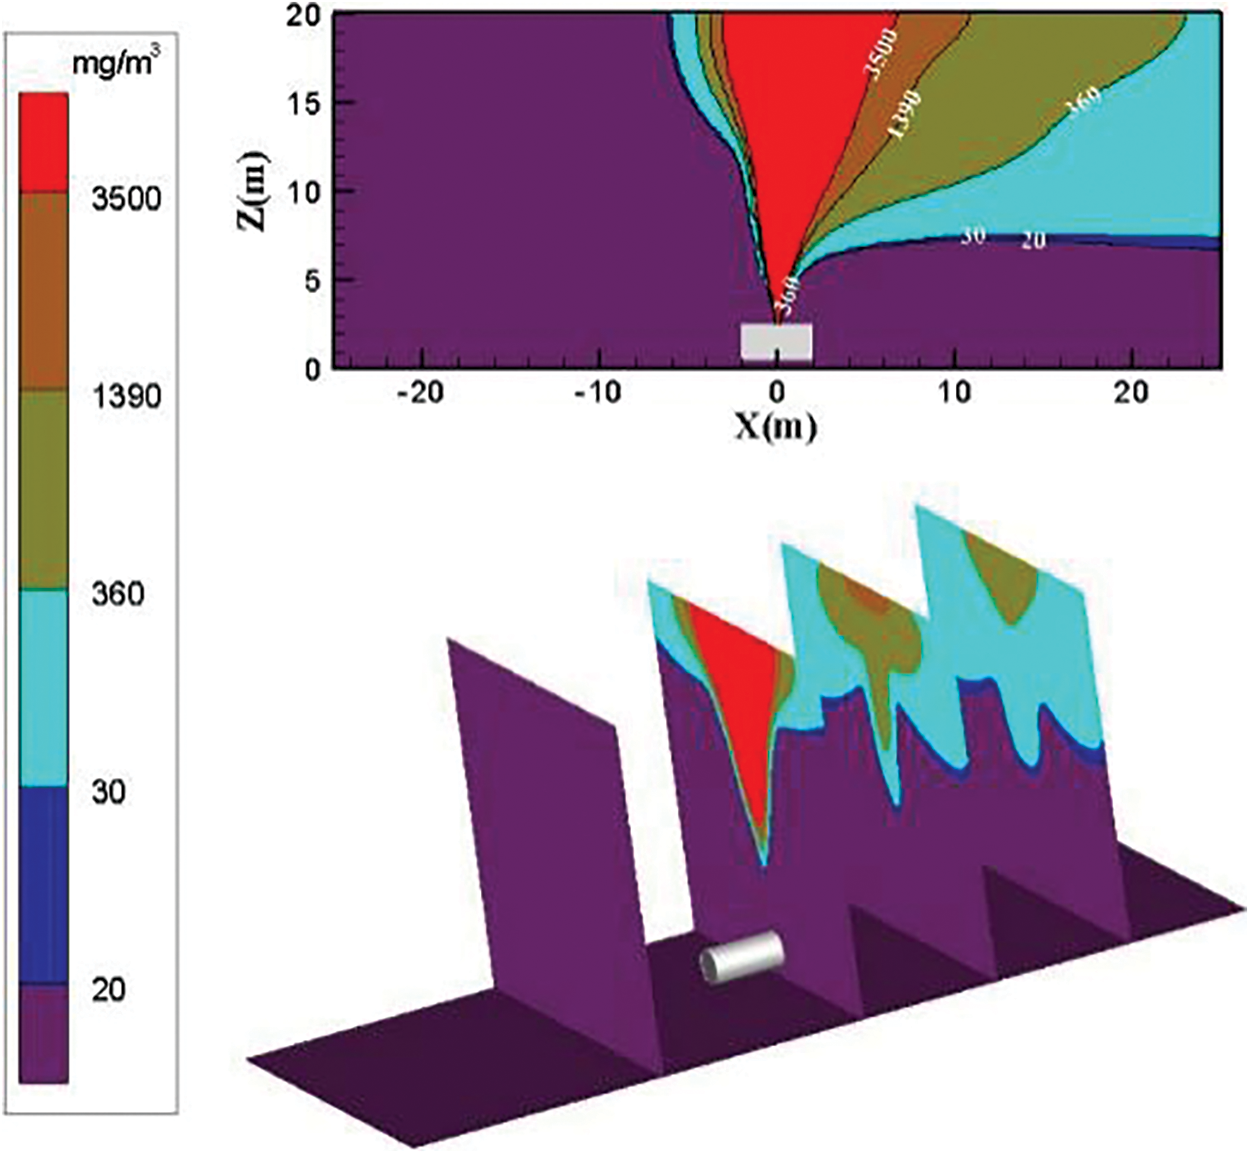
Figure 5: Distribution diagram of ammonia diffusion concentration; leak is located at the top of the tank; m = 5 kg/s, c = 3 m/s
The distribution diagram of ammonia diffusion concentration when the surrounding wind speed increases to 6 m/s is shown in Fig. 6. The dilution effect of the air on the ammonia gas cloud is enhanced. On the plane of Y = 0 m, the diffusion area of ammonia gas cloud with a concentration threshold of 360 to 1390 mg/m3 increases substantially. In addition, the trend of upward diffusion in the downwind direction further strengthens. The diffusion area of the ammonia gas cloud with the concentration threshold of 30 to 360 mg/m3 increases, and the distance from the ground is considerably reduced. The ammonia gas cloud above the concentration threshold of 3500 mg/m3 diffuses in the downward wind direction. However, the diffusion is not obvious. On a plane with a height of 5 m, the high threshold concentration of ammonia gas cloud decreases with the increase of the diffusion distance. However, some areas where the ammonia gas cloud concentration is between 1390 and 3500 mg/m3 exist. These areas remain in a dangerous concentration area.
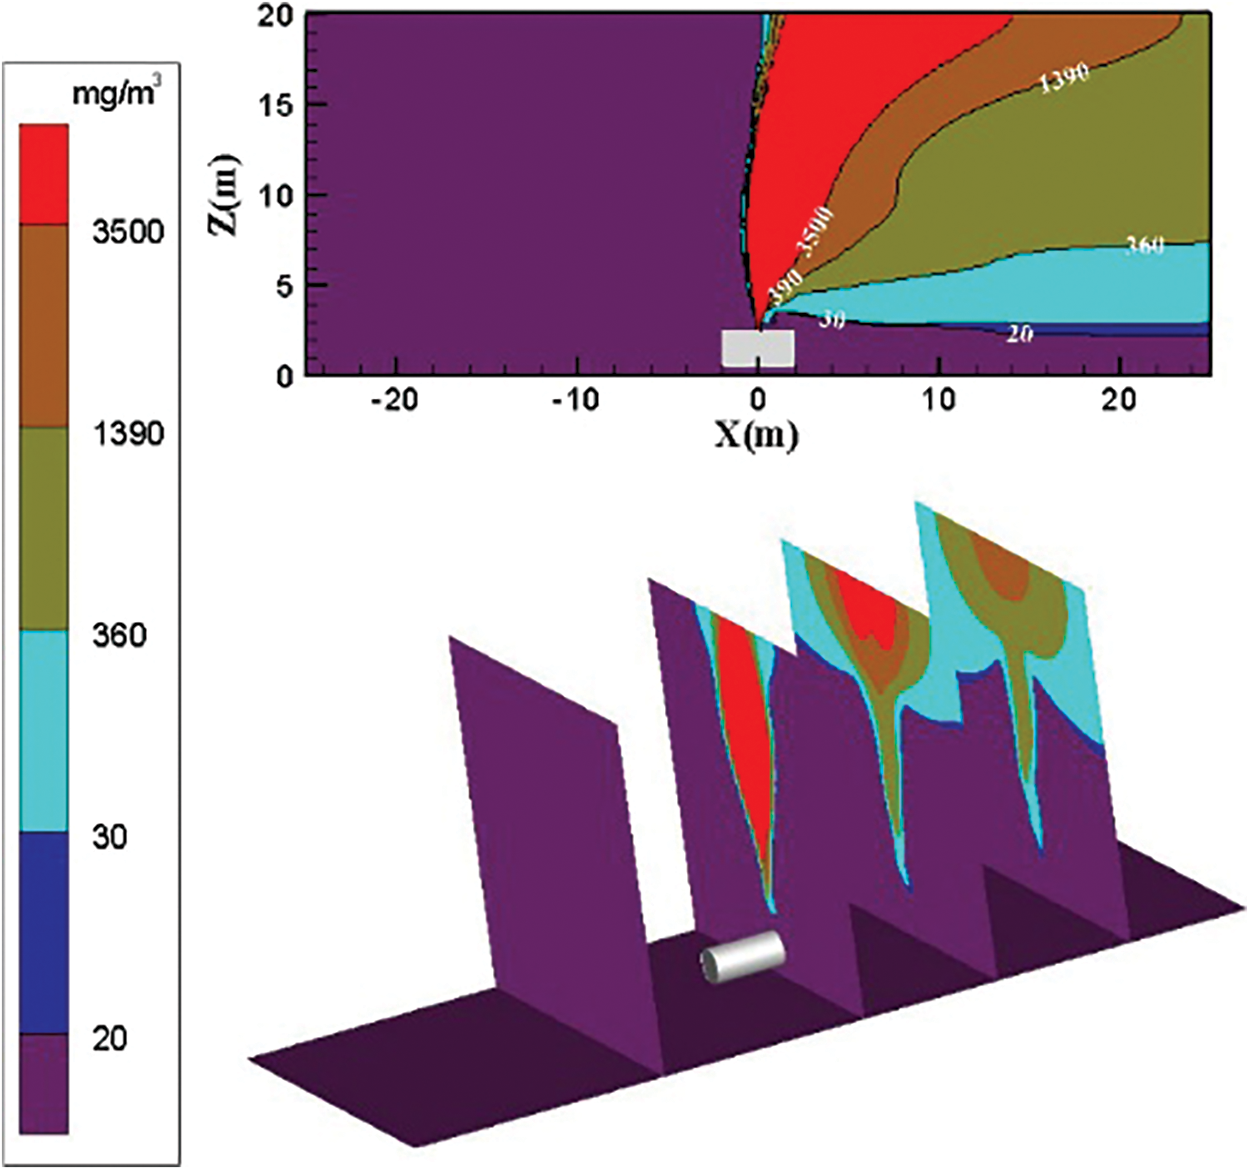
Figure 6: Distribution diagram of ammonia diffusion concentration; leak is located at the top of the tank; m = 5 kg/s, c = 6 m/s
The diffusion diagram of ammonia diffusion concentration when the surrounding wind speed further increases to 9 m/s is shown in Fig. 7. The high concentration of ammonia gas cloud increases in the downwind direction as the surrounding wind speed increases. The diffusion trend of ammonia gas that is higher than the concentration threshold of 3500 mg/m3 in the downwind direction is very obvious. As the effect of air on transport ammonia molecules increases, the area of the ammonia gas cloud with a high concentration in the X direction increases. The diffusion area of the ammonia gas cloud with the concentration threshold of 30 to 360 mg/m3 is reduced. The height of the low-concentration ammonia gas cloud is reduced. The diffusion area of ammonia gas cloud with the concentration threshold of 1390 to 3500 mg/m3 increases, and the downward wind upward diffusion trend increases.
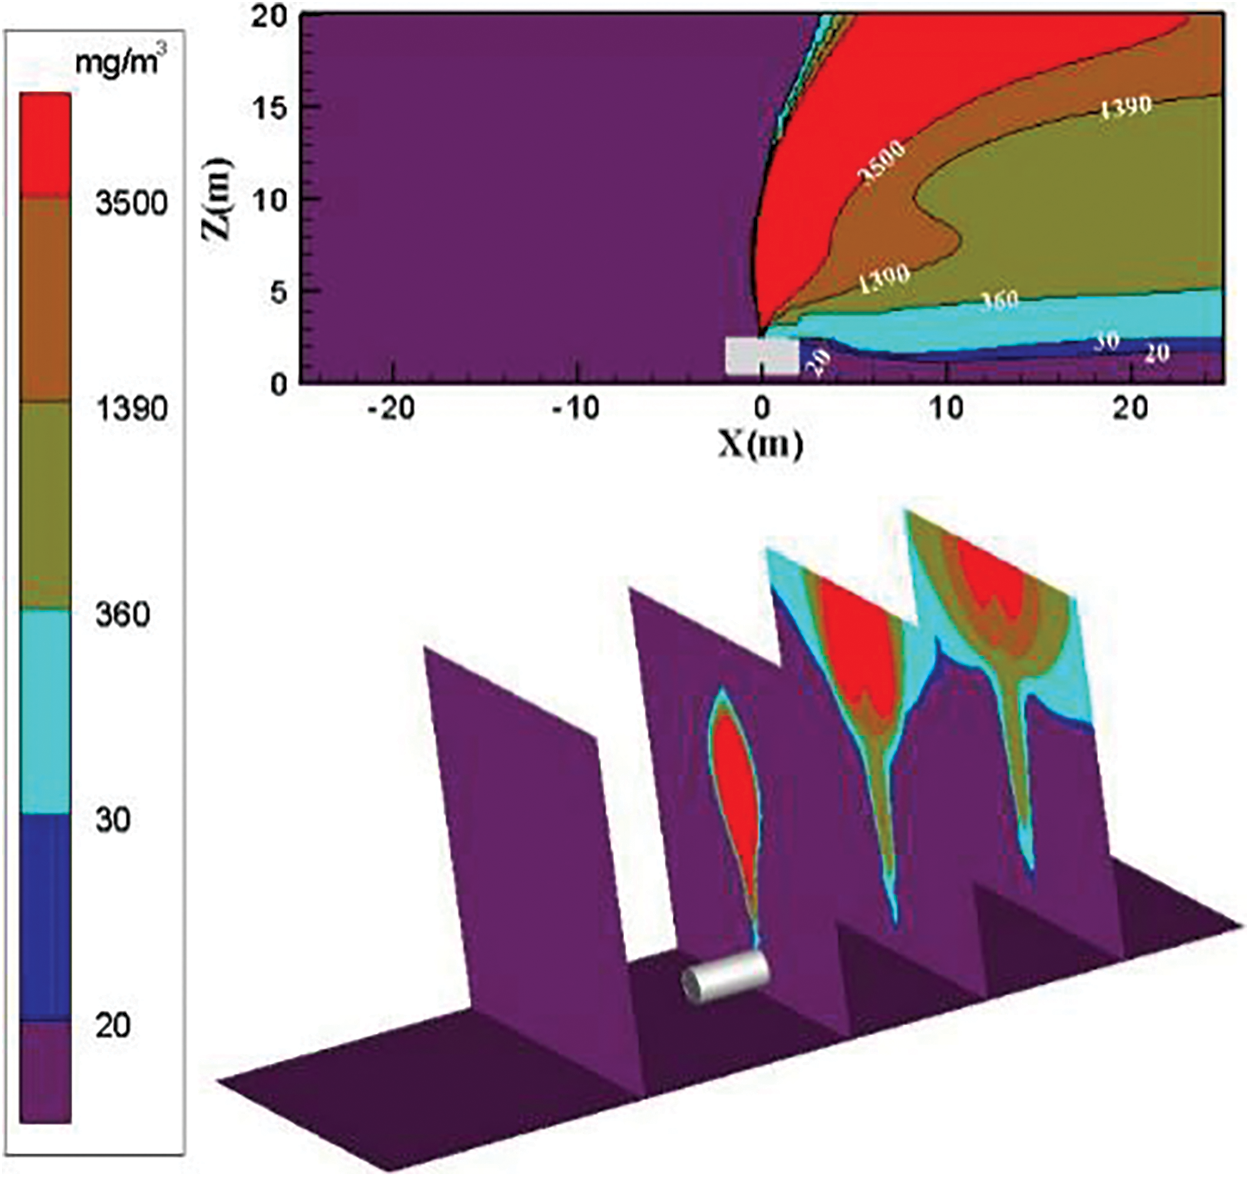
Figure 7: Distribution diagram of ammonia diffusion concentration; leak is located at the top of the tank; m = 5 kg/s, c = 9 m/s
The increase in the surrounding wind speed can effectively transport ammonia to the downwind direction. The diffusion height of low-concentration ammonia gas cloud gradually decreases. The diffusion area of the intermediate-concentration ammonia gas cloud gradually increases. The tendency of high-concentration ammonia gas clouds diffused to the downward wind direction is enhanced at high wind speeds. The ammonia gas cloud with a high concentration threshold is transported to the downwind direction when the surrounding wind speed increases to 9 m/s.
3.3 Leak Located at the Bottom of the Tank
Fig. 8 shows the distribution diagram of ammonia diffusion concentration after ammonia leaks from the bottom of the storage tank when the surrounding wind speed is 0 m/s. The analysis shows that when no surrounding wind speed exists, ammonia gas cloud surrounds both sides of the storage tank symmetrically. The density of ammonia gas is high, and the leaked high-concentration ammonia gas cannot be diffused easily to a low concentration. Fig. 8 shows that ammonia gas cloud concentration is from low to high and spreads from top to bottom. The diffusion height of each concentration of ammonia gas increases as the diffusion distance increases.
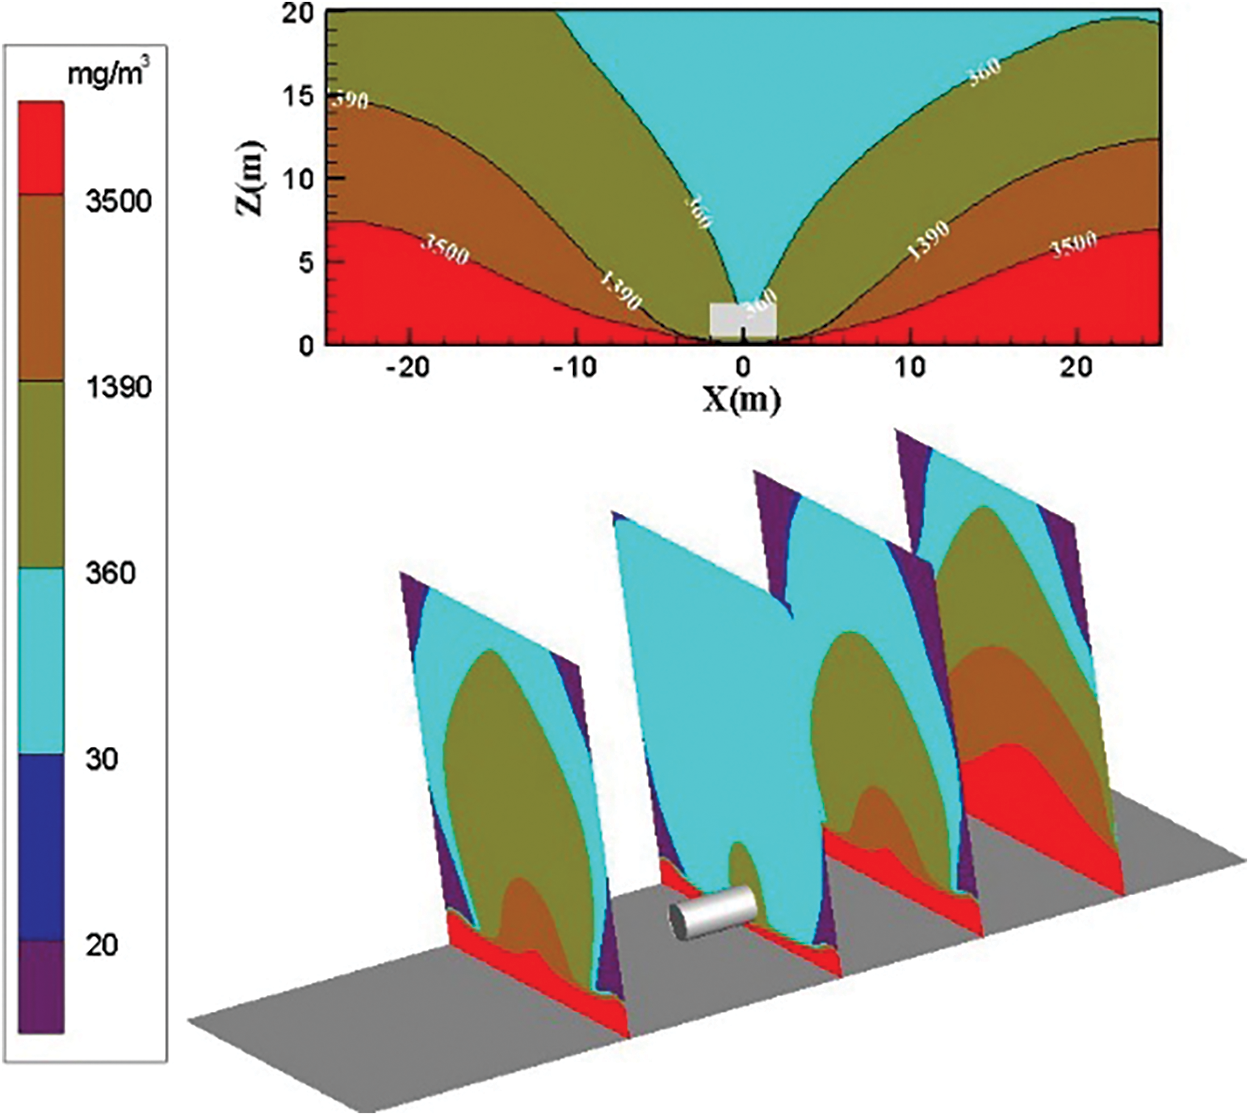
Figure 8: Distribution diagram of ammonia diffusion concentration; leak is located at the bottom of the tank; m = 5 kg/s, c = 0 m/s
The distribution diagram of ammonia diffusion concentration when the surrounding wind speed increases to 3 m/s is shown in Fig. 9. Diffused ammonia gas cloud is blown upwind to the downwind directions. The ammonia gas cloud diffusion stops at X = −20 m because of the influence of the surrounding wind speed. The high-concentration ammonia gas cloud presents a semielliptical shape upwind, gathers on the ground, and cannot be diffused. The upwind diffusion area of the low-concentration ammonia gas reduces considerably under the influence of the surrounding wind speed. The diffusion area of the ammonia gas cloud with the concentration threshold of 30 to 360 mg/m3 increases on the right side. The leaked ammonia gas cloud is not diffused and diluted well.
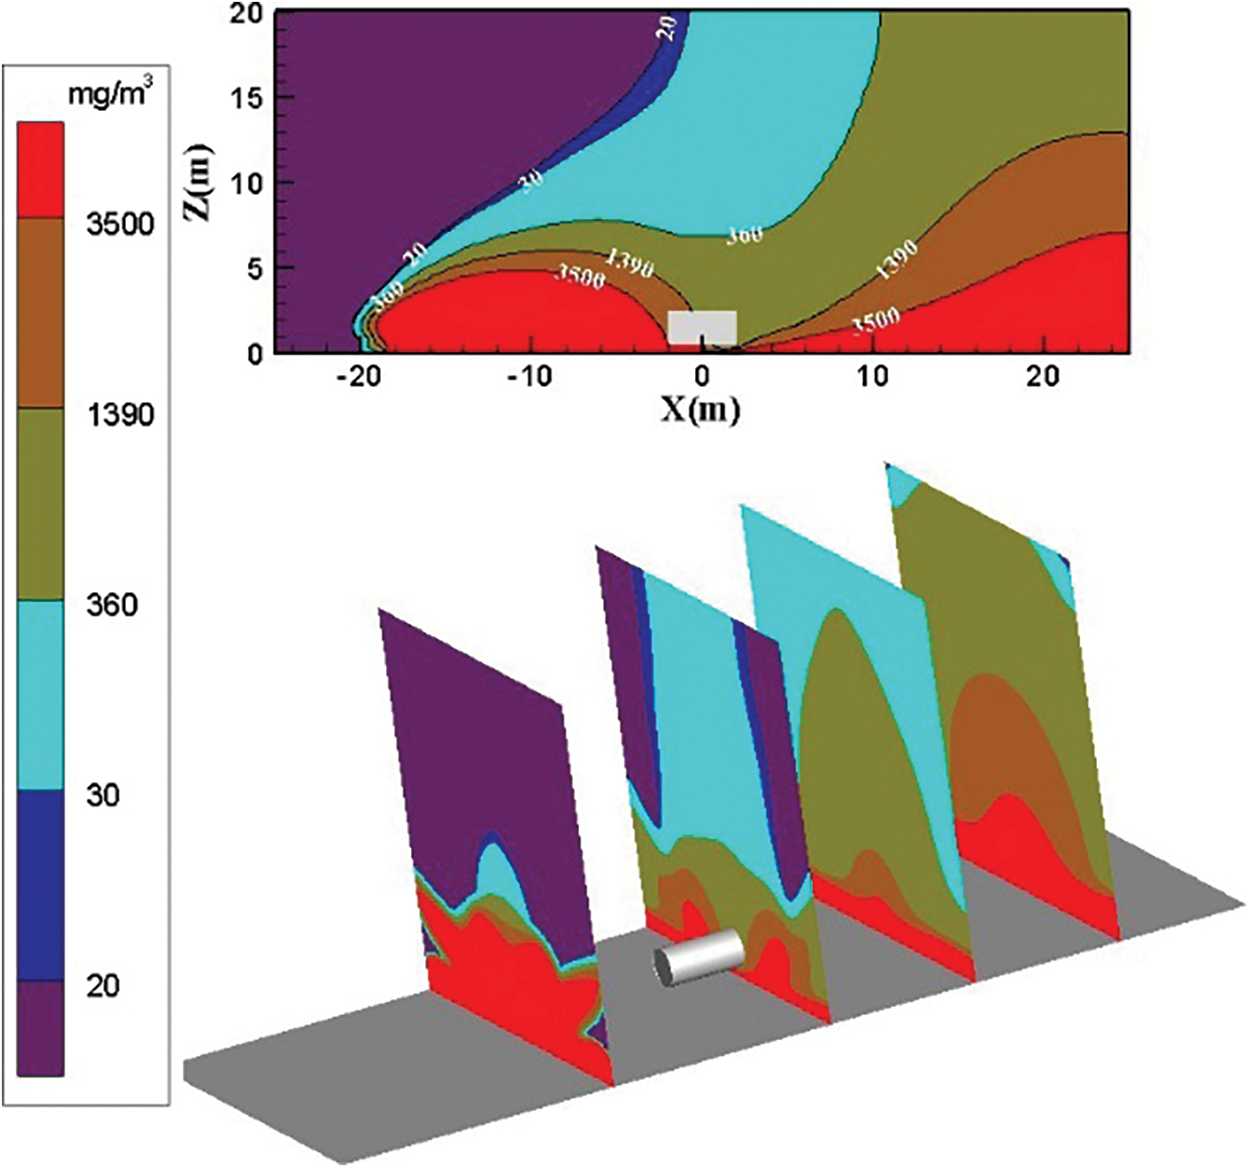
Figure 9: Distribution diagram of ammonia diffusion concentration; leak is located at the bottom of the tank; m = 5 kg/s, c = 3 m/s
The distribution diagram of ammonia diffusion concentration when the surrounding wind speed increases to 6 m/s is shown in Fig. 10. The dilution effect of the air on the ammonia gas cloud is enhanced. The diffusion area and height of the ammonia gas cloud of each concentration are reduced considerably. The concentration of the ammonia gas cloud near the ground at the bottom leak of the storage tank exceeds 3500 mg/m3. The height of the high-concentration threshold ammonia gas cloud on the left and right sides is reduced. The accumulation of high-concentration ammonia gas clouds on the left side of the storage tank is not improved well. The diffusion area and diffusion height of the ammonia gas cloud with the concentration threshold of 360 to 1390 mg/m3 are considerably reduced. The highest height is approximately 3.5 m on the left side of the storage tank. This finding indicates that increasing the wind speed to 6 m/s has a weak effect on improving high-concentration gas clouds. However, the dilution effect on medium-concentration gas clouds is substantial.
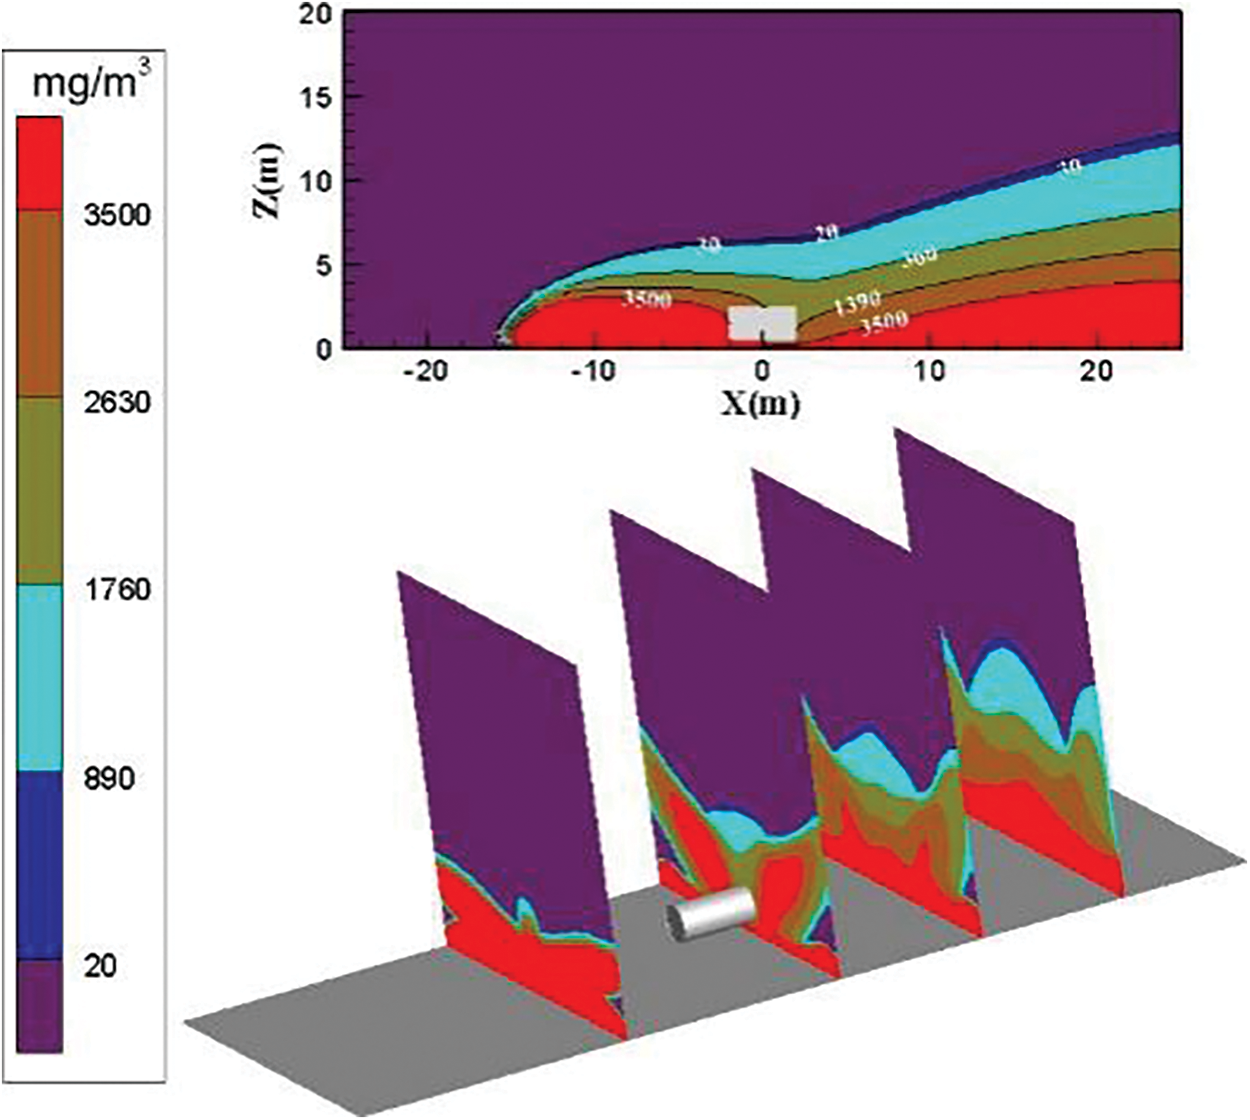
Figure 10: Distribution diagram of ammonia diffusion concentration; leak is located at the bottom of the tank; m = 5 kg/s, c = 6 m/s
The distribution diagram of ammonia diffusion concentration when the surrounding wind speed further increases to 9 m/s is shown in Fig. 11. At the position X = −10 m on the left side of the storage tank, the ammonia gas cloud above the concentration threshold of 3500 mg/m3 is transported to the downwind direction under the action of the external force of the wind as the surrounding wind speed increases. The ammonia gas cloud is transported to the downwind direction under the action of the external force of the wind. The ammonia gas cloud on the right side of the storage tank is transported by the strengthened air, and the dilution effect is strengthened. The ammonia molecules are transported to the leeward direction quickly and intensely. The concentration of the ammonia gas cloud above 5 m is below 360 mg/m3 in the vertical direction of the leeward direction.
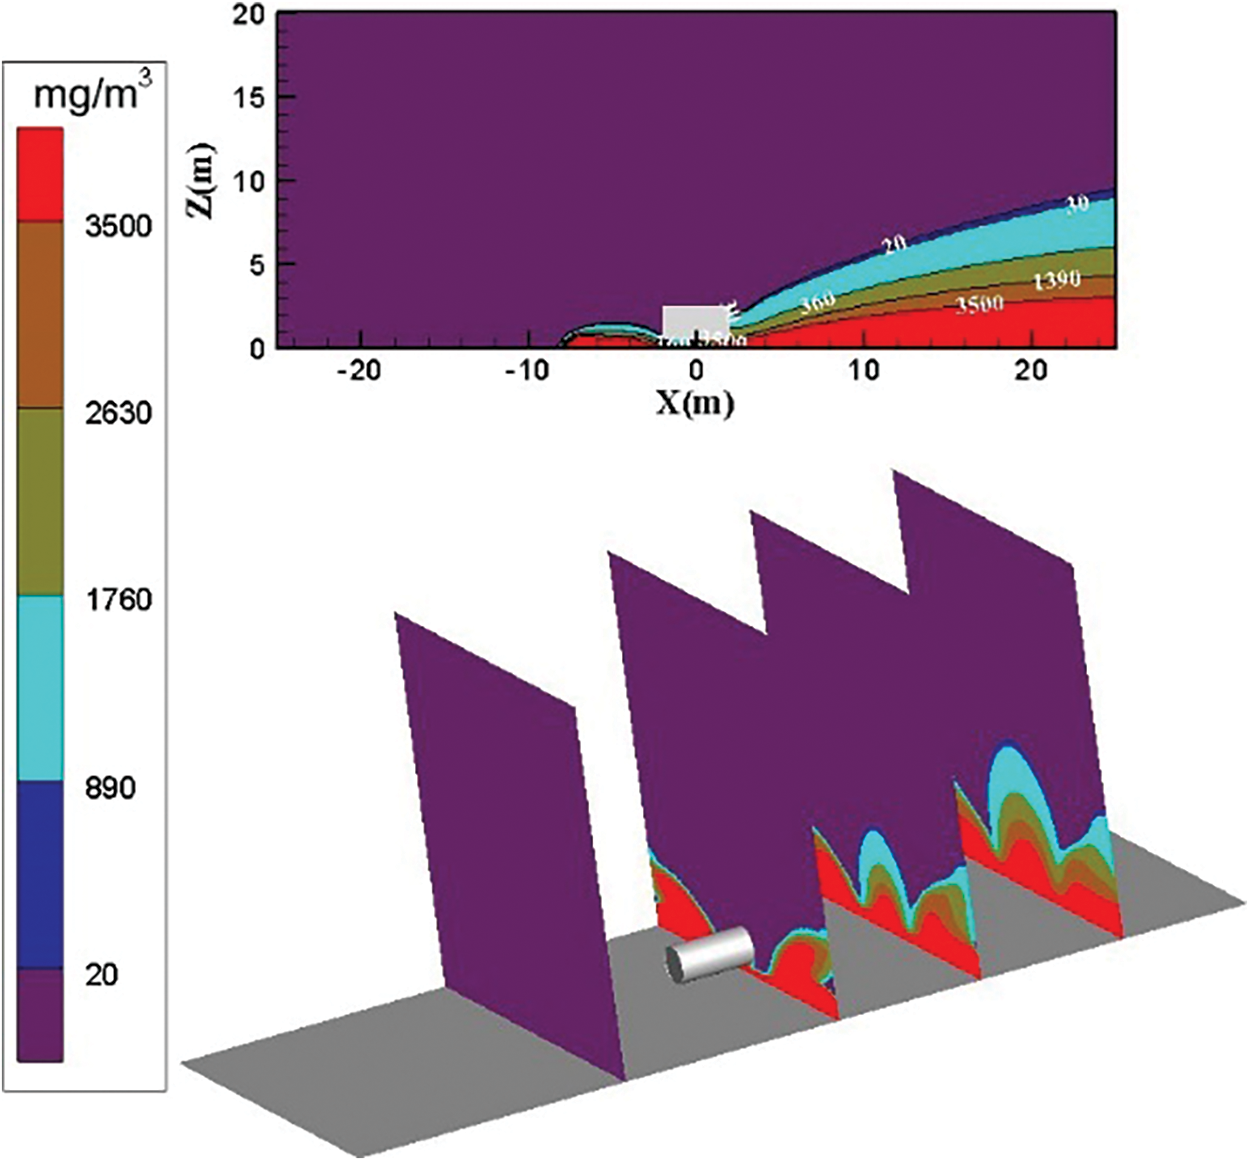
Figure 11: Distribution diagram of ammonia diffusion concentration; leak is located at the bottom of the tank; m = 5 kg/s, c = 9 m/s
As shown in Figs. 8–11, the air transport effect increases as the wind speed increases, and the ammonia gas cloud diffusion area in the calculation domain decreases considerably. After the wind speed reaches 9 m/s, the ammonia gas diffusion area only occupies a small part on the left side of the calculation domain. At X = −10 m on the left side of the leak, the concentration of ammonia gas cloud below 2 m is higher than 3500 mg/m3 when the surrounding wind speed is 0 m/s.
3.4 Leak Located on the Left of the Tank
Fig. 12 shows the distribution diagram of ammonia diffusion concentration after leaking from the left side of the storage tank when the surrounding wind speed is 3 m/s. The external force on the ammonia gas cloud is limited because of the low wind speed. On the left side of the storage tank, the concentration of diffused ammonia gas cloud mostly exceeds 3500 mg/m3. Only a few low-concentration ammonia gas clouds exist on the upper part. The diffusion area is like a parabola, and the diffusion area of low-concentration ammonia gas on the right side is increased.
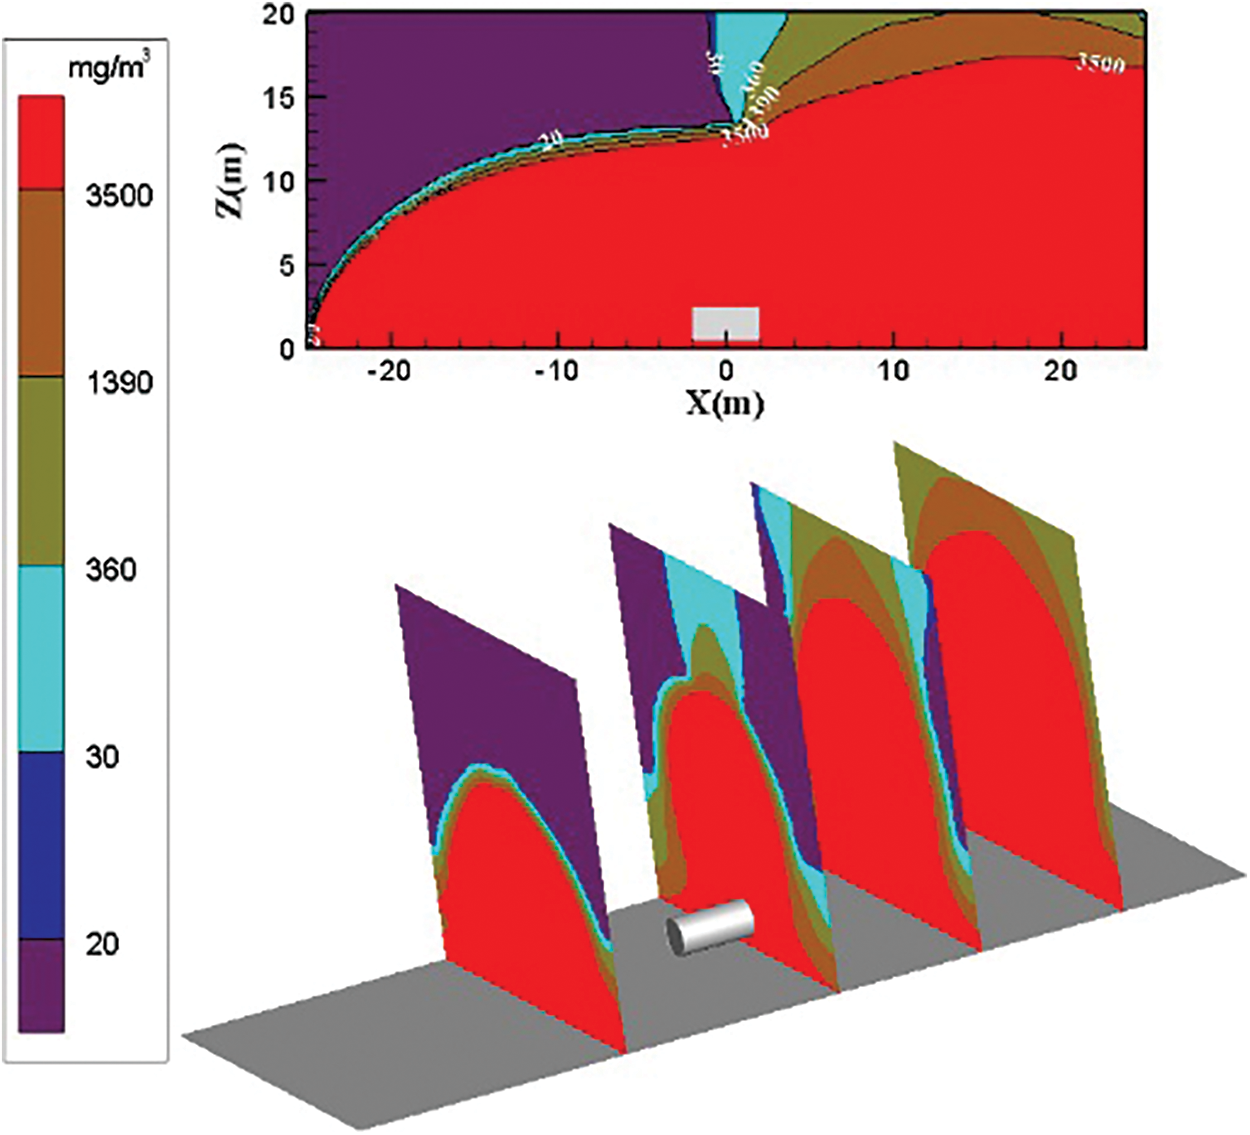
Figure 12: Distribution diagram of ammonia diffusion concentration; leak is located on the left of the tank; m = 5 kg/s, c = 3 m/s
Fig. 13 shows the distribution diagram of ammonia diffusion concentration when the surrounding wind speed increases to 6 m/s. The dilution effect of the air on the ammonia gas cloud is increased, and the ammonia diffusion height is considerably reduced. The overall diffusion area on the YZ plane is like a parabolic type. The diffusion area of the low-concentration ammonia gas cloud is small, and the diffusion area of the low-concentration ammonia gas cloud begins to increase at X = 12 m on the right side of the storage tank. The diffusion area of the high-concentration ammonia gas cloud also increases after a temporary decrease.
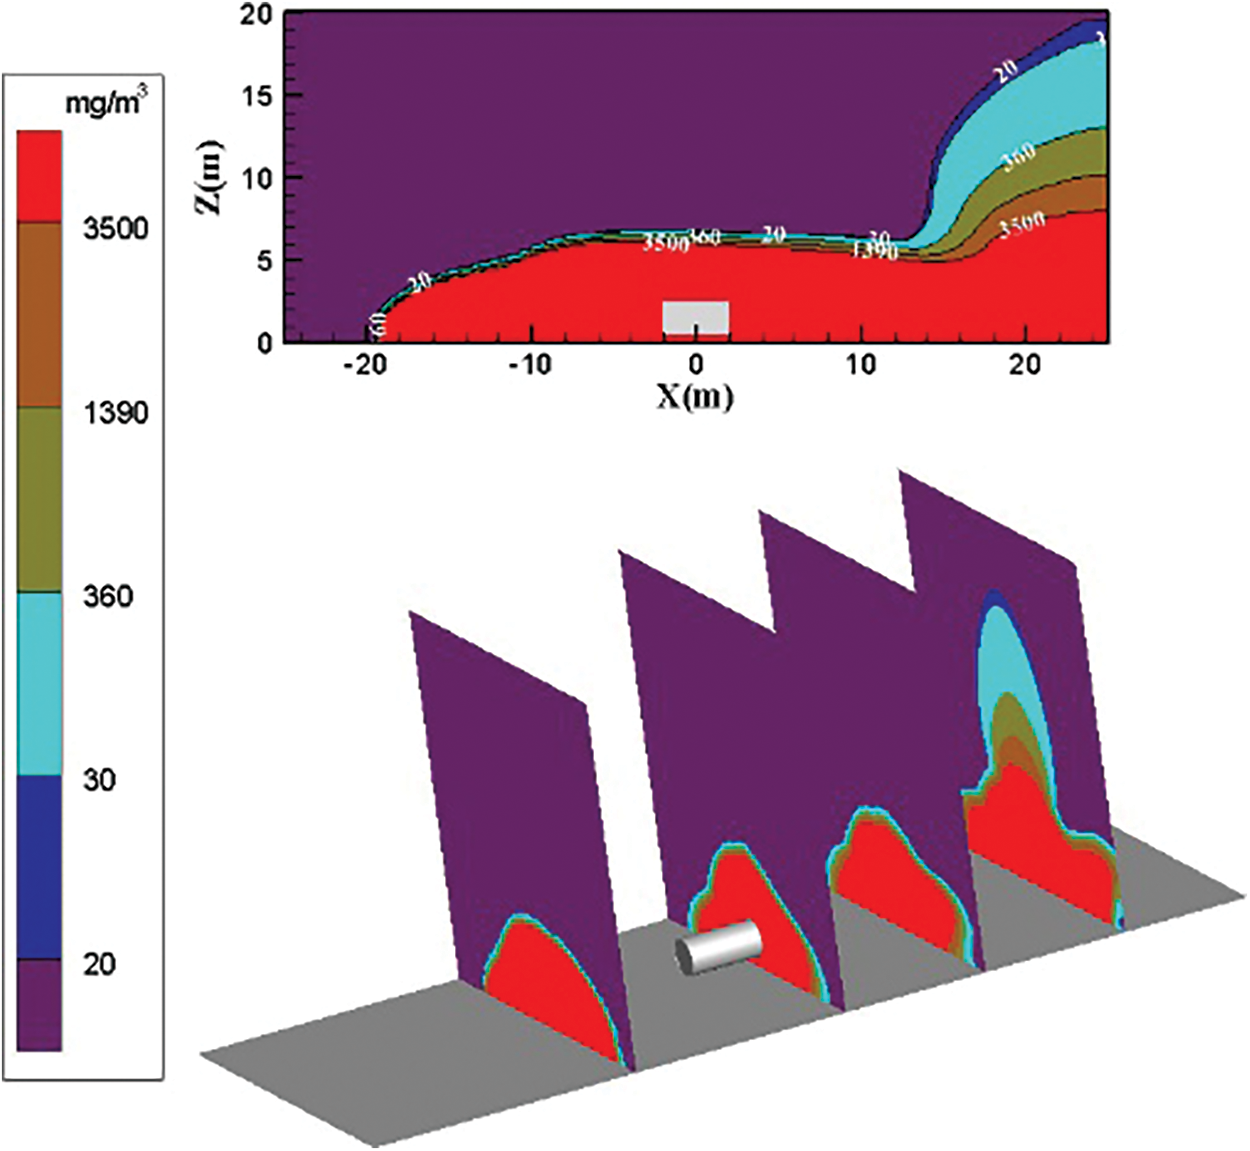
Figure 13: Distribution diagram of ammonia diffusion concentration; leak is located on the left of the tank; m = 5 kg/s, c = 6 m/s
The distribution diagram of ammonia diffusion concentration when the surrounding wind speed increases to 9 m/s is shown in Fig. 14. The transport effect of air is enhanced with the increase of environmental wind speed. The dilution effect is also considerably improved. The ammonia gas cloud diffuses rapidly in the downward wind direction under the action of air transport. The diffusion height of ammonia gas cloud above the concentration threshold of 3500 mg/m3 in the calculation domain increases slightly at X = −10 m and then falls. It stabilizes below 8 m. Fig. 14 shows that the diffusion area of the ammonia gas cloud outside the calculation domain is still gradually decreasing.
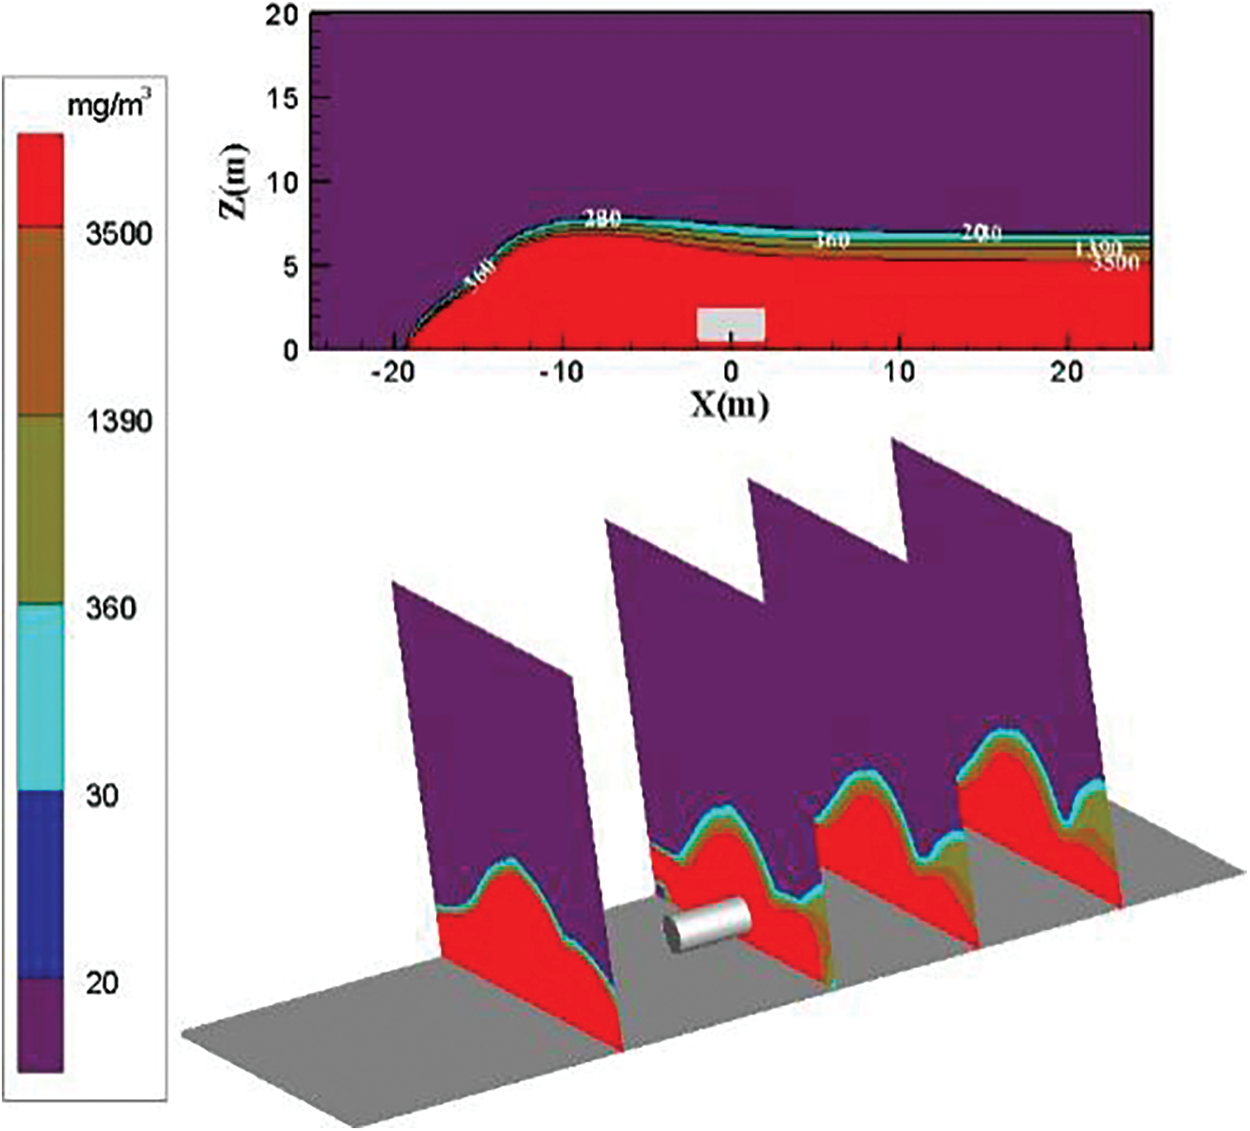
Figure 14: Distribution diagram of ammonia diffusion concentration; leak is located on the left of the tank, m = 5 kg/s, c = 9 m/s
Figs. 12–14 show that the ammonia diffusion height and diffusion area in the calculation domain gradually decrease from left to right as the surrounding wind speed increases. Under the three environmental wind speeds, the concentration threshold in the calculation domain is higher than 3500 mg/m3. The diffusion area of the ammonia gas cloud accounts for the largest part. At X = −10 m on the left side of the leak, the diffusion height and diffusion area of the ammonia gas cloud above the 3500 mg/m3 concentration threshold gradually decrease as the surrounding wind speed increases. The height of other concentrations of ammonia gas cloud decreases. However, the diffusion area does not change considerably. High-concentration ammonia is always near the ground.
3.5 Leak Located on the Left Side of the Tank, Wind from the Right
Fig. 15 shows the distribution diagram of ammonia diffusion concentration when the leakage port is on the left side of the storage tank and the surrounding wind is blowing horizontally from the right with the wind speed of 3, 6, and 9 m/s. In the three working conditions, the ammonia gas cloud above the concentration threshold of 3500 mg/m3 shows a spray shape at the leakage port. The diffusion height of the ammonia gas cloud at the rightmost side of the calculation area X = −25 m reaches a maximum of 10 m when the surrounding wind speed is 3 m/s. The concentration of ammonia gas cloud from the ground to a height of 5 m is higher than 3500 mg/m3. The concentration of ammonia gas cloud at 5–10 m is within the threshold range of 20–3500 mg/m3. The highest diffusion height of the rightmost ammonia gas cloud drops to 8 m when the wind speed increases to 6 m/s. The area of the gas cloud with a concentration of 20–3500 mg/m3 is reduced.
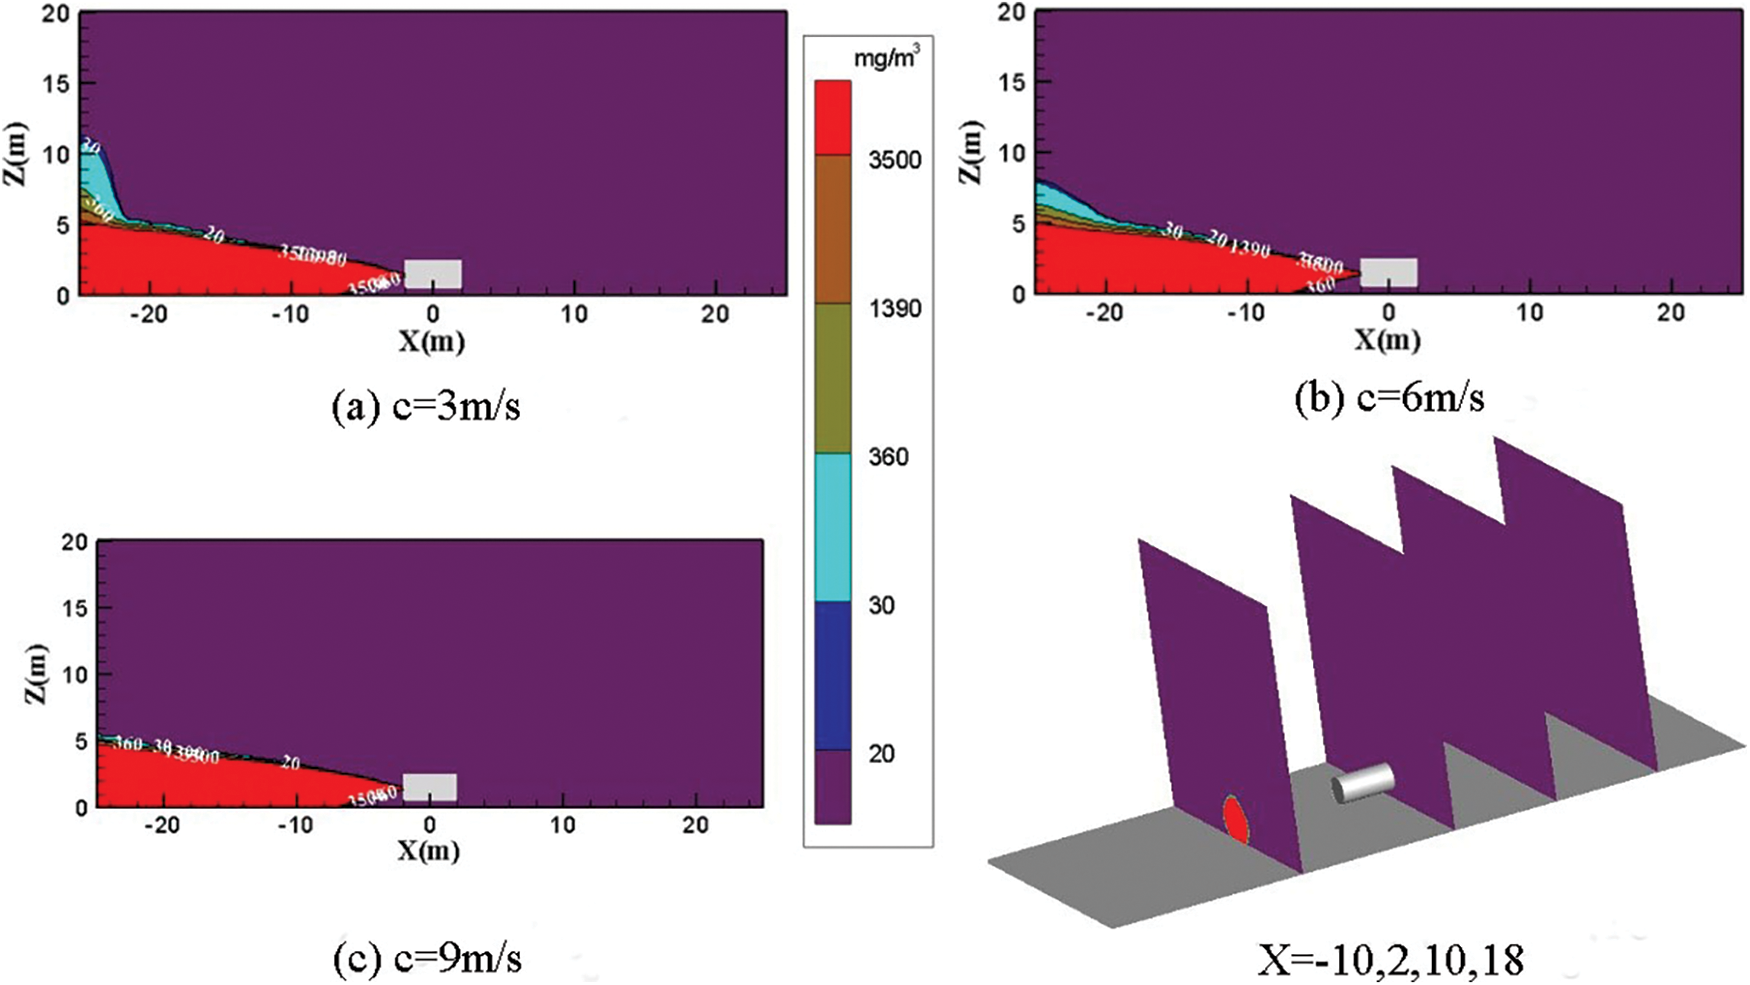
Figure 15: Distribution diagram of ammonia diffusion concentration; leak is located on the left side of the tank, wind from the right; m = 5 kg/s
Fig. 15 shows that the ammonia gas is sprayed after it leaks when the leak is on the left side of the tank and the wind blows horizontally from the right of the environment. The plane view at X = −10 m has a diameter of 5 m. The environmental wind speed has a weak effect on the leaked high-concentration ammonia gas cloud. The diffusion height and the diffusion area of the concentrated ammonia gas cloud within the farming area are considerably reduced with the increase of the environmental wind speed. Under the same leakage flow, the influence of different surrounding wind speeds on ammonia gas cloud diffusion is small from the YZ plane.
In this section, the mitigation performance of ventilation is discussed based on the changes in ammonia concentration under different accident scenarios.
Ammonia gas is sprayed vertically upward when the leakage port is located at the top of the storage tank and no surrounding wind speed exists. The refrigerating plant room, which has little influence on the spectators and trainers in the upwind area, is in a safe location. The increase in wind speed reduces the diffusion height of the ammonia gas cloud in the downwind direction. The concentration increases to 360 mg/m3 in the height range of 0–5 m, reaching the direct harmful concentration. At this concentration level, breathing becomes difficult, causing serious harm to the human body. On this occasion, we should organize evacuation quickly. At the height of 5 m, the concentration of ammonia gas cloud increases to 1390 mg/m3 when the wind speed increases to 9 m/s. This scenario already involves a half-lethal concentration, which can cause severe coughing in humans. In this case, the concentration is no longer suitable for human exposure. Therefore, the forced ventilation device should be closed when the top of the storage tank leaks. After ensuring that all staff members are evacuated from the downwind direction, increasing the surrounding wind speed can accelerate ammonia diffusion.
The ammonia concentration within the height range of 0–5 m on both sides of the storage tank exceeds 3500 mg/m3 when the leak is located at the bottom of the storage tank and no surrounding wind speed exists. This scenario is already a lethal concentration, which can directly cause casualties. The diffusion trend of the ammonia gas cloud in the upwind direction can be effectively curbed with the increase of wind speed. Outside the range of X < −20 m, the ammonia concentration is already at a safe concentration when the wind speed is 3 m/s. The height of ammonia diffusion is also effectively contained when the wind speed increases to 6 m/s. When the wind speed increases to 9 m/s, almost no high concentration of ammonia in the upwind direction exists, effectively ensuring the safety of the audience and trainers.
A breeze with a wind speed of 3 m/s can make a concentrated ammonia gas cloud at the height of 0–5 m exceed 3500 mg/m3 when the leak is in the same direction as the wind speed, reaching a lethal concentration. The ammonia diffusion distance does not change when the wind speed increases 6 and 9 m/s. In this scenario, the influence of lower external wind speed on ammonia diffusion is weak.
The external wind speed has a weak influence on ammonia gas cloud diffusion when the leakage port is different from the wind speed.
The mitigation ability of ventilation on ammonia leakage accidents is worrying. The effectiveness of ventilation mitigation performance under different ammonia leakage scenarios is evaluated.
The technology based on CFD is used to simulate the ventilation and diffusion of accident scenarios of ammonia concentration and wind speed at different leak locations. A qualitative assessment of ventilation mitigation performance is performed based on the changes in CFD modeling results.
When the leakage port is at top of the storge tank, the diffusion height of the ammonia gas cloud with a concentration below 360 mg/m3 decreases as the wind speed increases from 0 to 9 m/s, and the concentration of the ammonia gas cloud gradually increases from 360 to 3500 mg/m3. The diffusion area of the ammonia gas increases, which increases the dangerous area.
With the wind speed increases, the diffusion height and diffusion area are considerably reduced, and the dangerous area is effectively decreased, when the leakage port is at bottom of the storge tank. After the wind speed reaches 9 m/s, the diffusion area of the ammonia gas cloud on the left side of the calculation domain is only small.
When the leakage outlet of the liquid ammonia storage tank is opposite to the wind speed, and the wind speed is 3 m/s, the ammonia gas cloud with a concentration exceeding 3500 mg/m3 accounts for the largest proportion, making most of the computational domain in the danger zone. As wind speed increases, the diffusion height and diffusion area of ammonia gas cloud gradually decreased, and the dangerous area decreased. And the ammonia gas cloud with a concentration exceeding 3500 mg/m3 does not change considerably, when the leakage of liquid ammonia storage tank is in the same direction as the wind speed.
Funding Statement: This work was supported by the National Key R&D Program of China (No. 2020YFD1100305).
Conflicts of Interest: The authors declare that they have no conflicts of interest to report regarding the present study.
1. Liao, C. J., Zhao, S. Q., Liu, S., He, L., Zhou, Y. et al. (2017). Statistical analysis and countermeasures of hazardous chemical leakage accidents in China from 2010 to 2015. Safety and Environmental Engineering, 5, 151–157. DOI 10.13578/j.cnki.issn.1671-1556.2017.05.027. [Google Scholar] [CrossRef]
2. Roh, C. K., Choi, S., Seo, W. J., Cho, M., Hyung, W. J. (2021). Incidence and treatment outcomes of leakage after gastrectomy for gastric cancer: Experience of 14,075 patients from a large volume centre. European Journal of Surgical Oncology, 47(9), 2470–2471. DOI 10.1016/j.ejso.2021.06.001. [Google Scholar] [CrossRef]
3. Yarandi, M. S., Mahdinia, M., Barazandeh, J., Soltanzadeh, A. (2021). Evaluation of the toxic effects of ammonia dispersion: Consequence analysis of ammonia leakage in an industrial slaughterhouse. Medical Gas Research, 11(1), 24–29. DOI 10.4103/2045-9912.310056. [Google Scholar] [CrossRef]
4. Rosa, A. C., Teixeira, I., Terra, A., Hammad, A. W., Haddad, A. (2021). Quantitative risk analysis applied to refrigeration’s industry using computational modeling. Results in Engineering, 9, 100202. [Google Scholar]
5. Anjana, N. S., Amarnath, A., Harindranathan Nair, M. V. (2018). Toxic hazards of ammonia release and population vulnerability assessment using geographical information system. Journal of Environmental Management, 210, 201–209. DOI 10.1016/j.jenvman.2018.01.021. [Google Scholar] [CrossRef]
6. Amelina, L. V., Biliaiev, M. M., Mashykhina, P. B. (2017). Reducing ammonia concentrations in atmosphere after its unplanned release. https://cyberleninka.ru/article/n/reducing-ammonia-concentrations-in-atmosphere-after-its-unplanned-release/viewer. [Google Scholar]
7. Rémy, B., Stéphane, D., Olivier, S. (2005). Ammonia large scale atmospheric dispersion experiments in industrial configurations. Journal of Loss Prevention in the Process Industries, 4, 512–519. DOI 10.1016/j.jlp.2005.07.016. [Google Scholar] [CrossRef]
8. Mark, R. T., Alberto, S. C., Antonio, V., Mark, A. S. (2015). Suitability and uncertainty of two models for the simulation of ammonia dispersion from a pig farm located in an area with frequent calm conditions. Atmospheric Environment, 102, 167–175. DOI 10.1016/j.atmosenv.2014.11.056. [Google Scholar] [CrossRef]
9. Galeev, A. D., Salin, A. A., Ponikarov, S. I. (2013). Consequence analysis of aqueous ammonia spill using computational fluid dynamics. Journal of Loss Prevention in the Process Industries, 4, 628–638. DOI 10.1016/j.jlp.2012.12.006. [Google Scholar] [CrossRef]
10. Naserzadeh, Z., Atabi, F., Moattar, F., Nejad, N. M. (2017). Modeling the impact of consequence of ammonia release from ship loading arm by CFD. [Google Scholar]
11. Zhang, J. F., Xia, X., Li, D. S., Dun, C. J. (2017). Study on diffusion of ammonia based on fluent software. Journal of Tianjin University of Technology, 5, 60–64. [Google Scholar]
12. Qi, H. B., Wu, Y. M., Wang, D. (2020). Analysis of ammonia leakage and diffusion characteristics in ammonia transfer pipeline in cold storage and study on accident consequences. Environmental Protection Science, 2, 117–122. DOI 10.16803/j.cnki.issn.1004-6216.2020.02.023. [Google Scholar] [CrossRef]
13. San, J. Y., Shiao, W. Z. (2006). Effects of jet plate size and plate spacing on the stagnation nusselt number for a confined circular air jet impinging on a flat surface. International Journal of Heat and Mass Transfer, 19, 3477–3486. DOI 10.1016/j.ijheatmasstransfer.2006.02.055. [Google Scholar] [CrossRef]
14. Omer, M., Zhou, C. S., Chen, X., Gong, L. K. (2016). Prediction of swirling cold flow in a solid-fuel ramjet engine with a modified rotation/curvature correction SST turbulence model. Applied Thermal Engineering, 105, 737–754. DOI 10.1016/j.applthermaleng.2016.03.091. [Google Scholar] [CrossRef]
15. Zhou, N., Zhang, Q., Li, X., Chen, L., Liu, H. Y. (2021). Numerical simulation of the influence of wind speed on LNG leakage and diffusion process. Journal of Safety and Environment, 21(1), 285–294. DOI 10.13637/j.issn.1009-6094.2019.0909. [Google Scholar] [CrossRef]
16. Tan, W., Du, H., Liu, L. Y., Su, T., Liu, X. Y. (2017). Experimental and numerical study of ammonia leakage and dispersion in a food factory. Journal of Loss Prevention in the Process Industries, 47, 129–139. DOI 10.1016/j.jlp.2017.03.005. [Google Scholar] [CrossRef]
17. Min, D. S., Choi, S., Oh, E. Y., Jung, S. (2020). Numerical modelling for effect of water curtain in mitigating toxic gas release. Journal of Loss Prevention in the Process Industries, 63. DOI 10.1016/j.jlp.2019.103972. [Google Scholar] [CrossRef]
18. Tan, W., Lv, D., Guo, X. Y., Du, H., Liu, L. Y. et al. (2020). Accident consequence calculation of ammonia dispersion in factory area. Journal of Loss Prevention in the Process Industries, 67. DOI 10.1016/j.jlp.2020.104271. [Google Scholar] [CrossRef]
19. Rémy, B., Stéphane, D., Olivier, S. (2005). Ammonia large scale atmospheric dispersion experiments in industrial configurations. Journal of Loss Prevention in the Process Industries, 18(4), 512–519. DOI 10.1016/j.jlp.2005.07.016. [Google Scholar] [CrossRef]
20. Dan, C., Liu, Y., Kai, N. (2014). Research on leakage and diffusion impact of ammonia leak accident. Advanced Materials Research. https://www.scientific.net,AMR.926-930.4298. [Google Scholar]
21. Cerezo, J., Bourouis, M., Vallès, M., Coronas, A., Best, R. (2009). Experimental study of an ammonia–water bubble absorber using a plate heat exchanger for absorption refrigeration machines. Applied Thermal Engineering, 29(5–6), 1005–1011. DOI 10.1016/j.applthermaleng.2008.05.012. [Google Scholar] [CrossRef]
 | This work is licensed under a Creative Commons Attribution 4.0 International License, which permits unrestricted use, distribution, and reproduction in any medium, provided the original work is properly cited. |