| Fluid Dynamics & Materials Processing |
DOI: 10.32604/fdmp.2022.019489
ARTICLE
Optimizing Fluid Flow Cooling in Gas Transmission Systems
1Universitas Krisnadwipayana, Senior Lecturer Faculty of Public Health Universitas Indonesia, Faculty of Law Universitas Krisnadwipayana, Jawa Barat, 13077, Indonesia
2Scientific Research Center, Al-Ayen University, Thi-Qar, 64001, Iraq
3Islamic Azad University, Jolfa International Branch, Jolfa, 5441733574, Iran
4Departement of Aquatic Management, Faculty of Fisheries and Marine Science, Universitas Negeri Gorontalo, Gorontalo, 96128, Indonesia
5Kazan Federal University, Kazan, 420008, Russia
6School of Accounting, Jiujiang University, Jiujiang, 33200, China
7Department of Occupational Therapy, Faculty of Associated Medical Sciences, Chiang Mai University, Chiang Mai, 50200, Thailand
8Lipetsk State Technical University, Lipetsk, 398600, Russia
9Department of Information and Robototechnic Systems, Belgorod State University, Belgorod, 308015, Russia
*Corresponding Author: Oleg R. Kuzichkin. Email: golubeva.julivgt@inbox.ru
Received: 27 September 2021; Accepted: 23 November 2021
Abstract: In this study, structural theory was used to examine the geometric configuration of channels embedded inside an object in the presence of internal heat generation for cooling by a heat transfer mechanism. The growth and development of gas transmission lines and the lack of up-to-date integrated information systems have made the design and maintenance of pipelines, as well as the handling of problems caused by various accidents in the pipeline, very complex in many cases. Using accurate descriptive and spatial information in tolls on gas transmission line maps such as pipes, booster stations, valves, and forks in a spatial reference database can engage planners, operators, and paramedics in a variety of management. They are used to help in the direction of optimal and purposeful management. Therefore, in this paper, by considering appropriate laboratory conditions and numerical experiments and calculations, it is possible to determine the optimal attraction of duct holes for cooling components of the gas transmission system, so that the industry can produce and developed gas transmission without incident. In this study, in addition to studying the geometric characteristics of channel spacing and their length, the dimensions of a specific channel for reducing the maximum produced temperature are also discussed
Keywords: Cooling component; duct hole; gas transmission line; pipeline; cooling system
Gas transmission from the source to users is vital in the industry, That is, the gas will go from a higher pressure point to a lower pressure point. Of course, after extraction, the gas has a high pressure sometimes up to PSI1300, but along its route, it must pass through mountainous and low-lying areas, and of course, passing through these areas requires overcoming factors such as altitude, gas friction inside the pipe and fittings. Is relevant. According to Bernoulli’s law, considering natural gas as a complete gas, we will have: The pressure drop between the two points is proportional to the sum of the changes in velocity, height and pressure drop due to the friction of the car with the pipeline and related connections. In addition, the branches and uses taken along the route from the national pipelines cause a pressure drop. Gas booster stations, as their name implies, will compensate for these pressure drops along the way. In addition, gas is a compressible material, and its volume can be reduced by increasing the pressure, and as a result, a larger volume of gas can be transferred under standard conditions [1,2].
Due to the fact that a high percentage of gas consumption is related to domestic and industrial uses such as power plants and steel industries, and in recent years part of the gas is exported. Areas of consumption to be sent. The produced gas is sent to the industrial hubs and densely populated cities, including Tehran and border points, for export through national lines and sub-branches. Each gas transmission line at the inlet points of the stations has an inlet valve, an outlet valve and a bypass valve that the operator must know how the mentioned valves work. If the station wants to work on this line, the inlet and outlet valves and the bypass valve must be closed. Otherwise, the inlet and outlet valves are closed, and the bypass valve is left open so that the gas flow is free and without pressure in the path [3].
Due to the importance of gas transmission lines as one of the vital arteries and its position in the social, economic and international arenas for continuous, safe and secure delivery of gas to domestic and foreign customers, the existence of an integrated information system with Having the necessary tools can be responsible for two parts of designing and maintaining transmission lines by organizing the required descriptive data, and its relationship with the place with them on the map can meet many information, analytical and planning needs of transmission lines [4].
The results of previous articles show that further reduction of the outlet temperature of each station will save energy consumption, but the possibility of further cooling of gas in each station should be considered [5]. On the other hand, the possibility of hydrate formation in the pipeline due to cooling should be considered. The presence of water with the gas flow at low temperatures causes the formation of hydrates, which can cause channel blockage at low temperatures. To prevent hydrate formation, the gas temperature should always be kept above the flow hydrate temperature. Due to the fact that the gas temperature at the end of the pipeline of each station is lower due to heat exchange with the soil, so the risk of hydrate formation at the end of the pipeline will be higher [6,7].
Also in cold regions of garlic and in cold seasons of the year, the risk of hydrate formation is much higher than other seasons, and the issue of cooling the exhaust gas from each station should be investigated more carefully. Types of Cooling Towers: 1. One-Pass Cooling Systems 2. Circulation Systems 3. Dry Cooling Towers 4. Direct Dry Cooling Systems 5. Indirect Dry Cooling Systems [8]. Each of these cooling systems has its own advantages. In this paper, we want to investigate the effect of gravity on channel cavities to cool gas transmission components using methods.
It is assumed that the transmission network in question consists of one supplier and several consumers. Also, it is assumed that the system operates steadily and uniformly in each time period, and therefore the passage of gas within the system is independent of time. Although due to the fluid nature of the gas, some transient states may occur, due to the small effect of the changes, we ignore it [9]. The network consists of supply nodes, demand nodes, transmission nodes and input and output points to the compressor station.
The purpose of the problem is to determine the optimal attraction of the channel cavities for cooling the control components of the gas transmission system [10]. Investment costs include the cost of installing canals and compressor stations, as well as gas transmission system control components [11]. It should be noted that the operating costs include transmission costs, operating costs of canals and compressor stations (such as maintenance and power supply), and the cost of purchasing natural gas. In this section, the equation of total flow and compressible flow in a pipeline as well as different flow regimes in gas transmission systems (e.g., semi-turbulent and fully turbulent flow) and some transmission equations and their advantages and limitations. The effect of these factors on system cooling will also be investigated [12].
Consider a pipeline that carries natural gas between points 1 and 2 in stable conditions (see Fig. 1).
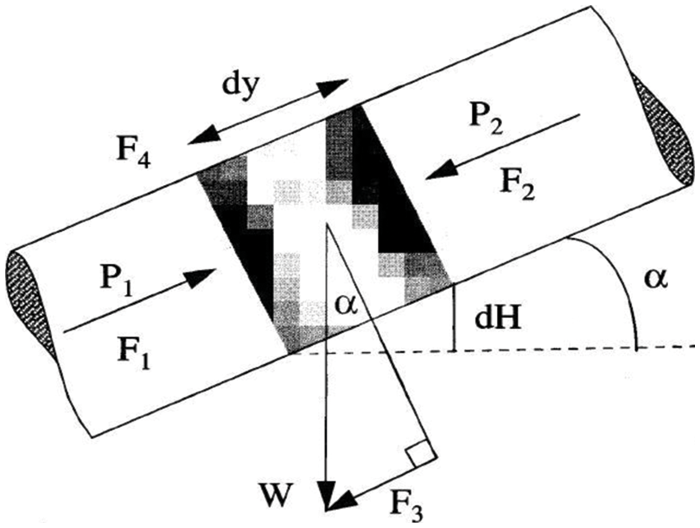
Figure 1: Shows all the forces acting on a gas particle in a non-horizontal pipeline
The forces F1 and F2 affect the gas-particle due to the gas pressure. The force F3 is applied to the gas due to the weight W of the gas-particle. F4 is the force of friction [13]. The general form of the flow equation is obtained by adding all the terms together and setting them to zero:
where the first term is kinetic energy, the second term is pressure energy, the third term is potential energy, and the fourth term is friction energy [13]. The equation of total natural gas flow in a pipeline in royal units can be written as follows:
where
In high-pressure transmission lines with medium to high flow, two types of flow regimes are usually observed [14]. 1. Completely turbulent flow (rough pipe flow); 2. Semi-turbulent flow (smooth tube flow)
The flow regime is defined as follows:
where
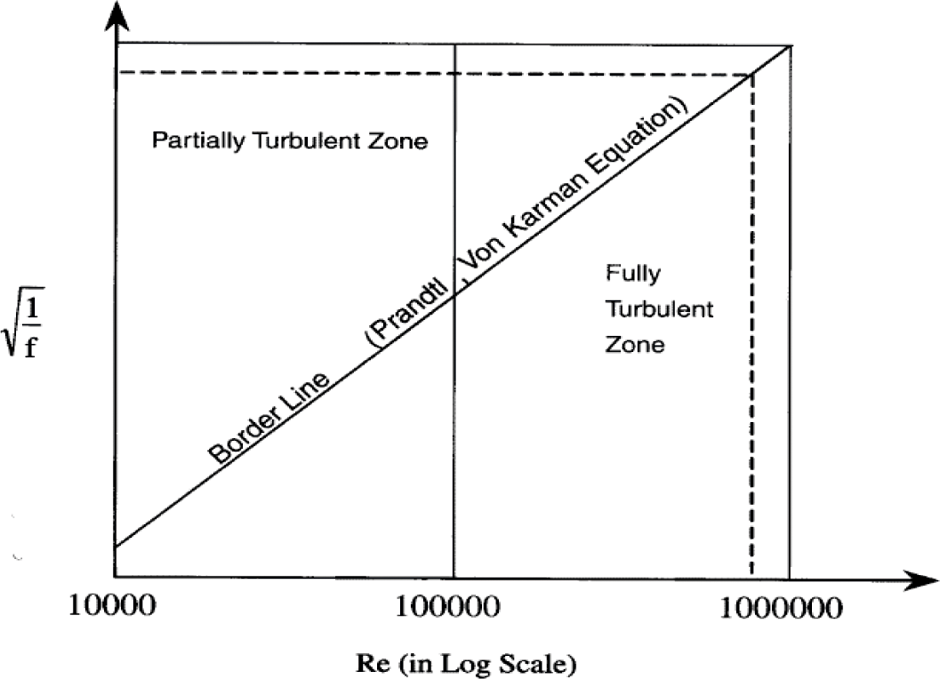
Figure 2: Shows completely turbulent/semi-turbulent areas
The design method is based on the full use of pressure drop and the development of the thermohydraulic model for compact converters [17]. This pressure drop model relates a specific current to the total volume of the converter and the heat transfer coefficient on the side of the converter. The heat transfer function for different compact surfaces by Reynolds number is as follows:
The term j is known as the Colborn factor and is defined as follows:
Prantel and Stanton numbers are defined as follows:
For the Reynolds number transmission channel, it is a function of the hydraulic diameter of the surface and is defined as follows:
As a result, the heat transfer coefficient is h:
AC is the free surface current, and Kh is as follows:
Eq. (10) expresses the heat transfer coefficient as a function of physical properties, the mass velocity of flow and the free surface of the flow.
2.3 The Effect of Different Parameters on the Hydraulic Capacity and Flow Rate of Gas Transmission Lines
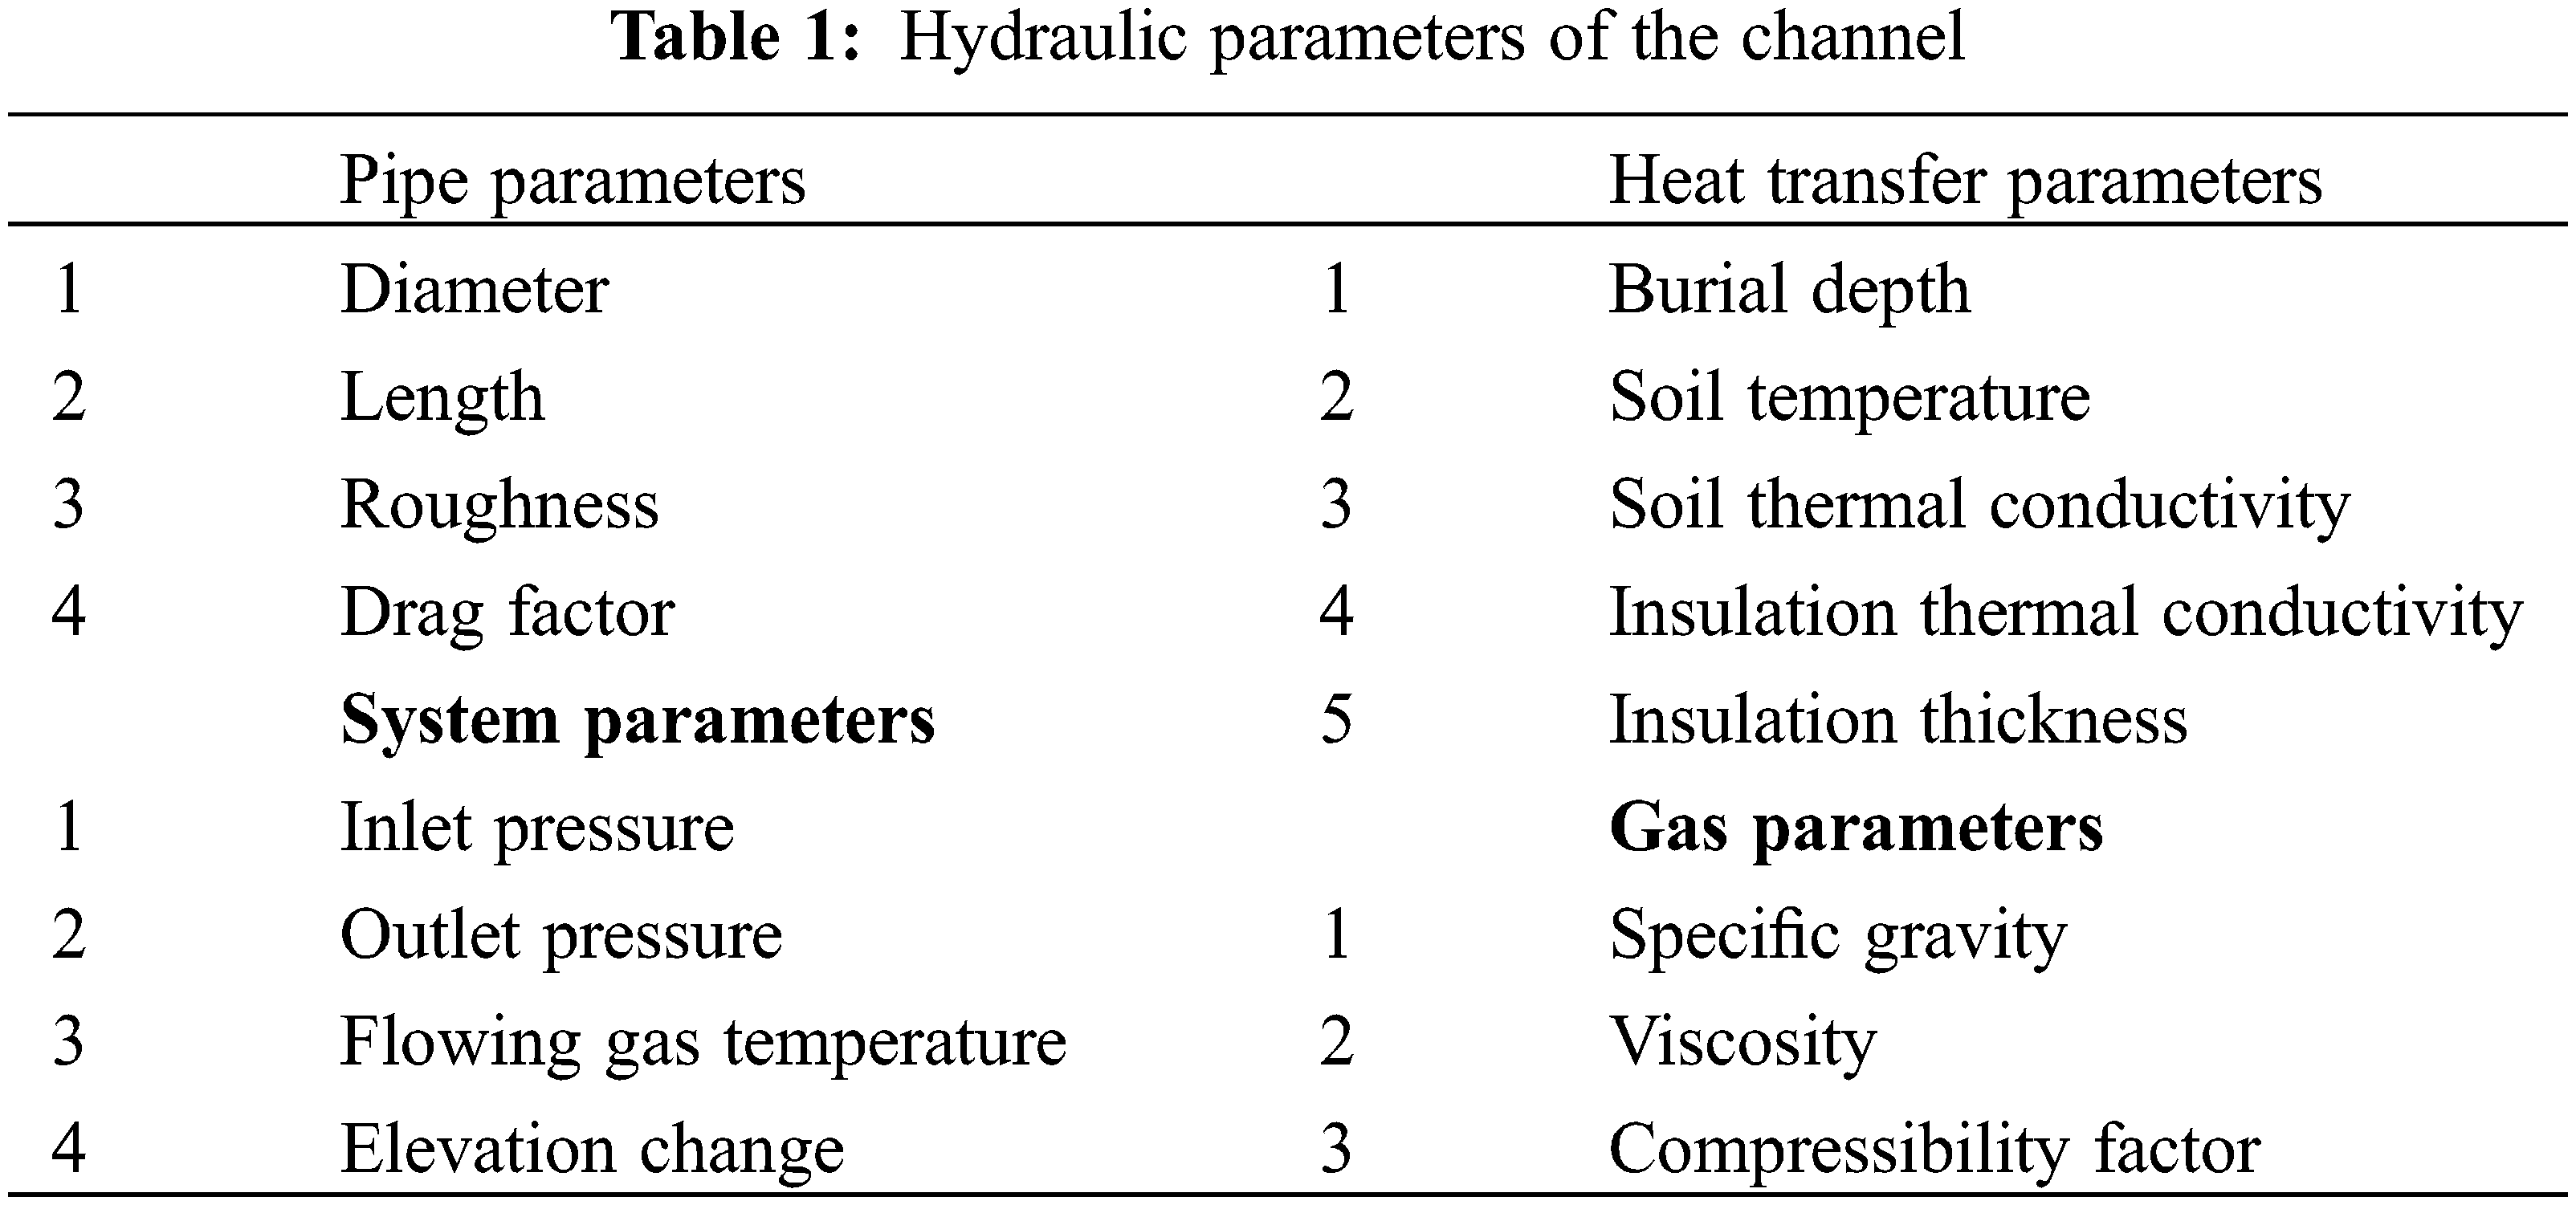
Hydraulic parameters are basic parameters that affect the behaviour of gas flow during transmission. They fall under the four broad headings shown in Table 1.
In this paper, we first briefly introduced the gas transmission network and its main components, which included pipelines, booster stations, etc., and then a mathematical model was presented to determine the location of pipelines and the optimal number of booster stations. In this model, it is assumed that the network is in a stable state. In the next step, the model developed by the software and data of the gas transmission network in Iran was solved [18,19].
The design shows the desired cavities in terms of surface, volume and overall heat transfer coefficient. In designing these cavities, it is necessary to have the surface specifications that are involved on both sides of the heat channel. As a result of these studies and experiments, we find the parameters affecting the efficiency of the gas transmission control network. Modification of the geometric structure of the middle part: by examining the gas velocity in the channel, it is determined The side parts and areas are close to the channel wall and this indicates that one of the important and effective factors in reducing the efficiency of the gas transmission system components is the improper geometry of the channel section or air passage chamber. In fact, the geometric structure of this part has a very significant effect on reducing the heat of this part of the system [20–22].
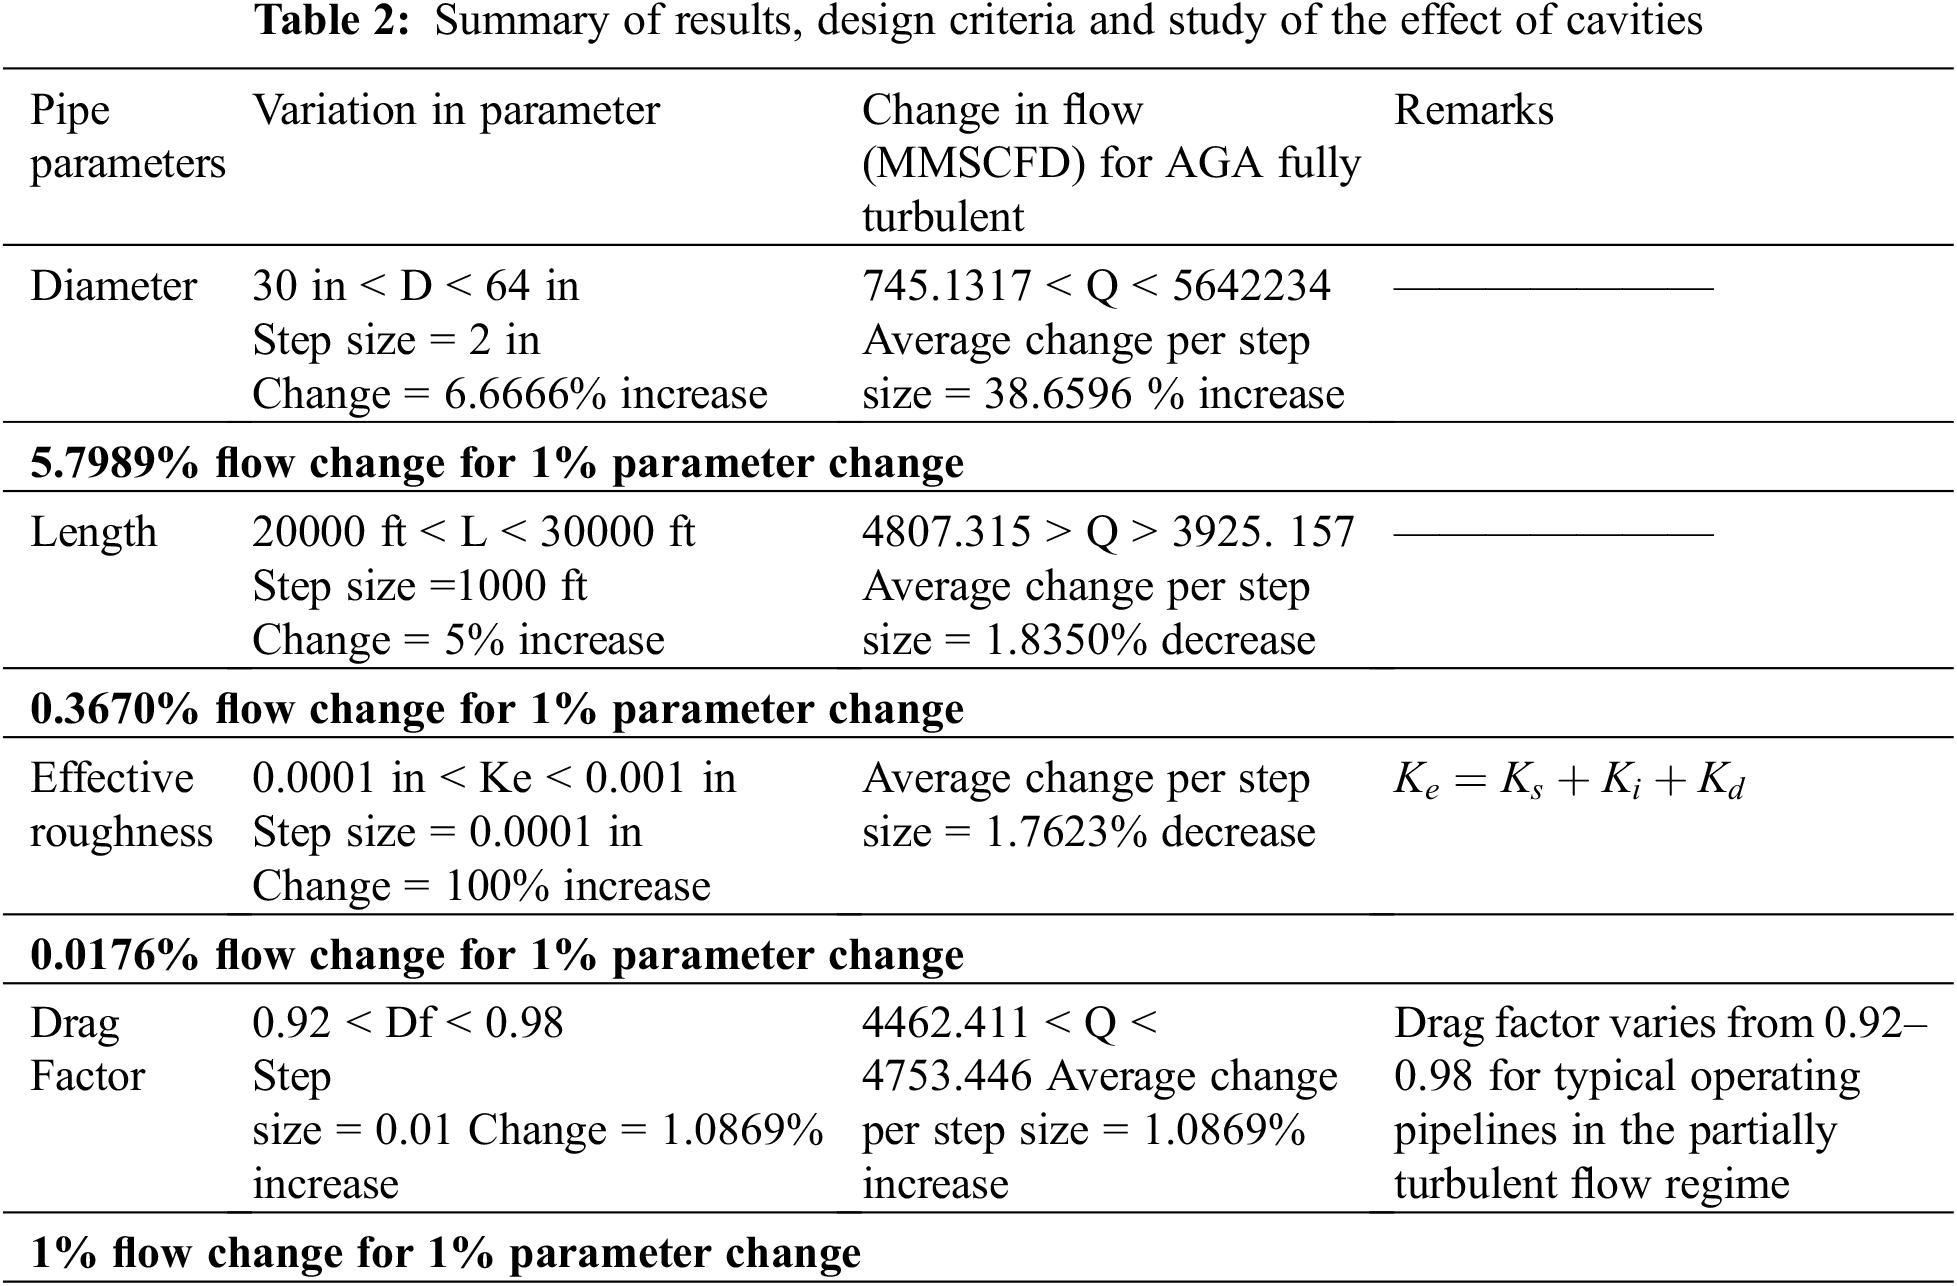
Therefore, if the geometric structure of the middle part is modified, the working efficiency of the gas transmission components system will increase [23]. Height correction of parts of the duct: the direction of the outlet airflow in the direction of the axis and perpendicular to the cooling holes of the duct. Due to the high values of speed and with regard to the above, air profiles are more inclined to leave the middle of the channel as soon as possible and enter the cooling holes of the channel. In fact, the parameters of high speed and vertical direction of airflow reduce the possibility of directing airflow to the side parts close to the wall. One way to solve this problem is to increase the height of the middle part of the duct and the cooling holes so that the angle of the airflow is somewhat adjusted and the air molecules have more opportunity to contact more space in the middle part [24,25]. In other words, as the height of the middle part or air passage chamber increases, it indicates an increase in the rate of heat transfer of the set of pipes and as a result, the efficiency of the working conditions of the gas transmission channel increases. Due to the significant increase in heat transfer coefficient by the cavities and the high values of the recourse number as well as the expressed space limitation, this important and influential factor should be examined more carefully. According to experiments and modelling, the results of the effect of changing the size of the cavities on keeping the components of the gas transmission system cool can be seen in the following Table 2:
As can be seen in Figs. 3 and 4, by increasing the diameter of the pipe and the coefficient of the tension of the pipe, by increasing the diameter and coefficient of drag, due to the reduction of pressure, it can increase the flow strength to maintain the same conditions [26–28].
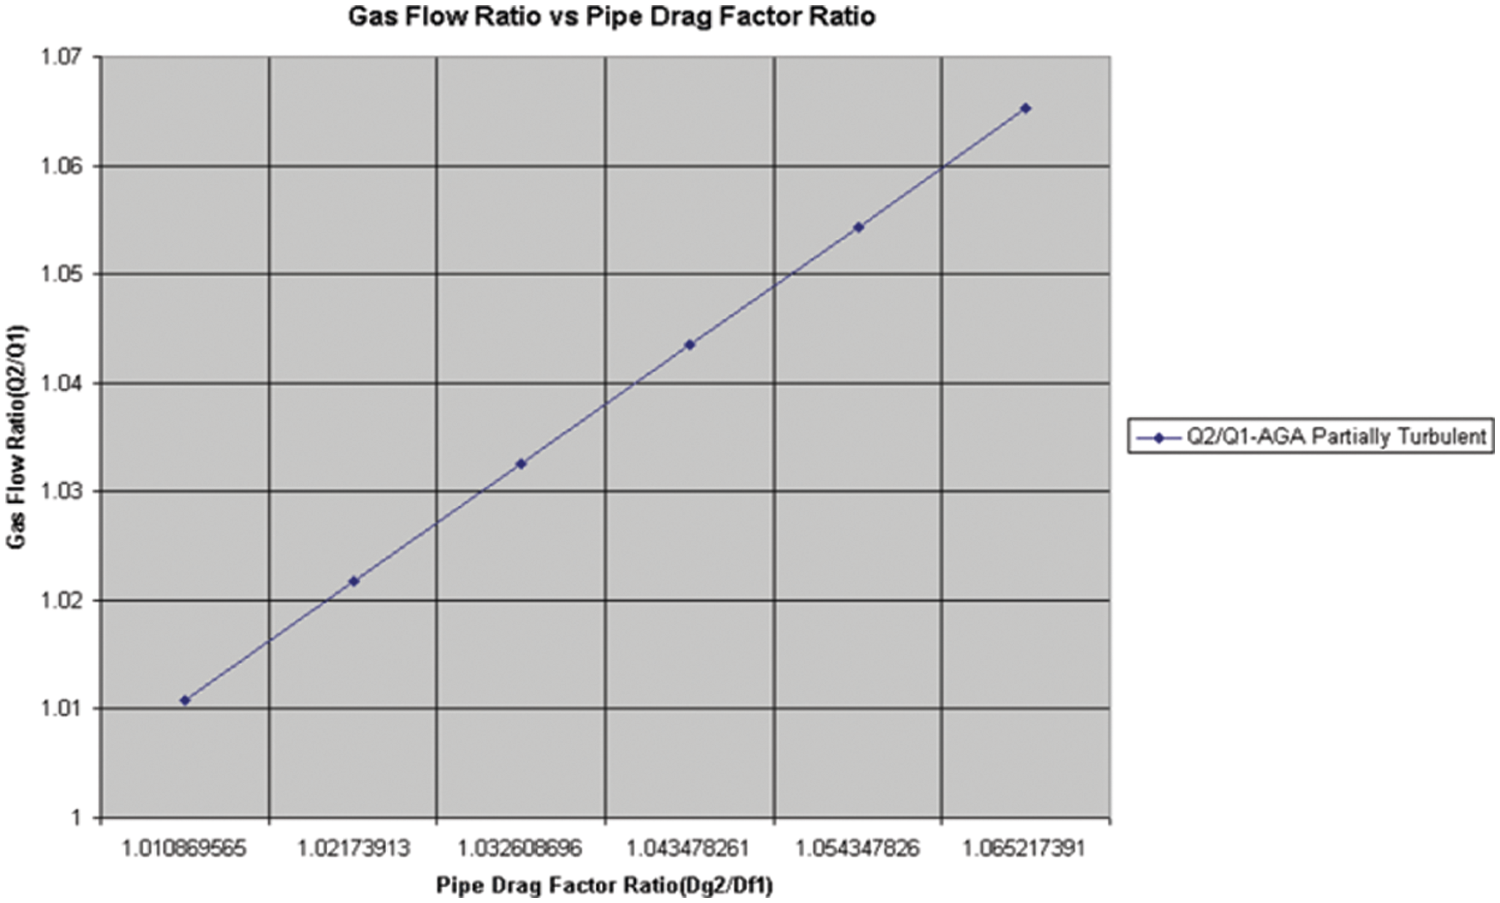
Figure 3: The impact of pipe drags factor ratio change on gas flow ratio
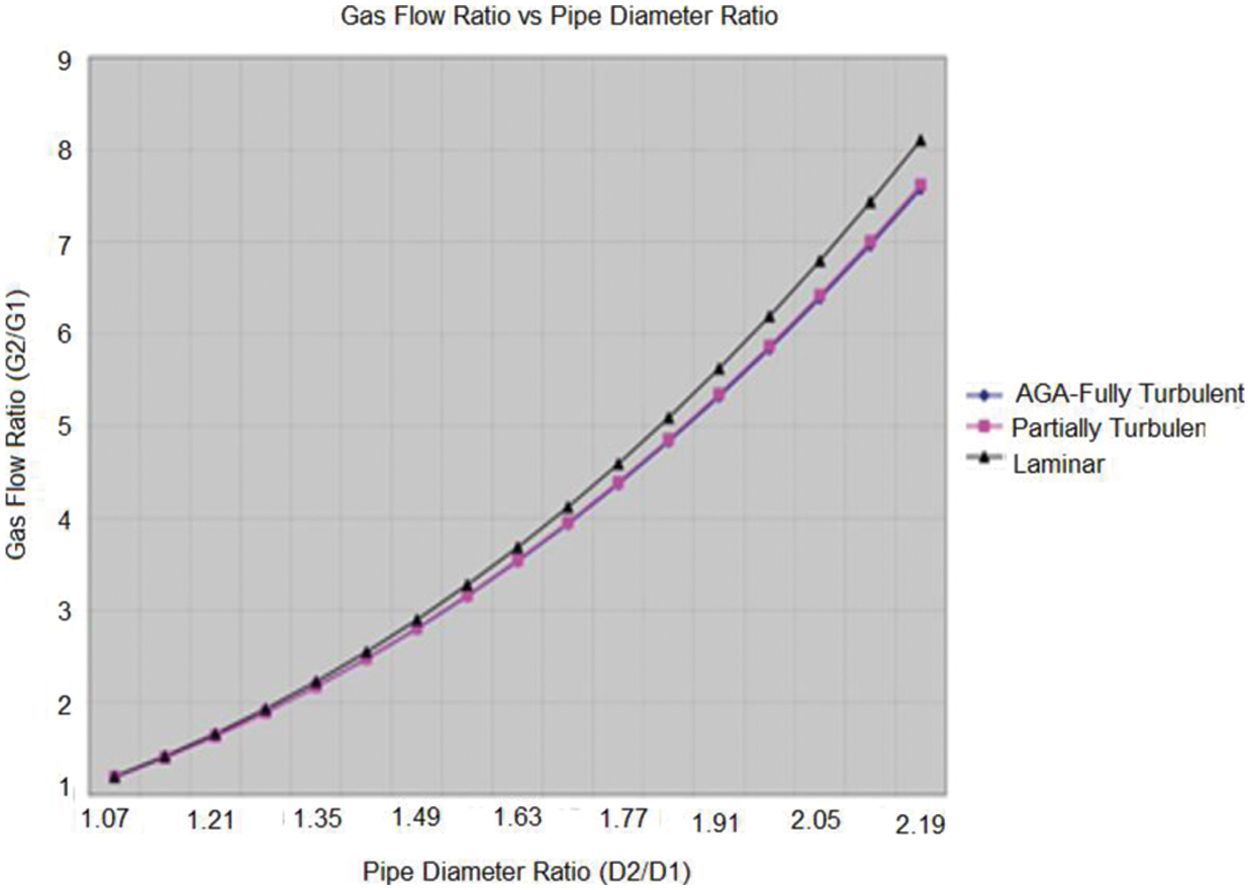
Figure 4: The impact of pipe diameter ratio change on gas flow ratio
Table 3 and Fig. 5 show the effects of the heat transfer parameter on the flow.
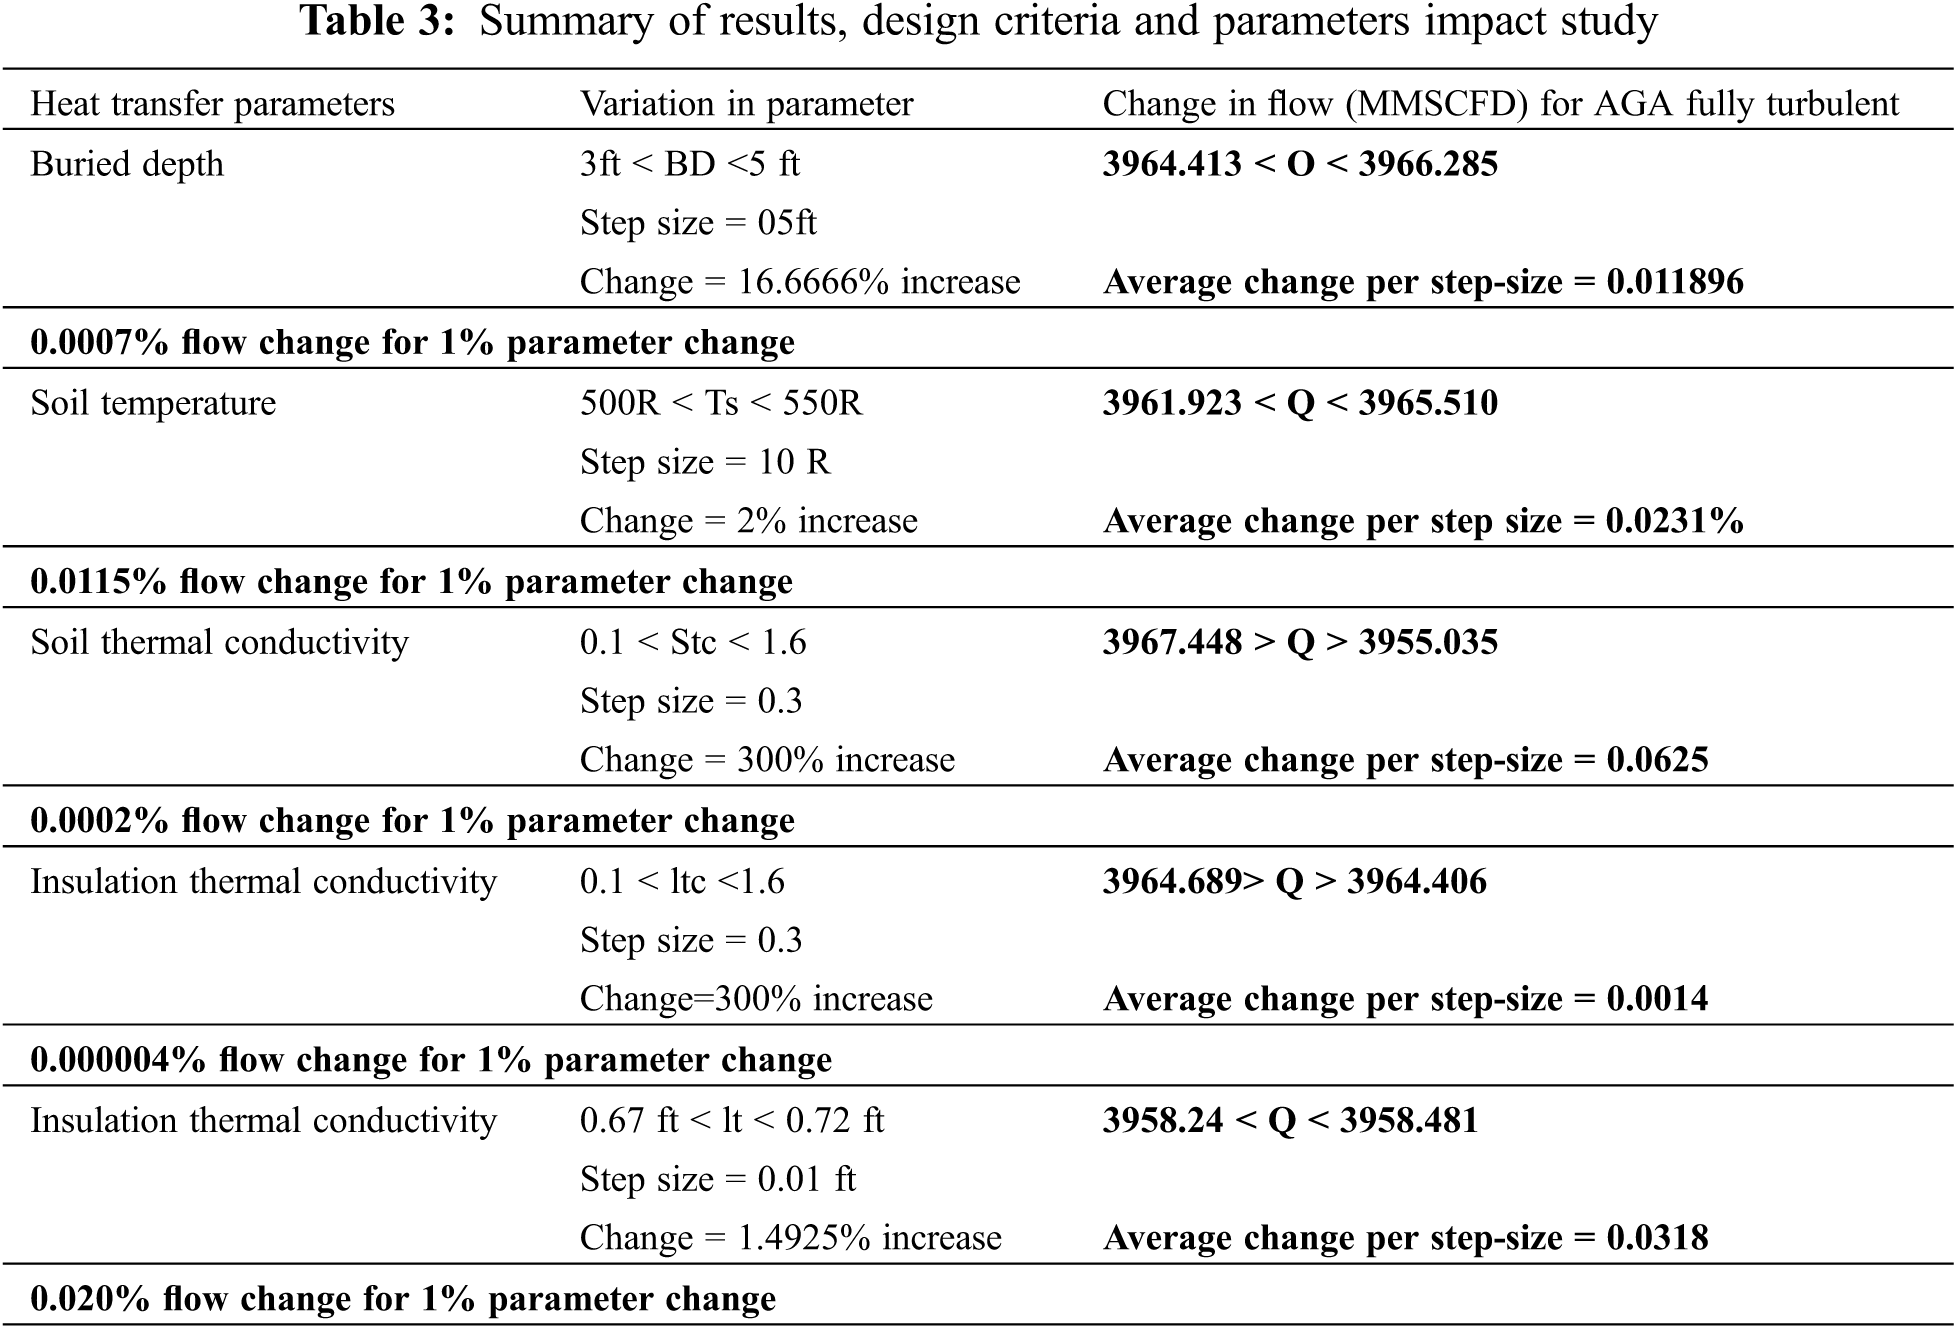
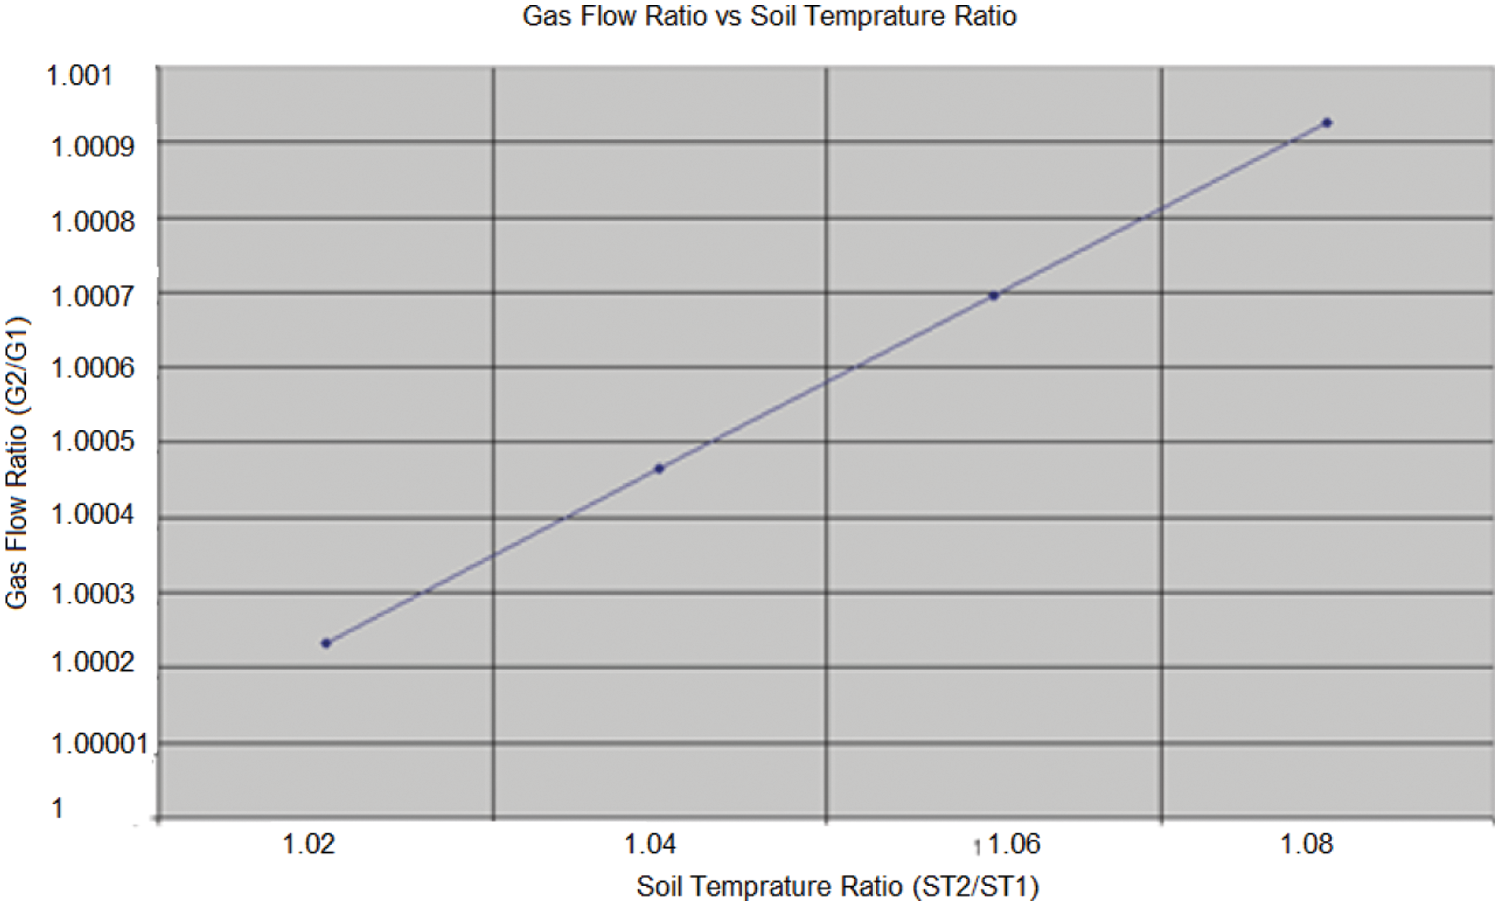
Figure 5: The impact of soil temperature ratio change on gas flow ratio
It is noteworthy that by reducing the heat transfer to the environment and reducing the tendency to liquid formation and phase change, the losses are reduced, and the flow capacity in the pipeline is increased.
The proposed methods lead to the least changes in the overall structure of cooling system and increase its efficiency. It can be concluded that by performing proper controls of different parts of the tower and making a series of changes, the efficiency of the cooling system was improved, which results in the creating efficient cooling. Further cooling of the exhaust gas from the station, in addition to reducing the gas pressure drop in the pipeline, would also reduce the fuel consumption in the compressors. It was also concluded that the measured temperature in contact with the channel walls was lower than the actual conductor temperature in the same peripheral and radial location. So, the difference increases with increasing heat production and the height of the horizontal channel. More work is needed to complete the design of partial cooling systems and its optimal control rate. The impact of these systems on the structure and configuration of gas transfer system control components also requires further studies.
Acknowledgement: The article was prepared as part of the state task “Research and development of complex energy-saving and thermoelectric regenerative systems” Application No. 2019–1497, Subject No. FZWG-2020 -0034.
Funding Statement: The authors received no specific funding for this study.
Conflicts of Interest: The authors declare that they have no conflicts of interest to report regarding the present study.
1. Nourdanesh, N., Ranjbar, F. (2021). Introduction of a novel electric field-based plate heat sink for heat transfer enhancement of thermal systems. International Journal of Numerical Methods for Heat & Fluid Flow, 38(3), 61. DOI 10.1108/HFF-08-2021-0531. [Google Scholar] [CrossRef]
2. Hadian, H., Chahardoli, S., Golmohammadi, A. M., Mostafaeipour, A. (2020). A practical framework for supplier selection decisions with an application to the automotive sector. International Journal of Production Research, 58(10), 2997–3014. DOI 10.1080/00207543.2019.1624854. [Google Scholar] [CrossRef]
3. Rasay, H., Naderkhani, F., Golmohammadi, A. M. (2020). Designing variable sampling plans based on lifetime performance index under failure censoring reliability tests. Quality Engineering, 32(3), 354–370. DOI 10.1080/08982112.2020.1754426. [Google Scholar] [CrossRef]
4. Ghalandari, M., Ziamolki, A., Mosavi, A., Shamshirband, S., Chau, K. W. et al. (2019). Aeromechanical optimization of first row compressor test stand blades using a hybrid machine learning model of genetic algorithm, artificial neural networks and design of experiments. Engineering Applications of Computational Fluid Mechanics, 13(1), 892–904. DOI 10.1080/19942060.2019.1649196. [Google Scholar] [CrossRef]
5. Qasem, S. N., Samadianfard, S., Sadri Nahand, H., Mosavi, A., Shamshirband, S. et al. (2019). Estimating daily dew point temperature using machine learning algorithms. Water, 11(3), 582. DOI 10.3390/w11030582. [Google Scholar] [CrossRef]
6. Makarova, O., Kalashnikova, T., Novak, I. (2020). The impact of energy consumption on quality of life in the world: Methodological aspects of evaluation. Economic Annals-XXI, 184(7–8), 29–37. DOI 10.21003/ea.V184-03. [Google Scholar] [CrossRef]
7. Salakhov, R., Gabdulkhakova, E. (2020). Numerical and experimental study of the impeller of a liquid pump of a truck cooling system and the development of a new open-type impeller. TehniČki Glasnik, 14(2135–142. [Google Scholar]
8. Mirsharafeddin, S. (2020). A bi-objective optimization of portfolio risk response strategies in oil and gas projects. Journal of Research in Science, Engineering and Technology, 8(4), 1–18. [Google Scholar]
9. Zhang, G., Liu, J., Sundén, B., Xie, G. (2018). On the improvement of film cooling performance using tree-shaped network holes: A comparative study. Numerical Heat Transfer, Part A: Applications, 74(4), 1121–1138. DOI 10.1080/10407782.2018.1507886. [Google Scholar] [CrossRef]
10. Faraji, M., El Alami, M., Najam, M. (2014). Numerical study of melting coupled natural convection around localized heat sources. Fluid Dynamics & Materials Processing, 10(2), 279–298. DOI 10.3970/fdmp.2014.010.279. [Google Scholar] [CrossRef]
11. Astanakulov, O., Asatullaev, Kh, Saidaxmedova, N., Batirova, N. (2021). The energy efficiency of the national economy assessment in terms of investment in green energy. Economic Annals-XXI, 189(5–6), 26–34. DOI 10.21003/ea.V189-03. [Google Scholar] [CrossRef]
12. Elnajjar, E., Hamdan, M., Haik, Y. (2013). Experimental investigation of internal channel cooling via jet impingement. Fluid Dynamics & Materials Processing, 9(1), 77–89. DOI 10.3970/fdmp.2013.009.077 2013. [Google Scholar] [CrossRef]
13. Heidary, S., Imani, M., Mostafavi, S. M. (2017). A validated and rapid hplc method for quantification of human serum albumin in interferon beta-1a biopharmaceutical formulation. MedBioTech Journal, 1(1), 26–30. DOI 10.22034/mbt.2017.60336. [Google Scholar] [CrossRef]
14. Paccati, S., Cocchi, L., Mazzei, L., Andreini, A. (2020). Numerical investigation on the effect of rotation and holes arrangement in cold bridge-type impingement cooling systems. Journal of Turbomachinery, 142(4), 041004. DOI 10.1115/1.4046454. [Google Scholar] [CrossRef]
15. Zheng, X., Cooper, E., Gillott, M., Wood, C. (2020). A practical review of alternatives to the steady pressurization method for determining building airtightness. Renewable and Sustainable Energy Reviews, 132, 110049. DOI 10.1016/j.rser.2020.110049. [Google Scholar] [CrossRef]
16. Epelle, E. I., Gerogiorgis, D. I. (2020). A review of technological advances and open challenges for oil and gas drilling systems engineering. AIChE Journal, 66(4), e16842. DOI 10.1002/aic.16842. [Google Scholar] [CrossRef]
17. Pustokhina, I., Seraj, A., Hafsan, H., Mostafavi, S. M., Alizadeh, S. M. (2021). Developing a robust model based on the gaussian process regression approach to predict biodiesel properties. International Journal of Chemical Engineering, 2021(1), 1–12. DOI 10.1155/2021/5650499. [Google Scholar] [CrossRef]
18. BoŠnjaković, M., Maglić, O., MoŠkun, D., Crnac, Z. (2019). Vortex cooled air turning of induction-hardened raceway on the wind turbine-bearing ring. TehniČki Glasnik, 13(3), 230–234. [Google Scholar]
19. Huang, K., Zhang, J., Wang, C., Shan, Y. (2019). Numerical evaluation on single-row trenched-hole film cooling performances on turbine guide vane under engine-representative conditions. Numerical Heat Transfer, Part A: Applications, 76(4), 198–219. DOI 10.1080/10407782.2019.1627830. [Google Scholar] [CrossRef]
20. Kehinde, A. G. (2019). Feasibility of once-through cooling for 50 MWe solar thermal power plant on/near the lower Orange River (Doctoral Dissertation). Stellenbosch: Stellenbosch University. [Google Scholar]
21. Ma, Z., Lee, Y. (2008). Patent application and technological collaboration in inventive activities: 1980–2005. Technovation, 28(6), 379–390. DOI 10.1016/j.technovation.2007.07.011. [Google Scholar] [CrossRef]
22. Tu, Z., Mao, J., Han, X. (2017). Numerical study of film cooling over a flat plate with anisotropic thermal conductivity. Applied Thermal Engineering, 111, 968–980. DOI 10.1016/j.applthermaleng.2016.09.170. [Google Scholar] [CrossRef]
23. Andreini, A., Cocchi, L., Facchini, B., Mazzei, L., Picchi, A. (2018). Experimental and numerical investigation on the role of holes arrangement on the heat transfer in impingement/effusion cooling schemes. International Journal of Heat and Mass Transfer, 127(3), 645–659. DOI 10.1016/j.ijheatmasstransfer.2018.06.102. [Google Scholar] [CrossRef]
24. Chaplynskiy, K., Sydorov, O., Shapovalov, D., Antoniuk, O. (2021). Interaction between economy and law through the example of China: From the retrospective to the development prospect. A critical analysis and comparison with developed democracies. Economic Annals-XXI, 187(1–2), 15–28. DOI 10.21003/ea.V187-02. [Google Scholar] [CrossRef]
25. Hosseini, S. E., Bahrami, M. (2020). Designing an integrated model of oil and gas management with a SWOT approach: The case of NIOC. Tehnički Glasnik, 14(4), 440–445. DOI 10.31803/tg-20200514234542. [Google Scholar] [CrossRef]
26. Jing, Q., Xie, Y., Zhang, D. (2019). Effects of channel outlet configuration and dimple/protrusion arrangement on the blade trailing edge cooling performance. Applied Sciences, 9(14), 2900. DOI 10.3390/app9142900. [Google Scholar] [CrossRef]
27. Hoseini, M., Haghtalab, A., Navid Family, M. (2020). Elongational behavior of silica nanoparticle-filled low-density polyethylene/polylactic acid blends and their morphology. Rheologica Acta, 59(9), 621–630. DOI 10.1007/s00397-020-01225-5. [Google Scholar] [CrossRef]
28. Zhou, H., Cen, K. (2018). Combustion optimization based on computational intelligence. London, UK: Springer. [Google Scholar]
 | This work is licensed under a Creative Commons Attribution 4.0 International License, which permits unrestricted use, distribution, and reproduction in any medium, provided the original work is properly cited. |