| Fluid Dynamics & Materials Processing |
DOI: 10.32604/fdmp.2022.019532
ARTICLE
Systematic Investigation of Two-Phase Flow in Special Channels
1Department of Information and Robototechnic Systems, Belgorod State University, Belgorod, 308015, Russia
2Al-Nisour University College, Baghdad, 10012, Iraq
3College of Science for Women, University of Babylon, Babil, 51002, Iraq
4Departement of Aquatic Management, Faculty of Fisheries and Marine Science Universitas Negeri Gorontalo, Gorontalo, 96128, Indonesia
5Kazan Federal University, Kazan, 420008, Russia
6Lipetsk State Technical University, Lipetsk, 398600, Russia
7Department of Dentistry, Kut University College, Kut, Wasit, 52001, Iraq
*Corresponding Author: Oleg R. Kuzichkin. Email: golubeva.julivgt@inbox.ru
Received: 28 September 2021; Accepted: 28 December 2021
Abstract: A systematic study of two-phase (water-air) currents in open channels (water-air) has been conducted by means of experiments and numerical simulations. A dedicated device has been designed and manufactured on purpose. The numerical simulations have been based on the solution of a system of mass, momentum and energy balance equations for a two-phase fluid. The effect of different influential parameters has been explored, namely, velocity and dimensions of the channel, surface pressure and tension.
Keywords: Two-phase; special channels; systematic study; pressure drop
Gas-liquid two-phase flows have many applications in the oil and gas, petrochemical, nuclear technology, and other industries. One of the main industrial applications is two-phase currents in pipes, which are used in different slopes from horizontal to vertical. One of the most important natural and unintended phenomena of this interaction is the mixing of water passing through the structures and the surrounding airflow, which in some cases causes severe reactions between the existing climate and causes considerable damage. This type of current is called “two-phase current” [1–4]. One of the most important problems in the analysis of two-phase current in pipes is to determine the exact pattern of flow or distribution of liquid and gas phase inside the pipe [5]. Since many important design and engineering parameters such as pressure drop, mass transfer, heat transfer, etc., are closely related to the distribution of phases, so determining this distribution or in other words determining two-phase flow patterns is one of the essential requirements for two-phase flow analysis. Two-phase flow follows all the rules governing fluid mechanics. Two-phase current systems are highly complex (even one-dimensional two-phase currents in ducts) and many characteristics make these types of currents indeterminate and complex compared to single-phase currents [6]. To simplify these complexities, various researchers have conducted model experiments to use laboratory and experimental results to obtain simple equations for the analysis of practical and engineering problems, two-phase climate flows in various problems, and Various structures occur-including chemical processes, energy generation and formation, water collection and transmission systems, the oil industry, and offshore hinge lines for oil transportation [7].
It should be noted that despite many attempts to classify the types of biphasic flow regimes, all of these methods are highly qualitative and often conform to the personal views of different researchers. So far, different regimes have been defined, and a wide range of titles have been used for this purpose. These patterns are flow, layer or mould flow, layer flow, wave flow, mixing flow, annular flow, and droplet flow. Methods for predicting two-phase flow patterns within flow transmission pipelines are generally divided into two groups: using experimental and laboratory facilities and using analytical models [8]. For many years, the prediction of various two-phase air-water flow regimes in pipelines has been considered through experimental experiments. A common method for this purpose is to collect experimental data on the flow rates of the gas and liquid phases and the physical properties of each phase on a section of pipeline under test. Many studies have now been conducted in the fields of experimental, kinematic, and dynamic two-phase flow modelling, but many aspects of this phenomenon remain unknown [9–11]. Usually, the necessary research is done to identify the types of biphasic flow patterns in the channel and tubular lines of biphasic current transmission using direct current observation method. Among the methods that make these observations possible are “very fast photography” and “X-ray audiography”; So that using the received images, the type of current available can be interpreted to some extent.
The most important possible patterns in horizontal and near-horizontal ducts (tunnels and closed ducts) are floc, wave, and stratigraphic regimes. Especially when the duct length is long, other diets occur in a very small length and very quickly become the main diets mentioned with a limited length transfer, and even if they appear, they generally have many similarities to the three mentioned diets. Typically in large sloping canals, the flow velocity in operation is more than 5 to 10 m/s, and the Reynolds number is in the range of 107 to 109 and surface aeration is almost always on these Structures are observed. Due to the existence of various equations and parameters governing such high velocity and aeration flows, their numerical analysis is not possible, and in most cases to solve many problems related to hydraulics, such flows have to use hypotheses and simplifications. We are the ones who make the results differ from reality [12].
In [13], a three-dimensional Eulerian method was presented for simulating dynamic systems comprising multiple compressible solid and fluid components where internal boundaries are tracked using level-set functions. Due to the observed geometric similarities, many researchers consider these regimes as one of the three main regimes mentioned. The stratigraphic regime occurs when water or liquid phase at the bottom of a pipe or channel and close to the floor, and air with The gas-phase moves in the upper part of the liquid stream and close to the ceiling and two separate layers are formed [14]. Wave regime occurs when the airflow increases relative to the stratigraphic flow and alternating and uniform waves form and move along the tube. As the flow rate or velocity of the air increases relative to the wave current, the waves touch the roof of the tunnel under certain conditions, causing the air layer to rupture, resulting in a clotting regime. An important and significant issue in biphasic currents is that these types of currents have an oscillating and time-dependent nature. Depending on the flow regime, these oscillating characteristics change. This oscillating nature of the current causes special reactions in the biphasic current. In this paper, we try to study the kinematics of two-phase current in open channels using methods [15].
The model used in this research, according to Fig. 1 is a combination of the main water transmission channel with a diameter of 0.09 and a length of 10 meters. The upstream tank is a metal tank in the shape of a rectangular cube, which is installed in the middle of its longitudinal wall at the height of 5 cm from the bottom of a hole with a diameter of 1.5 m in order to connect the duct to the tank [16].
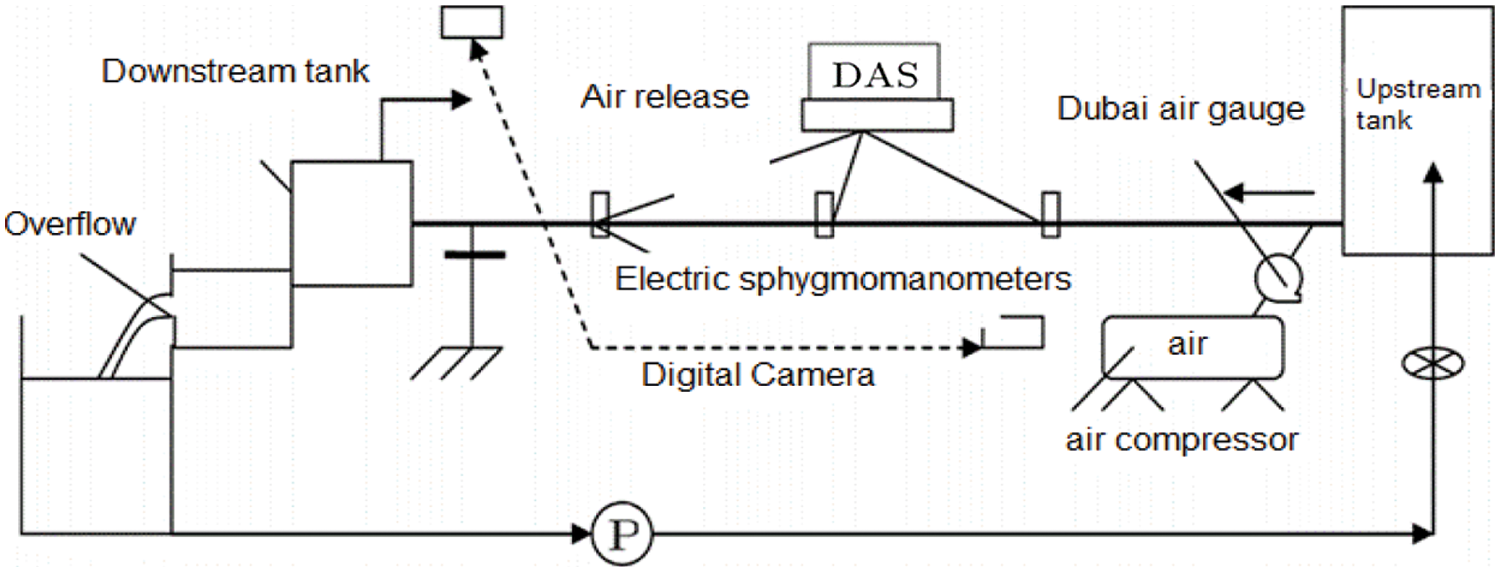
Figure 1: A general overview of parts of the laboratory model
Governing equations for above presented flow include continuity, momentum and energy [17]:
where, P is the pressure,
where e is the internal energy of each phase. Also, the rate of work on two-phase control volume is calculated by:
Energy rate added to each phase by mass transfer:
Finally, the energy conservation equation for each phase of the steady stream without the presence of a heat source is written in the form of Eqs. (7) and (8):
It should be noted that the phrase of Eq. (9) indicates the input energy rate to each phase:
Laboratory flow conditions In order to evaluate the turbulence characteristics of the mixed airflow on a physical model of fast water, the range of discharges is between 13 to 38 litres per second. The existing pumping system, the volume of water in the laboratory tanks, the geometric dimensions and the discharge-Ashle curve of the rapid water model were considered [18]. The design and construction of the physical model were based on the law of landing similarity. It is necessary to mention that in order to ensure that the “scale effect” is insignificant, an attempt was made to provide conditions in the model so that forces that are not large and effective in principle are not effective in the model as well [19]. These conditions were created by selecting the appropriate scale and geometry, controlling the minimum flow depth in the model, controlling the minimum surface roughness, and so on. In this research, the properties of the liquid used in the experiment are as follows:
The flow simulation was performed for the geometry similar to the device made in three dimensions so that the results could be compared well [20]. The effect of gravity was also considered, and it was also assumed that there is no mass transfer between the two phases and that both phases are incompressible; Because the length of the pipe is short and the pressure changes at this length are not large, according to the two-phase flow analysis in the transient state, a time step of 0.001 s was used, and the calculations continued until reaching the steady-state [21].
Apparent weather speeds are defined as follows:
The fluid which used in all cases enters the pipe vertically 998 kg/m3 and the water density was set at 225.1 kg/m3. Speed input limit condition was used for input, and the output current limit condition was used for output [22].
3.1 Mesh Independence Analysis
The first step in examining the independence of the solution from the network is to generate a large network and simulate it. Under these conditions and after convergence solves, the desired result as shown in Fig. 2 for pressure in two-phase compensation. To do this, first shred the grid and increase the number of elements and cells to repeat the simulation using the new grid. Then, to check the independence of the solution from the network, the network is slightly smaller and the pressure drop is recorded. This process of refinement and simulation continues until the difference of the desired parameter in the two final simulations is very small and their difference is less than the desired error. In this case, the process of checking the independence of the solution from the network is stopped and the last one network that has a similar answer to the last network is considered as the optimal solution network.
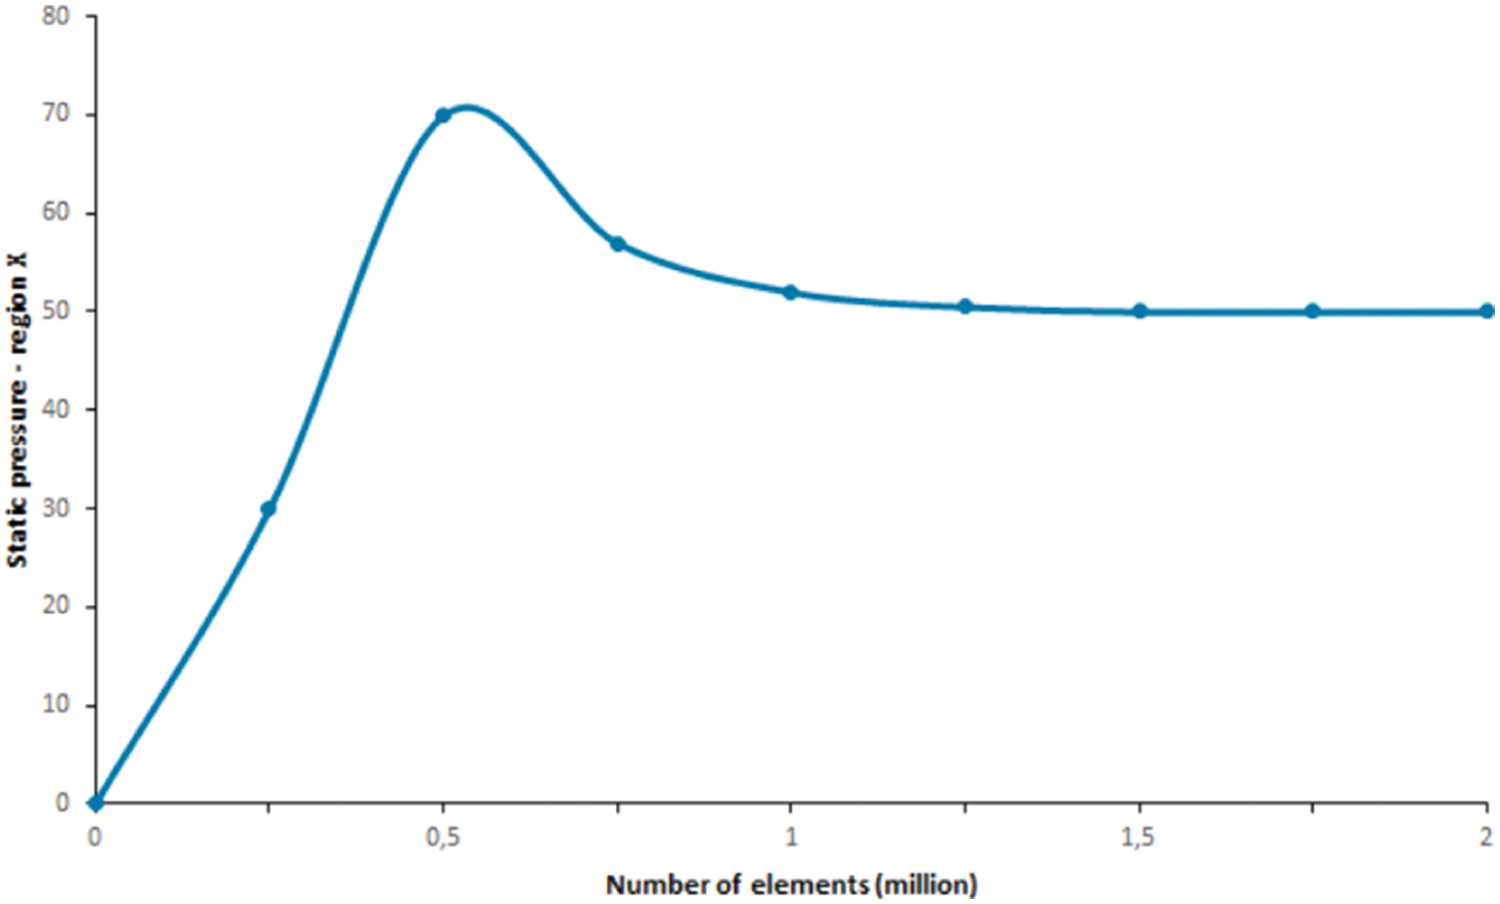
Figure 2: Mesh independent analysis
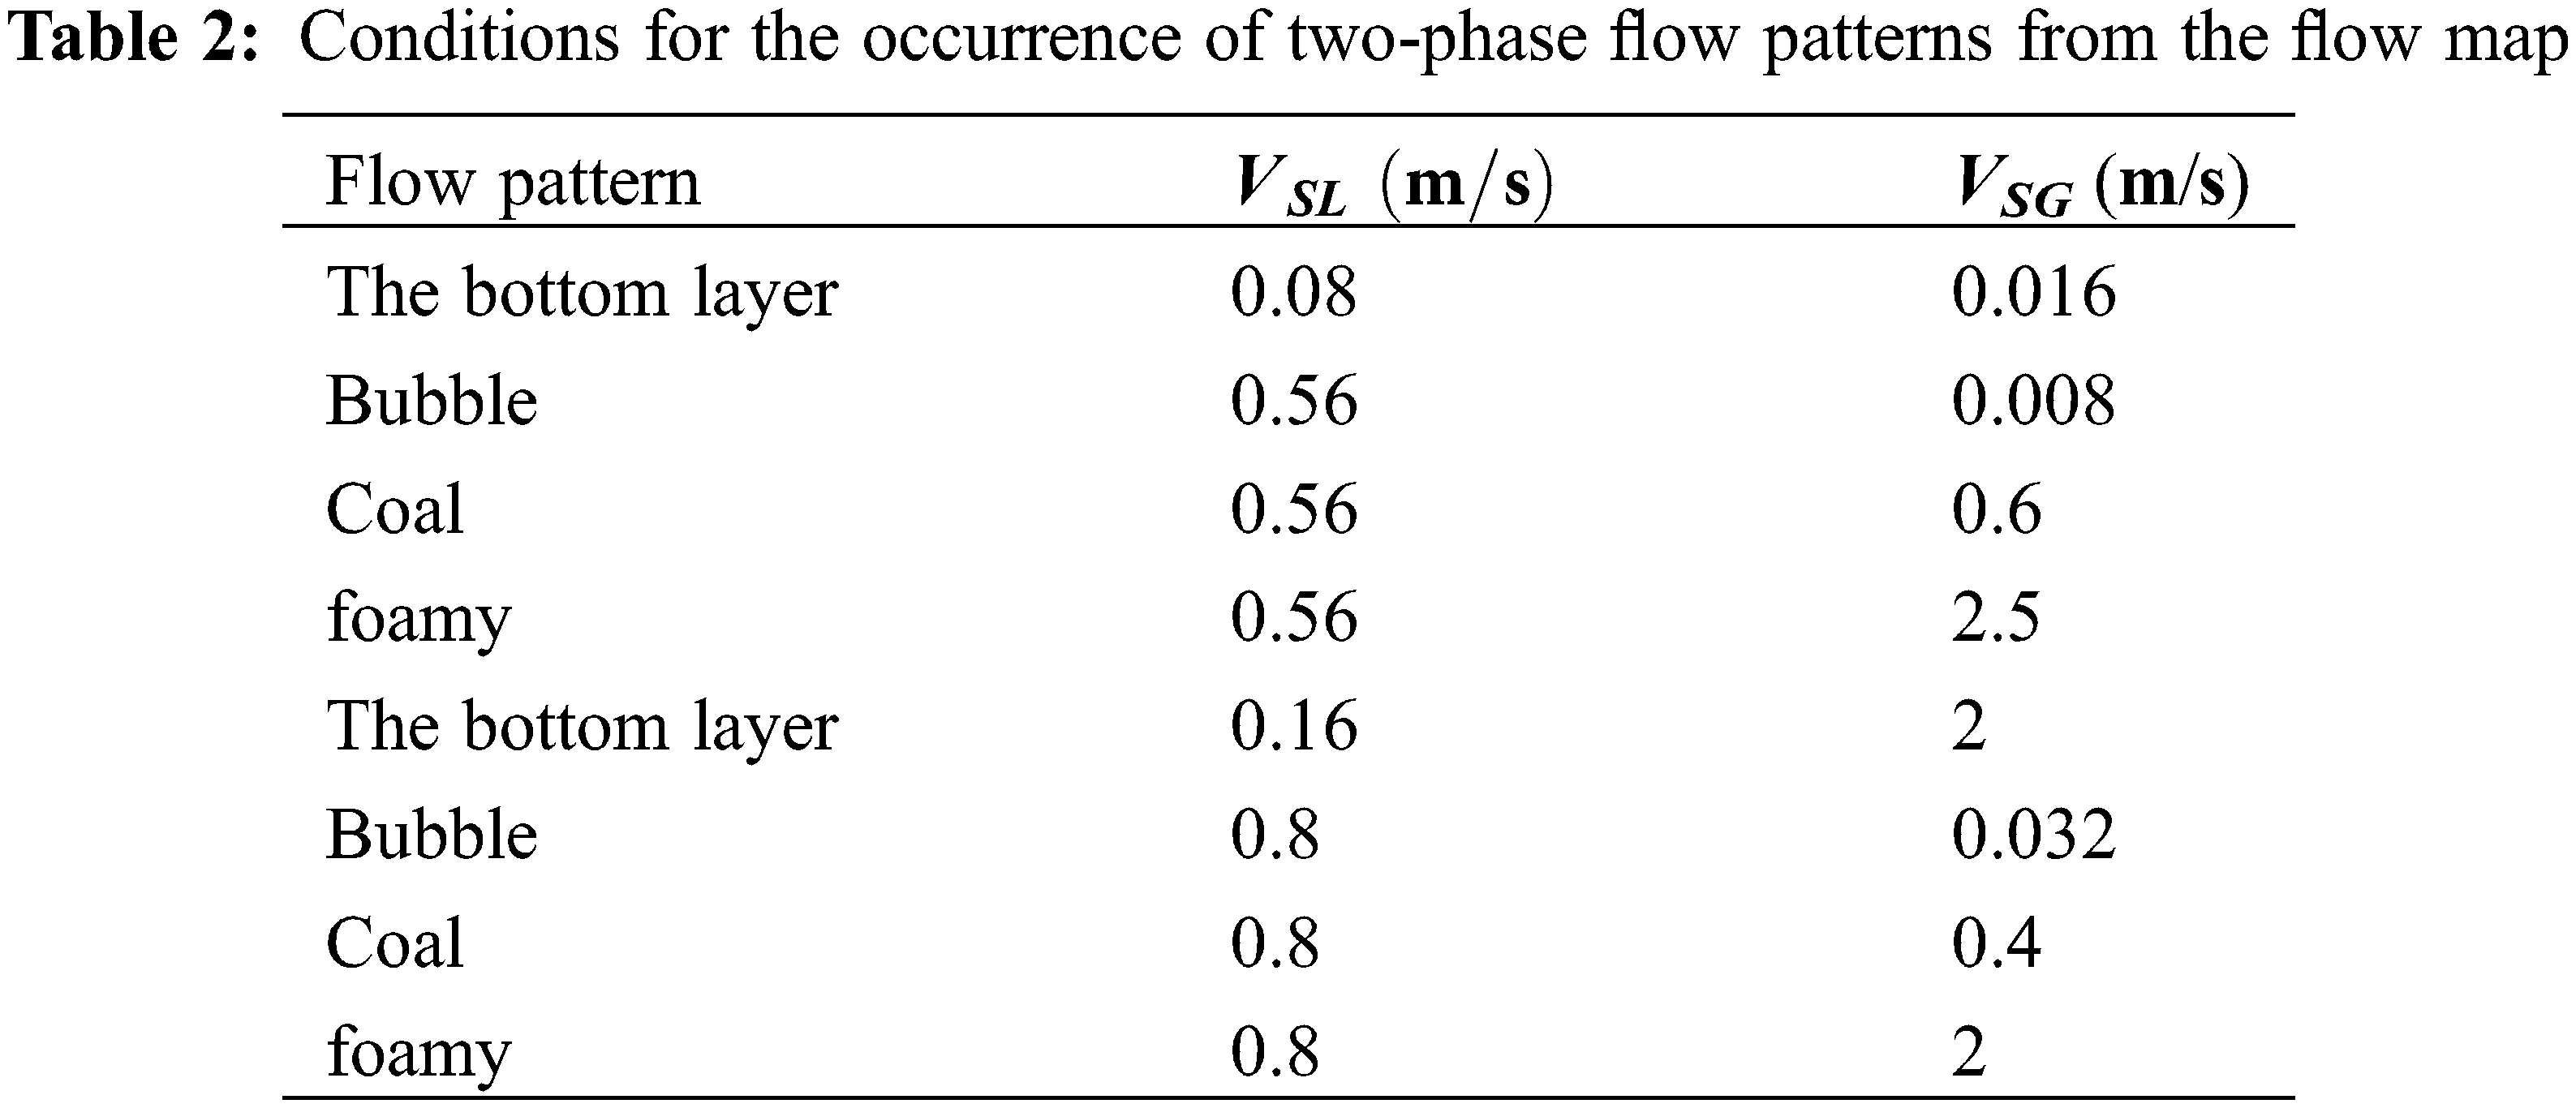
There is currently a severe lack of information regarding appropriate standards and design methods for predicting the hydraulic characteristics of biphasic flows, especially in hydraulic structures due to lack of information and insufficient research, whether theoretical or laboratory. In such cases, it is usually based on previous experience or speculation [23]. Carefully in this form, the closeness of the information obtained in this study and the results of previous research can be seen. Therefore, at first glance, the flow pattern map obtained in this research can be a suitable tool for predicting two-phase flow patterns.
As shown in Fig. 3, the results of measurements related to the velocity and turbulence characteristics of two-phase airflow were performed completely for a number of dimensionless flow parameters [24]. The maximum water load on the inlet opening of the canal is between 25.89 to 95.93 cm and is equivalent to the flow rate of 0.0167 to 0.02 cubic meters per second per unit width. The landing number of the stream approaching the overflow is in the range of 0.663 to 1/007. The results of distribution and dispersion of variable values of climate flow velocity and parameter without turbulence intensity dimension indicate some of the characteristic features of this type of two-phase flow that the conditions of occurrence of two-phase flow patterns were obtained from the flow map according to the
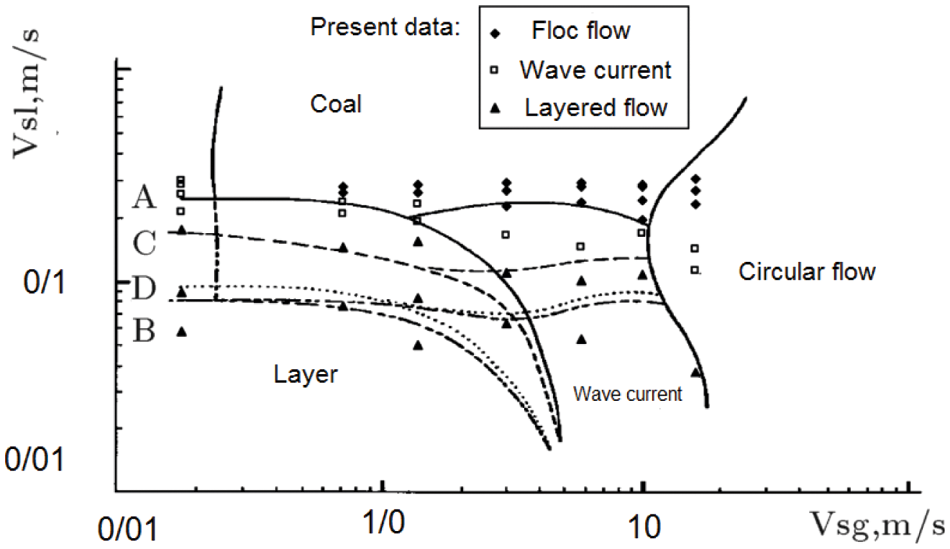
Figure 3: Comparison of current test results with previous research
Tables 1 and 2, respectively [25].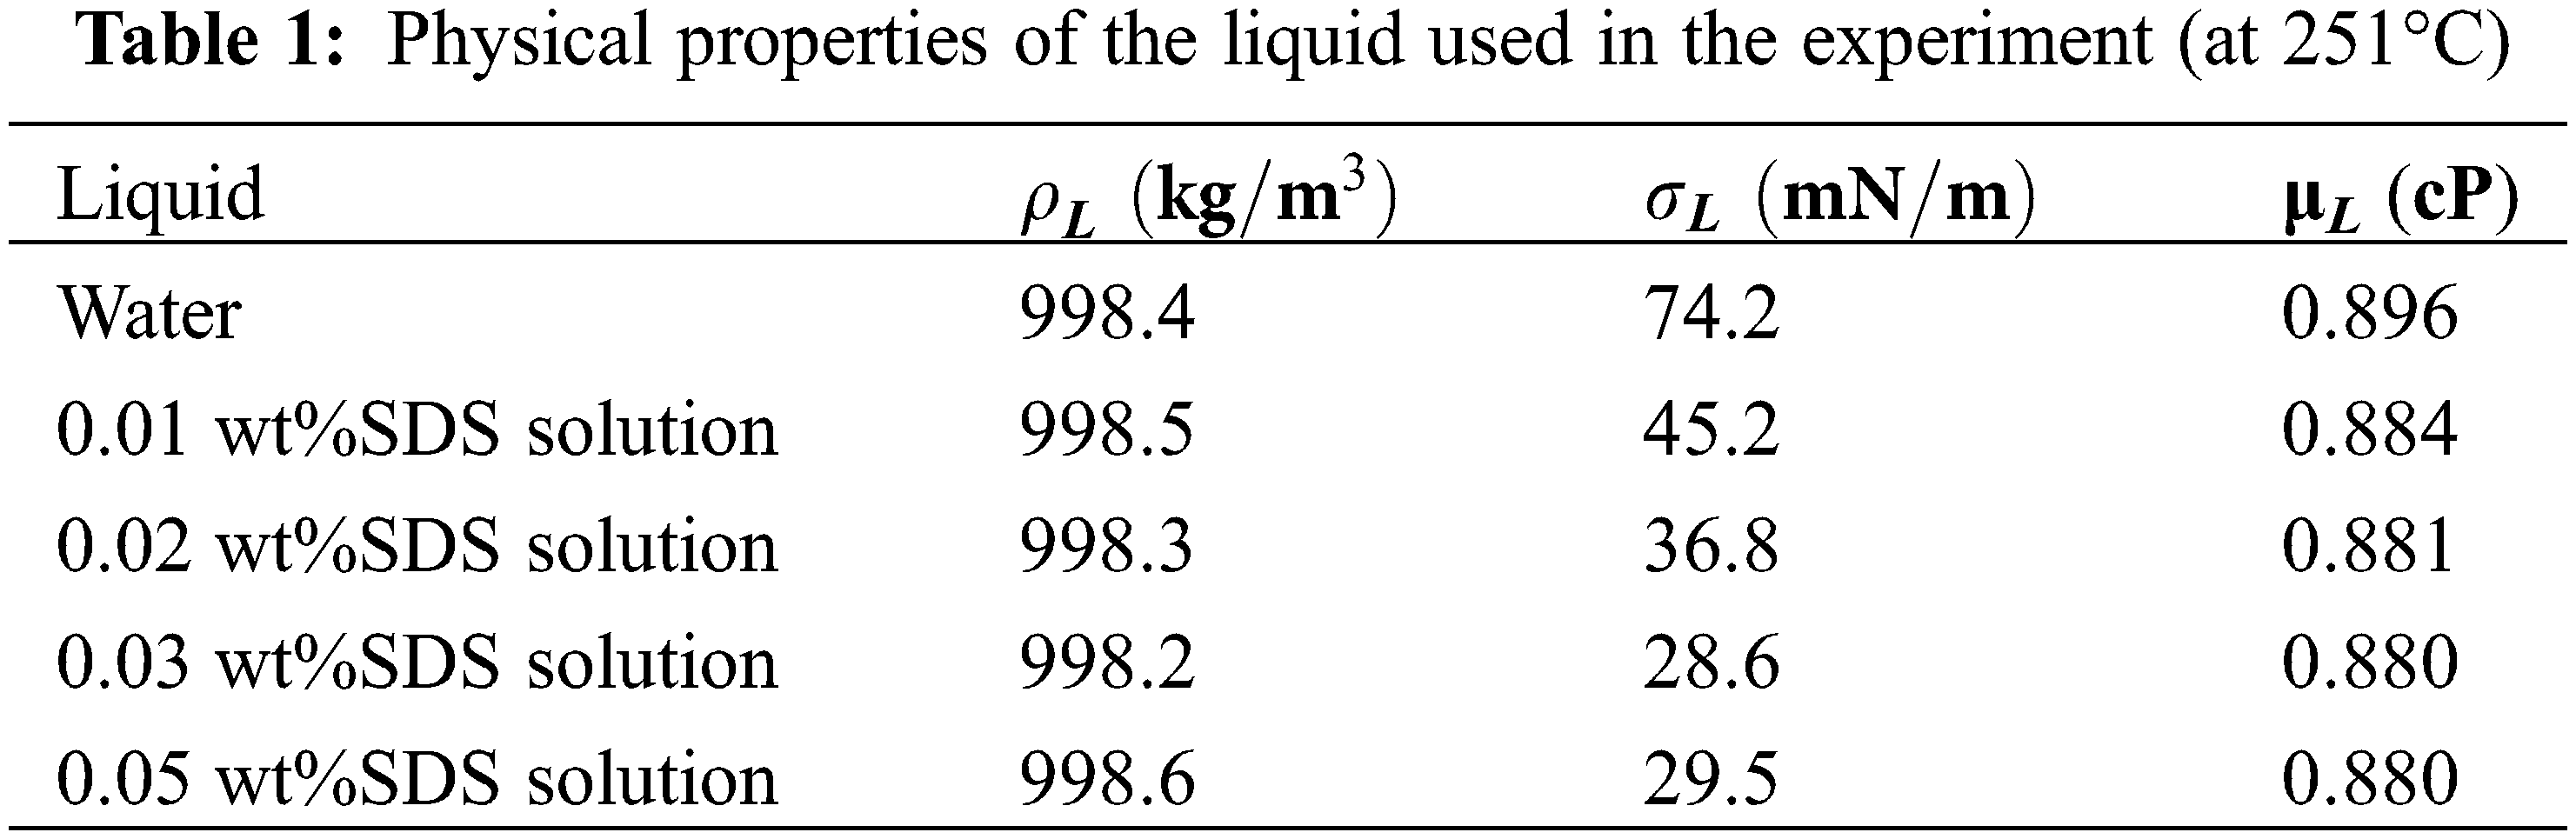
Reynolds number,
Fig. 4 shows the two-phase flow pressure drop profiles. In general, channels are when the channels are hollow, which is intended to be compared to a porous media channel. The common feature of these three curves is the decrease in pressure drop, followed by a sudden increase. The reason is the transfer of the two-phase flow pattern from the stratified flow in one channel and the stagnant fluid in the other channel to the stratified currents in both channels.
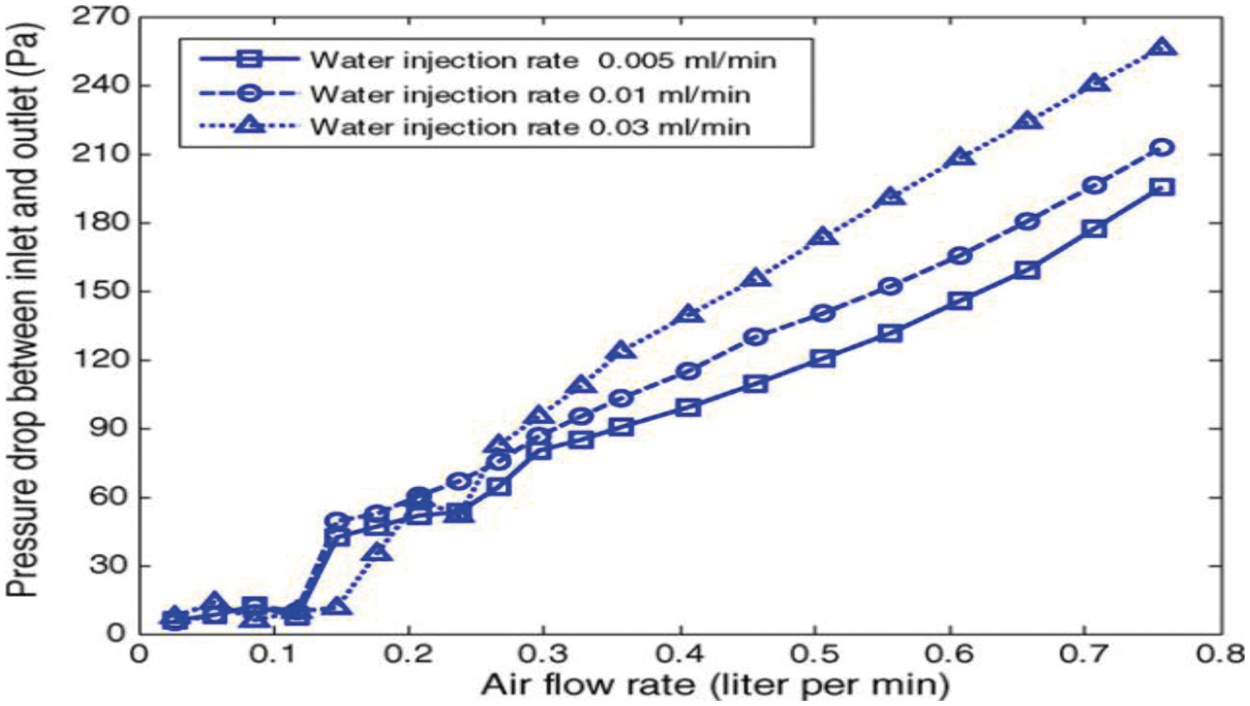
Figure 4: Pressure drop profiles
Fig. 4 shows typical images of two-phase currents observed in a circular microchannel with different gas flow velocities and low liquid flow rates (Fig. 5a), medium liquid flow rates (Fig. 5b), and high liquid flow rates (Fig. 5c).
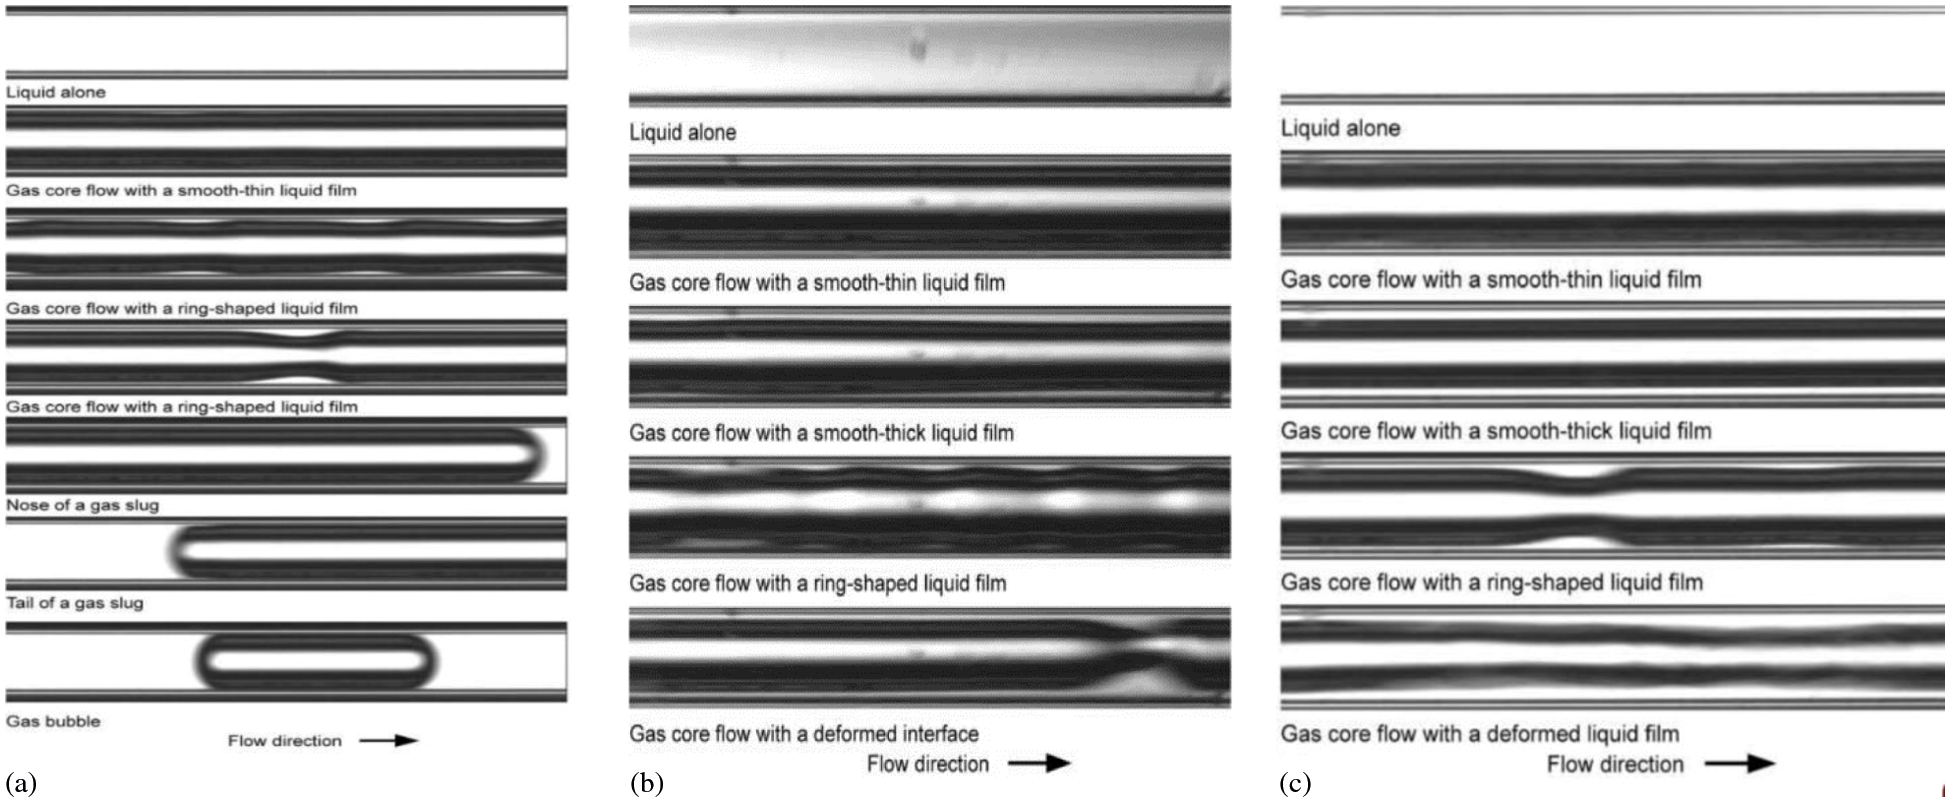
Figure 5: Typical images of two-phase currents
In a given flow condition, different flow patterns are observed which, depending on the surface configuration, can be classified into five distinct patterns: “liquid alone (or liquid snail) “,” gas core with the smooth thin liquid film “,” Gas core with the smooth liquid film “,” Gas core with the ring-shaped liquid film “and” Gas core with deformed interface “Liquid alone pattern “No bubbles or liquefied gas interface in the field Visibility did not show 1 mm and appeared under any circumstances. The smooth liquid films around the gas core can be classified as thin or thick, and the wavy liquid films can be classified as a ring or deformed [27,28].
When the biphasic current from the header is divided into parallel T channels, the surface tension effect becomes more apparent. In the two-phase air/water flow test, we find that all the liquids are divided into partially branched channels, but the rest of the branch channels are blocked by alternating air coils and liquid coils. Therefore, it is necessary to first determine the effect of surface tension and dredge all channels.
In this study, the flow behaviour of two phases of air and water in parallel channels of specified width with experimental porous inserts was investigated using a self-made and produced transparent assembly. In this work, we created a two-phase model for channel flow. Theoretical analysis was performed to calculate the liquid water saturation, the starting point of the two-phase flow and the concentration of species along the channel. Due to the expansion of industrial applications of two-phase downstream flow, its modelling and simulation are of great practical importance for predicting its various conditions in pipes. The dependence of these physical characteristics on cell performance of the main working parameters, such as air stoichiometry and relative humidity, is examined. The results show that liquid water accumulates rapidly in the inlet area, followed by a gentle increase downstream, at full moisture inlet conditions. The predicted liquid saturation rate reaches 30%. Subsequently, biphasic flows in heterogeneous channels were theoretically analyzed and numerically simulated. In this study, the flow pattern of downstream, bubble, Coal and foamy in the downstream flow of the pipe was clearly identified and photographed and using the flow map obtained from the laboratory study, the conditions for the occurrence of two-phase flow patterns were determined. The results of current research can be summarized as follows. First, in general, the experimental results agree well with the numerical predictions; however, some deviations are obvious when the fluid pressure drop is large. Second, porous channels consisting of spheres with smaller diameters have a higher heat transfer coefficient due to their larger heat transfer area.
The observed biphasic flow patterns were mainly alternating currents, But a closer look at the structure of the liquid film showed that the gas core flows with a smooth or ring-shaped film and a helical gas core flow surrounded by a deformed liquid. The probability of the emergence of different flow patterns indicates a gradual change in the dominant flow pattern with increasing gas and liquid flow velocities. For low liquid flow velocities, gas core currents with a thin, smooth liquid film often occur at low gas flow velocities, but gas kernel flows with a ring-shaped liquid film increase at high gas flow velocities. For the inlet flow, the gas and liquid distribution assume a transitional property. As the inlet gas surface velocity increases, more gas tends to the three middle channels, while more fluid is occupied in the first and end channels. Increasing the surface velocity of the inlet fluid does not change the inlet flow pattern in the header much, so the flow distribution changes slightly. When the input current changes to a ring, the inhomogeneous distribution of the two phases reaches its maximum. Liquid flows in large numbers to the first and last channels, while gas is mostly divided into three intermediate channels. However, in general, the relatively good agreement between the simulation results, especially the flow map and the laboratory flow map, shows the good ability of computational fluid dynamics in predicting low two-phase flow patterns.
Acknowledgement: The article was prepared as part of the state task “Research and development of complex energy-saving and thermoelectric regenerative systems” Application No. 2019–1497, Subject No. FZWG-2020-0034
Funding Statement: The authors received no specific funding for this study.
Conflicts of Interest: The authors declare that they have no conflicts of interest to report regarding the present study
1. Chupradit, S., Jalil, A. T., Enina, Y., Neganov, D. A., Alhassan, M. S. et al. (2021). Use of organic and copper-based nanoparticles on the turbulator installment in a shell tube heat exchanger: A CFD-based simulation approach by using nanofluids. Journal of Nanomaterials, 2021, 1–7. DOI 10.1155/2021/3250058. [Google Scholar] [CrossRef]
2. Kukartsev, V., Stupina, A., Tynchenko, V., Panfilov, I., Korpacheva, L. (2021). Air and space vehicle production: Indicators of innovative activity. Economic Annals-XXI, 187 (1–2), 114–120 DOI 10.21003/ea. [Google Scholar] [CrossRef]
3. Zabihi, O., Khodabandeh, A., Mostafavi, S. M. (2012). Preparation, optimization and thermal characterization of a novel conductive thermoset nanocomposite containing polythiophene nanoparticles using dynamic thermal analysis. Polymer Degradation and Stability, 97(1), 3–13. DOI 10.1016/j.polymdegradstab.2011.10.022. [Google Scholar] [CrossRef]
4. Qasem, S. N., Samadianfard, S., Sadri Nahand, H., Mosavi, A., Shamshirband, S. et al. (2019). Estimating daily dew point temperature using machine learning algorithms. Water, 11(3), 582. DOI 10.3390/w11030582. [Google Scholar] [CrossRef]
5. Ma, L., He, L., Luo, X., Mi, X. (2021). Numerical simulation and experimental analysis of the influence of asymmetric pressure conditions on the splitting of a Gas-liquid Two-phase flow at a T-junction. Fluid Dynamics & Materials Processing, 17(5), 959–970, DOI 10.32604/fdmp.2021.016710. [Google Scholar] [CrossRef]
6. Lee, J., Mudawar, I. (2007). Assessment of the effectiveness of nanofluids for single-phase and two-phase heat transfer in micro-channels. International Journal of Heat and Mass Transfer, 50(3–4), 452–463. DOI 10.1016/j.ijheatmasstransfer.2006.08.001. [Google Scholar] [CrossRef]
7. Lei, L., An, J., Liang, F., Cheng, C., Zhou, N. et al. (2021). An experimental study on the void fraction for Gas-liquid Two-phase flows in a horizontal pipe. Fluid Dynamics & Materials Processing, 17(6), 1037–1048, DOI 10.32604/fdmp.2021.016081. [Google Scholar] [CrossRef]
8. O’Neill, L. E., Mudawar, I. (2020). Review of two-phase flow instabilities in macro-and micro-channel systems. International Journal of Heat and Mass Transfer, 157, 119738. DOI 10.1016/j.ijheatmasstransfer.2020.119738. [Google Scholar] [CrossRef]
9. Zhang, F., Chen, K., Zhu, L., Appiah, D., Hu, B. et al. (2020). Gas–Liquid Two-phase flow investigation of side channel pump: An application of MUSIG model. Mathematics, 8(4), 624. DOI 10.3390/math8040624. [Google Scholar] [CrossRef]
10. Wang, X., Pan, W. (2022). Numerical simulation of wake vortices generated by an A330-200 aircraft in the nearfield phase. Fluid Dynamics & Materials Processing, 18(1), 173–188, DOI 10.32604/fdmp.2022.017869. [Google Scholar] [CrossRef]
11. Hoseini, M., Haghtalab, A., Navid, M. (2020). Elongational behavior of silica nanoparticle-filled low-density polyethylene/polylactic acid blends and their morphology. Rheologica Acta, 59, 621–630, DOI 10.1007/s00397-020-01225-5. [Google Scholar] [CrossRef]
12. Kopparthy, S., Mansour, M., Janiga, G., Thévenin, D. (2020). Numerical investigations of turbulent single-phase and two-phase flows in a diffuser. International Journal of Multiphase Flow, 130, 103333. DOI 10.1016/j.ijmultiphaseflow.2020.103333. [Google Scholar] [CrossRef]
13. Man, Z., Ebadi, A. G., Mostafavi, S. M., Surendar, A. (2019). Fuel oil characteristics and applications: Economic and technological aspects. Petroleum Science and Technology, 37(9), 1041–1044. DOI 10.1080/10916466.2019.1570256. [Google Scholar] [CrossRef]
14. Zhang, T. (2019). Experimental investigation of two-phase instability in natural circulation with direct transient local measurement (Thesis). University of Illinois at Urbana, Champaign. [Google Scholar]
15. Saisorn, S., Wongwises, S. (2015). Adiabatic two-phase gas-liquid flow behaviors during upward flow in a vertical circular micro-channel. Experimental Thermal and Fluid Science, 69, 158–168. DOI 10.1016/j.expthermflusci.2015.07.021. [Google Scholar] [CrossRef]
16. Trifonov, Y. Y. (2010). Flooding in two-phase counter-current flows: Numerical investigation of the gas–liquid wavy interface using the Navier–Stokes equations. International Journal of Multiphase Flow, 36(7), 549–557. DOI 10.1016/j.ijmultiphaseflow.2010.03.006. [Google Scholar] [CrossRef]
17. Banowski, M., Hampel, U., Krepper, E., Beyer, M., Lucas, D. (2018). Experimental investigation of two-phase pipe flow with ultrafast X-ray tomography and comparison with state-of-the-art CFD simulations. Nuclear Engineering and Design, 336, 90–104. DOI 10.1016/j.nucengdes.2017.06.035. [Google Scholar] [CrossRef]
18. Sardeshpande, M. V., Shastri, P., Ranade, V. V. (2016). Two-phase flow boiling pressure drop in small channels. International Journal of Heat and Fluid Flow, 61, 636–649. DOI 10.1016/j.ijheatfluidflow.2016.07.008. [Google Scholar] [CrossRef]
19. Tham, T. T., Nguyen, H. P. (2021). An integrated approach of fuzzy-AHP-TOPSIS for E-commerce evaluation. Industrial Engineering & Management Systems, 20(2), 82–95. DOI 10.7232/iems.2021.20.2.82. [Google Scholar] [CrossRef]
20. Lu, Y. (2018). Investigation of two-phase flow during liquid displacement in microchannels: Experiments and CFD simulations (Doctoral Dissertation). University of Birmingham. [Google Scholar]
21. Grabenstein, V., Polzin, A. E., Kabelac, S. (2017). Experimental investigation of the flow pattern, pressure drop and void fraction of two-phase flow in the corrugated gap of a plate heat exchanger. International Journal of Multiphase Flow, 91, 155–169. DOI 10.1016/j.ijmultiphaseflow.2017.01.012. [Google Scholar] [CrossRef]
22. Rysak, A., Litak, G., Mosdorf, R., Gorski, G. (2016). Investigation of two-phase flow patterns by analysis of Eulerian space–time correlations. International Journal of Multiphase Flow, 85, 23–37. DOI 10.1016/j.ijmultiphaseflow.2016.04.017. [Google Scholar] [CrossRef]
23. Wang, J. X., Li, Y. Z., Zhang, Y., Li, J. X., Mao, Y. F. et al. (2018). A hybrid cooling system combining self-adaptive single-phase mechanically pumped fluid loop and gravity-immune two-phase spray module. Energy Conversion and Management, 176, 194–208. DOI 10.1016/j.enconman.2018.09.010. [Google Scholar] [CrossRef]
24. Spreitzer, R., Moonsamy, V., Korak, T., Mangard, S. (2017). Systematic classification of side-channel attacks: A case study for mobile devices. IEEE Communications Surveys & Tutorials, 20(1), 465–488. DOI 10.1109/COMST.2017.2779824. [Google Scholar] [CrossRef]
25. Frederix, E. M. A., Mathur, A., Dovizio, D., Geurts, B. J., Komen, E. M. J. (2018). Reynolds-averaged modeling of turbulence damping near a large-scale interface in two-phase flow. Nuclear Engineering and Design, 333, 122–130. DOI 10.1016/j.nucengdes.2018.04.010. [Google Scholar] [CrossRef]
26. Vakili-Farahani, F., Amalfi, R. L., Thome, J. R. (2016). Two-phase heat transfer and pressure drop within plate heat exchangers. In: Encyclopedia of two-phase heat transfer and flow II: Special topics and applications, pp. 145–215. London, UK: IntechOpen. [Google Scholar]
27. Golpanian, R. S., Yosipovitch, G. (2020). Current and emerging systemic treatments targeting the neural system for chronic pruritus. Expert Opinion on Pharmacotherapy, 21(13), 1629–1636. DOI 10.1080/14656566.2020.1775815. [Google Scholar] [CrossRef]
28. Pourreza, T., Alijani, A., Maleki, V. A., Kazemi, A. (2022). The effect of magnetic field on buckling and nonlinear vibrations of Graphene nanosheets based on nonlocal elasticity theory. International Journal of Nano Dimension, 13(1), 54–70. DOI 10.22034/ijnd.2022.683988. [Google Scholar] [CrossRef]
 | This work is licensed under a Creative Commons Attribution 4.0 International License, which permits unrestricted use, distribution, and reproduction in any medium, provided the original work is properly cited. |