| Fluid Dynamics & Materials Processing |
DOI: 10.32604/fdmp.2022.019736
ARTICLE
Study on a Gas Plunger Lift Model for Shale Gas Wells and Its Effective Application
1Sichuan Changning Gas Development Company, PetroChina Southwest Oil & Gas Field Company, Chengdu, 610051, China
2Petroleum Engineering Institute of Yangtze University, Wuhan, 430100, China
3Key Laboratory of Drilling and Production Engineering for Oil and Gas, Yangtze University, Wuhan, 430100, China
*Corresponding Author: Wei Luo. Email: luoruichang@163.com
Received: 11 October 2021; Accepted: 28 December 2021
Abstract: The problem of efficient gas lift for gas well annulus packers that rely on their own energy plungers is considered. The complex related gas-liquid problem is addressed in the frame of model where the gas inflow dynamics and liquid inflow dynamics of the considered shale gas wells are weakly coupled. On this basis, and with the aiding support of indoor simulation experimental data, a new gas plunger lift design taking into account liquid leakage is obtained. Finally, a dedicated software relying on this approach is developed and used to verify the reliability of the model by means of field examples.
Keywords: Packers; their own energy plungers; shale gas wells; weakly coupled; liquid leakage
Nomenclature
| Aa | oil sleeve annulus cross-sectional area, m2 |
| At | tubing cross-sectional area, m2 |
| C | constant related to tubing size |
| c | gas well exponential equation coefficient, 104 m3/d/MPa2n |
| f(Vup) | loss speed (quantity) function related to factors such as plunger speed (obtained in the above experiment) |
| f | pressure coefficient of produced gas column in oil and gas well |
| g | acceleration of gravity, 9.8 kg · m/s2 |
| Hk | downhole stopper position, m |
| Htl | height of liquid level recovery during shut-in, m |
| H | medium-deep reservoir, m |
| J | gas well fluid production index, m3/d/MPa |
| K | constants related to tubing size |
| np | daily cycle times of plunger, times/d |
| pa | local atmospheric pressure, MPa |
| pcavg | average casing pressure, MPa |
| pcmax | maximum casing pressure, MPa |
| pcmin | minimum wellhead casing pressure, i.e., the casing pressure when the plunger reaches the wellhead, MPa |
| pp | required pressure to lift the plunger itself (pp = plunger weight/plunger cross-sectional area), MPa |
| pLH | required pressure to lift each liquid, MPa/m3 |
| pLF | friction caused by lifting each liquid, MPa/m3 |
| qL | lifting liquid volume per cycle, m3 |
| ptmin | oil pressure after the plunger reaches the wellhead, MPa |
| pwf | bottom hole pressure, MPa |
| qgcyc | air volume required for single-cycle lifting, m3; |
| QG | gas well gas production, 104 m3/d |
| Ql | gas well liquid production, m3/d |
| Qreal | actual maximum liquid volume (initial) lifted during the ascent of the plunger every day considering the effect of leakage, m3/d |
| qLN | lifting liquid volume out of the wellhead in a single cycle, m3/time |
| qL | average liquid volume during single-cycle lifting, m3/time |
| R | production gas-liquid ratio (Calculated based on actual output), m3/m3 |
| tdg | time of plunger falling in gas, min |
| tdl | time that the plunger falls in the liquid, min |
| tgj | time for the plunger shut-in pressure recovery, min |
| tup | plunger up time, min |
| txl | time of plunger freewheeling production, min |
| Vdg | speed at which the plunger falls in the gas, m/min |
| Vdl | speed of the plunger falling in the liquid, m/min |
| Vup | average rising speed of the plunger, m/min |
| Greek letters | |
| ρ | density of the output mixed liquid (usually calculated by weighted average method), 103 kg/m3 |
Plunger drainage gas recovery technology is one of the main drainage technology measures for production from gas wells. Research on the optimization design of plunger gas lift production systems is of great significance to ensure the efficient development of gas wells and improve the work efficiency of on-site management staff. Especially in the current large-scale development and application of shale gas fields, due to the widespread use of large-scale fracturing and commissioning, the initial fluid production levels are relatively large, fluid production continues to slowly decline, and the production parameters change more quickly than those of conventional gas wells. Therefore, drainage gas production is generally required for gas wells [1,2]. The aforementioned plunger gas lift working system is unsuitable at present, and it is difficult for on-site plunger gas lift wells to remain in their optimal production states. Thus, it is necessary to focus more on the inflow dynamics of gas–liquid production from shale gas wells and the corresponding research on plunger gas lift design methods. It is helpful to improve the efficiency of plunger gas lift methods, reduce the intensity of on-site work, save labor costs, increase economic benefits, and provide technical support for the long-term stable production and efficient development of oilfields.
Studies of plunger gas lift technologies began in the late 1930s. At that time, several new plunger structures were designed but not widely used in the oilfield. The main reason was that no plunger gas lift dynamic model could reasonably describe the plunger operation, and these plunger structures had significant defects. In the 1960s, Foss et al. [3] deduced the statistical analysis method of the plunger gas lift wellhead pressures, casing pressures and production based on a large amount of gas well field data by summarizing the actual test data from 110 test wells in the Ventura oil field. For the first time, the static operating model of plunger gas lift was established, and a series of more general plunger lift dynamic curves was drawn, which provided a foundation in the development history of plunger gas lift and has thus far become the most commonly used empirical method for plunger gas lift designs in vertical wells. The predictions of the model are very close to field data, but the model has limitations and does not consider the nature of gas reservoirs and liquid leakage. This model assumes that the liquid accumulation in the upper part of the lift plunger is driven by the expansion of gas in the annulus (this is the case in most wells, and some gas well tubing and annuli are sealed by packers because the upper annulus and tubing are not connected, so this model is not suitable for use).
Abercrombie [4] established a static model in 1980. He collected a large amount of data for the falling speed of the plunger. Based on this, he adjusted the falling speed of the plunger to be closer to the actual speed, improved the static model, and studied how to best design the plunger.
Lea [5] established the first dynamic model in 1982, which focused on studying the plunger rising stage, and he believed that the plunger speed changes when the plunger is rising, which is contrary to the assumption in the previous static models that the speed is constant. The plunger speed is variable. When establishing the mechanical relationship, he introduced a stable gas reservoir inflow dynamic production curve and assumed that the gas above the plunger was in a stable state during the run of the plunger. The essence of this model was to allow the plunger speed to change with time and depth. After this change, this model was also used to create a computer program to analyze and guide the operating parameters of plunger gas lift wells.
In 1985, Mower et al. [6] established a new model, but this model was quite similar to Lea’s model. He introduced a liquid loss term based on field data.
In 1994, Marcano et al. [7] studied the application of plunger gas lift technology in oil and gas wells with high gas-liquid ratios based on previous studies. By assuming a linear relationship between the fallback amounts and the plunger speeds, a plunger gas lift dynamic model that considered liquid leakage during the lifting process was established using the law of mass conservation. Simultaneously, the fallback shapes were compared, verified and corrected in combination with the field data. The errors between the model predictions and actual production data were 15%–20%. It is recommended to correct the application in combination with accurate on-site measured data for complex situations.
In 1995, Baruzzi et al. [8] proposed a dynamic model that simply described the plunger gas lift based on experiments. The model is consistent with the production and pressure dynamics of actual wells. Through the analysis of sensitive parameters based on the model, the following conclusions were drawn: (1) when the wellhead pressure is known, there is an optimal time after flow, and (2) when the time after flow is known, a lower wellhead pressure corresponds to a higher output. They developed a recommended method to optimize the working system for plunger gas lift technology.
In 1997, Gasbarri et al. [9] improved the dynamic model of plunger lifting. The established model considers the friction of the plunger and liquid column, the gas expansion pressure of the upper and lower sections of the plunger and liquid column, and the transient changes in the liquid column that reaches the wellhead, which are convenient for understanding that the plunger gas lift improves the lifting efficiency, increases production and improves the entire production process. The model provides a more complete description of the discharge system, and the simulation results show that the discharge system directly affects the casing pressures, liquid column sizes and rising speeds, so it is also very key. Thus, the model is improved in two aspects: the upward liquid drop of the plunger and the falling speed of the plunger.
In 2000, Maggard et al. [10] established a plunger gas lift performance model that could be applied to tight gas wells based on the characteristics of short-term, rapid changes during tight gas well production and introduced the transient inflow performance curve for gas reservoirs. This model numerically simulates the full-cycle process of the plunger.
In 2008, Chava et al. [11] proposed a new method to simulate plunger lifting. In this method, the pressure and temperature data are obtained by using an intelligent plunger; then, the obtained pressure and temperature data are substituted into the basic mass, momentum and energy conservation equations that control the plunger dynamics to predict the changes in other parameters. This method can accurately reflect the actual dynamics of the plunger, but it cannot predict the dynamic process of plunger lift and can be adjusted and optimized only after installation.
In the same year, Tang et al. [12,13] proposed a new model to describe the plunger movement, which considered the influences of tubing casing pressure changes, fluid accumulations, liquid fall and plunger resistance. However, the model must first quantitatively describe the tubing casing pressure of the plunger gas lift process based on oilfield test data and subsequently use the plunger motion equation to simulate the changes in other parameters, which improves the prediction accuracy of the plunger lift process.
In 2010, based on the application of plunger gas lift in horizontal wells in Sierra oil and gas fields, Sask et al. [14] reported that the greatest difficulty when using plunger gas lift in horizontal wells was that it was difficult for the liquid to rise from the horizontal section to a level above the stopper and one-way valve in the section of the inclined well. Because there is a certain inclination angle, the one-way valve leaked significantly, and the one-way valve was improved to prevent leakage in the inclined well section when the inclination angle was less than 67°. In some horizontal wells, the lifting efficiency and descent speed test measurements of different types of plungers were also carried out, and the influences of the wellbore trajectory and liquid retention in the horizontal wellbore on the performance of the plunger were explored through examples.
In 2011, Kravits et al. [15] conducted a theoretical study on using plunger gas lift technology for drainage gas recovery in horizontal gas wells. A plunger gas lift monitoring system was used to record the falling speed of the plunger and changes in wellhead tubing casing pressures during the test, and the test data were analyzed. The study found that after the plunger passed the wellbore kickoff point, the falling speed significantly increased and then gradually decreased. It was proven that plunger gas lift technology could be applied at large inclination angles in horizontal wells.
In 2015, Nascimento et al. [16] studied three shale gas wells, each with a different trajectory. 1) A transient multiphase simulation device was used to simulate the liquid filling processes of the three wells; 2) a plunger lift was used to simulate gas well drainage; and 3) the startup procedures of the oil wells were optimized. These simulations provided valuable insights into the flows and pressure transients that characterize shale production. The research results provide guidance for optimizing the startup of horizontal shale wells and designing the best shale well trajectory for plunger lifting operations. This method was not previously introduced in the literature, and it emphasizes the role of transient simulations in the shale development planning stage.
In 2018, Nandola et al. [17] proposed an effective method to optimize the plunger lift process of shale gas wells. Plunger lifting is a cyclic process that consists of binary decision-making and continuous and discrete state variables. The time series data that are obtained from surface measurements are converted into process-related periodic data performance outputs, and the binary manipulated variables are converted into continuous threshold values. These converted variables are used to develop a reduced-order cycle-to-cycle model and corresponding rolling optimization problems to maximize daily outputs while meeting operational constraints. The effectiveness of the algorithm was verified on the simulated plunger.
In 2021, a new model proposed by Zhao et al. [18] can obtain the basic parameters of the plunger lifting cycle, including the plunger speeds/accelerations, tubing/casing pressures and productivities. Compared with the previous model, the predicted plunger rising and falling speeds are improved. In this study, the hydrocarbon mixture properties in gas wells are calculated by a component model to provide more accurate and reasonable predictions of the tubing and casing pressures.
In recent years, since the plunger gas lift technology has demonstrated good field application effects and obvious advantages, this technology has entered a period of vigorous development of its popularization and application, and the application scope and technical theory of plunger gas lift technology have been improved. At present, the application of plunger gas lift liquid and gas production technology gradually tends to be intelligent and integrated, and an intelligent plunger production skid for several typical high-liquid well conditions has been developed. The trend of using integrated and intelligent plunger equipment is obvious. Research on the remote intelligent monitoring of plunger drainage technology and dynamic decision-making and planning issues is relatively extensive. However, for completed shale gas horizontal wells, the well structures are complex, the production conditions are complex and variable, and few studies require long-term and efficient development. Considering this limitation and some limitations of Foss’s empirical method [1], this paper studies the plunger gas lift design based on the most commonly used empirical method of plunger gas lift design.
1.1 Gas-Liquid Inflow Dynamic Method for Shale Gas Wells
Because the gas-liquid inflows of shale gas wells are complex and variable, the gas-liquid inflow proportions are not necessarily fixed. Therefore, this paper loosely couples the gas inflow dynamics of shale gas wells with the liquid inflow dynamics, and the gas-liquid flows follow their own inflow dynamic equations. Among them, the inflow dynamic equation for formation gas production can use the binomial equation or other gas well productivity prediction methods, such as the exponential equation. Taking the exponential equation as an example, the equation is:
The inflow dynamic equation for formation liquid production can be the liquid production index equation, which can be Vogel equation, Fetkovich equation, or Petrobras equation. Using the liquid production index equation as an example, the equation is:
where QG is the gas well gas production, 104 m3/d; Ql is the gas well liquid production, m3/d; c is the gas well exponential equation coefficient, 104 m3/d/MPa2n; and
1.2 Design Method of Plunger Gas Lift
The process parameters must be optimized before the plunger gas lift is implemented. The main working parameters of the optimized design include the minimum casing pressure, maximum casing pressure, single-cycle lifting liquid volume, and number of plunger cycles. Among these, parameters such as the minimum casing pressure and maximum casing pressure can be solved by empirical formulas. Since the method of Jin et al. [1] does not consider liquid leakage, this model considers this factor by using the results of an indoor plunger gas lift simulation experiment (e.g., pad plunger simulation experiment), as shown in Fig. 1. Based on the nodal analysis principle, the flow chart (Fig. 2) and calculation method of the plunger gas lift design are as follows.
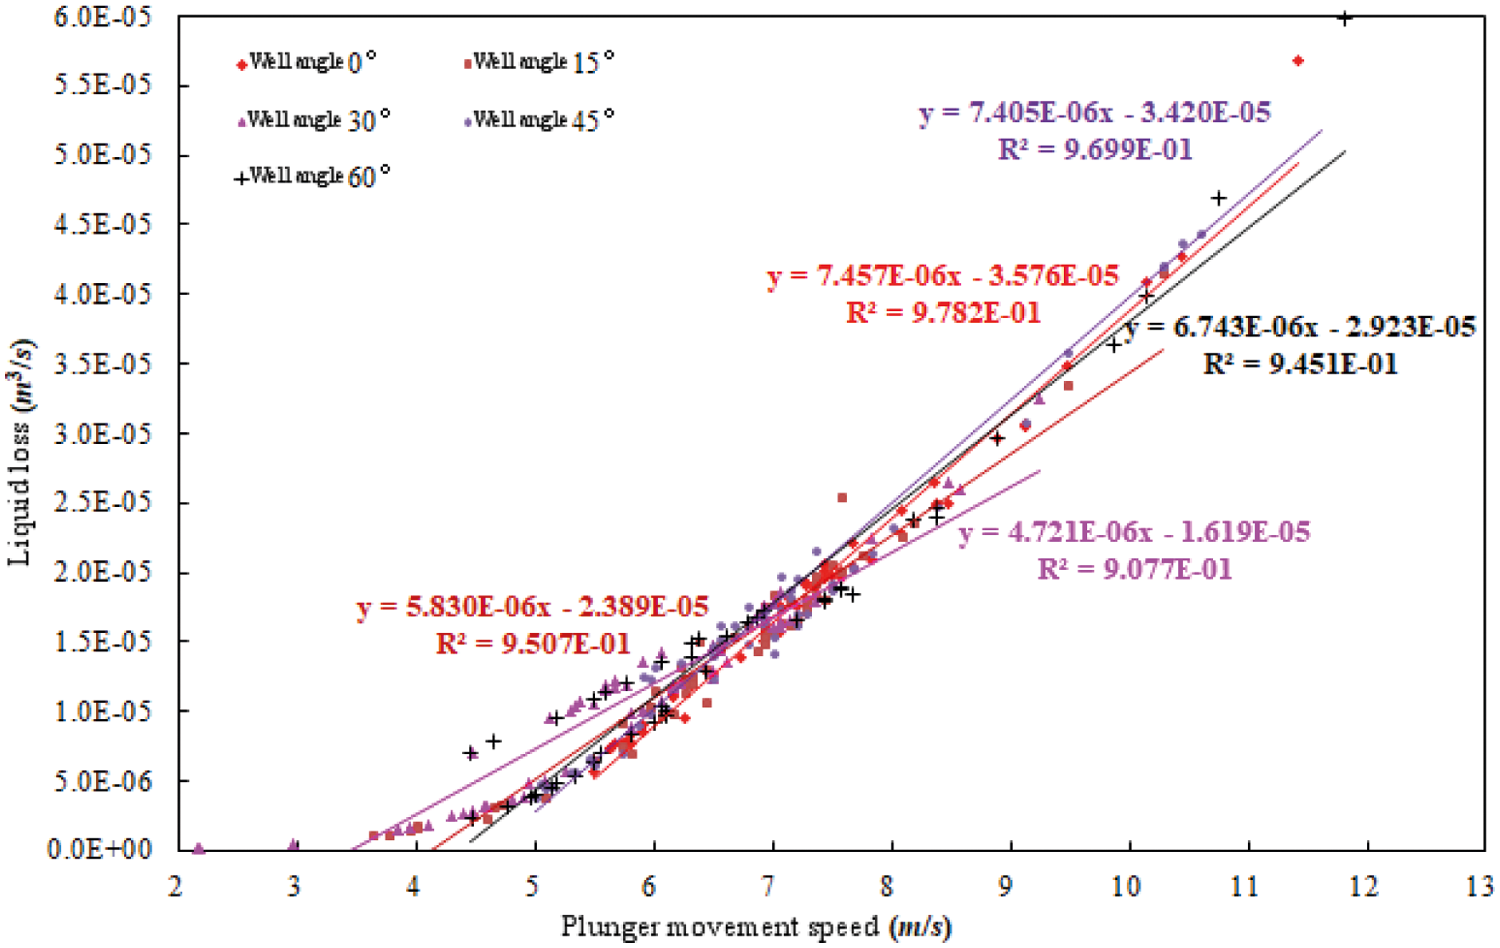
Figure 1: Analysis of the leakage law for the pad plunger
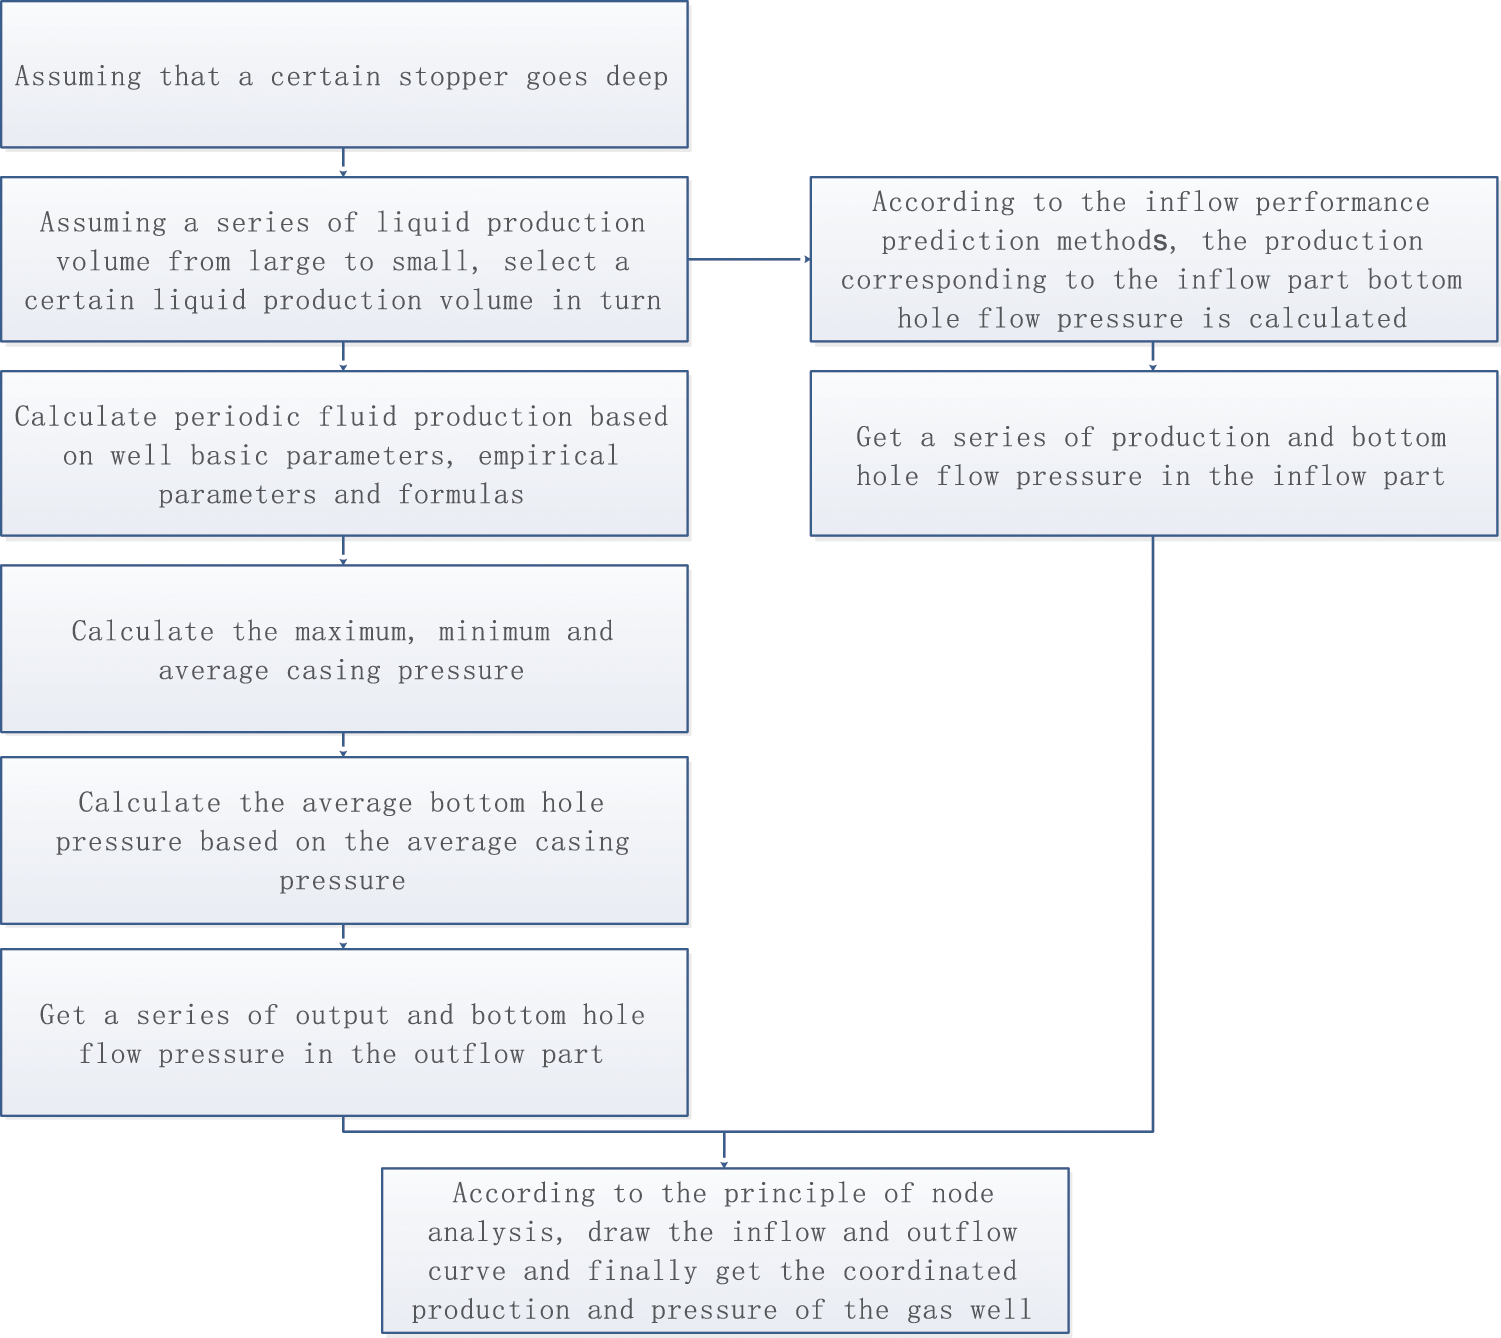
Figure 2: Flow chart of the plunger gas lift design program
(1) Minimum casing pressure
After the well is opened, when the liquid slug on the upper part of the plunger just reaches the wellhead, the tubing and casing pressures are in a balanced state. At this time, the pressure converted from the tubing nozzle to the bottom of the well is equal to the pressure converted from the casing head to the bottom of the well. Simultaneously, relative to the tubing, the annulus volume is larger, and the gas in the annulus expands after the well is opened, so the gas flow rate is very low, and the friction generated by this flow can be ignored. The plunger is very short relative to the liquid slug, so the friction caused by plunger movement can also be ignored. Thus, the following equation applies:
where pcmin is the minimum wellhead casing pressure, which is the casing pressure when the plunger reaches the wellhead, MPa; pp is the pressure required to lift the plunger (e.g., pp = plunger weight/plunger cross-sectional area), MPa; pLH is the pressure required to lift liquid in each cycle, MPa/m3; pLF is the friction caused by lifting liquid in each cycle, MPa/m3; qL is the liquid lifting volume per cycle, m3; ptmin is the oil pressure after the plunger reaches the wellhead, MPa; pa is the local atmospheric pressure, MPa; Hk is downhole stopper position, m; and K is a constant related to the tubing size.
(2) Maximum casing pressure and average casing pressure
Then, the average casing pressure can be calculated as the average maximum casing pressure, and the minimum casing pressure is:
where pcavg is the average casing pressure, MPa.
(3) Gas and liquid production of gas wells
To calculate the gas and liquid production of gas wells according to the method of gas-liquid inflow performance in Section 1.1 for middle shale gas wells, the average bottom hole flow pressure according to the average casing pressure is first calculated; then, the gas production QG and liquid production Ql are calculated according to the methods described in Section 1.1. The formula to calculate the average bottom hole pressure is as follows:
where pwf is the bottom hole pressure, MPa; ρ is the density of the mixed liquid output (usually calculated by the weighted average method), 103 kg/m3; H is the depth of a medium-deep reservoir, m; g is the gravitational acceleration, 9.8 kg · m/s2; and f is the pressure coefficient of the produced gas column in an oil and gas well.
Assuming that QL is the fluid production volume at the production wellhead, considering the effect of leakage, the actual daily maximum liquid volume (initial) that is lifted during the ascent of the plunger is:
where f(Vup) is the loss speed (quantity) function that is related to factors such as the plunger speed (obtained in the above experiment).
(4) Gas volume and gas-liquid ratio required for single-cycle lifting
(5) Daily plunger cycle times
The time required for the plunger gas lift process to complete one working cycle is defined by the opening time and closing time. The well opening time includes the time when the plunger goes up and the time when the upper liquid section of the plunger continues to flow at the wellhead. The shut-in time includes the downward time of the plunger and the time when the plunger remains at the bottom of the well to wait for pressure recovery. Therefore, the daily plunger operating cycle times are:
where np is the daily plunger cycle time, time/d; tup is the plunger up time, min; txl is the plunger freewheeling production time, min; tdg is the time that the plunger falls in gas, min; tdl is the time that the plunger falls in liquid, min; tgj is the time for the plunger shut-in pressure to recover, min; Htl is height of the liquid level recovery during shut-in, m; Vdg is the speed at which the plunger falls in gas, m/min; Vdl is the speed at which the plunger falls in liquid, m/min; and Vup is the average rising speed of the plunger, m/min.
The recovery time for the plunger shut-in pressure can be calculated as follows:
The continuous flow production time of the plunger must be determined based on the time required for the wellhead oil pressure to drop to pcmin after the wellhead fluid is discharged.
(6) Single-cycle lifting liquid volumes
where qL is the average liquid volume during single-cycle lifting, m3/time; qLN is the lifting liquid volume out of the wellhead in a single cycle, m3/time; and R is the production gas-liquid ratio (calculated based on the actual output), m3/m3.
2 Software Compilation and Example Verification Analysis
The software is developed based on the new theoretical model. The bottom function algorithm of the software adopts VB (Visual Basic), and the top interface design and diagram drawing use C# (C sharp). The software is not open-source. The trial version can be obtained by contacting the corresponding author (luoruichang@163.com). The operating environment is as follows.
System Requirements:
Windows Server 2008, Windows Vista, or Windows 7/8/10 operating system;
Windows XP, Windows Server 2003 and other operating systems need to install Microsoft.NET Framework version 4.0;
AMD/Intel 1.6 GHz or above processor;
Total RAM memory of 2 GB or above.
Recommended configuration:
Microsoft Windows version 7 or higher;
Intel Core i3 or an equivalent AMD processor;
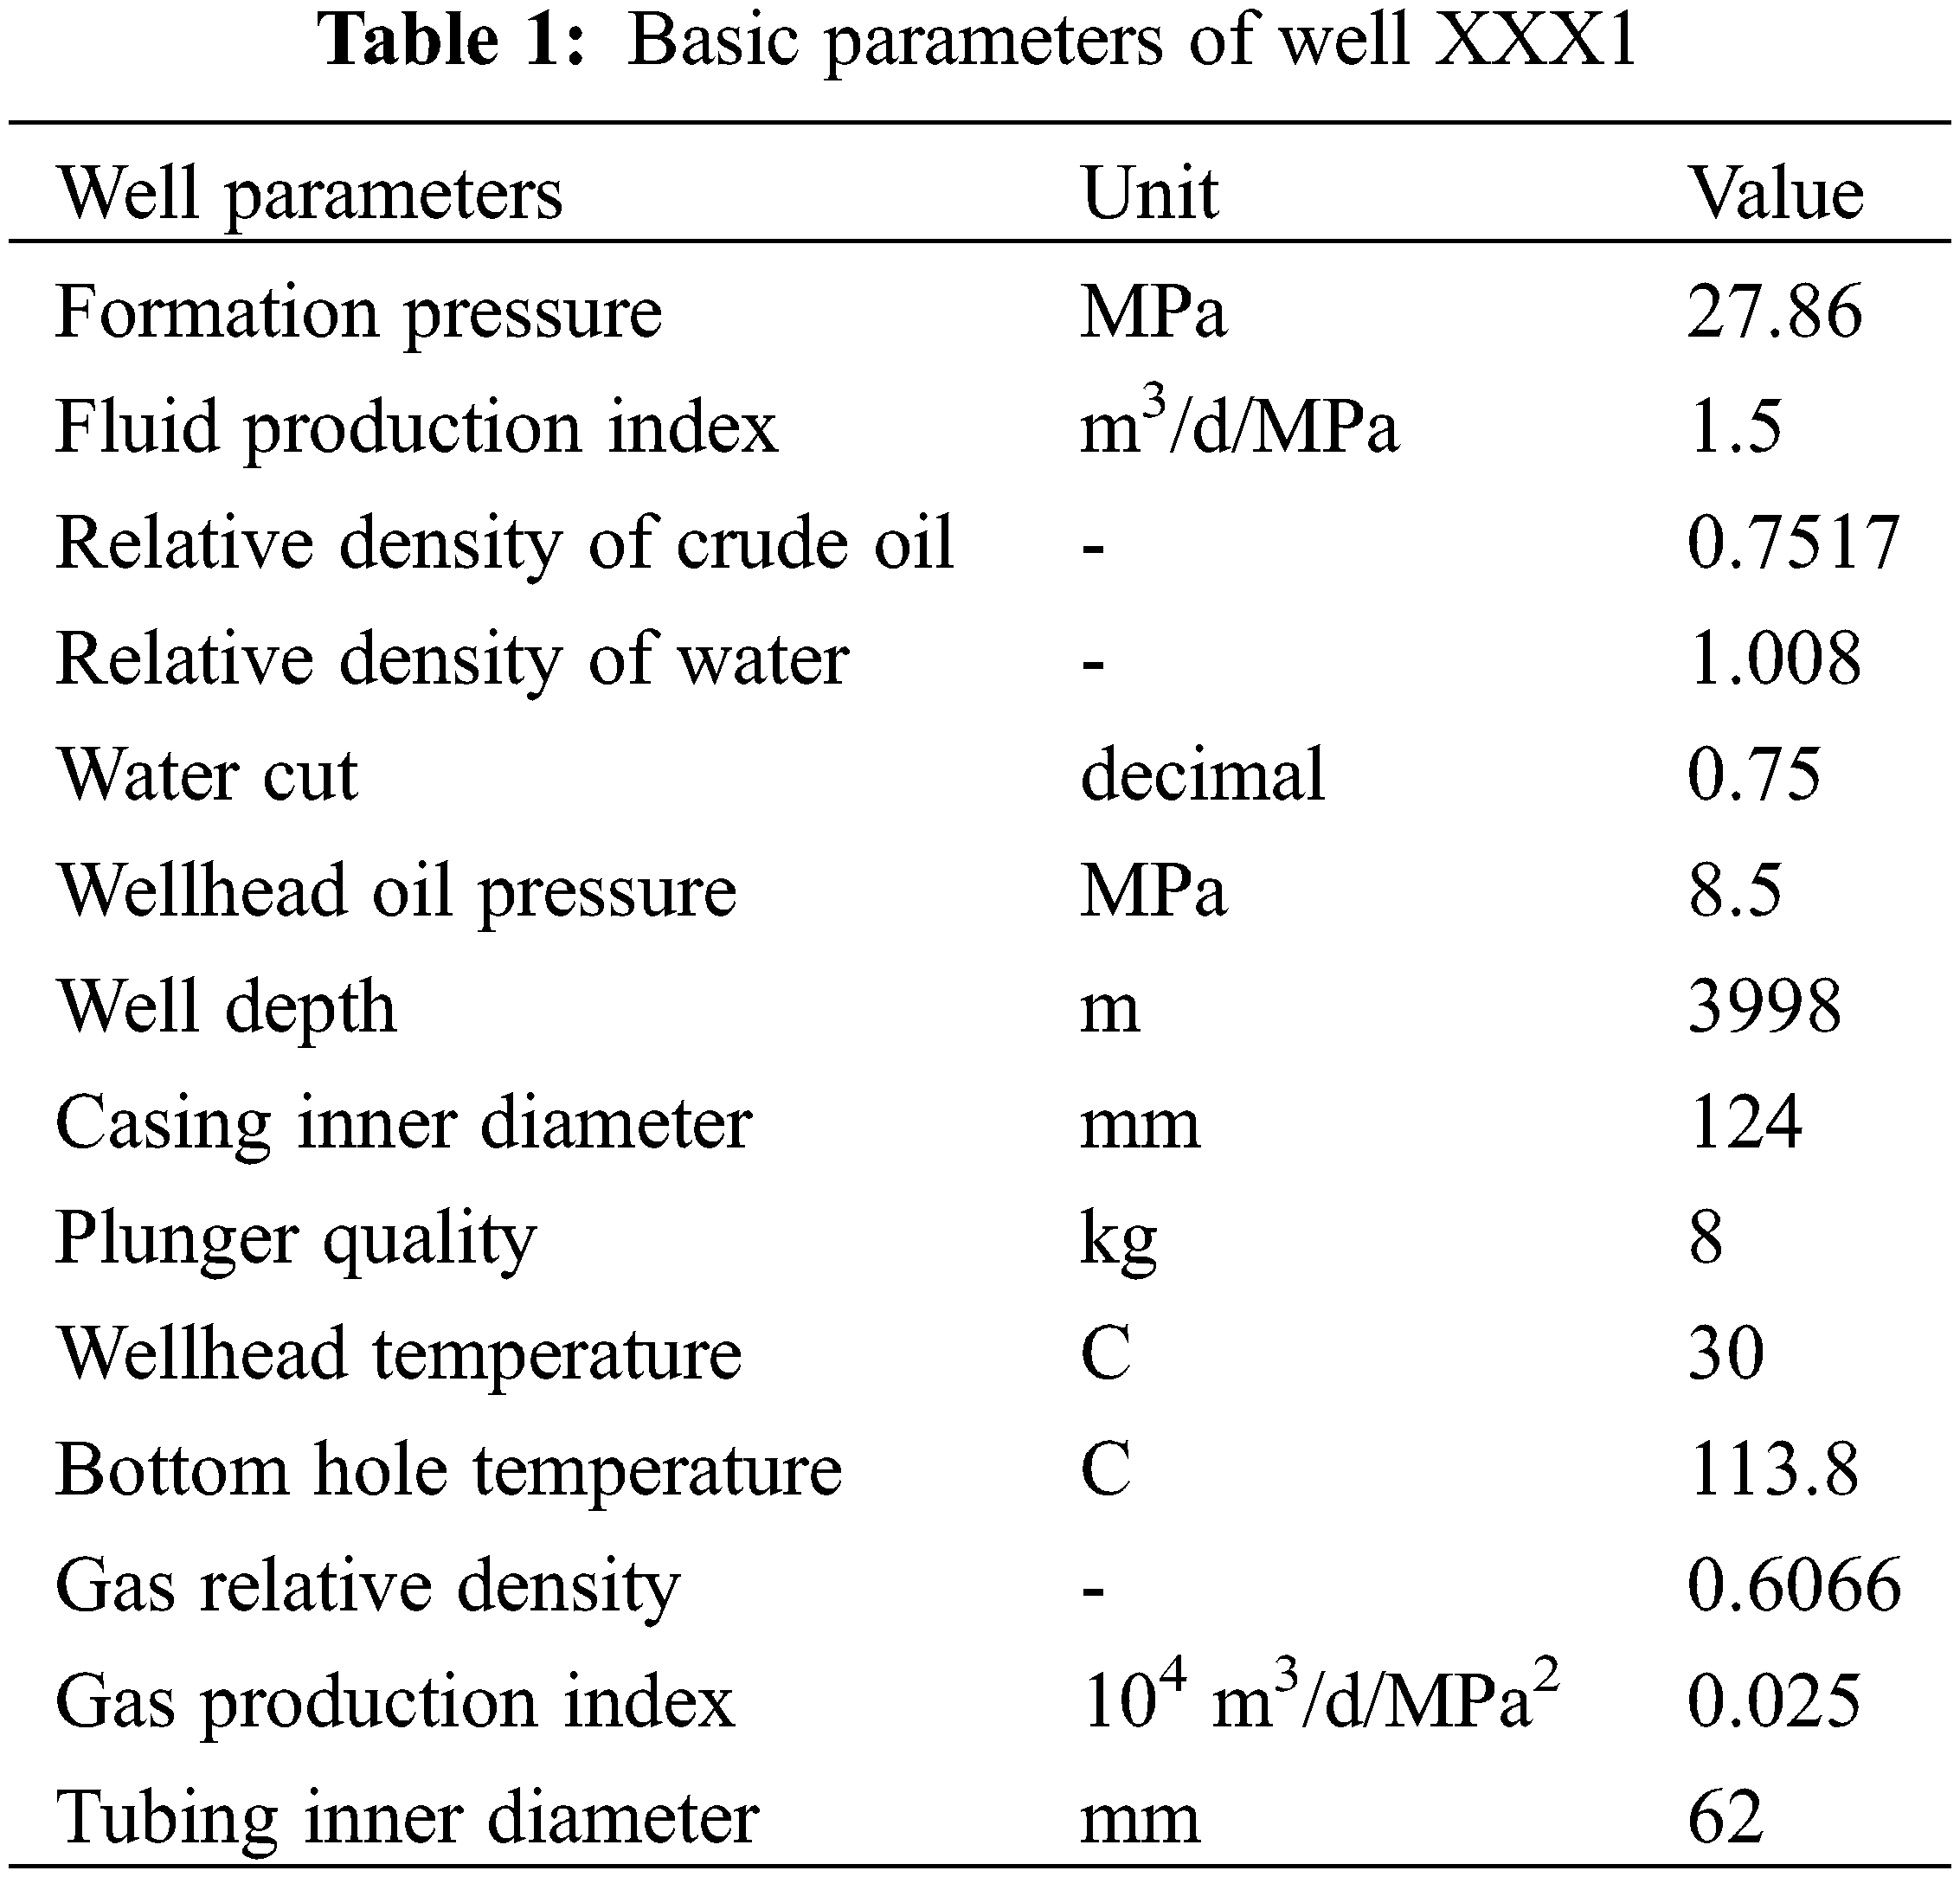
Example 1 involves example well XXX1 (Table 1), and the basic parameters are as follows.
(1) Parameter input (Figs. 3–5)
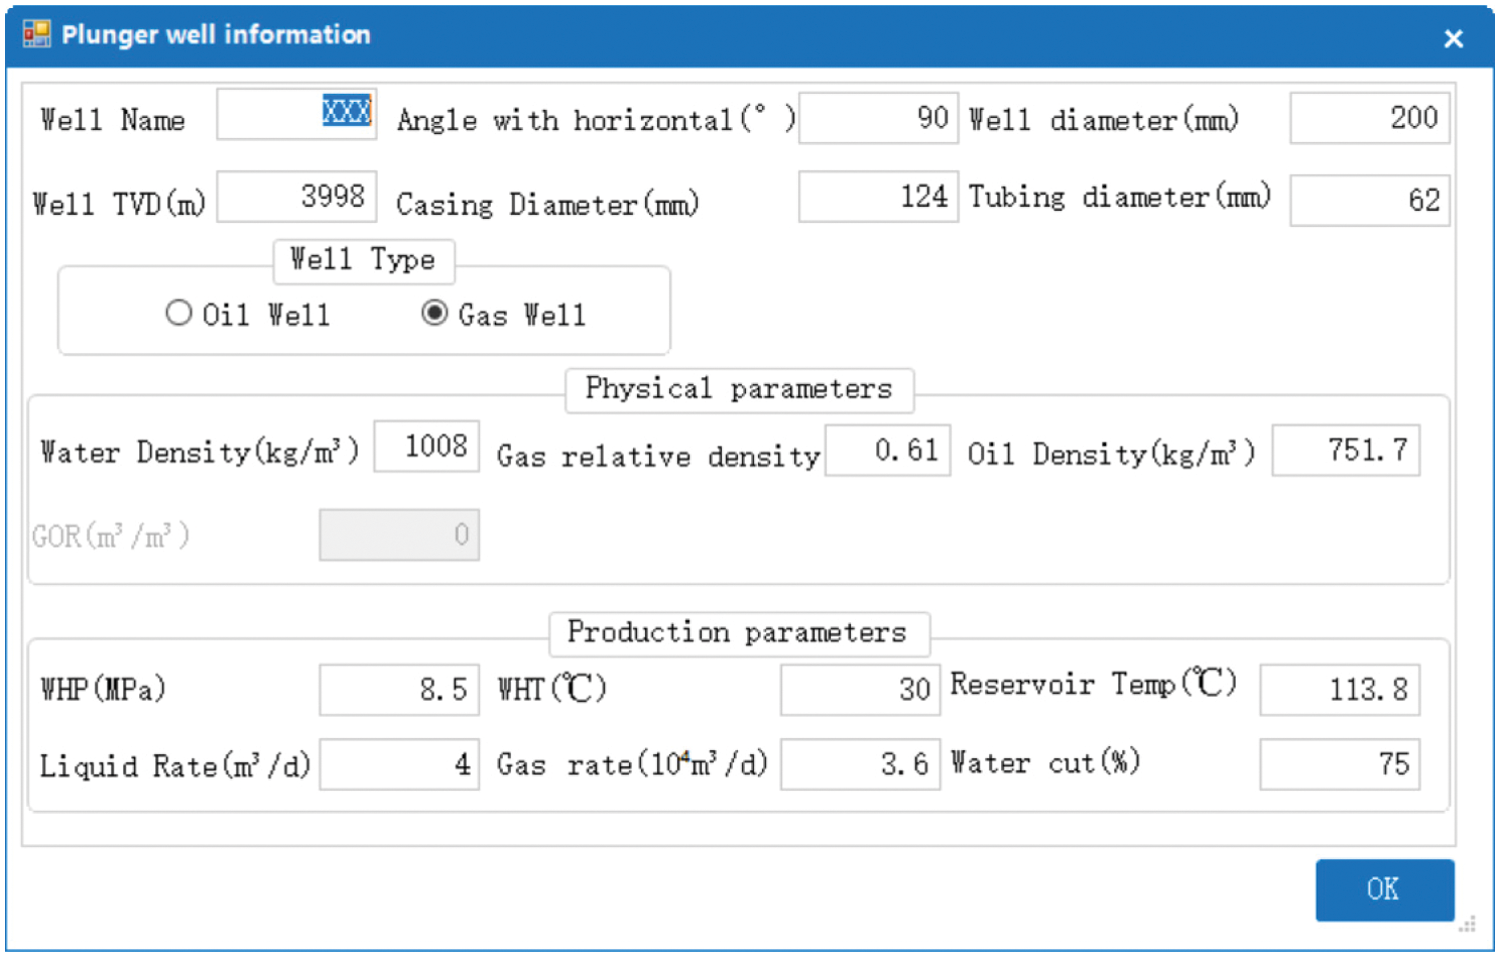
Figure 3: Basic gas well parameters (e.g., fluid properties and well profile configuration)
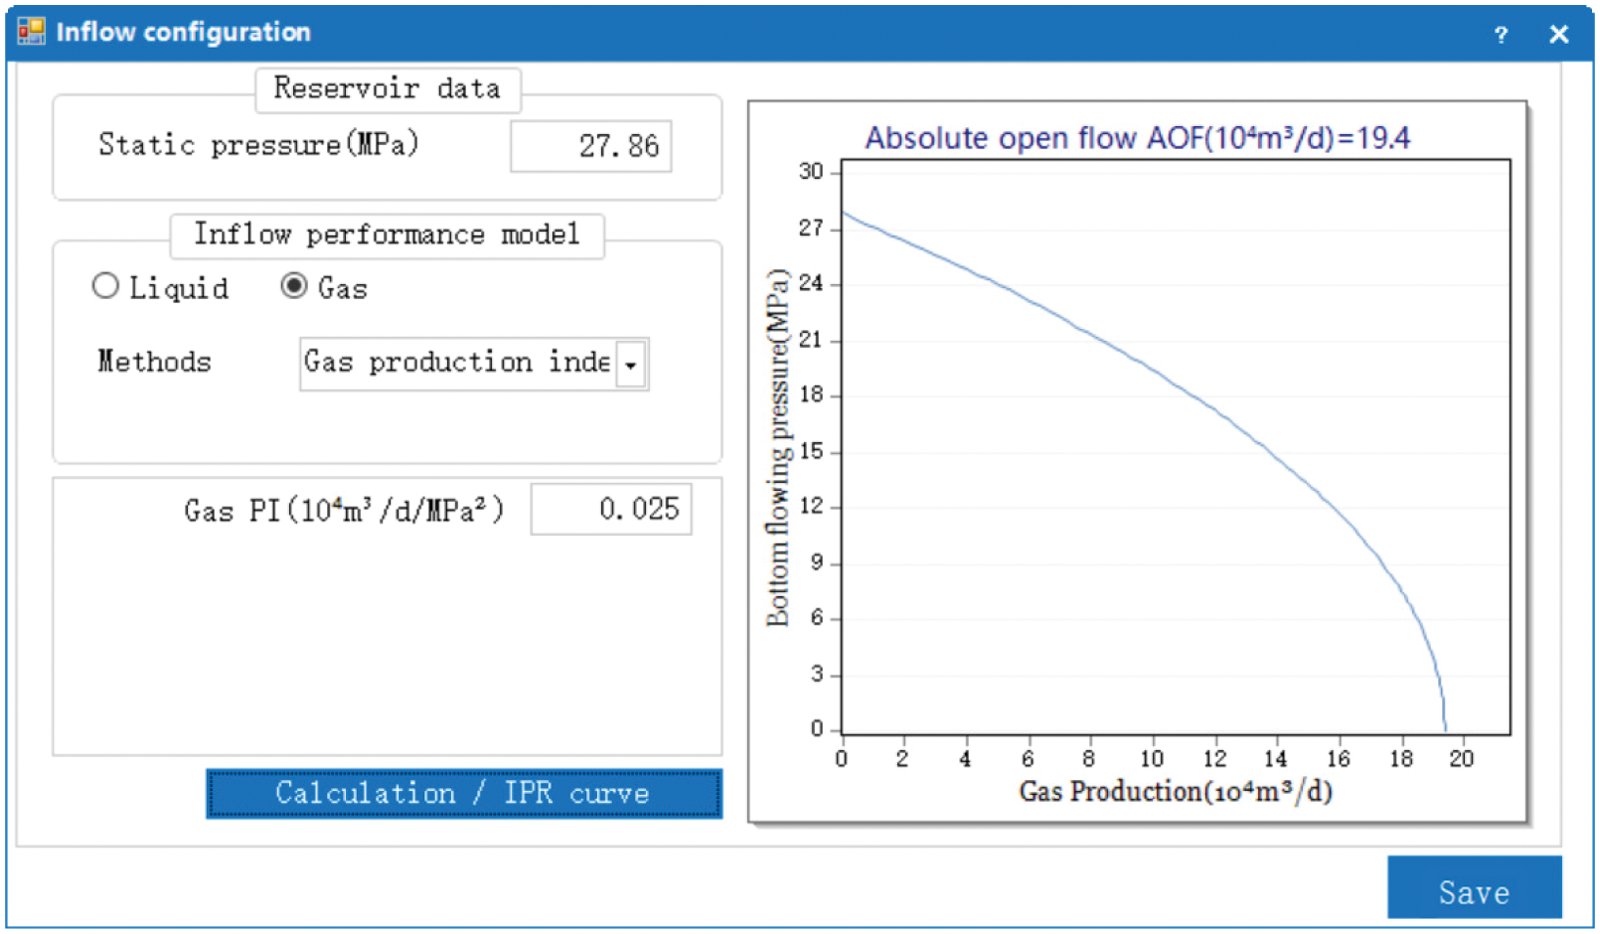
Figure 4: Graph of the gas inflow performance
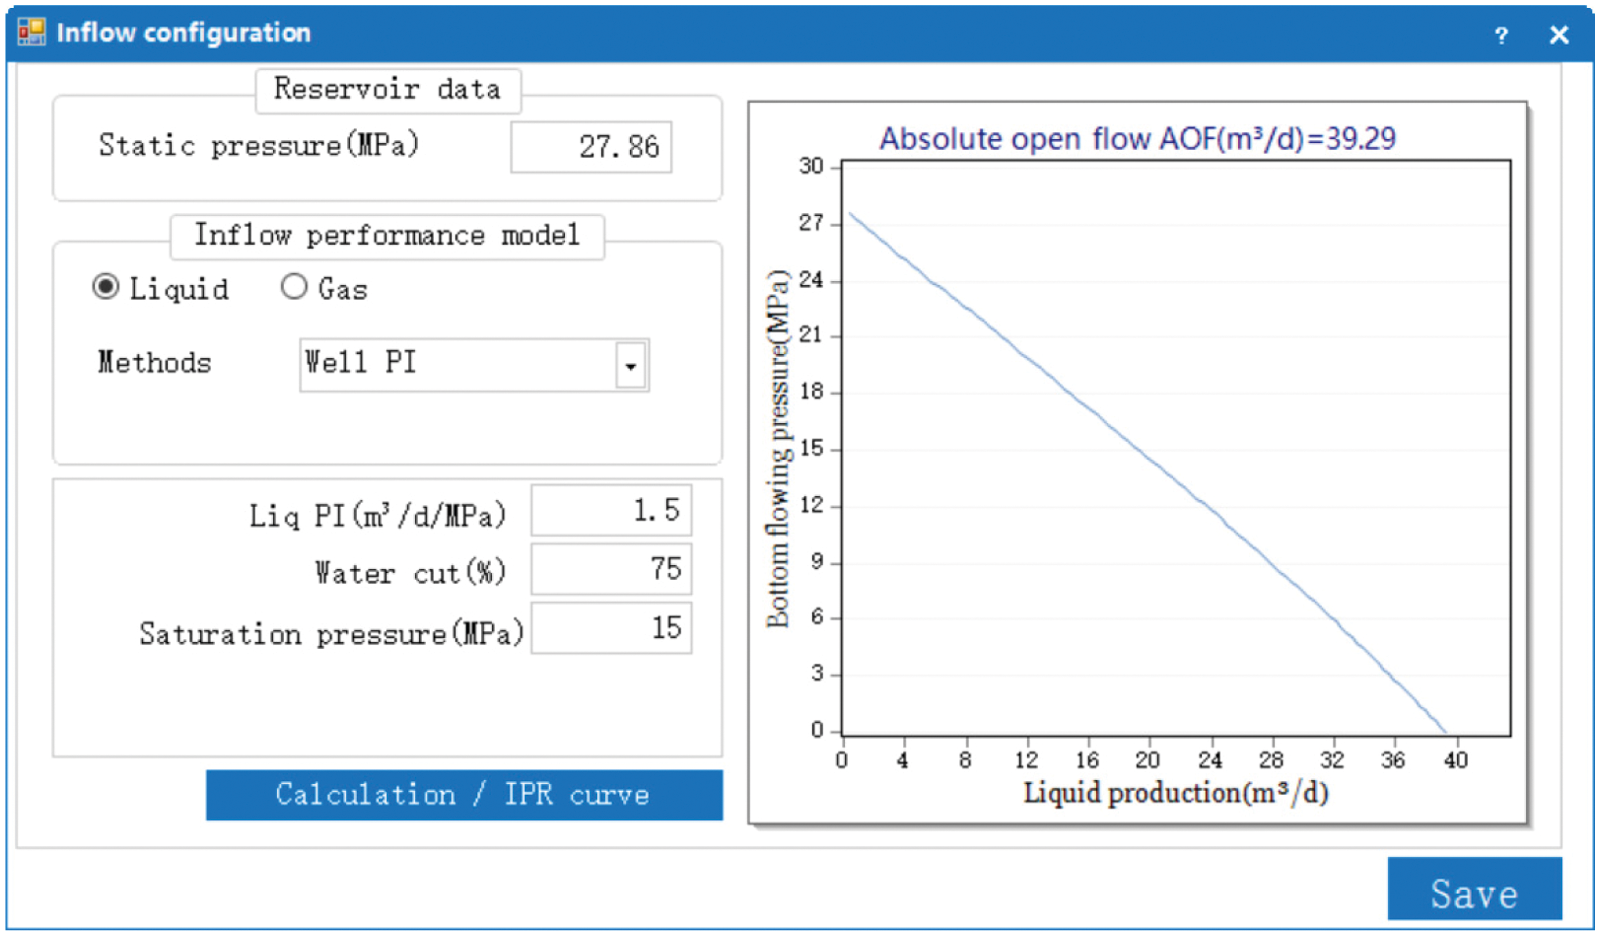
Figure 5: Graph of the liquid inflow performance
(2) Depth optimization of the stopper
The design results for different plunger stopper depths using a model that considers leakage are shown in the following Figs 6–8. Figs. 7 and 8 show that the liquid discharge increases with increasing stopper depth, but the increase in liquid discharge decreases after the stopper depth reaches approximately 3600 m. Therefore, the recommended stopper depth is approximately 3600 m.
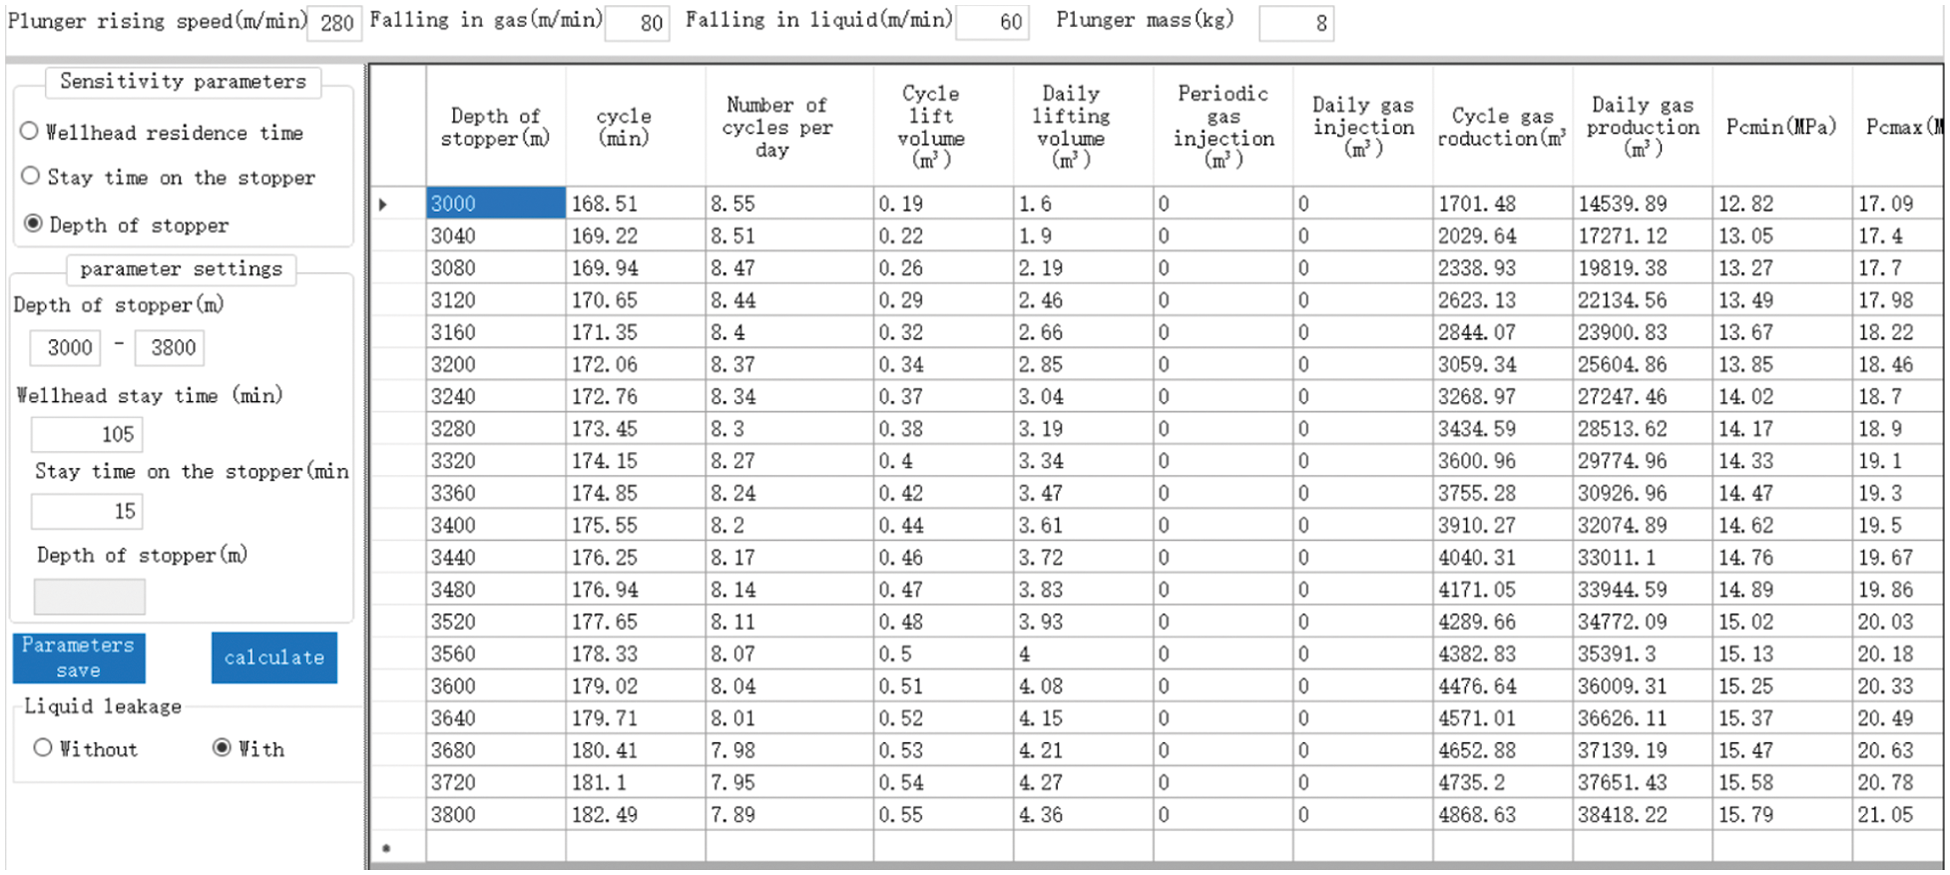
Figure 6: Plunger gas lift design for different plunger stopper depths
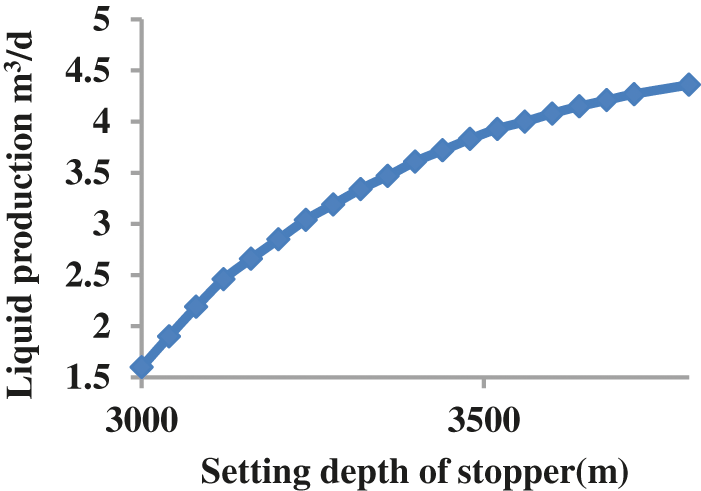
Figure 7: Liquid production for the plunger gas lift design for different plunger stopper depths
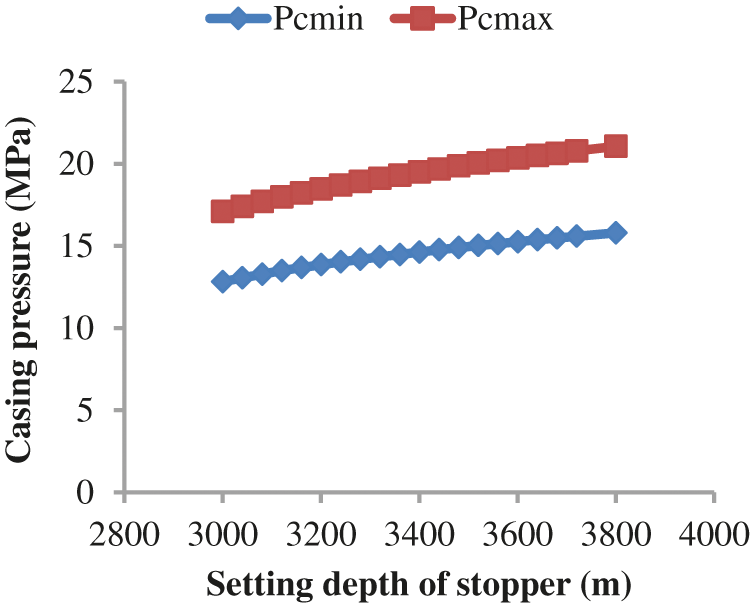
Figure 8: Casing pressures for the plunger gas lift design for different plunger stopper depths
The software determines that when the depth of the plunger stopper is 3640 m, the well is opened for 2 h and closed for 1 h, the gas production is 36626.1 m3/day, and the liquid production is 4.15 m3/day when a model that considers leakage is employed. As shown in Table 2, compared with the production data of the gas well with an actual plunger stopper depth of 3642.16 m (the gas production is 36000 m3/day and liquid production is 4 m3/day), the calculation error of the software simulation of the well is less than 5.0%.
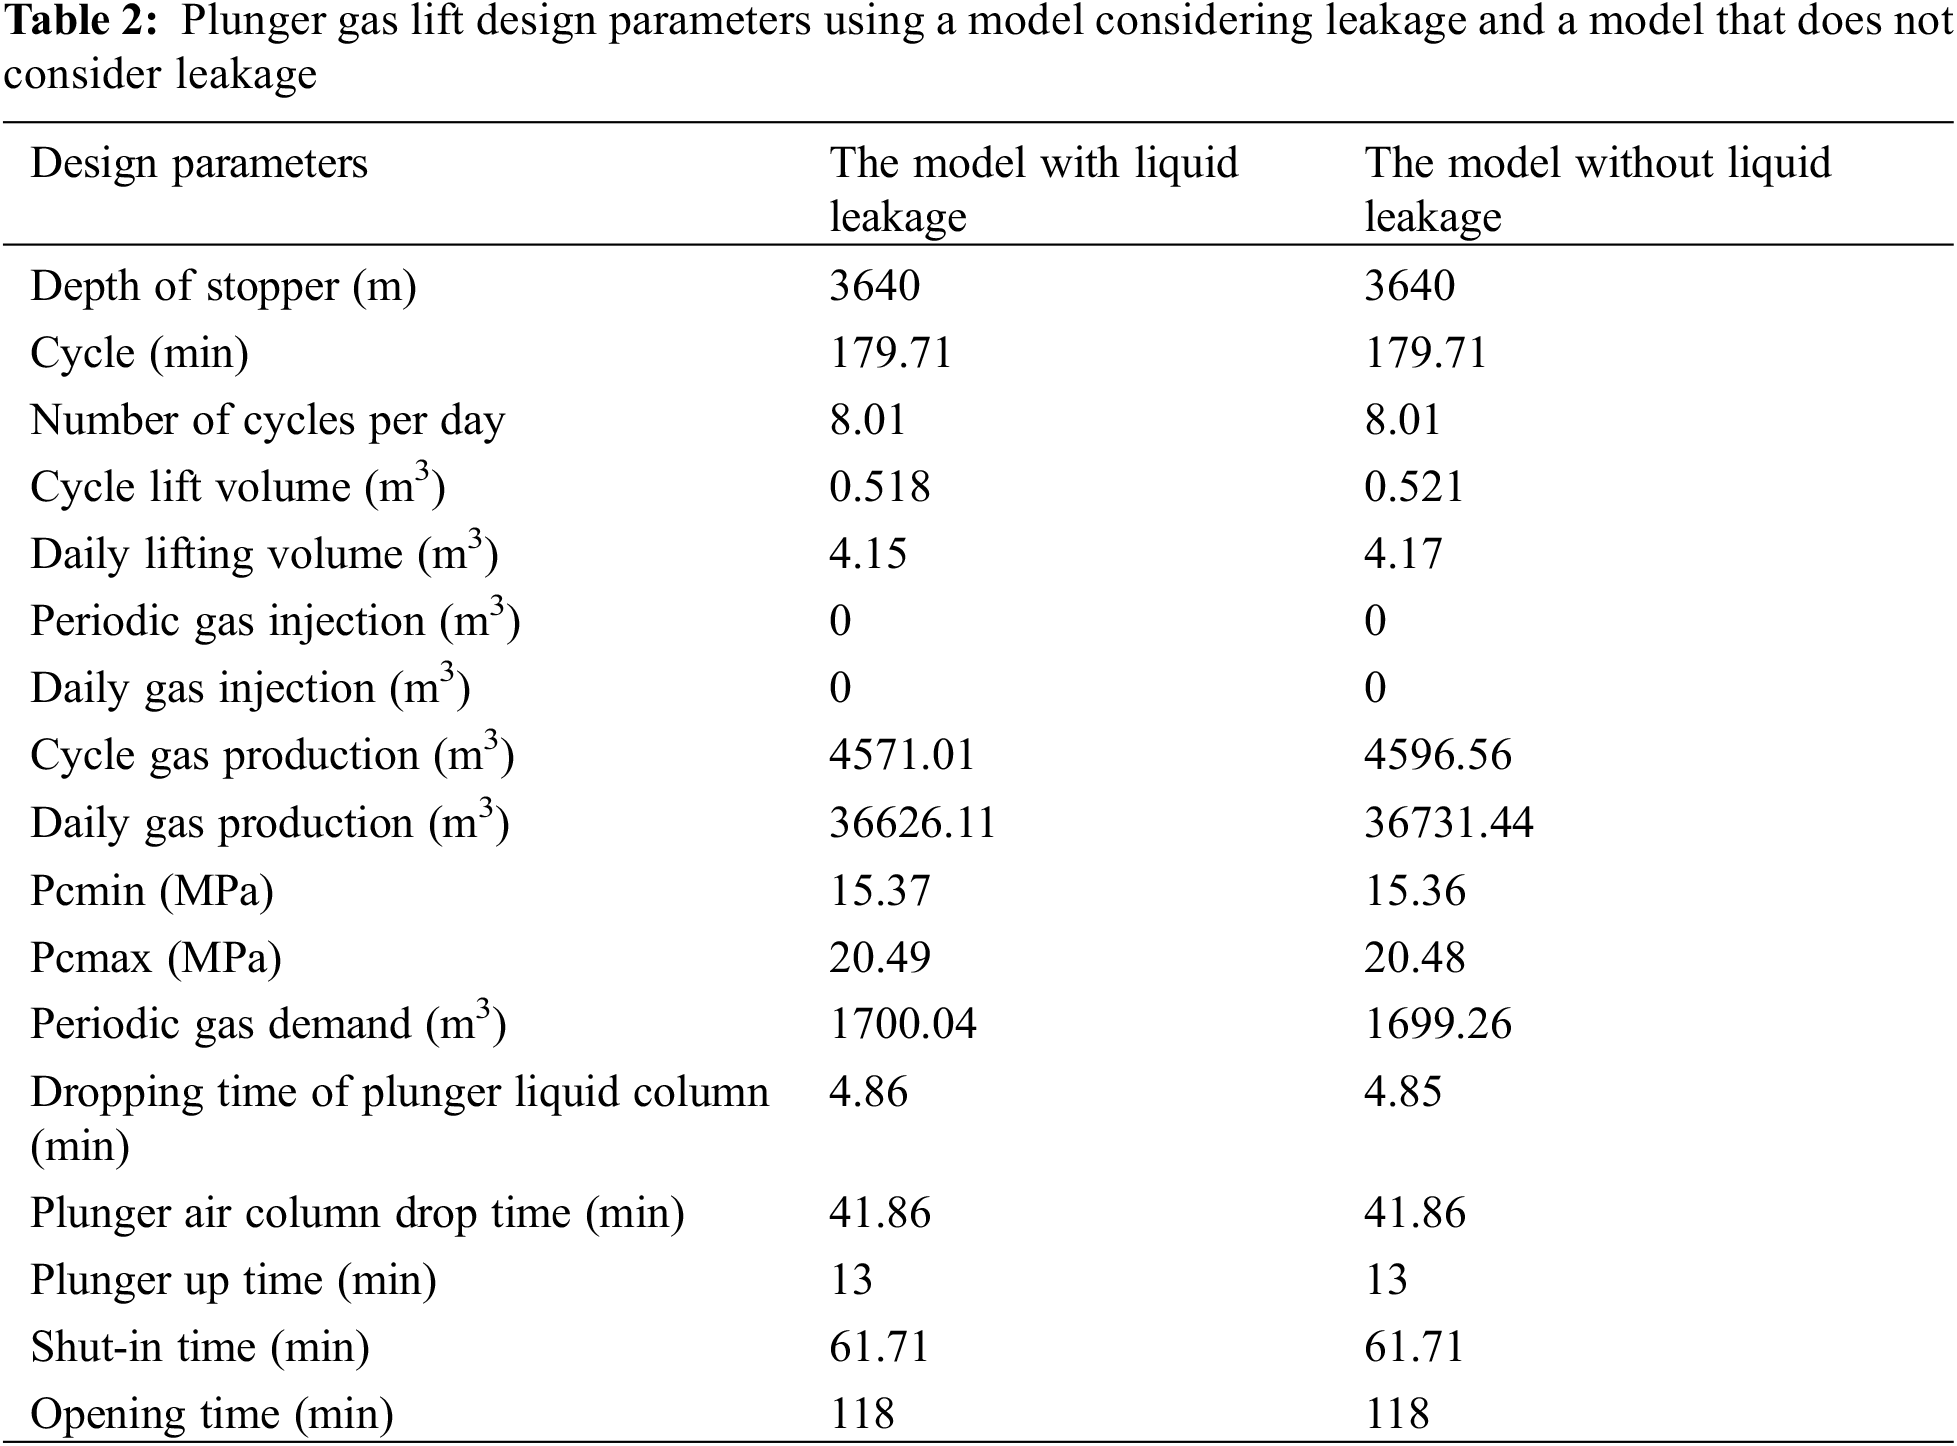
Table 2 and Fig. 9 show the model that considers leakage and one that does not consider leakage factors. The changes in fluid production are small. Figs. 10 and 11 show that a higher plunger speed corresponds to a higher casing pressure and smaller corresponding liquid production.
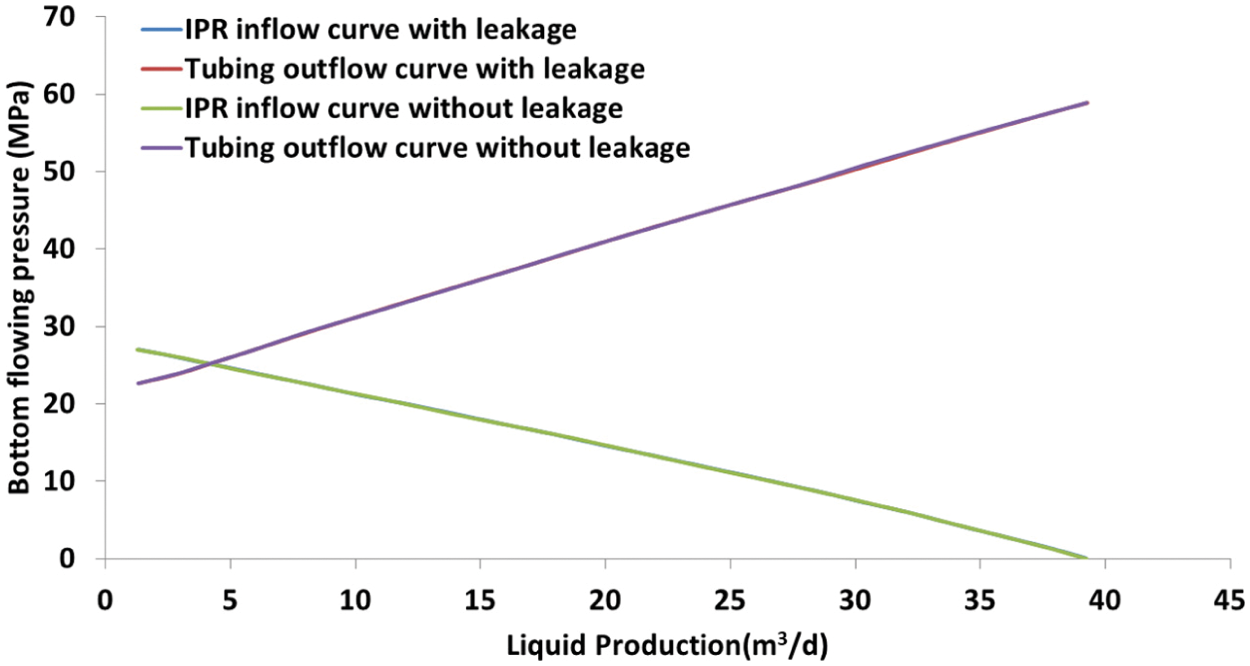
Figure 9: Nodal analysis graph of the plunger gas lift design
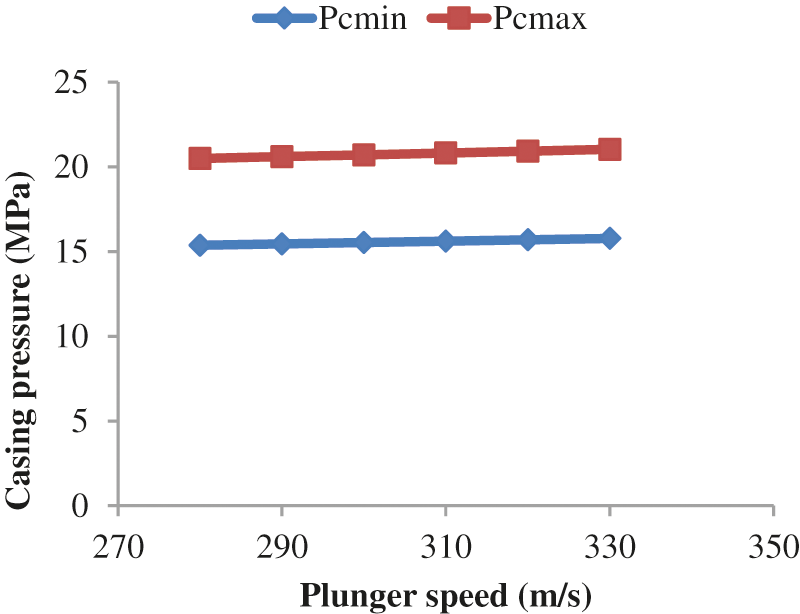
Figure 10: Casing pressures by analyzing the sensitive parameter of plunger velocity for a stopper depth of 3640 m
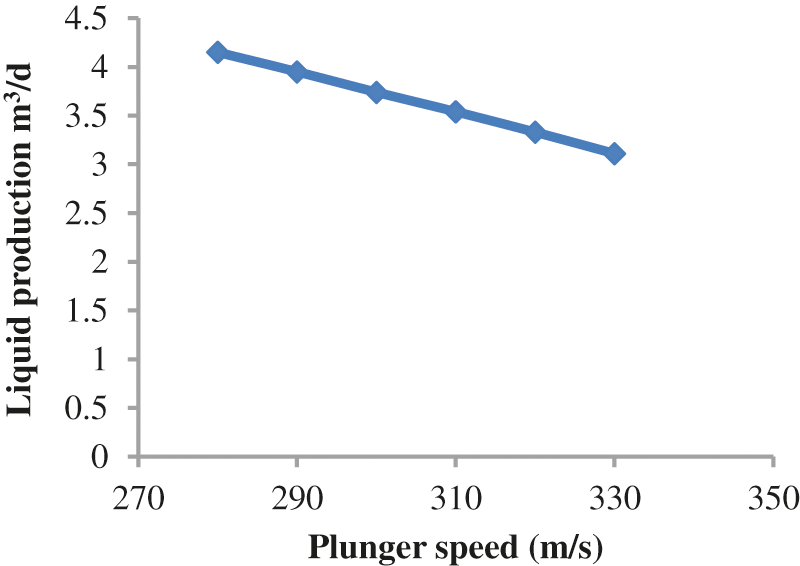
Figure 11: Liquid production by analyzing the sensitive parameter of plunger velocity for a stopper depth of 3640 m
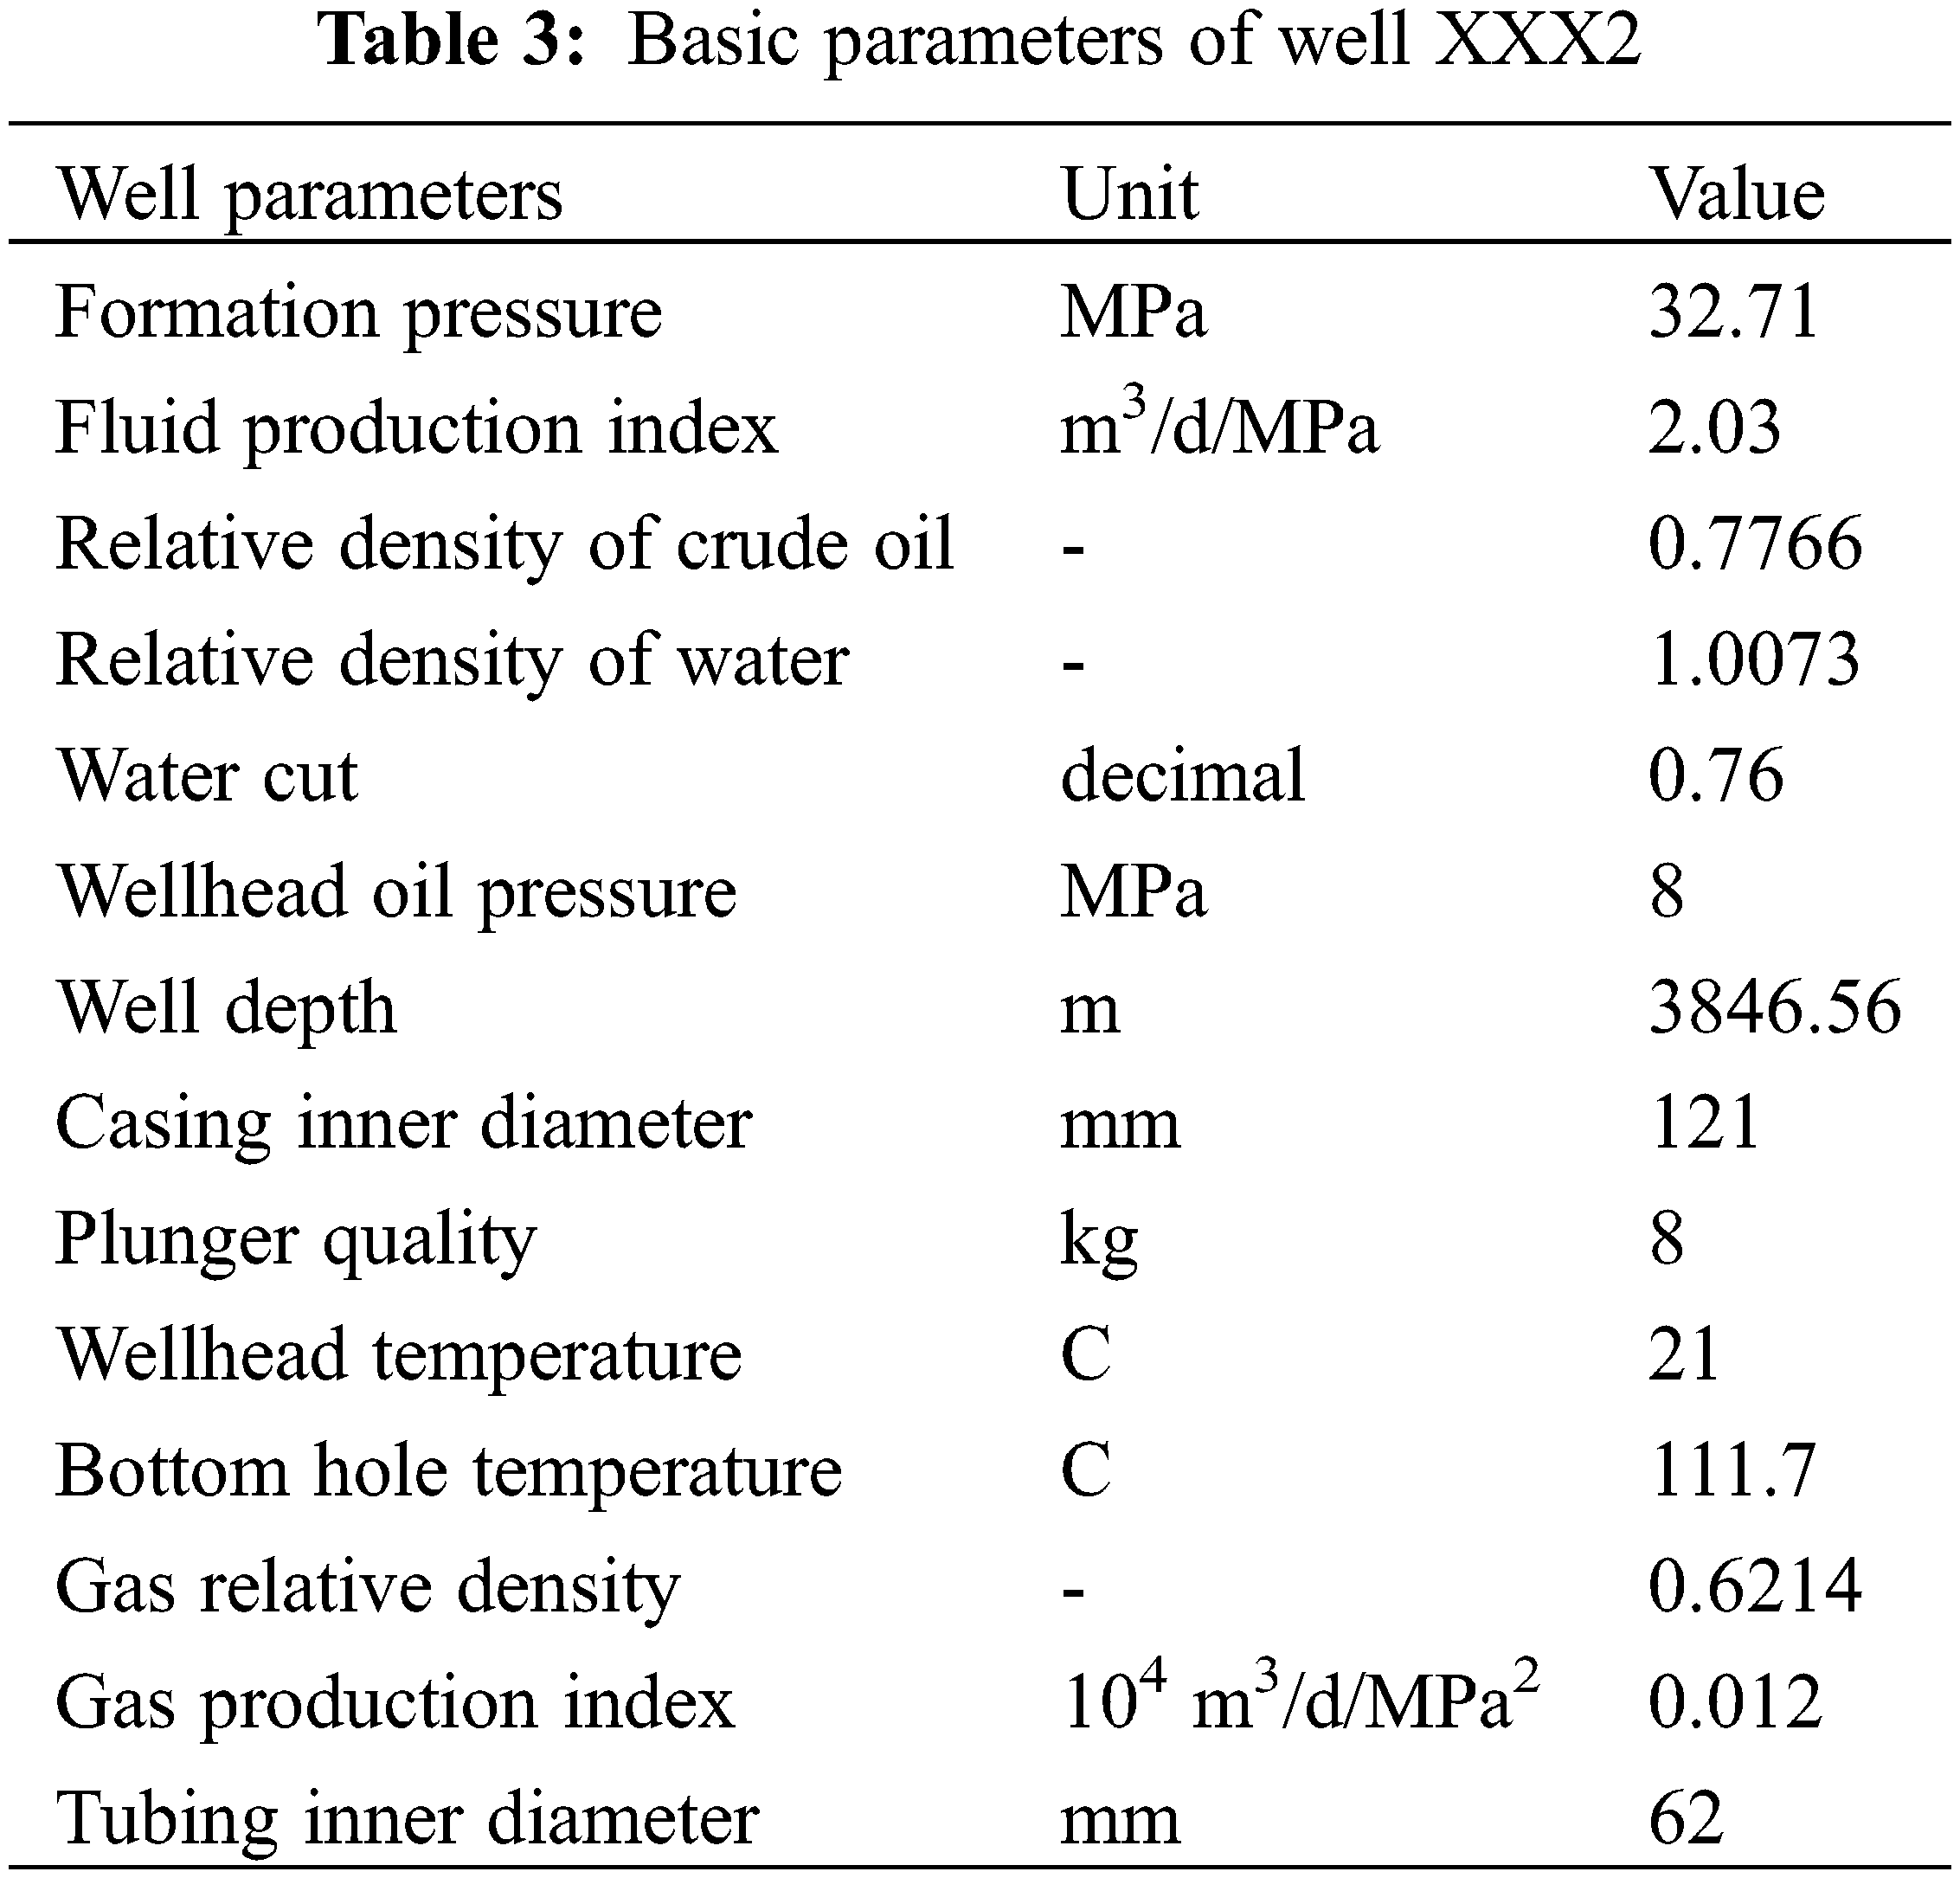
Example 2 involves example well XXX2 (Table 3), and the basic parameters are as follows.
(1) Parameter input (Figs. 12–14)
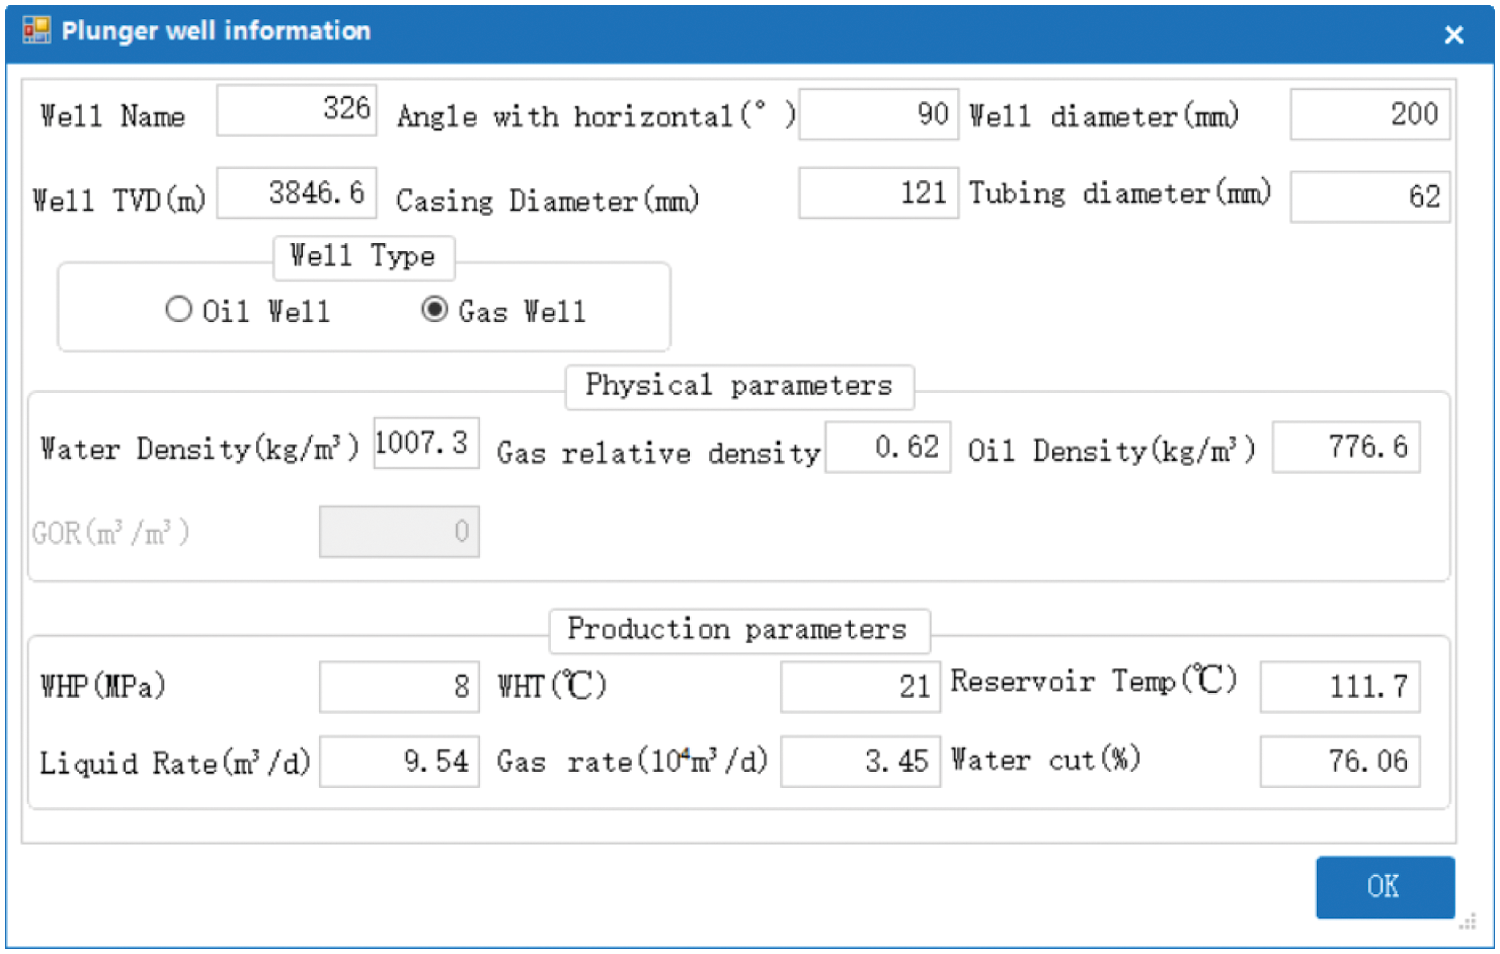
Figure 12: Basic gas well parameters (e.g., fluid properties and well profile configuration)
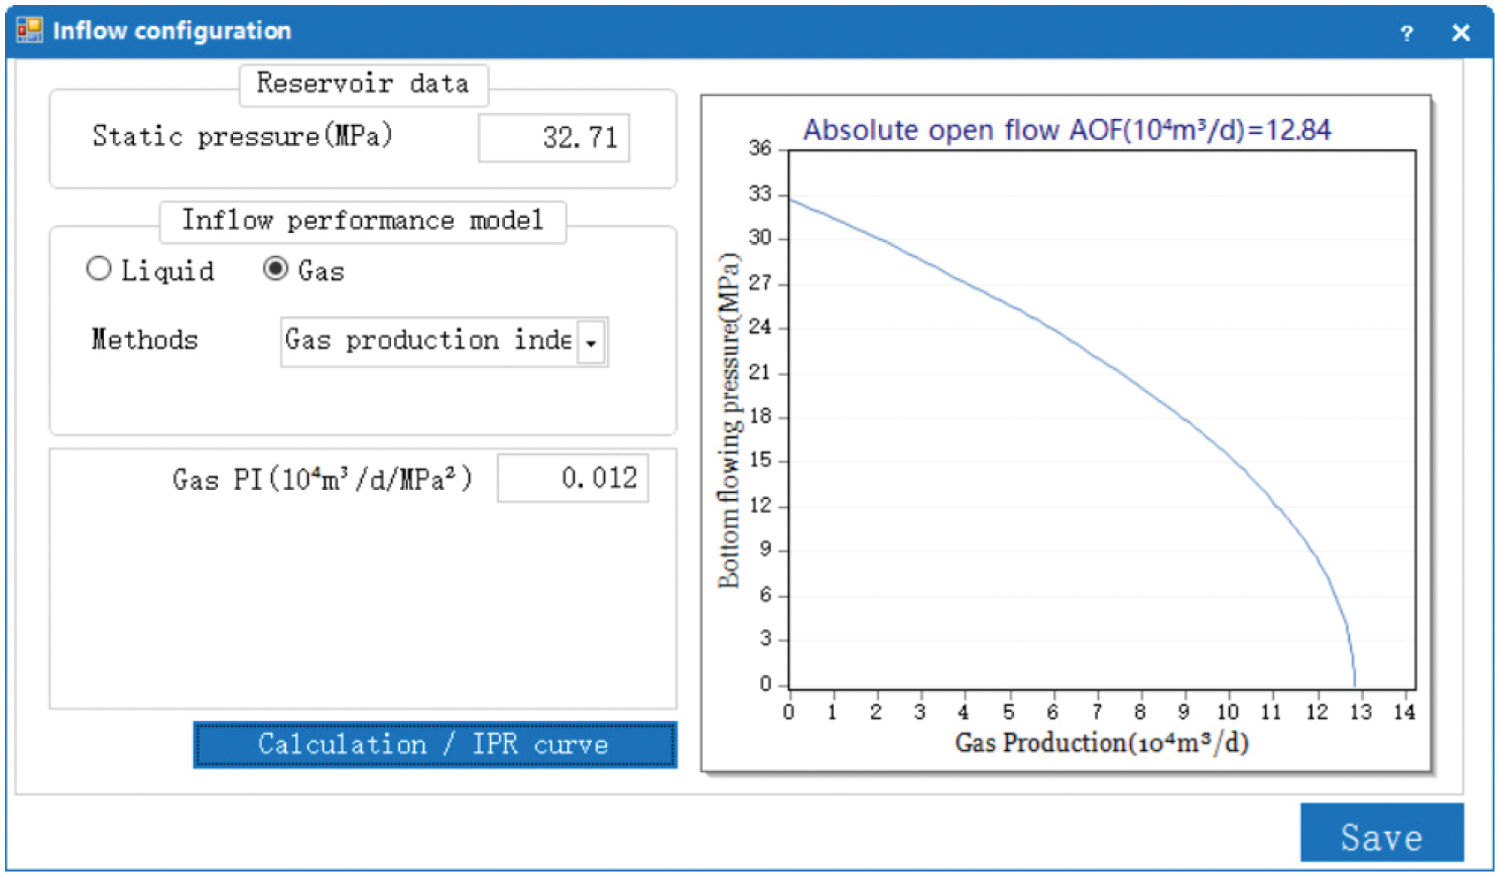
Figure 13: Graph of the gas inflow performance
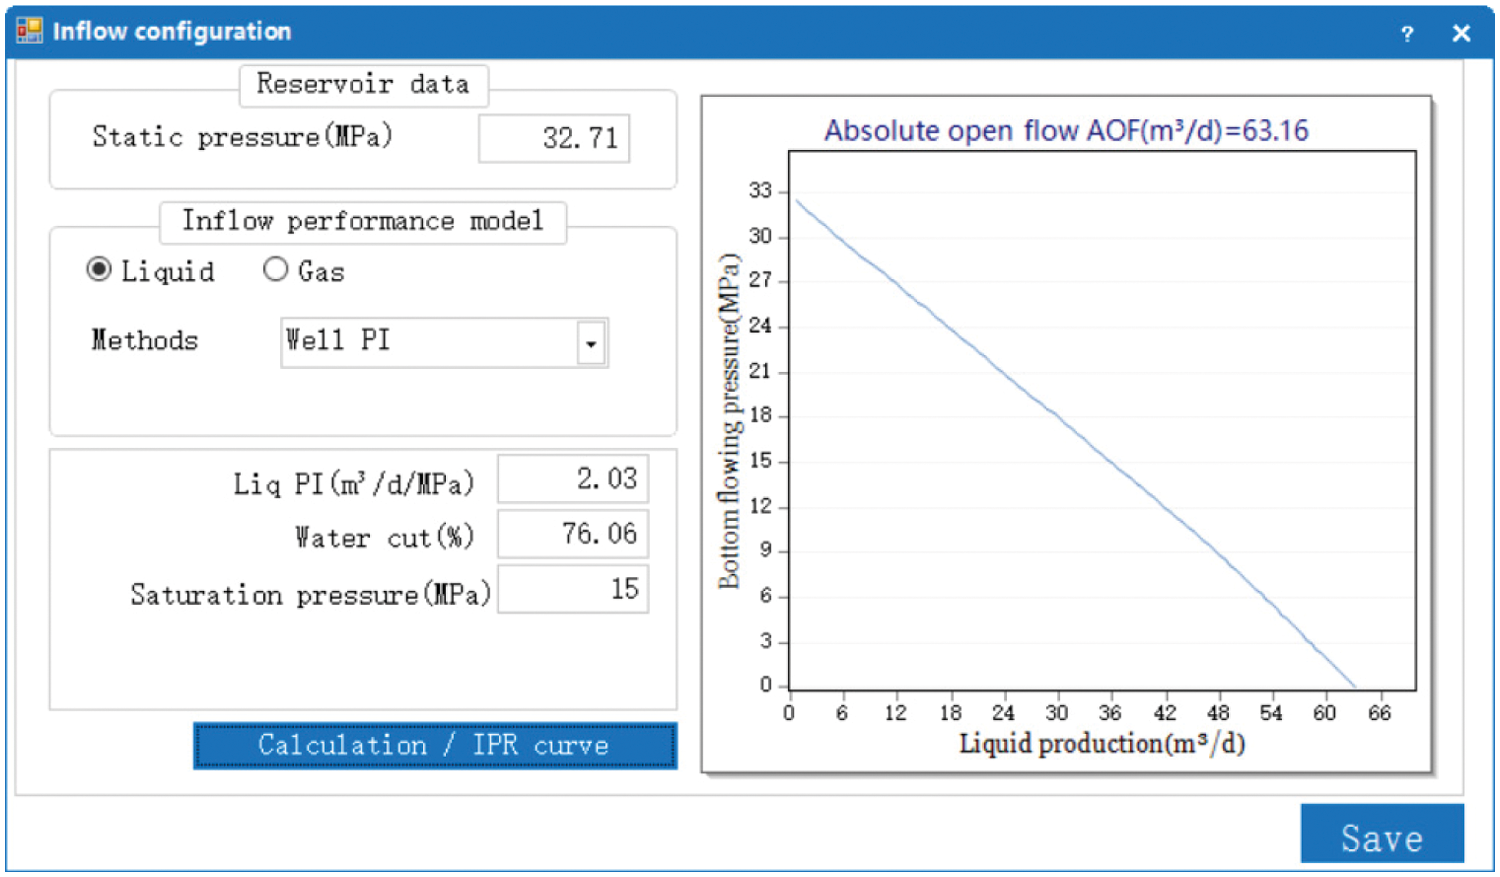
Figure 14: Graph of the liquid inflow performance
(2) Depth optimization of the stopper
The design results for different plunger stopper depths are shown in the following Figs 15–17. Figs. 16 and 17 show that the liquid discharge amounts increase with increasing stopper depths, but when the stopper depth reaches approximately 3500 m, the discharge volume slowly increases. Therefore, the depth of the stopper is recommended to be set to approximately 3500 m.
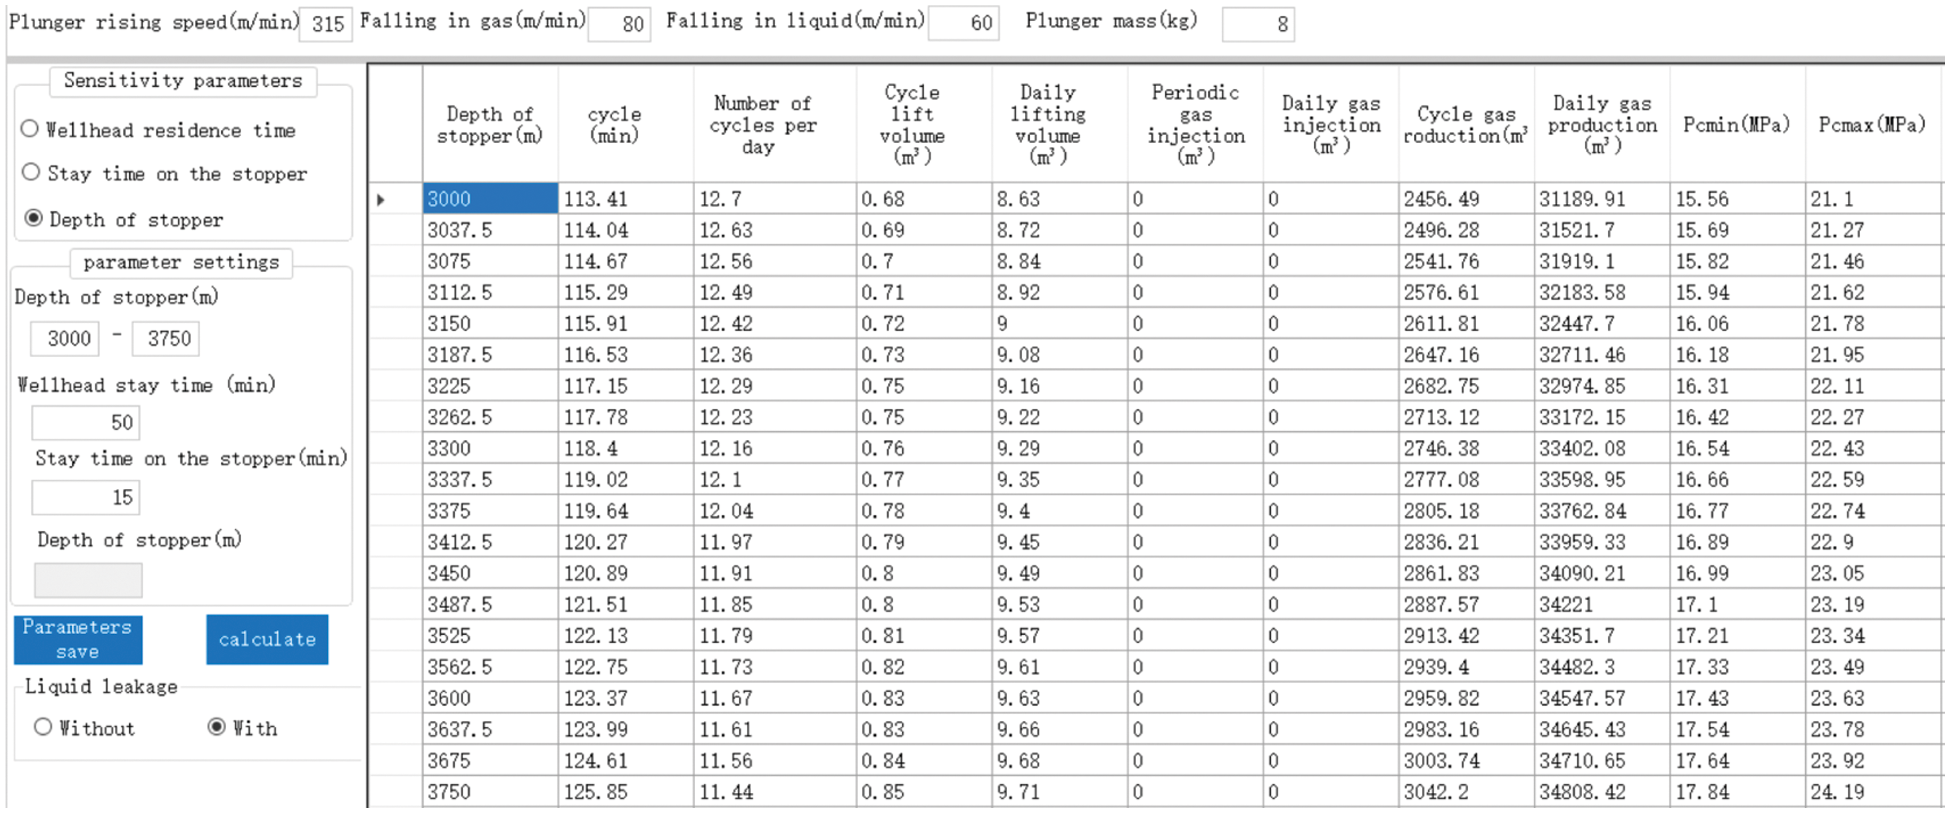
Figure 15: Plunger gas lift design for different plunger stopper depths
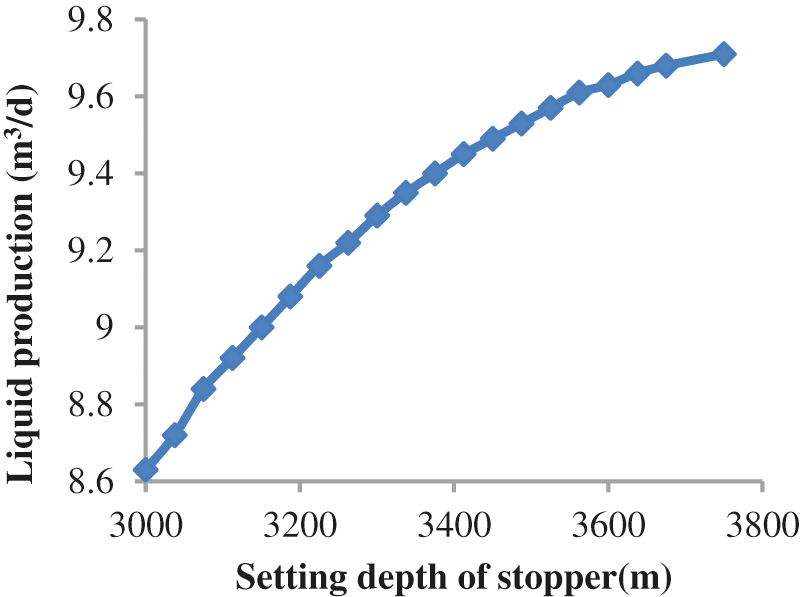
Figure 16: Liquid production of the plunger gas lift design for different plunger stopper depths
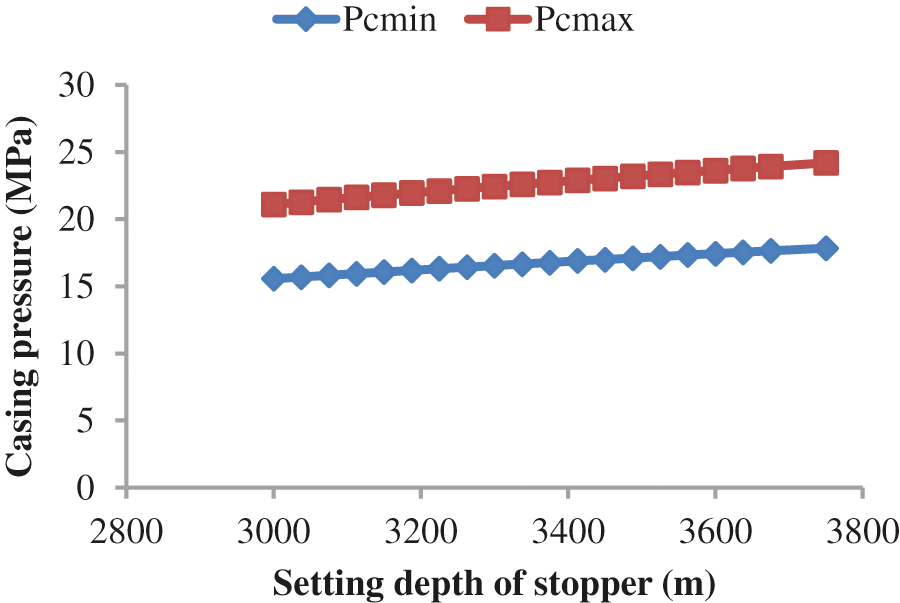
Figure 17: Casing pressures of the plunger gas lift design for different plunger stopper depths
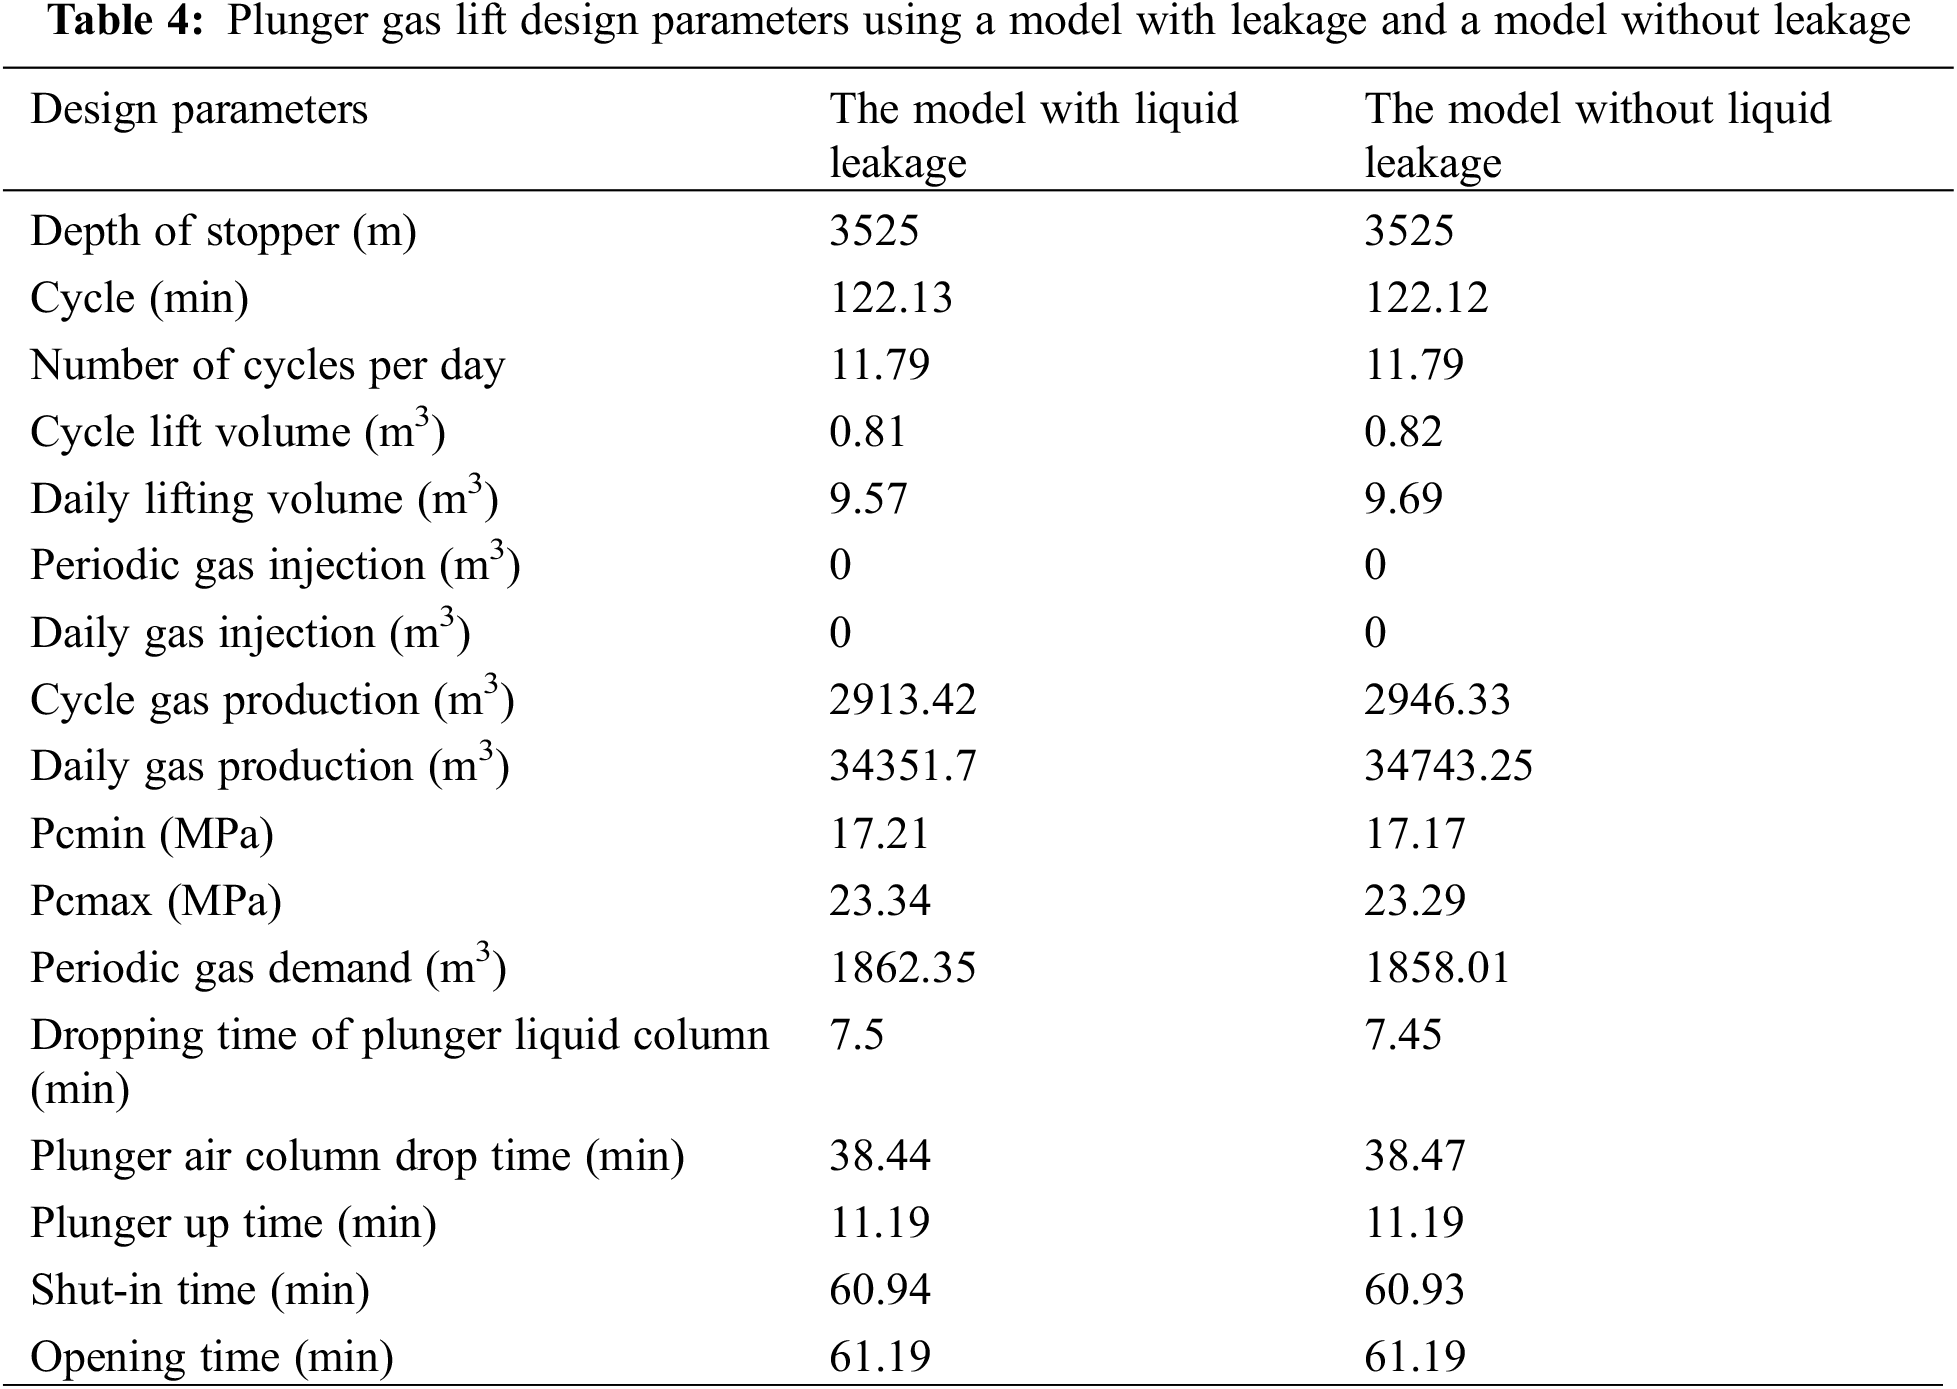
The software determines that when the depth of the plunger stopper is 3525 m, the well is opened for 1 h and closed for 1 h, the gas production is 34351.7 m3/day, and the liquid production is 9.57 m3/day. As shown in the figure below, compared with the production data of the actual plunger stopper depth of 3500 m (e.g., gas production is 34500 m3/day and liquid production is 9.54 m3/day), the software simulation calculation error for the well is less than 5.0%.
Table 4 and Fig. 18 show the results when the model considers leakage and does not consider leakage factors; the changes in fluid production are small. Figs. 19 and 20 show that a higher plunger speed corresponds to a higher casing pressure and smaller corresponding liquid production.
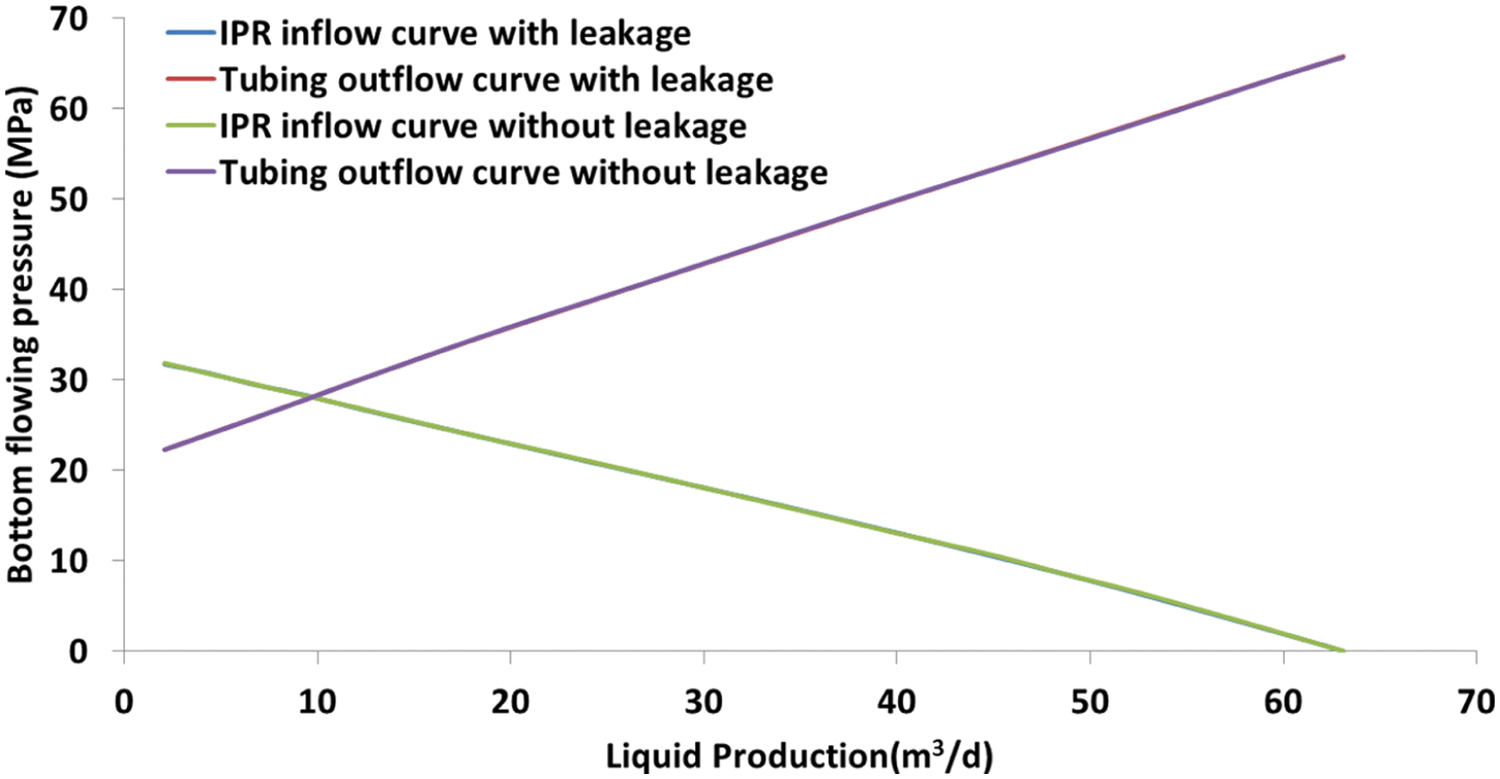
Figure 18: Nodal analysis graph of the plunger gas lift design
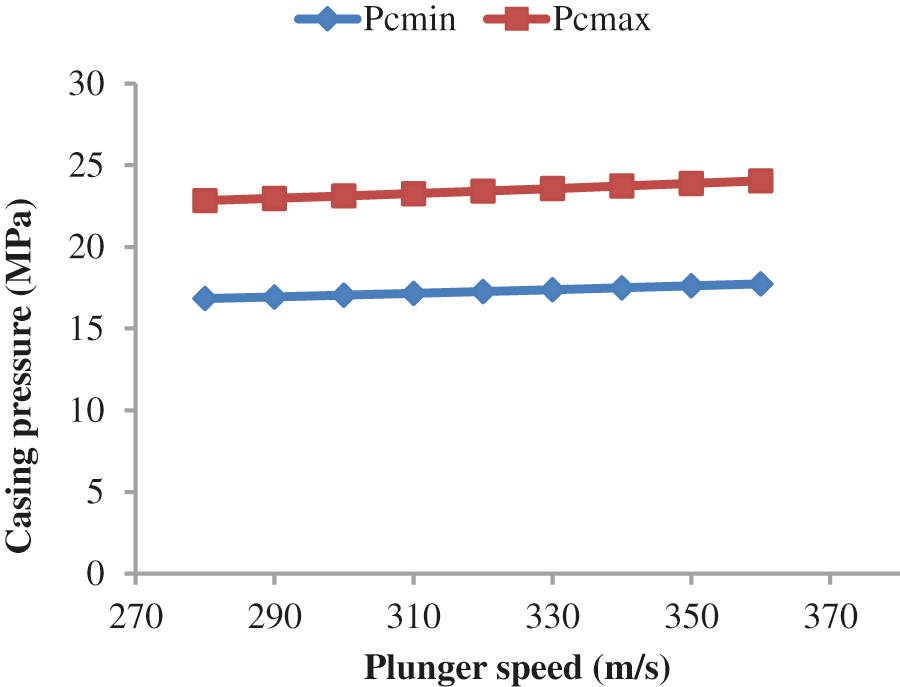
Figure 19: Casing pressures by analyzing the sensitive parameter of plunger velocity for a stopper depth of 3525 m
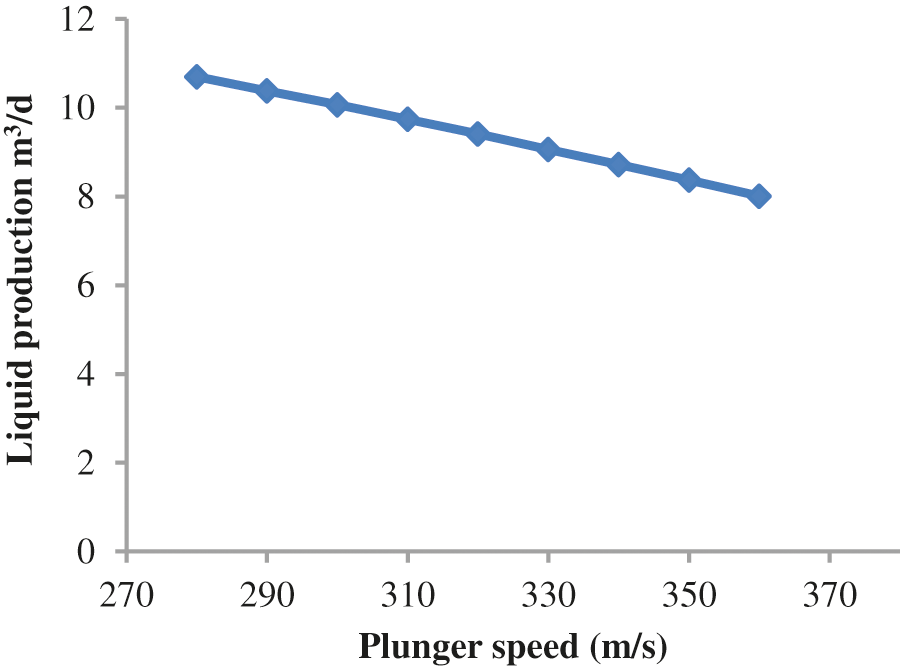
Figure 20: Liquid production by analyzing the sensitive parameter of plunger velocity for a stopper depth of 3525 m
2.3 Feasibility Analysis of the Plunger Gas Lift with a Packer in the Annulus
Taking well XXX2 as an example, the following principles are:
(1) The principle of equivalent casing inner diameter states that the storage space below the packer is equal to the volume of an equivalent amount of casing;
(2) The maximum achievable pressure in the reservoir space is the formation pressure; i.e., the designed maximum casing pressure + pressure gradient cannot be greater than the formation pressure.
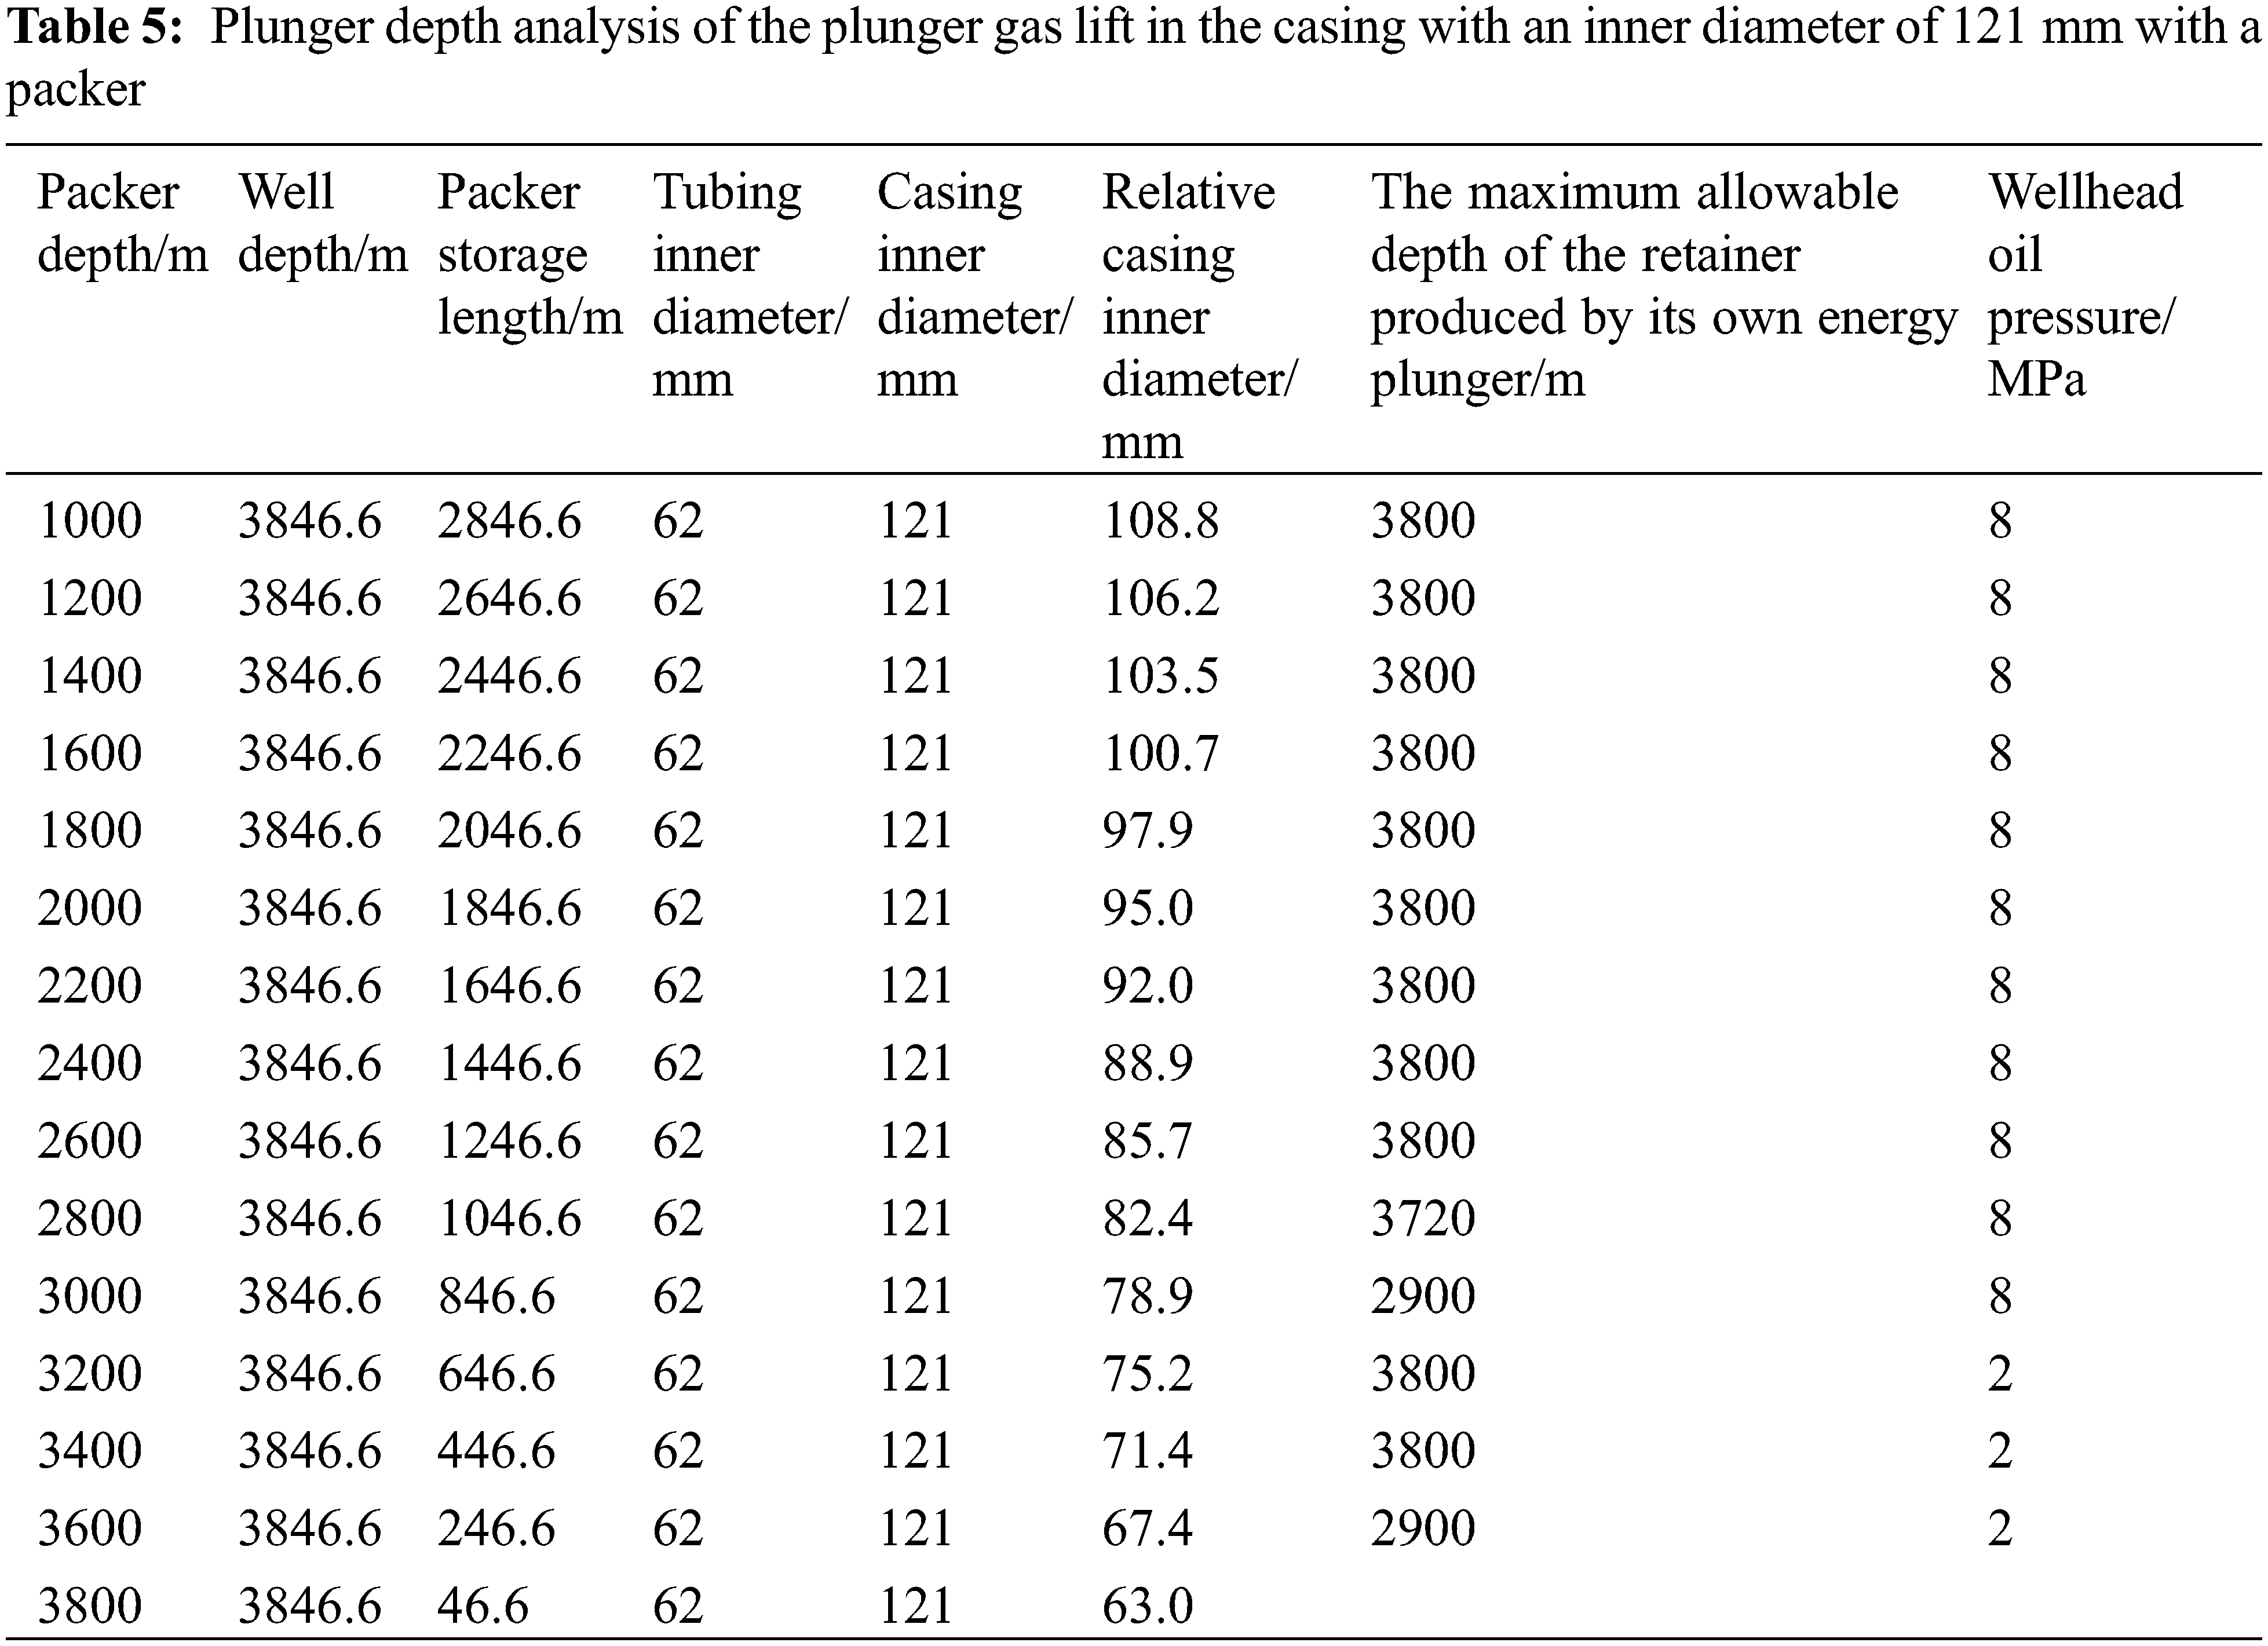
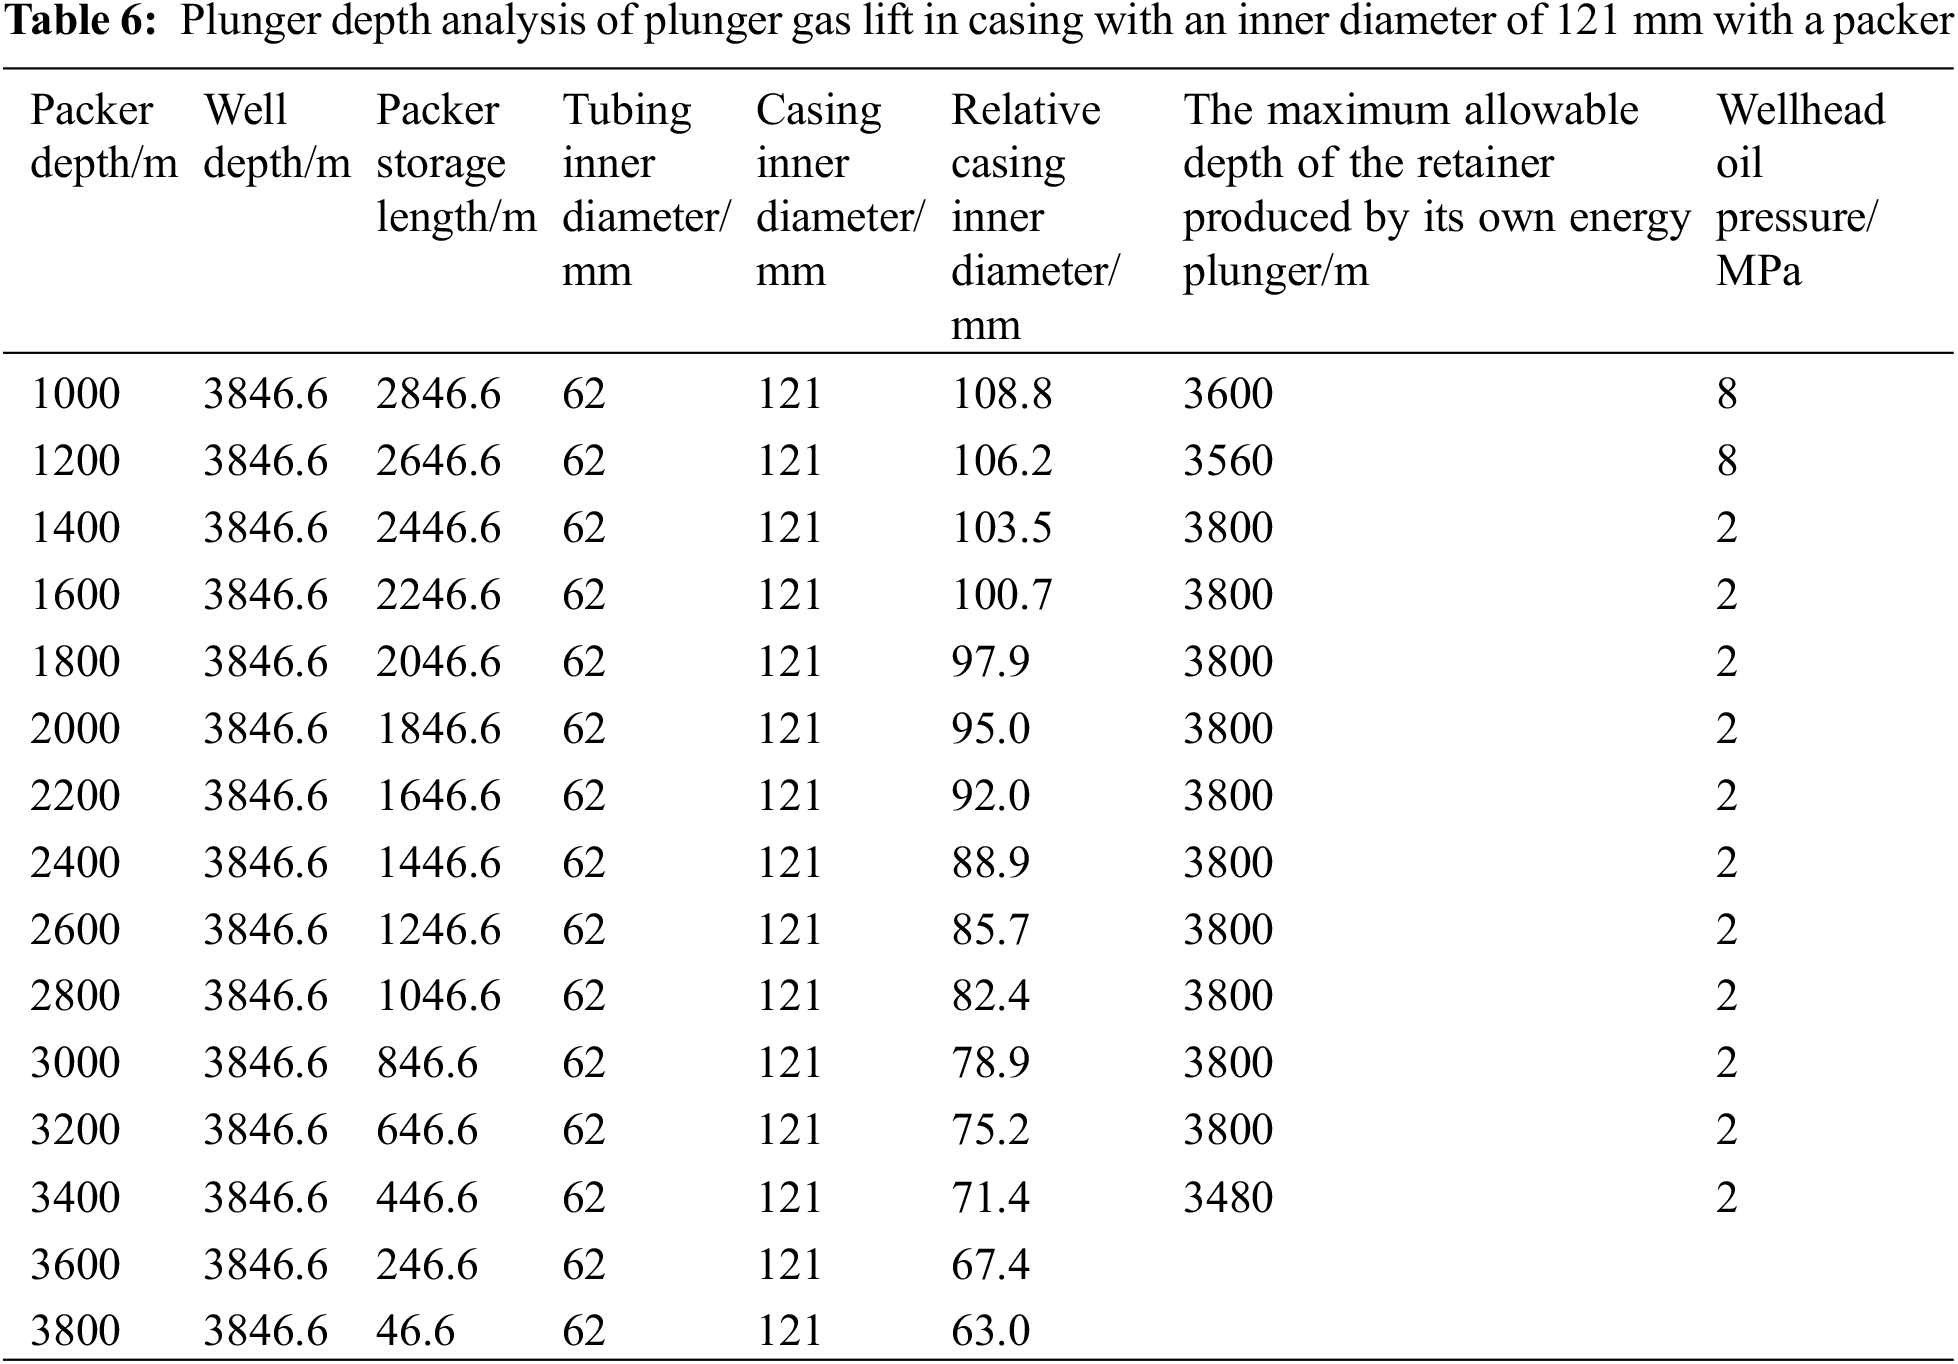
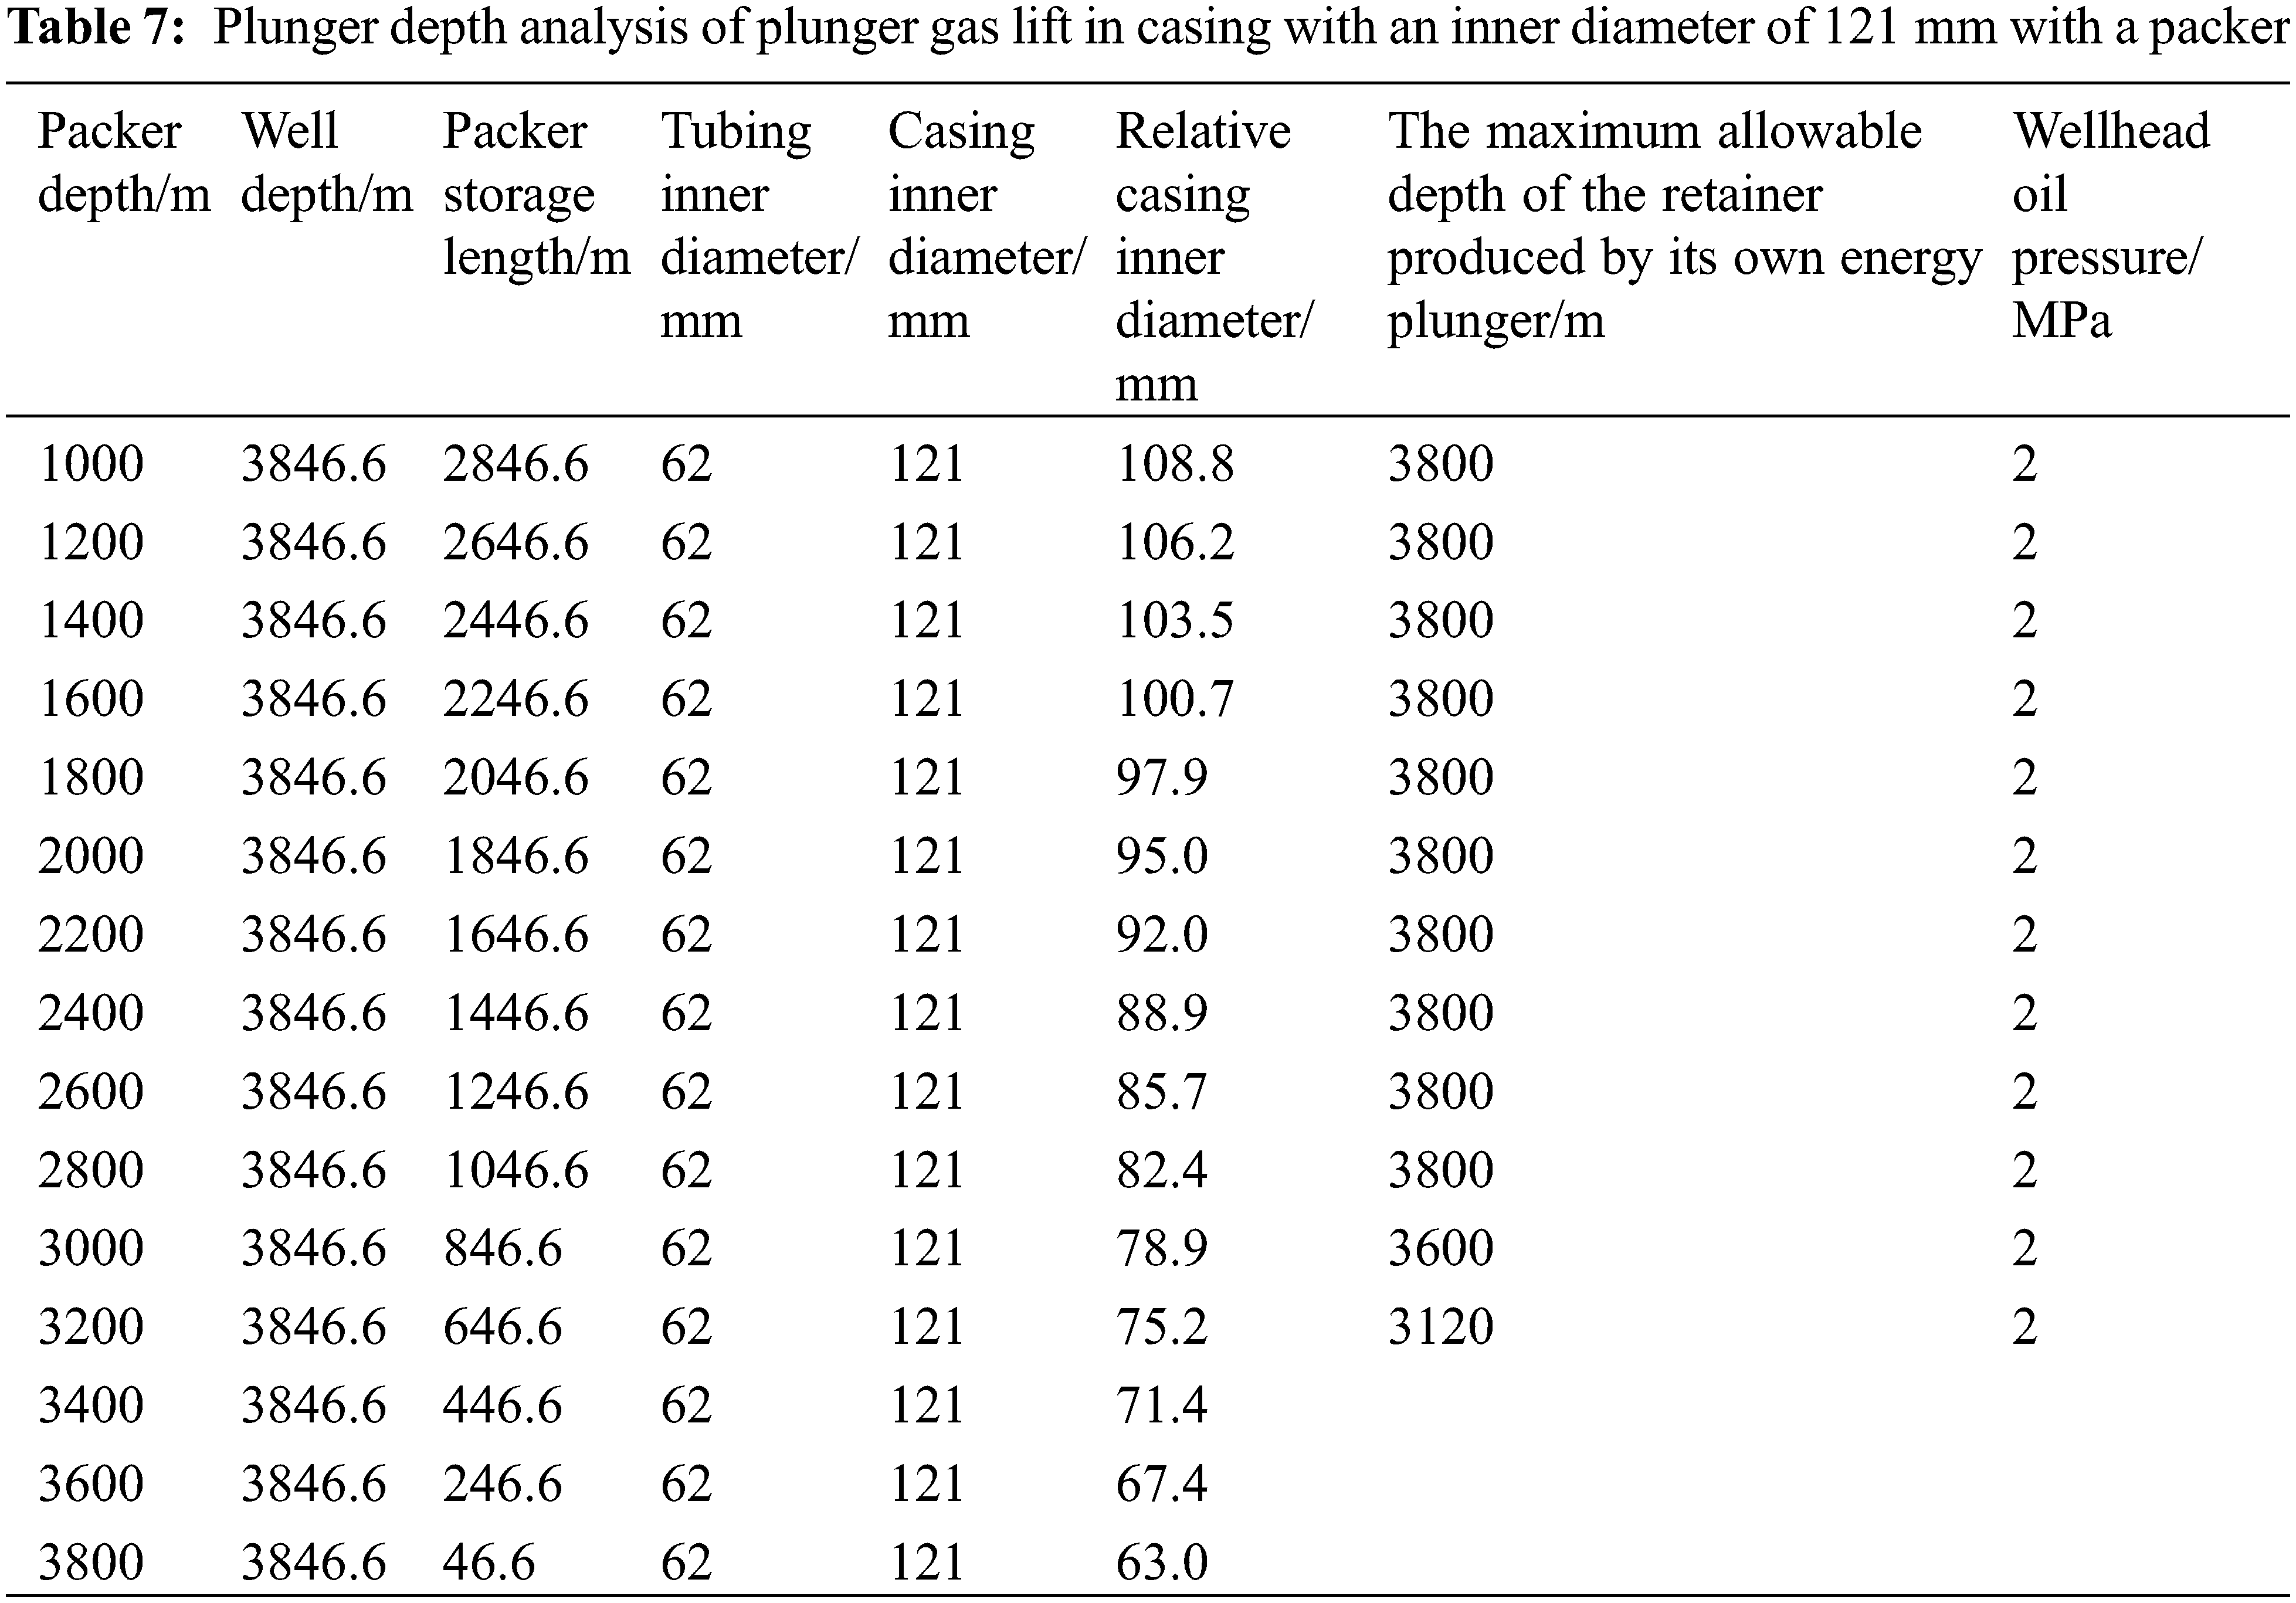
According to these principles, the plunger gas lift dynamic model is used for simulation analysis. Tables 5–7 provide the maximum running depths of the stopper for the plunger gas lift based on the energy of a gas well with a 121-mm inner casing diameter. Table 5 shows that for the case of a 121-mm inner casing diameter and 8 MPa wellhead pressure, plunger gas lift drainage is not feasible after the depth of the packer exceeds 3200 m. When the wellhead pressure decreases to 2 MPa, plunger gas lift drainage can occur when the packer is not deeper than 3600 m and the stopper is not deeper than 2900 m. Tables 5–7 show that with decreasing formation pressures, the feasible range for plunger gas lift in gas wells with packers gradually decreases.
① The formation pressure is 32.71 MPa
Depth feasibility analysis of the plunger gas lift with a packer in the casing with an inner diameter of 121 mm.
② The formation pressure is 20 MPa
③ The formation pressure is 15 MPa
Considering the complex and variable gas-liquid inflows in shale gas wells, a loosely coupled method to determine the shale gas well gas inflow dynamics and liquid inflow dynamics is proposed, and the gas and liquid follow their respective inflow dynamic equations, which are combined with the experimental data of plunger gas lift leakage. Using the node analysis principle, a new model for plunger gas lift design that considers leakage factors was established, software development was completed, and the analysis was verified using field examples. Based on this model, a method for evaluating the feasibility of plunger gas lift by using the equivalent annulus inner diameter method for a gas well annulus with a packer is provided, and a feasibility analysis of the plunger gas lift is carried out for typical gas wells. The following conclusions are reached:
(1) By comparing the calculated cycle, wellhead oil casing pressures and other operational parameters with the actual operational production parameters, the coincidence rate is more than 90%, which verifies the reliability of the established model.
(2) The leakage amounts are closely related to the movement speeds of the plunger, but when the average movement speed of the plunger is small, the upward leakage of the plunger is small. The wellhead casing pressures are also closely related to the movement speeds of the plunger. With higher movement speeds of the plunger, higher wellhead casing pressures are required.
(3) For a 121-mm-inner-diameter gas well casing, when the wellhead pressure is 8 MPa and the depth of the packer exceeds 3200 m, the plunger gas lift drainage is not feasible. When the wellhead pressure decreases to 2 MPa, plunger gas lift drainage can occur when the packer is lowered to deeper than 3600 m and the retainer is lowered to deeper than 2900 m. With a decrease in formation pressure of the gas well, the feasible range for plunger gas lift in the gas well with a packer gradually decreases.
Acknowledgement: We thank Luo Wei for serving as the corresponding author for this article.
Funding Statement: The authors would also like to acknowledge the support provided by the National Natural Science Fund Project (62173049) and Major National Projects (2016ZX05056004-002).
Conflicts of Interest: The authors declare that they have no conflicts of interest to report regarding the present study.
1. Jin, S., Bai, X., Luo, W., Li, L., Liao, R. (2020). Improving existing drainage and gas recovery technologies: An experimental study on the wellbore flow in a horizontal well. Fluid Dynamics & Materials Processing, 16(6), 1229–1242. DOI 10.32604/fdmp.2020.011051. [Google Scholar] [CrossRef]
2. Liu, J., Jiang, Z., Feng, X., Liao, R., Feng, D. et al. (2020). An experimental study on the pressure distribution in horizontal gas wells. Fluid Dynamics & Materials Processing, 16(6), 1243–1258. DOI 10.32604/fdmp.2020.010722. [Google Scholar] [CrossRef]
3. Foss, D. L., Gaul, R. B. (1965). Plunger-life performance criteria with operating experience-ventura avenue field. Spring Meeting of the Pacific Coast District, pp. 124–140. [Google Scholar]
4. Abercrombie, B. (1980). “Plunger Lift” in the technology of artificial lift methods, pp. 483–518. USA: Penn Well Publishing Co. [Google Scholar]
5. Lea, F. J. (1982). Dynamic analysis of plunger lift operations. Journal of Petroleum Technology, 34(11), 2617–2629. DOI 10.2118/10253-PA. [Google Scholar] [CrossRef]
6. Mower, L. N., Lea, J. F., Beauregard, E., Ferguson, P. L. (1985). Defining the characteristics and performance of gas-lift plungers. 60th Annual Technical Conference and Exhibition of the Society of Petroleum Engineers, Las Vegas, NV. SPE14344. [Google Scholar]
7. Marcano, L., Chacin, J. (1994). Mechanistic design of conventional plunger lift installation. SPE Advanced Technology Series, 2(1), 15–24. DOI 10.2118/23682-PA. [Google Scholar] [CrossRef]
8. Baruzzi, J., Alhanati, F. (1995). Optimum plunger lift operation. Production Operations Symposium, Oklahoma City, Oklahoma, USA. DOI 10.2118/29455-MS. [Google Scholar] [CrossRef]
9. Gasbarri, S., Wiggins, M. L. (1997). A dynamic plunger lift for gas wells. SPE Production Operations Symposium, Oklahoma City, Oklahoma, USA. DOI 10.2118/37422-MS. [Google Scholar] [CrossRef]
10. Maggard, J. B., Wattenbarger, R. A., Scott, S. L. (2000). Modeling plunger lift for water removal from tight gas wells. 2000 SPE/CERI Gas Technology Symposium, Calgary, Alberta Canada. SPE59747. [Google Scholar]
11. Chava, G. K., Falcone, G., Teodoriu, C. (2008). Development of a new plunger-lift model using smart plunger data. 2008 SPE Annual Technical Conference and Exhibition, Denver, Colorado, USA. SPE115934. [Google Scholar]
12. Tang, Y. L., Liang, Z. (2008). A new method of plunger lift dynamic analysis and optimal design for gas well deliquification. 2008 SPE Annual Technical Conference and Exhibition, Denver, Colorado, USA. SPE116764. [Google Scholar]
13. Tang, Y. L. (2009). Plunger lift dynamics characteristics in single well and network system for tight gas well deliquification. 2009 SPE Annual Technical Conference and Exhibition, New, Orleans, Louisiana, USA. SPE124571. [Google Scholar]
14. Sask, D., Kola, D., Tuftin, T. (2010). Plunger lift optimization in horizontal gas wells: Case studies and challenges. Canadian Unconventional Resources & International Petroleum Conference, Calgary, Alberta, Canada. SPE137860. [Google Scholar]
15. Kravits, M., Frear, R., Bordwell, D. (2011). Analysis of plunger lift applications in the marcellus shale. SPE Annual Technical Conference and Exhibition, Denver, Colorado, USA. SPE147225. [Google Scholar]
16. Nascimento, C. M., Becze, A., Virues, C. J., Wang, A. (2015). Using dynamic simulations to optimize the start-up of horizontal wells and evaluate plunger lift capability: Horn river shale gas trajectory-based case study. SPE Western Regional Meeting, Garden Grove, California, USA. SPE174053. [Google Scholar]
17. Nandola, N., Kaisare, N. S., Gupta, A. (2018). Online optimization for a plunger lift process in shale gas wells. Computers & Chemical Engineering, 108, 89–97. DOI 10.1016/j.compchemeng.2017.09.001. [Google Scholar] [CrossRef]
18. Zhao, Q., Zhu, J., Cao, G., Zhu, H., Zhang, H. (2021). Transient modeling of plunger lift for gas well deliquification. SPE Journal, 26(5), 1–20. DOI 10.2118/205386-PA. [Google Scholar] [CrossRef]
 | This work is licensed under a Creative Commons Attribution 4.0 International License, which permits unrestricted use, distribution, and reproduction in any medium, provided the original work is properly cited. |