| Fluid Dynamics & Materials Processing |
DOI: 10.32604/fdmp.2022.019888
ARTICLE
A Comprehensive Study on the Process of Greenhouse Gas Sequestration Based on a Microporous Media Model
State Key Laboratory of Offshore Oil Efficient Development, Beijing, 100028, China
CNOOC Research Institute Co., Ltd., Beijing, 100028, China
*Corresponding Author: Deqiang Wang. Email: 2017312038@student.cup.edu.cn
Received: 22 October 2021; Accepted: 05 December 2021
Abstract: Carbon dioxide geological sequestration is an effective method to reduce the content of greenhouse gases in the atmosphere of our planet. This process can also be used to improve the production of oil reservoirs by mixing carbon dioxide and crude oil. In the present study, a differential separation experiment (DL) based on actual crude oil components is used to simulate such a process. The results show that after mixing, the viscosity and density of reservoir fluid decrease and the volume coefficient increase, indicating that the pre buried gas induces fluid expansion and an improvement of the fluid rheological properties. These effects are interpreted using a pore scale model based on real scanning electron microscopy (SEM). The results show that increasing the pressure and reducing the viscosity are beneficial to increasing the micro oil displacement efficiency. Moreover, these effects can improve the production in the target area and slow down the decline of the formation pressure. Furthermore, in the case of fracture development in the reservoir (due to CO2 injection before exploitation), the risk of gas channelling, induced by the displacement pressure difference between injection and production wells, is avoided.
Keywords: Greenhouse gas; carbon sequestration; PVTi; porous media model; EDFM
Nomenclature
| EDFM | Embedded discrete fracture model |
| SEM | Scanning electron microscope |
| DL | Differential liberation experiment |
| o | Oil |
| w | Water |
| g | Gas |
| μo | Oil viscosity, cP |
| μw | Water viscosity, cP |
| a | The parameters calculated using van der Waals mixing rules |
| b | The parameters calculated using van der Waals mixing rules |
| Ki | Fugacity |
| xi | Mole fraction in the liquid phase |
| yi | Mole fraction in the vapor phase |
| zi | Mole fraction in the mixture as a whole |
| p | Pressure, MPa |
| φ | Porosity, dimensionless |
| ω | Eccentric factor |
| T | Temperature of the mixture, °C |
| V | Mole fraction of the vapor phase |
| L | Mole fraction of the liquid phase |
| Z | The compressibility of liquid and vapor phases |
The increase of greenhouse gas content has become the focus of environmental protection [1,2]. Carbon dioxide geological sequestration is an effective method to reduce the scope of greenhouse gases. To reduce carbon dioxide emissions and improve the final recovery efficiency of oil reservoirs, many scholars have carried out relevant research on the development of oil reservoirs by carbon dioxide injection [3].
In the experimental research on gas injection, enhanced oil recovery mechanisms are studied through core experiments. Experiments show that diffusion is an important mechanism of huff-n-puff in unconventional reservoir oil based on the history matching results. Swelling, oil viscosity reduction and repressurization are important mechanisms of conventional reservoirs. And the exposure time and the contact area need to be increased for higher production [4]. The continuous and cyclic injection are compared in the core-scale experiment, and the results showed that the cyclic injection could achieve a better effect [5]. Huff-n-puff experiments in core prove that CO2 has better injectivity and recovery than N2 [6]. Gamadi et al. [7] showed that a certain shut-in time should be maintained to allow the gas phase to contact the oil in place. Gamadi et al. [7] studied the effect of shut-in time on production through core experiments. The results showed that short shut-in time with several cycles led to higher oil recovery efficiency than using a long shut-in time with fewer cycles. Bai et al. [8] used fractured cores to evaluate the effect of fracture for residual oil distribution during CO2 huff-n-puff in the different permeability cores. And the results show that fracture can improve oil recovery by 14%. The matrix permeability affects the oil recovery for the cores without fracture, but the matrix permeability has little influence on the cores with fracture. The results mean that fractures are the dominant factor in core-scale experiments, and the impact of matrix permeability cannot be ignored. It can see that fractures have an important effect on oil production, and the influence of fracture and matrix permeability on gas injection at reservoir scale should be studied. Ma et al. [9] revealed that the oil recovery is sensitive to maximum pressure. The formation pressure should be kept as high as possible for low-pressure reservoirs through core experiments. Therefore, oil reservoirs with low formation pressure should maintain the formation pressure as much as possible.
In the numerical simulation research on gas injection [10,11], the four core experiments analyze the influencing factors after history matching and optimization. The results found that miscible CO2 huff-n-puff reaches the oil recovery factors about 63.0% [12]. Zuloaga compared the huff-n-puff and continuous injection for matrix ranging from 0.001 mD to 0.1 mD. In addition, the influence of matrix permeability, the number of wells, well pattern, fracture half-length were analyzed, and the matrix permeability was regarded as the most important influencing factor [13]. However, the initial reservoir pressure of the target block is 50 MPa in the literature. The relevant simulation research is insufficient for the reservoir with low initial formation pressure. Therefore, it is necessary to study low-pressure reservoirs by micro and macro simulations.
Several pilot applications about gas injection are reported in oil fields. The results show that gas huff-n-puff has good injectivity, but oil production after gas injection is limited due to gas channeling. The gas injection needs to be optimized [14]. Sheng [15] revealed that a single cycle’s longer soaking time could improve oil recovery. However, less shut-in time is better for multiple cycles. Different field applications show that more effective gas injection methods are necessary.
Most studies focus on reservoirs with high initial formation pressure. This paper analyzes the pre-buried greenhouse gas to improve the production of low-pressure reservoirs. Pre-buried greenhouse gas is that greenhouse gas is injected into the formation before production, and then crude oil, which is mixed with the greenhouse gas, products after shut-in. PVTi analyzes the changes in fluid properties by DL. Then, a pore-scale model is established to investigate the effects of viscosity decrease and pressure increase. An example of reservoir scale synthesis is established, and the effects of expansion, viscosity reduction, pressurization and fractures are analyzed. Pre-buried greenhouse gas is an effective measure to reduce greenhouse gases and enhance oil recovery.
Greenhouse gas is pre-buried to improve the production of low-pressure reservoirs. And carbon dioxide is injected into the formation before production, and carbon dioxide and crude oil are fully mixed during well shut-in. Then, crude oil, mixed with the greenhouse gas, products after shut-in. Pre-buried gas makes full use of carbon dioxide to improve crude oil properties, supplement formation elastic energy, and slow down production decline. Fig. 1a compares depleted development and pre-buried gas. Fig. 1b shows that the pre-buried gas is continuous with A-B-C, while the depletion development has only a C process. This method has the advantage of easy operation. Only one gas injection cycle is required in this way. Injecting gas before production can increase formation pressure. Reducing gas injection cycles can reduce the risk of gas channeling compared with multiple gas injection cycles.

Figure 1: Explanation of pre-gas injection (a) difference between pre-gas injection and depletion (b) the flow chart of pre-gas injection
Simulator PVTi is adopted to study the change of fluid properties with CO2. The principles and methods are as follows:
1. Principles
The properties of crude oil are affected by temperature, pressure and composition. PVTi of Eclipse 2011 version is adopted to calculate the property changes to study the fluid property changes after pre-buried gas. The computational principles are Eqs. (1) and (2). By changing the fluid’s temperature, pressure, and composition, the fluid properties under different temperature and pressure conditions are calculated [16,17]. The specific derivation process can be seen in Appendix A.
where, R is the universal gas constant, a and b are the parameters calculated using van der Waals mixing rules, Z is the compressibility of liquid and vapor phases, T is the temperature (°C), p is pressure (MPa).
2. Method
DL means that decreased pressure results in gas-liquid separation in a constant volume container, as shown in Fig. 2a. The pre-buried gas is described in 2.1, which injects gas into the reservoir before production, as shown in Figs. 2b–a and 2a–A. Then, the injection well is shut to fully mix the injected gas with the reservoir, as shown in Figs. 2b–b and 2a–B. Finally, the well produces the reservoir’s mixed fluid, as shown in Figs. 2b–C and Figs. 2a–c. Therefore, the properties of pre-buried gas can be studied by the reverse process of DL.

Figure 2: The explanation of DL (a) comparison between DL and pre-buried gas (b) corresponding process of pre-buried gas
The composition of a well in the target block is shown in Table 1. The composition of crude oil after adding different mole fractions of CO2 is written in Table 1 to determine the influence of different injected CO2 volumes on crude oil properties. Injecting greenhouse gas means that the mole fraction of greenhouse gas becomes higher, and then the related properties of crude oil are calculated by phase equilibrium equations.
3. Result
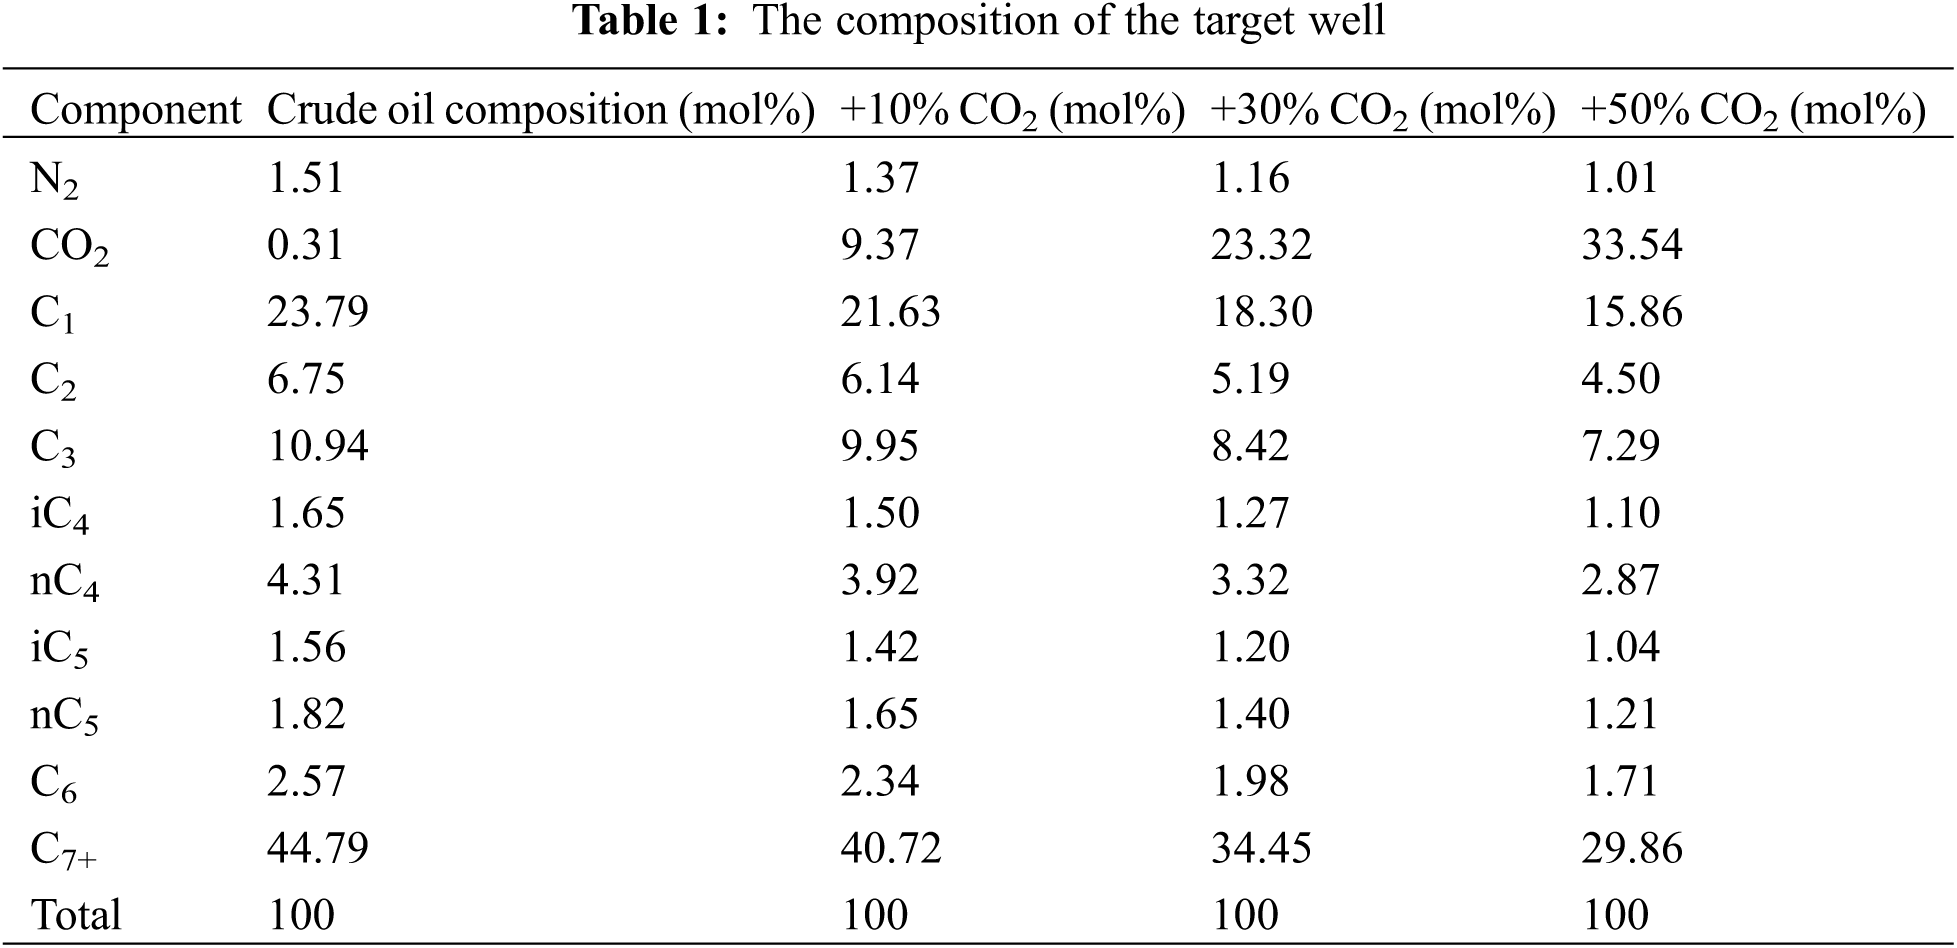
The mole weight, viscosity, interfacial tension have changed after different mole fractions of gas are injected. The curves of various properties with mole fractions are obtained in Fig. 3. The viscosity and mole weight decreased with the increase of gas injection volume in Figs. 3a and 3b. Therefore, the pre-buried gas has the effect of expansion and viscosity reduction. And the surface tension decreases gradually after gas injection in Fig. 3c, which leads to the increase of crude oil production and the decrease of residual oil saturation.

Figure 3: The properties of crude oil after injecting different mole fractions gas (a) Mole weight (b) Viscosity (c) Interfacial tension
By establishing a porous media model based on scanning electron microscope images, including onshore oil fields [18] and offshore oil fields [19], flow characteristics at different pressures are analyzed [20–22].
For the low original formation pressure of the target reservoir, the pre-buried gas can improve formation pressure. Therefore, fluid flow characteristics are compared under different pressure gradient (0.01 MPa/m, 0.05 MPa/m, 0.1 MPa/m). According to the velocity field diagram in Fig. 4, the flow area increased after pre-buried gas injection compared with the conventional reservoir, as shown in Figs. 4b, 4d, 4f. And the red area increased with the increase of pressure gradient. Therefore, increased pressure after pre-buried gas can expand the range affected by the gas.

Figure 4: Comparison of flow velocity at different pressure gradients (a) 0.01 MPa/m in onshore oil field (b) 0.01 MPa/m in offshore oil field (c) 0.05 MPa/m in onshore oil field (d) 0.05 MPa/m in offshore oil field (e) 0.1 MPa/m in onshore oil field (f) 0.1 MPa/m in offshore oil field
It can be seen from 2.2.1 that the fluid viscosity decreases after gas injection. Therefore, the flow characteristics are compared with different viscosities. It can be seen from Fig. 5 that the red area becomes larger after the viscosities are reduced for conventional and offshore oil fields, which means that the flowing area becomes larger.

Figure 5: Comparison of flow velocity at different viscosities (a) 1 mPa.s in onshore oil field (b) 1 mPa.s in offshore oil field (c) 2 mPa.s in onshore oil field (d) 2 mPa.s in offshore oil field (e) 3 mPa.s in onshore oil field (f) 3 mPa.s in offshore oil field
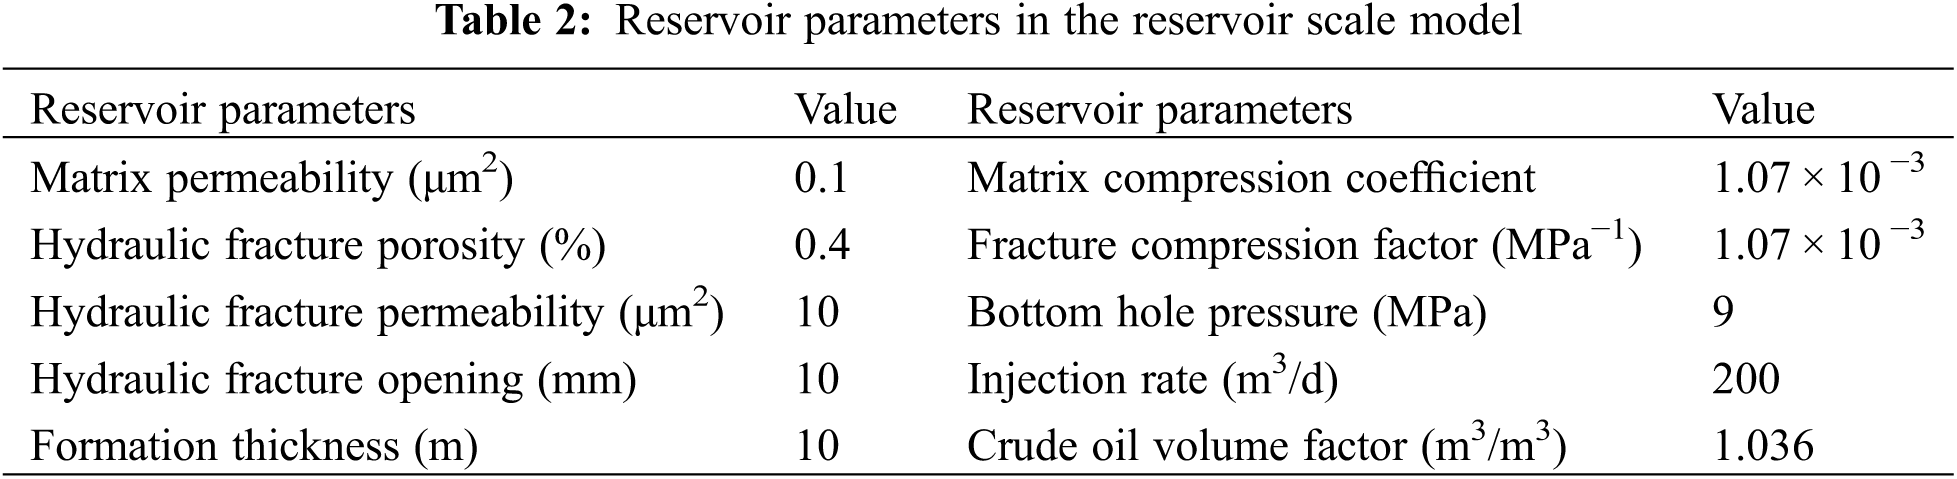
A reservoir scale model of 500 m * 600 m * 10 m is built to better investigate the effect of pre-buried gas. And Eclipse.2011 is adopted to simulate and analyze the expansion, viscosity reduction, and increasing pressure. The model parameters are shown in the following Table 2.
Expansion is an important mechanism of enhancing oil recovery by gas injection [23,24]. Using PVTi to compute the fluid properties change, volume factor increased after pre-buried gas. The expansion effect is analyzed by volume coefficient after injecting different mole fractions of gas (10%, 20%, 50%), as shown in Fig. 6. The increasing injected gas results in an increased volume factor. Compared to the cumulative oil production under different volume factors in Fig. 6, expansion is beneficial to increasing production.

Figure 6: Comparison of the cumulative oil production of depletion and pre-buried gas with expansion
Viscosity reduction also is an important mechanism to enhance oil recovery by gas injection [13]. Viscosity reduced after pre-gas injection. The viscosity reduction effect is analyzed by the different viscosities after pre-buried gas with varying mole fractions of gas (10%, 20%, 50%), as shown in Fig. 7. The increasing injection gas results in decreased viscosity. Compared to the cumulative oil production under different viscosity in Fig. 7, viscosity reduction after pre-gas injection is beneficial for increasing production.

Figure 7: Comparison of the cumulative oil production from depletion and pre-buried gas with viscosity reduction
Initial formation pressure cannot change for specific blocks, but pre-buried gas can raise formation pressure to slow down low-pressure characteristics’ diminishing effect. Therefore, the comparison of cumulative production between pre-buried gas injection and depletion is shown in Fig. 8. It can be seen that the cumulative production is increased for pre-buried gas due to injection time increased. The reason is that the formation pressure rises after pre-buried gas, as shown in Figs. 9 and 10. The longer injection time leads to a larger injected gas volume, and the gas injection effectively slows down the formation pressure attenuation.
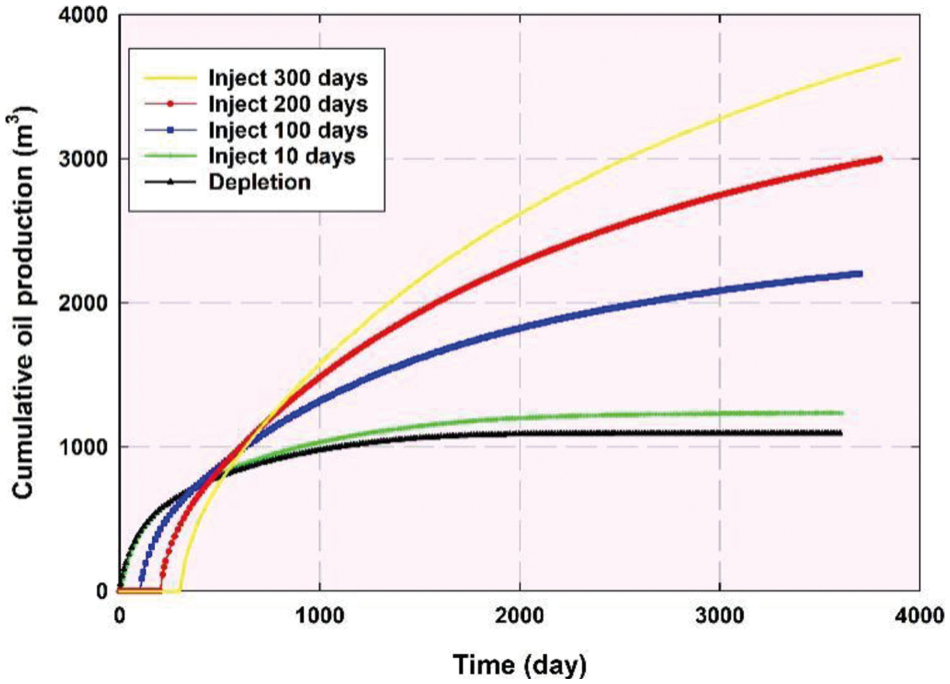
Figure 8: Comparison of cumulative production of depletion and pre-buried gas

Figure 9: Comparison of formation pressure of depletion and pre-buried gas

Figure 10: The comparison of formation pressure field diagram of depletion and pre-buried gas (a) Well pattern diagram (b) Depletion (c) Inject 10 days (d) Inject 100 days (e) Inject 200 days (f) Inject 300 days
Gas storage efficiency is an important standard [25]. The cumulative gas production is compared between conventional production and pre-buried gas in Fig. 11. There is almost no difference in gas production between the two schemes, proving that the injected gas is buried in the formation and not produced. The gas injection is far from the production well, leading to no gas channeling and the buried efficiency is close to 100%.

Figure 11: Comparison between conventional production and pre-buried gas
The existence of fractures greatly affects the effect of pre-buried gas. It is necessary to evaluate the effect of pre-buried gas in the presence of fractures. Generally speaking, natural fractures are easy to cause gas channeling. Still, there is no well opening in the process of pre-buried gas, which reduces the risk of gas channeling. At the same time, the existence of fractures in the formation is conducive to wider pressure propagation. To better describe the fractures distributed in different directions, the EDFM model is adopted in this paper [26,27]. See Appendix B for its control equation and calculation principle.
Fig. 12 shows three types of fracture networks: hydraulic fractures, fractures around injection wells, and fractures between production and injection wells. Fig. 12a shows the pressure drop near the fracture after production. Without energy supplement, the formation pressure decreases continuously after production. Fig. 12b shows the presence of fractures around the injection well. Fractures expand the influence range of injection wells due to no well opening, no production, and no gas breakthrough. Fig. 12c shows the pressure field with fractures between injection and production wells. Due to the gas injection before production, the relationship between the injection well and production well has not been established. There is no gas channeling, and the fracture expands the gas sweep area. When the production well is opened, the formation pressure has been improved, as shown in Fig. 12c, to increase production further.

Figure 12: Pressure field diagram before production (a) only hydraulic fracture using depletion (b) fractures near the injection well using pre-buried gas (c) fractures between the injection well and horizontal well using pre-buried gas
Pre-buried carbon dioxide is an effective method for carbon sequestration and enhanced oil recovery. This paper uses PVTi to study the changes in crude oil properties after pre-buried gas. The pore model evaluates the flow characteristics. The reservoir scale model studies the effects of expansion, viscosity reduction, and pressurization.
1. The changes of crude oil properties after pre-buried gas are simulated based on the DL. The results show that the crude oil viscosity decreases, and the volume coefficient increases. The crude oil expands and reduces viscosity after pre-buried gas.
2. The pore-scale seepage model is constructed to compare the micro sweep efficiency under different reservoir conditions. The results show that the high-pressure gradient and low viscosity formed after pre-buried gas improve the pore-scale range affected by the gas.
3. Comparing the gas channeling risks under different reservoir conditions shows that the pre-buried gas uses the fractures in the reservoir to expand the macro gas sweep range, reduce the crude oil viscosity, increase the pressure gradient, and effectively improve the crude oil production.
4. Pre-buried gas can improve the efficiency of gas sequestration. In this paper, the gas injection is far from the production well, leading to no gas channeling and the sequestration efficiency is close to 100%.
Funding Statement: Thanks for the support of a major national special project during the 13th Five-Year Plan period, “Chemical Flooding Technology for Offshore Oil Fields” (No. 2016ZX05025-003) and “Heavy Oil Chemical Flooding Mechanism and Simulation Technology Research” (No. 2019-YXKJ-008), Research on Source Sink Matching Technology and Scheme of Regional CCUs Project (2021-ZYZL-XNY-01), etc.
Conflicts of Interest: The authors declare that they have no conflicts of interest to report regarding the present study.
1. Rosa, E. A., Dietz, T. (2012). Human drivers of national greenhouse-gas emissions. Nature Climate Change, 2(8), 581–586. DOI 10.1038/nclimate1506. [Google Scholar] [CrossRef]
2. Boswell, M. R., Greve, A. I., Seale, T. L. (2010). An assessment of the link between greenhouse gas emissions inventories and climate action plans. Journal of the American Planning Association, 76(4), 451–462. DOI 10.1080/01944363.2010.503313. [Google Scholar] [CrossRef]
3. Al-Hassani, K. A., Alam, M. S., Rahman, M. M. (2021). Numerical simulations of hydromagnetic mixed convection flow of nanofluids inside a triangular cavity on the basis of a Two-component nonhomogeneous mathematical model. Fluid Dynamics & Materials Processing, 17(1), 1–20. DOI 10.32604/fdmp.2021.013497. [Google Scholar] [CrossRef]
4. Alfarge, D., Wei, M., Bai, B. (2018). CO2-EOR mechanisms in huff-n-puff operations in shale oil reservoirs based on history matching results. Fuel, 226, 112–120. DOI 10.1016/j.fuel.2018.04.012. [Google Scholar] [CrossRef]
5. Yu, Y., Li, L., Sheng, J. J. (2017). A comparative experimental study of gas injection in shale plugs by flooding and huff-n-puff processes. Journal of Natural Gas Science and Engineering, 38, 195–202. DOI 10.1016/j.jngse.2016.12.040. [Google Scholar] [CrossRef]
6. Li, L., Su, Y., Hao, Y., Zhan, S., Lv, Y. et al. (2019). A comparative study of CO2 and N2 huff-n-puff EOR performance in shale oil production. Journal of Petroleum Science and Engineering, 181, 106–124. DOI 10.1016/j.petrol.2019.06.038. [Google Scholar] [CrossRef]
7. Gamadi, T. D., Sheng, J. J., Soliman, M. Y., Menouar, H., Watson, M. C., Emadibaladehi, H. (2014). An experimental study of cyclic CO2 injection to improve shale oil recovery. SPE Improved oil Recovery Symposium. SPE Annual Technical Conference and Exhibition, New Orleans, Louisiana, USA. DOI 10.2118/166334-MS. [Google Scholar] [CrossRef]
8. Bai, H., Zhang, Q., Li, Z., Li, B., Zhu, D. et al. (2019). Effect of fracture on production characteristics and oil distribution during CO2 huff-n-puff under tight and low-permeability conditions. Fuel, 246, 117–125. DOI 10.1016/j.fuel.2019.02.107. [Google Scholar] [CrossRef]
9. Ma, J., Wang, X., Gao, R., Zeng, F., Huang, C. et al. (2015). Enhanced light oil recovery from tight formations through CO2 huff-n-puff processes. Fuel, 154, 35–44. DOI 10.1016/j.fuel.2015.03.029. [Google Scholar] [CrossRef]
10. Redchyts, D. O., Shkvar, E. A., Moiseienko, S. V. (2020). Computational simulation of turbulent flow around tractor-trailers. Fluid Dynamics & Materials Processing, 15(4), 91–103. DOI 10.32604/fdmp.2020.07933. [Google Scholar] [CrossRef]
11. Basri, A. A., Zuber, M., Basri, E. I., Zakaria, M. S., Aziz, A. F. A. et al. (2021). Fluid-structure interaction in problems of patient specific transcatheter aortic valve implantation with and without paravalvular leakage complication. Fluid Dynamics & Materials Processing, 17(3), 531–553. DOI 10.32604/fdmp.2021.010925. [Google Scholar] [CrossRef]
12. Song, C., Yang, D. (2017). Experimental and numerical evaluation of CO2 huff-n-puff processes in bakken formation. Fuel, 190, 145–162. DOI 10.1016/j.fuel.2016.11.041. [Google Scholar] [CrossRef]
13. Zuloaga, P., Yu, W., Miao, J., Sepehrnoori, K. (2017). Performance evaluation of CO2 huff-n-puff and continuous CO2 injection in tight oil reservoirs. Energy, 134, 181–192. DOI 10.1016/j.energy.2017.06.028. [Google Scholar] [CrossRef]
14. Todd, H. B., Evans, J. G. (2016). Improved oil recovery IOR pilot projects in the bakken formation. SPE Low Perm Symposium, Denver, Colorado, USA. DOI 10.2118/180270-MS. [Google Scholar] [CrossRef]
15. Sheng, J. J. (2017). Critical review of field EOR projects in shale and tight reservoirs. Journal of Petroleum Science and Engineering, 159, 654–665. DOI 10.1016/j.petrol.2017.09.022. [Google Scholar] [CrossRef]
16. Zhang, Y., Yu, W., Sepehrnoori, K., Di, Y. (2017). A comprehensive numerical model for simulating fluid transport in nanopores. Scientific Reports, 7(1), 1–11. DOI 10.1038/srep40507. [Google Scholar] [CrossRef]
17. Zhang, Y., Yu, W., Li, Z., Sepehrnoori, K. (2018). Simulation study of factors affecting CO2 huff-n-puff process in tight oil reservoirs. Journal of Petroleum Science and Engineering, 163, 264–269. DOI 10.1016/j.petrol.2017.12.075. [Google Scholar] [CrossRef]
18. Zhu, G., Yao, J., Zhang, L., Sun, H., Li, A. et al. (2017). Pore-scale investigation of residual oil distributions and formation mechanisms at the extra-high water-cut stage. Chinese Science Bulletin, 62, 2553–2563. DOI 10.1360/N972017-00392. [Google Scholar] [CrossRef]
19. Chun, L., Zhang, R., Zhang, H., Junpeng, W., Tao, M. et al. (2017). Genesis and reservoir significance of multi-scale natural fractures in kuqa foreland thrust belt, Tarim basin, NW China. Petroleum Exploration and Development, 44, 495–504. DOI 10.1016/S1876-3804(17)30057-5. [Google Scholar] [CrossRef]
20. Lopez, N., Galeos, S., Calderon, B., Dominguez, D., Uy, B. et al. (2021). Computational fluid dynamics simulation of indoor Air quality and thermal stratification of an underfloor Air distribution system (UFAD) with various vent layouts. Fluid Dynamics & Materials Processing, 17(2), 333–347. DOI 10.32604/fdmp.2021.011213. [Google Scholar] [CrossRef]
21. Kalaivanan, R., Ganesh, N. V., Al-Mdallal, Q. (2021). Buoyancy driven flow of a second-grade nanofluid flow taking into account the arrhenius activation energy and elastic deformation: Models and numerical results. Fluid Dynamics & Materials Processing, 17(2), 319–332. DOI 10.32604/fdmp.2021.012789. [Google Scholar] [CrossRef]
22. Al-Hassani, K., Alam, M. S., Rahman, M. M. (2021). Numerical simulations of hydromagnetic mixed convection flow of nanofluids inside a triangular cavity on the basis of a Two-component nonhomogeneous mathematical model. Fluid Dynamics & Materials Processing, 17(1), 1–20. DOI 10.32604/fdmp.2021.013497. [Google Scholar] [CrossRef]
23. Phukan, R., Saha, R. (2022). Low salinity surfactant alternating gas/CO2 flooding for enhanced oil recovery in sandstone reservoirs. Journal of Petroleum Science and Engineering, 212, 110–120. DOI 10.1016/j.petrol.2022.110253. [Google Scholar] [CrossRef]
24. Altawati, F., Emadi, H., Pathak, S. (2021). Improving oil recovery of eagle ford shale samples using cryogenic and cyclic gas injection methods–An experimental study. Fuel, 302, 121–170. DOI 10.1016/j.fuel.2021.121170. [Google Scholar] [CrossRef]
25. Misyura, S. Y., Donskoy, I. G. (2019). Ways to improve the efficiency of carbon dioxide utilization and gas hydrate storage at low temperatures. Journal of CO2 Utilization, 34, 313–324. DOI 10.1016/j.jcou.2019.07.010. [Google Scholar] [CrossRef]
26. Kuzmenkov, D., Struchalin, P., Litvintsova, Y., Delov, M., Skrytnyy, V. et al. (2022). Influence of particle size distribution on the optical properties of fine-dispersed suspensions. Fluid Dynamics & Materials Processing, 18(1), 1–14. DOI 10.32604/fdmp.2022.018526. [Google Scholar] [CrossRef]
27. Oxyzoglou, I., Xie, Z. (2020). Effects of heaving motion on the aerodynamic performance of a double-element wing in ground effect. Fluid Dynamics & Materials Processing, 16(6), 1093–1114. DOI 10.32604/fdmp.2020.012237. [Google Scholar] [CrossRef]
28. Torres, F., Xavier, M., Wang, H., Yu, W., Kong, X. et al. (2020). A new discrete fracture network calibration workflow using EDFM method. 54th US Rock Mechanics/Geomechanics Symposium. [Google Scholar]
29. Shakiba, M., de Araujo Cavalcante Filho, J. S., Sepehrnoori, K. (2018). Using embedded discrete fracture model (EDFM) in numerical simulation of complex hydraulic fracture networks calibrated by microseismic monitoring data. Journal of Natural Gas Science and Engineering, 55, 495–507. DOI 10.1016/j.jngse.2018.04.019. [Google Scholar] [CrossRef]
30. Leines Artieda, J. A. (2020). Discrete fracture network modeling and simulation using EDFM (Doctoral Dissertation). [Google Scholar]
It can be known from the law of conservation of matter [16,17]:
The molar fraction of each component in the liquid and gas phases is defined as
Pressure can be written about
where
A cubic expression can be obtained
where
EDFM is used to describe the fracture network [27,28]. And the control equation and calculation principle [29,30] is shown in Eqs. (11)–(13):
 | This work is licensed under a Creative Commons Attribution 4.0 International License, which permits unrestricted use, distribution, and reproduction in any medium, provided the original work is properly cited. |