| Fluid Dynamics & Materials Processing |
DOI: 10.32604/fdmp.2022.019018
ARTICLE
Study on the Influence of a Wake Vortex on an ARJ21 Aircraft Using the Strip Method
Civil Aviation Flight University of China, Guanghan, 618307, China
*Corresponding Author: Weijun Pan. Email: dljtwjk@163.com
Received: 29 August 2021; Accepted: 10 December 2021
Abstract: A model for the vortex distribution in the wake of an aircraft is elaborated to investigate the wake influence on the behaviour of other aircrafts potentially interacting with it. As a realistic case, the interaction of an ARJ21 aircraft with a (leading) A330-200 aircraft is considered. Different distances are considered, namely, 6 km, 7 km, 8 km, 9.3 km, and 10 km. Simulations based on the used wake dissipation mechanism are used to investigate different conditions, namely, the ARJ21 in take-off and level flight and the changes induced in the related lift by the front aircraft A330-200 during landing. The induced roll moment is also studied and analyzed by means of a strip method. As a result, the roll moment coefficient is determined to quantify the roll degree of the aircraft when it is influenced by the wake vortex. The results show the overall roll moment coefficient of the considered ARJ21 aircraft is less than 0.05, and the wing roll moment coefficient is less than 0.04. Such results are interpreted and discussed according to existing standards.
Keywords: Wake vortex dissipation; safety interval; induction velocity; roll torque; rolling moment coefficient
When air flows through the wing, the pressure on the lower wing surface will be greater compared to the upper surface since the upper surface velocity is greater. The resulting pressure difference enables the aircraft to generate lift; air flows from the high-pressure area to the low-pressure area–from the lower wing surface, around the wingtip, to the upper surface. Thus, two relatively rotating vortex pairs, with the wingtip as the center, are formed. Those are known as wingtip vortices. When the following aircraft enters the downwash speed field formed by the front-tail vortex field, it will roll, pitch, stall, and lose altitude, seriously affecting air operation safety. In more severe cases, it may even cause safety issues and casualties; therefore, to prevent the wake from causing dangerous events, ICAO (International Civil Aviation Organization) formulated safety separation standards. However, with the increase in the number of flights and the development of new technologies and airport capacities, the airspace is becoming increasingly crowded. Further, the traditional wake interval will cause airport congestion and waste airspace. Therefore, shortening the wake interval is of great significance when aiming to increase the airport and airspace capacities. Finally, regarding the wake reduction technology, it is necessary to quantify the indicators that the aircraft is affected by the front aircraft, which then can be evaluated, ensuring aircraft safety.
ARJ21 is a new type of medium- and short-range turbofan regional jet. It adopts tail-hoisted twin engines, a T-type flat tail, and a single-wing layout [1]. The aerodynamic force and torque it is subjected to are different from those encountered in traditional passenger aircraft. Hence, there is a lack of studies on the ARJ21 response when encountering the front wake vortex. As a result, said aircraft lacks the associated risk assessment, thus requiring a large wake interval with the preceding aircraft, greatly limiting the airport take-off and landing capacity, as well as its operational efficiency.
Crow et al. [2] proposed the Crow long-wave instability theory, allowing Greene [3] to establish the first wake vortex intensity dissipation model–Greene dissipation model. Separately, evolution mechanisms of the separation vortex based on the detection data were proposed–APA, TDAWP, D2P, P2P, and three-stage dissipation model [4–6], and used to establish the wake safety interval. Gerben [7] analyzed the severity rating of more than 700 wake encounters in horizontal flight and recent approach scenarios. The flight data was analyzed and the dimensionless rolling moment coefficient was used to measure the wake encounter severity. Finally, the authors have proposed a quantitative risk level evaluation. In terms of the wake vortex encounter safety assessment, Carsten et al. [8] applied the aerodynamic response model to evaluate the severity of aircraft encounters. Further, Campos proposed a torque model for simulating the aircraft roll condition under the influence of the wake vortex. The maximum roll angular velocity was used as the index for risk assessment [9]. Visscher proposed the induced moment coefficient to be used as a measurement index for evaluating the severity of the aircraft state after encountering the wake vortex [10]. Wang et al. [11] carried out a numerical simulation study on the wake vortex of A330-200 aircraft during the approach stage, finding that the crosswind could accelerate the wake vortex dissipation, shortening the wake interval.
Li et al. [12] studied the effect of icing on the helicopter wake dynamics; the rotor aerodynamic performance was significantly reduced when the ice accumulation occurred. Han [13] considered the influence of aircraft roll moment, roll angular acceleration, and maximum roll angle on the aircraft control quality. A calculation model for determining the aircraft disturbance parameters was established, and the acceptable slope angles and aircraft safety intervals were calculated. Moreover, Gu [14] established a multi-objective optimization evaluation model based on the induced rolling moment coefficient and drag coefficient. The formation flight safety and induced drag reduction effect were optimized, and the optimal formation position of the following aircraft relative to the front aircraft was determined. Pan et al. [15] optimized the wake interval under crosswind conditions, establishing an optimization model in the paired approach mode by considering the lateral dispersion, wake consumption, and the wake vortex strength the following aircraft can withstand. Further, Wei et al. [16] established the dissipation models of near and far vortices. Simulation calculations on the wake vortex flow field induced by the front plane were performed, providing a reference for the safe separation of the airport terminal area. Finally, Pan et al. [17] developed the force model for the following aircraft, shortening the wake interval based on the existing standard and thus providing a theoretical basis for the dynamic wake interval.
Currently, studies on the following aircraft response mainly consider the effect of lift changes on the wing force. As such, the impact of changes in the tail force, fuselage, and engine on the aircraft controllability and safety was not considered. At present, the wake interval of this new aircraft was not quantified. For this reason, the impact of the force changes on different aircraft parts was considered, verifying the current wake safety interval standards during the takeoff, level flight, and landing phases of ARJ21 following the A330-200. As a result, the wake safety interval was shortened.
2 Wake Formation and Dissipation Model
2.1 Wake Circulation and Velocity Induction Model
During the airplane flight, a pair of counter-rotating cylindrical vortices known as wake vortices are formed. According to the Kutta-Joukowsky law, the wake vortex strength is generally expressed by the amount of circulation [18]:
where
where
Aiming to calculate the induced wake vortex flow field velocity at a certain point, the Burnham-Hallock model was used as it is currently the most widely used wake vortex velocity induction model:
where
In this paper, the influence of the dual vortex model on the following aircraft was studied. Thus, a cross-section perpendicular to the wake field was selected, and the centerline midpoint of both vortex cores was used as the coordinate system origin; the vortex core lines were selected as X-axes. The zone speed direction was the positive direction. The positive half-axis speed of the Y-axis was positive, corresponding to the induced speed in the wake upwash zone. The negative half-axis speed of the Y-axis was negative, and inducing speed in the wake downwash zone.
The induced wake vortex velocity was usually determined by the amount of wake vortex circulation. Fig. 1 shows the relationship between the tangential wake vortex velocity and distance for different circulation values.
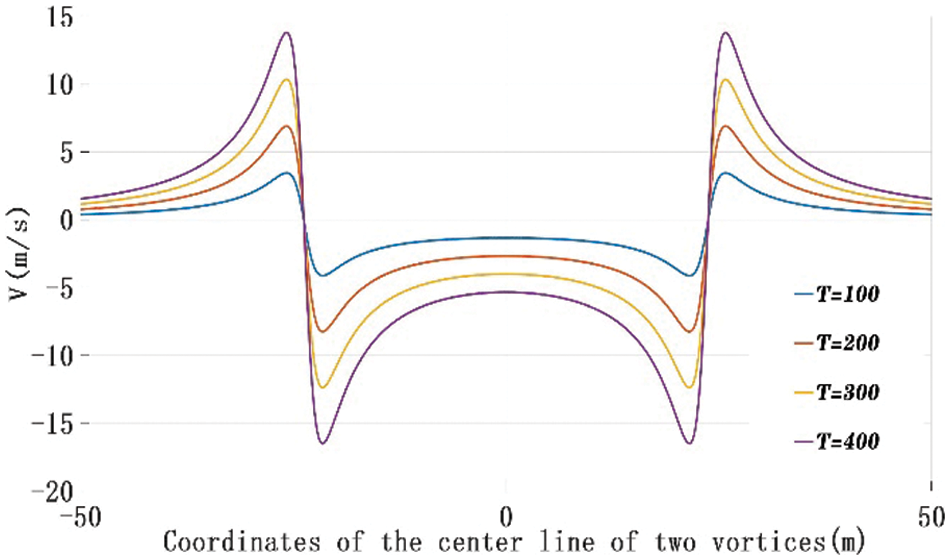
Figure 1: Tangential velocities of wake vortices at different positions
2.2 Wake Vortex Dissipation Model
Once the wake vortex field is formed, it will pass through two stages: the diffusion stage and the rapid decay stage. In the former, the wake vortex is a near-field vortex and its range is approx. six wingspans behind the airplane, which is known as the wake-up zone (starting zone). At this stage, the wake vortex strength decays slowly. Based on the lidar observation data analyses, the wake vortex strength dissipation at this stage is about 10% [19]. The approximate near vortex dissipation model can be used to describe this process [16]:
where
According to the Crow long-wave instability theory, the wake vortex intensity dissipation is caused by the mutual inducement between the initial and wake vortices of the left and right wing, which have equal intensities. This, in turn, causes the connection of the two vortices in the diffusion motion, re-forming the flow field. After the connection, the intensity decreases rapidly, and the unstable fluctuation caused by the atmospheric turbulence (at a certain scale) in the longitudinal distance of the vortex accelerates the formation of the connection dissipation.
In the rapid decay stage, the wake vortex is a far-field vortex. Hence, under the action of air viscous force, atmospheric buoyancy, and gravity, the two counter-rotating wake vortices cause each other to sink. The wake vortex strength decreases sharply, and the wake strength can be regarded as an exponential proportional relationship between the far vortex dissipation time and the near vortex duration. The wake intensity can be obtained as [19]:
where
The wake vortex dissipation schematic diagram for different buoyancy frequencies is shown in Fig. 2. In the diffusion stage (
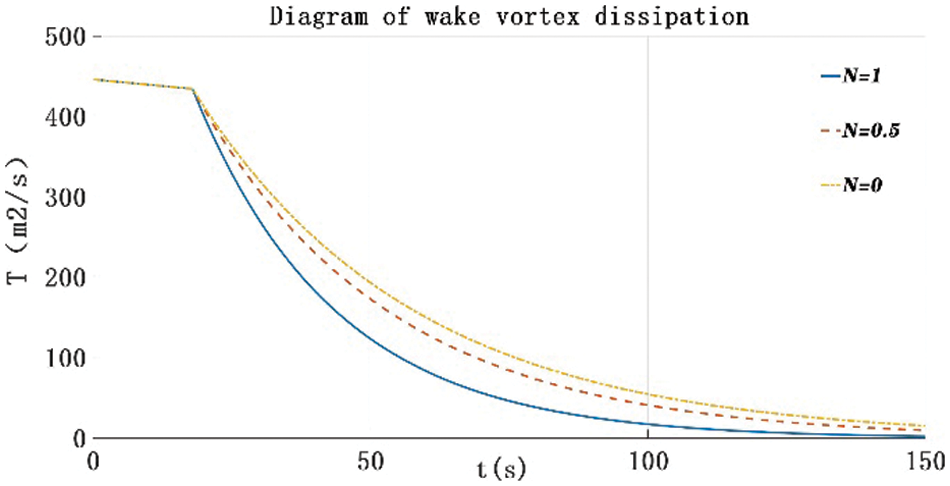
Figure 2: Wake vortex dissipation under different buoyancy frequencies
3 The Force Response Model of the Following Aircraft
3.1 The Way the Aircraft Enters the Front and Tail Vortex Field
There are three ways for the following airplane to enter the induced velocity field formed by the leading airplane wake vortex. The first is to laterally cross the entire flow field, the second is to longitudinally enter the downwash velocity field between the vortices, and the third is to longitudinally enter the center of the single vortex. All three ways are shown in Fig. 3.
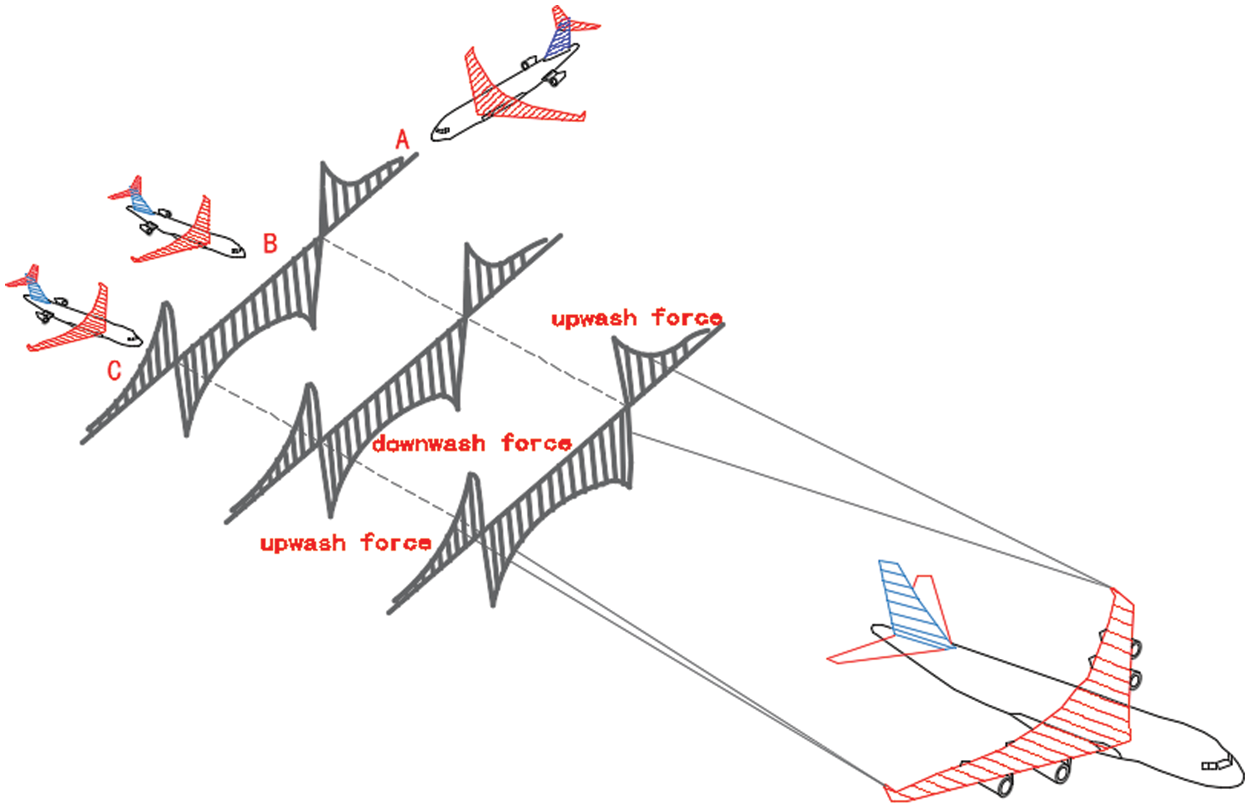
Figure 3: The ways the following aircraft can enter the front and tail vortex field
When the aircraft laterally crosses the wake vortex field, a pitching moment will be generated, and the aircraft will firstly rise, which will be followed by a descend and then rise. This will cause large turbulence and damage to the body structure, threatening flight safety. Further, when the aircraft longitudinally enters the mid-wake field of two vortexes (airplane B), its fuselage will be affected by the downwashing wake vortex field force. The aircraft will drop in altitude for a short time.
During the final approach, the aircraft altitude will be relatively low. In severe cases, the aircraft may require re-landing and cause safety accidents. At the same time, due to the difference in forces acting on the left and right wing, the aircraft will be subjected to a rolling moment. The moment will, in turn, cause a roll over of different degrees, causing safety hazards when the aircraft enters the center of a single vortex core (right vortex center) longitudinally (see aircraft C). The left wing side will be subjected to downwash force, while the right side will be subjected to an upwash force, rolling the plane counterclockwise. The roll moment generated by the airplane will be the largest, meaning that this way of entering the wake vortex is the most dangerous.
This article aims to evaluate the feasibility of the safety interval and shorten it. Thus, only the second and third entry methods were studied – the lateral crossing of the wake vortex field was not considered.
3.2 Calculation Model of Induced Rolling Moment
When the airplane enters the induced velocity field formed by the front tail vortex field, its lift will change. The variation of additional lift force acting on the wing and tail caused by the wake vortex field can be expressed as:
where
where
where
For the commonly used swept-wing aircraft, the wing or tail section wing chord length can be approximated as [22]:
where
In this paper, the strip method was used to calculate the aircraft rolling moment. The strip method is based on the idea of integration to calculate the torque; it thus divides the aircraft wing and tail into countless strips. Torque is calculated for each strip, which is followed by the integration over the entire wing and tail. The result is the total torque acting on the wing and tail. The strip model of the wing and tail is shown in Fig. 4a.
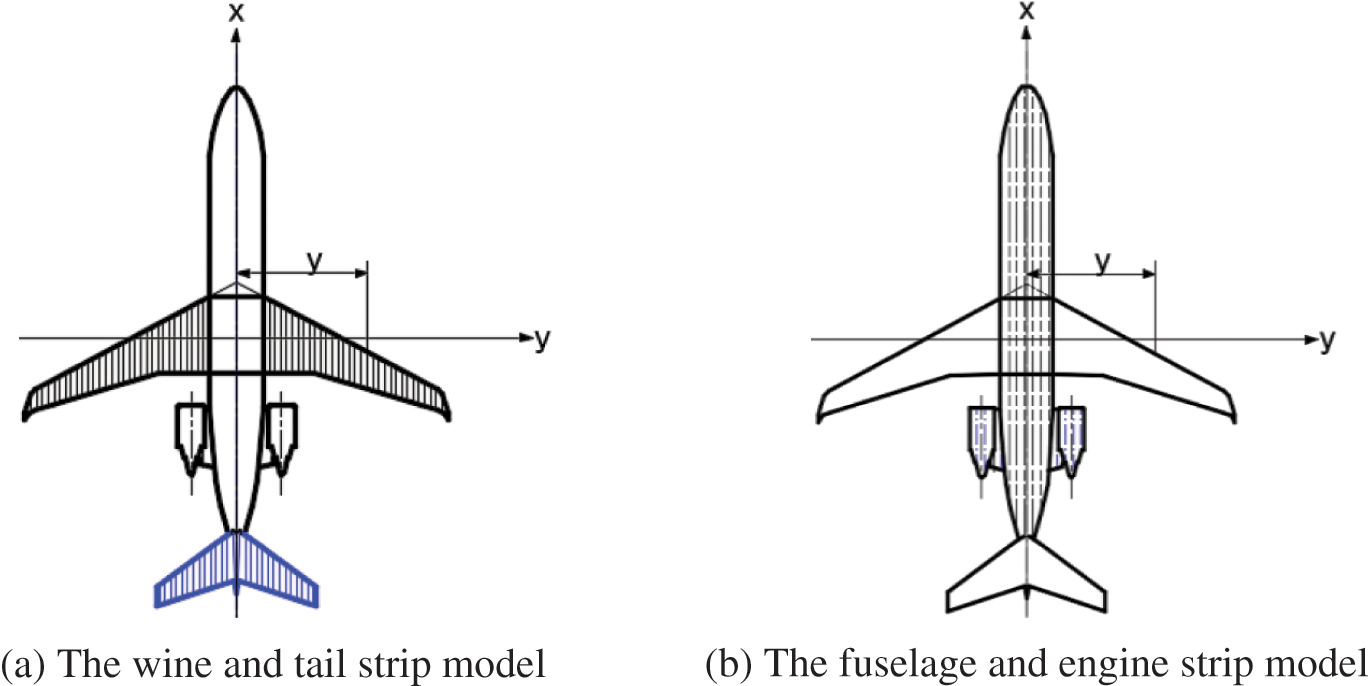
Figure 4: Strip model diagram
The moment is calculated as the force multiplied by the moment arm; therefore, the rolling moment generated by the wake on the wing or tail is:
where
By substituting Eqs. (8) and (9) into Eq. (12), the roll moment of the wing or tail induced by the wake of the front aircraft can be obtained:
After substituting Eqs. (10), (11), and (13) into Eq. (14), the induced rolling moment coefficient RMC can be further derived as:
Besides the wings and tail, changes in lift and roll moments are also generated by the fuselage and engine, affecting the aircraft maneuverability. The engine and fuselage can be simplified using the strip method, as shown in Fig. 4b.
According to the vortex plate numerical method, the lift variation, roll moment, and engine roll moment coefficient can be found using the following expression [23]:
where
The fuselage can be regarded as a slender cylinder with a small angle of attack. According to the slender spin linearization theory, its lift change can be expressed as [24]:
where
where
where
As noted earlier, the ARJ21 is assumed to follow A330-200 to study the changes in a lift, roll moment, and roll moment coefficient at various intervals during different flight stages. The atmospheric buoyancy frequency was taken as 0.5, and the front aircraft wake vortex was initialized. The parameters are shown in Table 1.
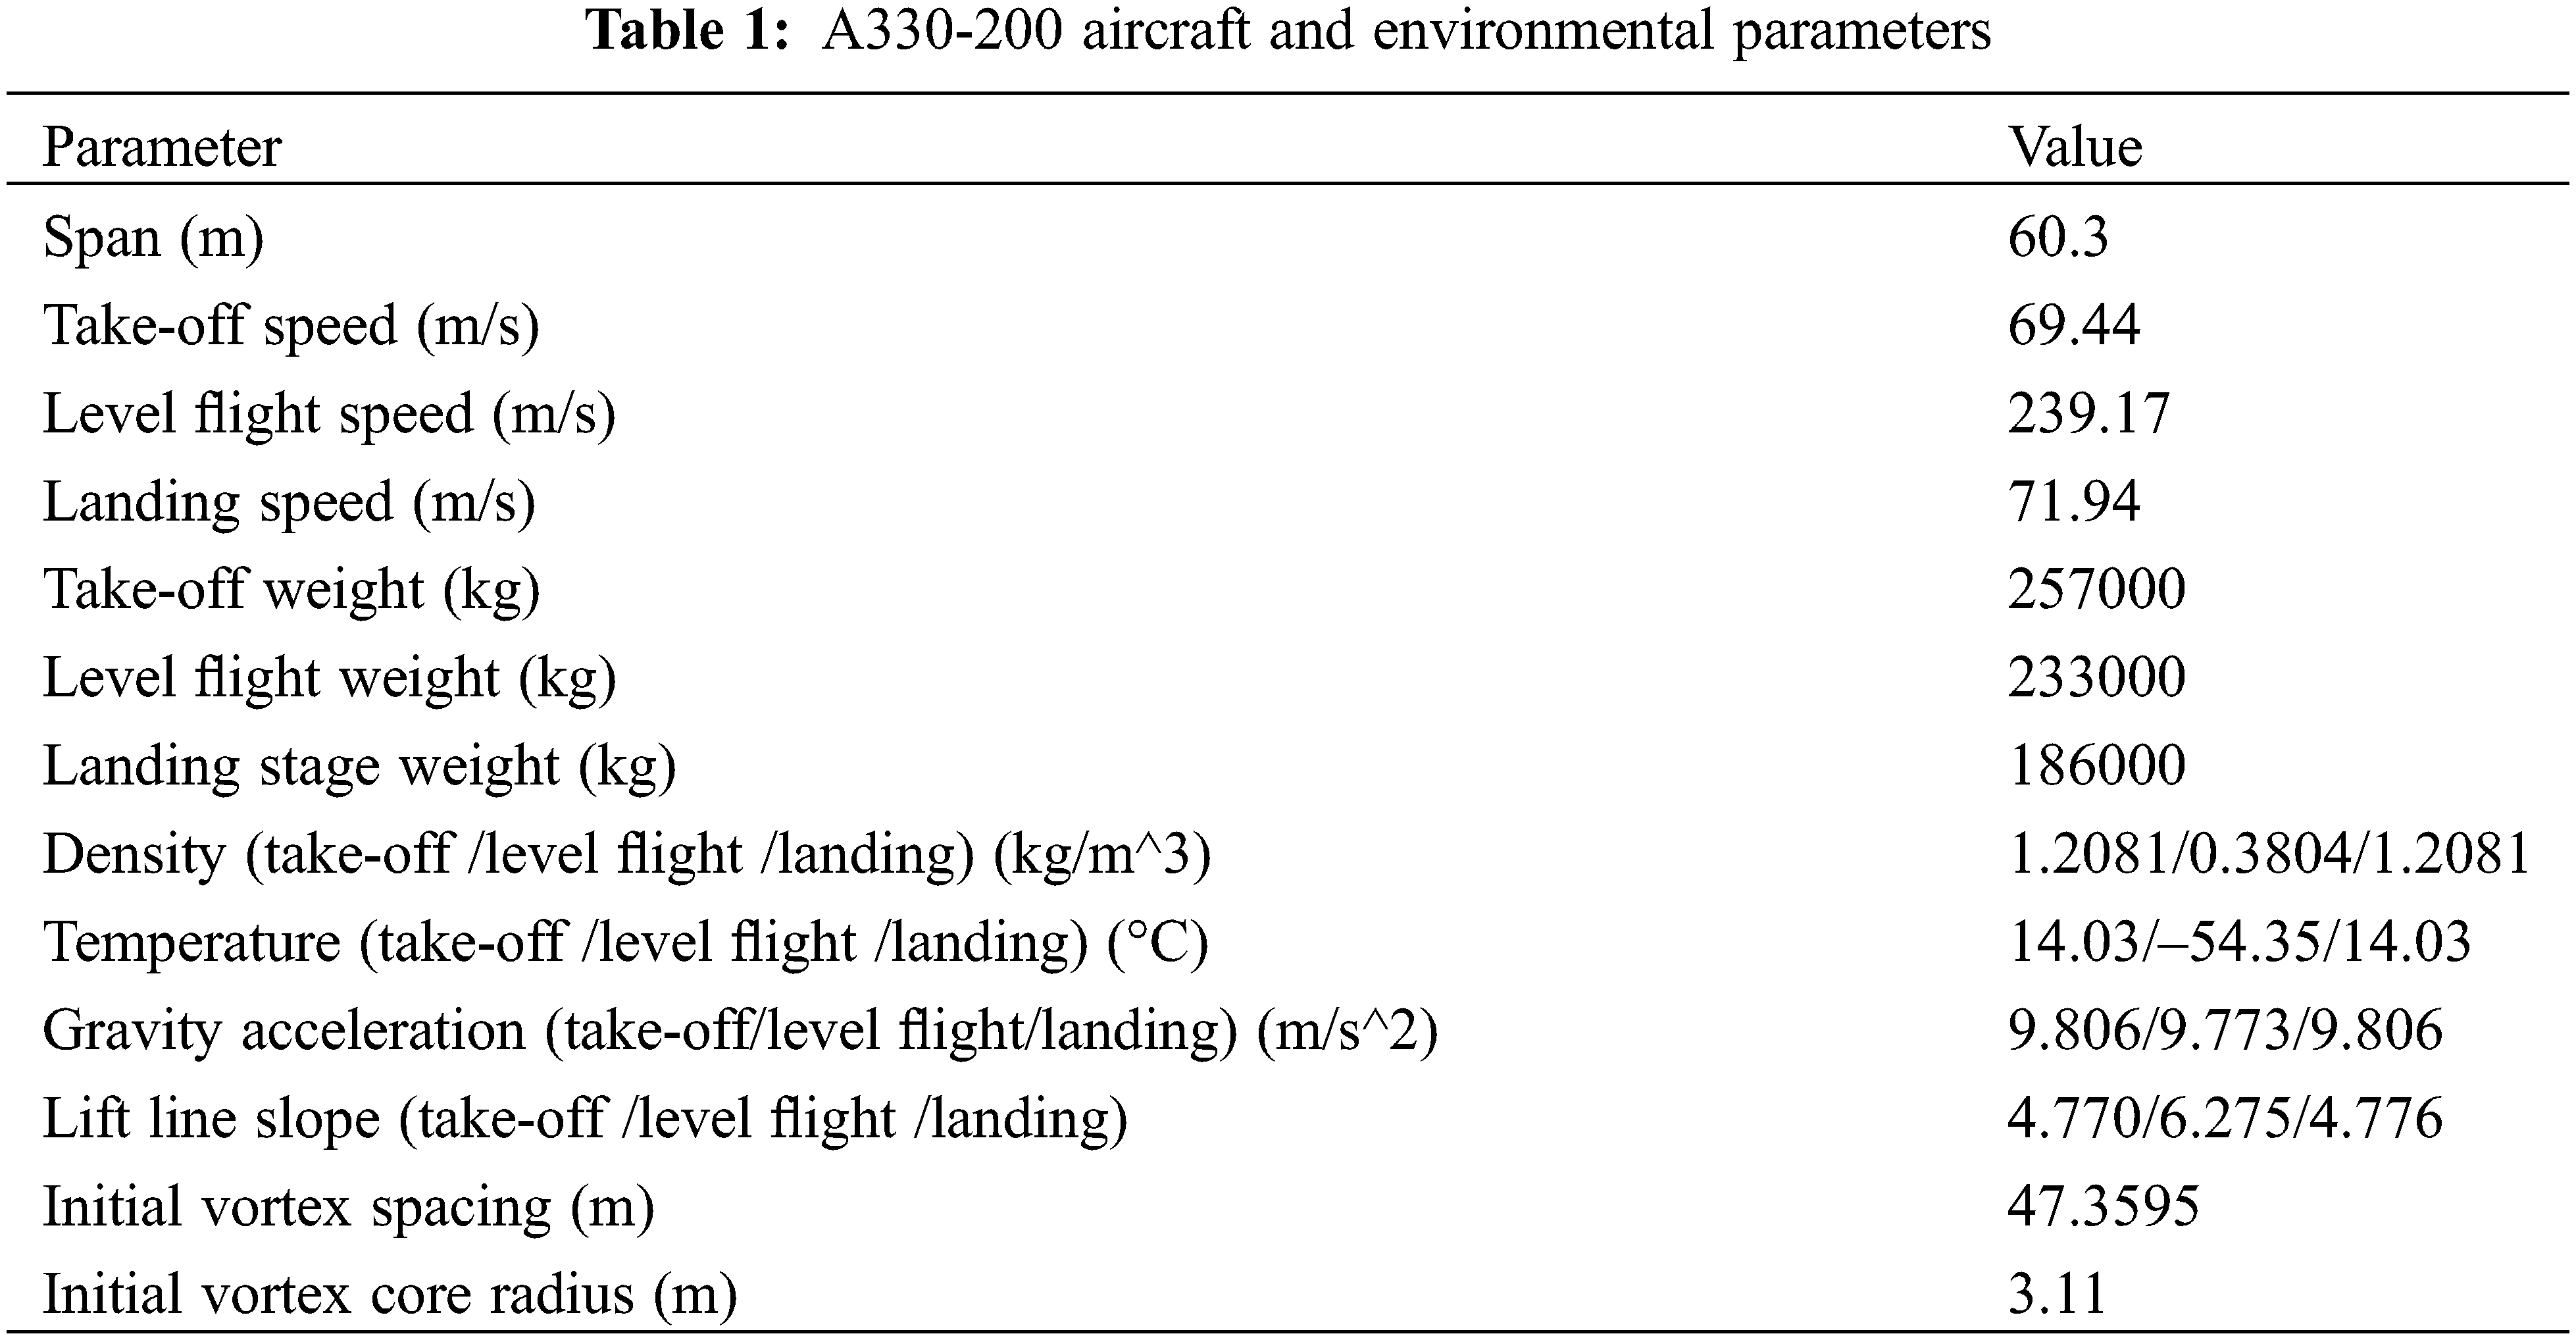
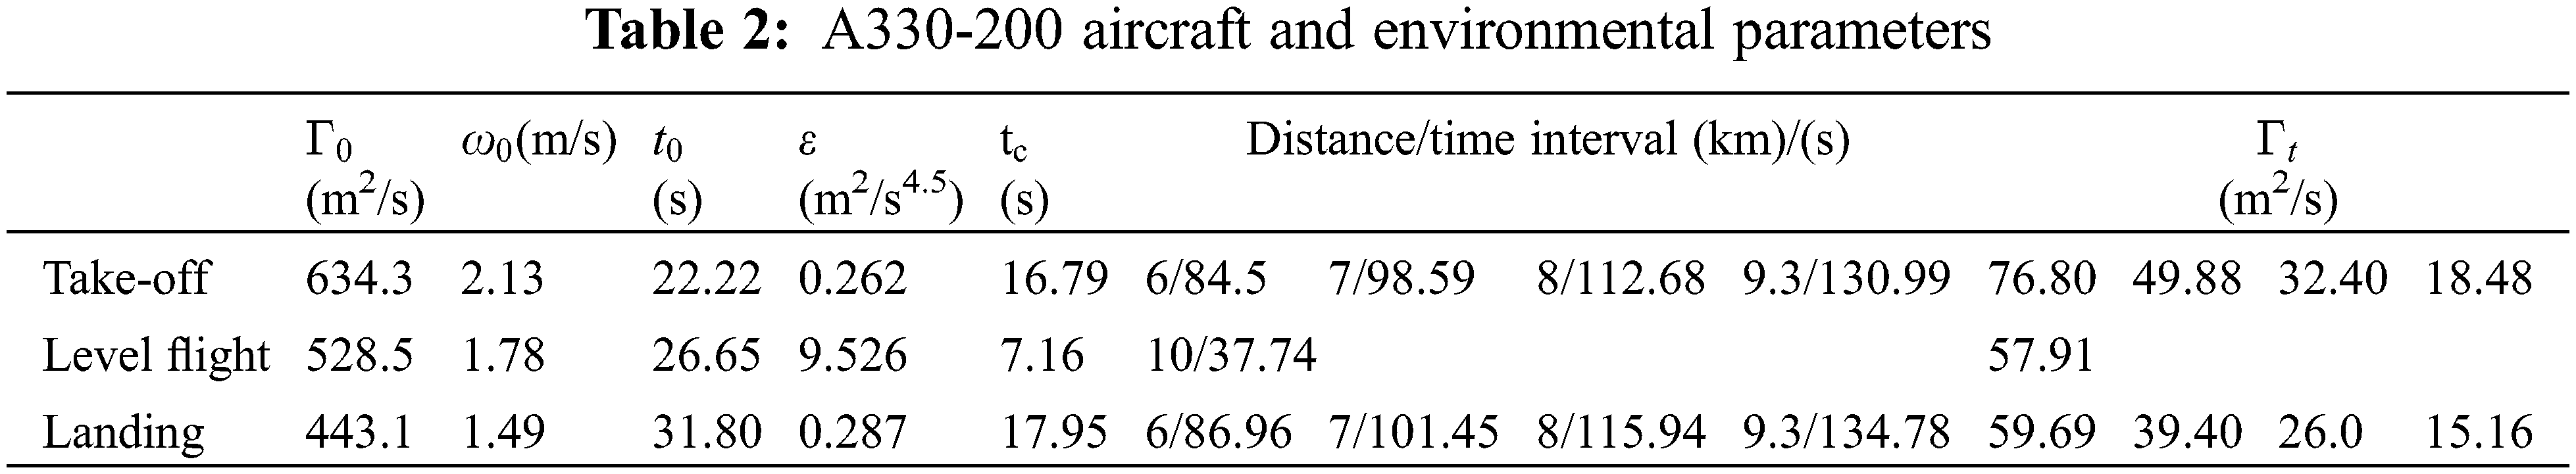
Table 2 shows the wake vortex circulation calculation results when ARJ21 encounters wake at different intervals during the take-off, horizontal flight, and landing phases. Since the ARJ21, a medium-sized aircraft, follows the A330-200 which is a heavy-duty aircraft, the safety wake interval standard stipulated by ICAO in the near-earth phase is 9.3 km. Thus, the interval step was 1 km, resulting in 6 km, 7 km, 8 km, and 9.3 km intervals. For the level flight, the safety interval was 10 km.
The above-presented separation distances were used to explore changes in the lift, roll moment, and roll moment coefficients of different parts of the aircraft passing through the vortex flow field. Multiple positions between the two vortexes of the front airplane during the take-off, level flight, and landing were considered. The results for lift changes are shown in Fig. 5. The authors assumed that upward is the positive direction, the midpoint of the line between the two vortex cores was taken as the origin coordinate, and the X-axis coordinate shows the position where the aircraft nose enters the vortex field. The airplane passes through the downwash velocity field between the two vortices. Thus, the lift change under the action of the downwash force is negative. Since the A330-200 take-off weight is greater than its landing weight, the wake vortex ring produced during the take-off phase will be larger, resulting in greater induced speed for the ARJ21. Therefore, the ARJ21 lift change during the take-off phase will be greater than that during the landing phase; as the interval becomes larger, the wake vortex strength will wane, reducing the downwashing force and the lift change.
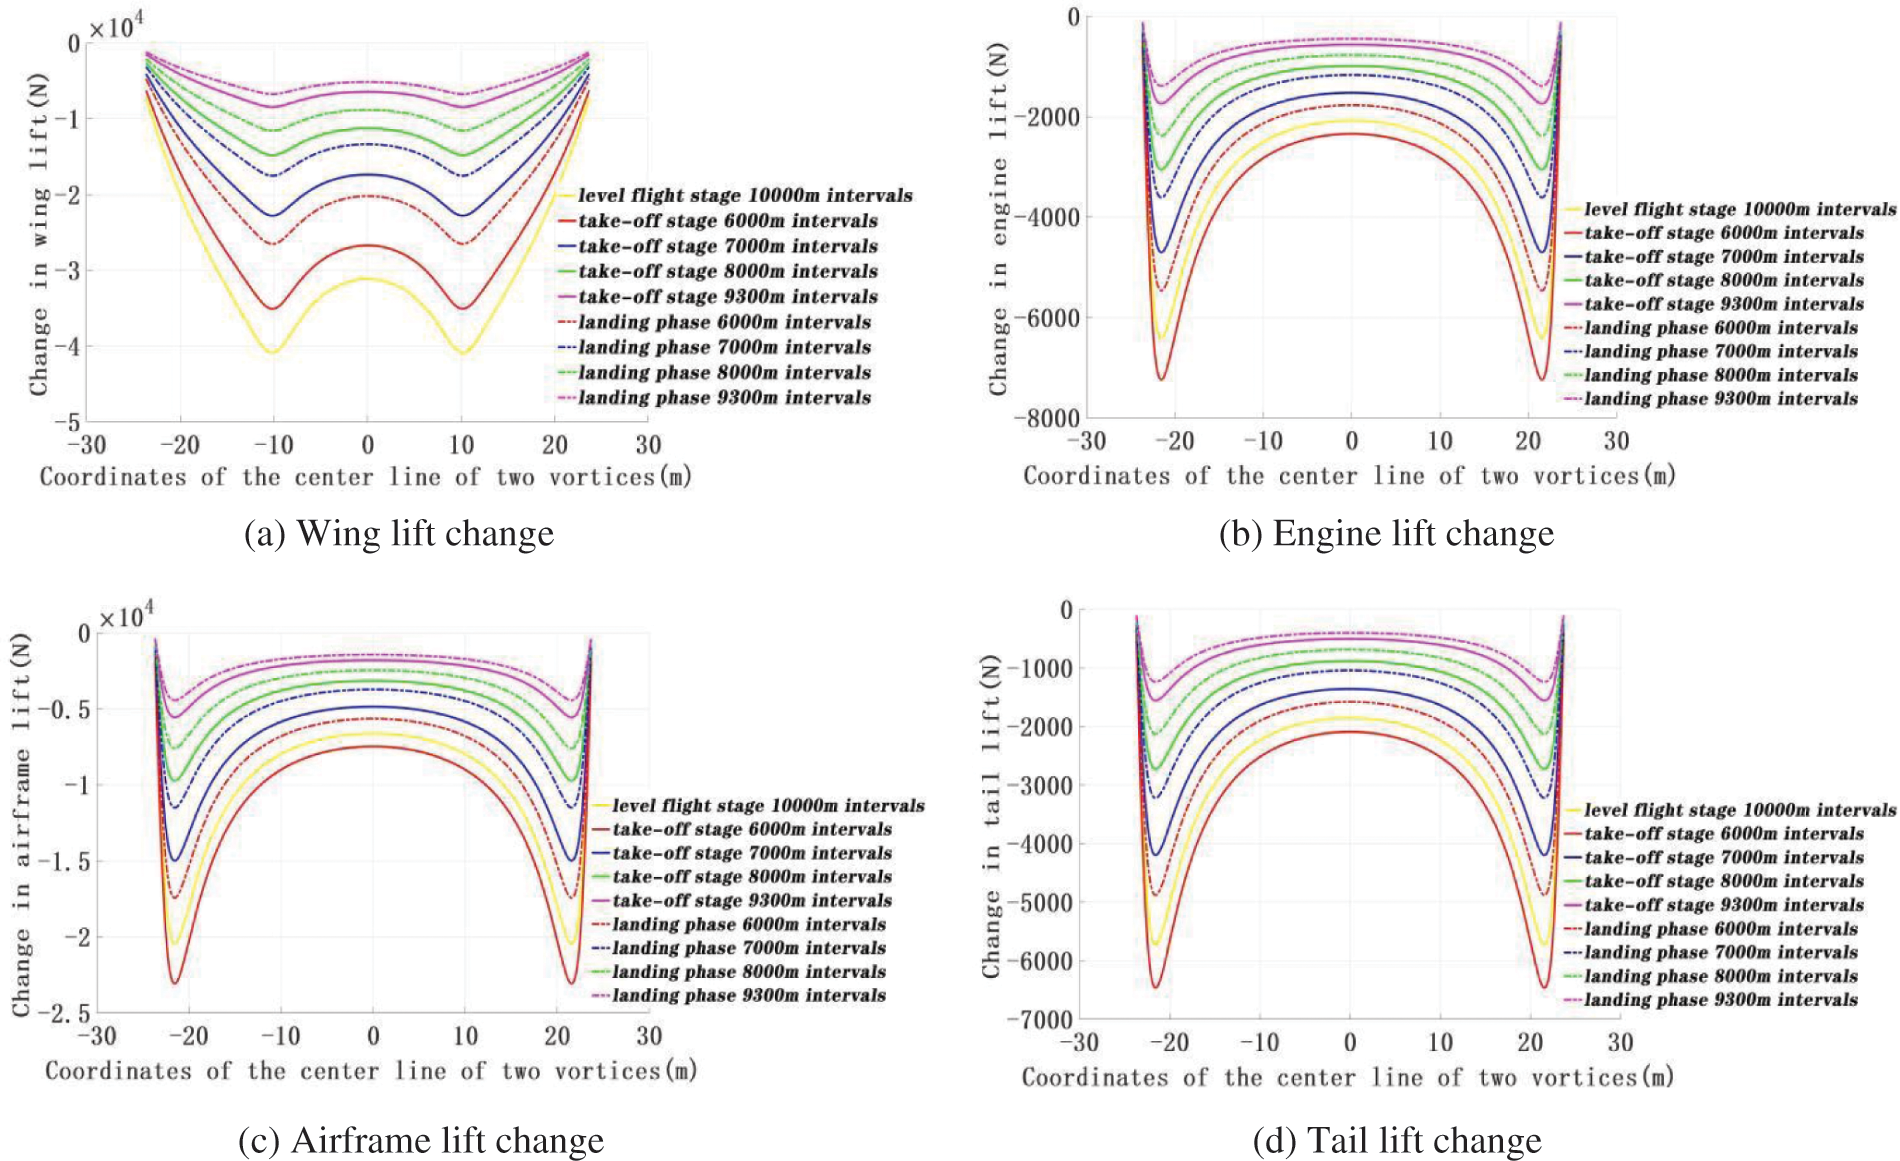
Figure 5: The lift changes of different ARJ21 aircraft parts
Although the distance between the two aircraft is relatively large during the level flight and the wake vortex dissipation time is relatively long, the front aircraft flight speed is faster, resulting in the relatively large lift change. When the ARJ21 aircraft enters the left and right vortex cores generated by the front plane from the center, the lift change will be the smallest. This is since the induced speeds on vortex core sides are opposite, Hence, the left and right wings receive the opposite force directions, meaning that the positive and negative lift changes cancel each other out, resulting in the smallest total lift change. Further, when the ARJ21 aircraft nose enters the tail vortex field from approx. 10 m from the vortex core center, the wing lift changes the most. Additionally, when its nose enters the tail vortex field from approx. 10 m from the connecting center of two vortex cores, the wing lift variation will be the largest. The engine, fuselage, and tail lift change the most when the aircraft nose enters the front tail vortex from the vicinity of the vortex core center.
Fig. 6 shows a schematic diagram of the rolling moment of different ARJ21 aircraft parts. The counterclockwise rolling direction was denoted as positive torque direction. Moreover, Fig. 7 shows the schematic diagram of the rolling torque coefficient. At the center of the connection between vortexes, forces acting on the left and right fuselage halves are the same in both magnitude and direction. Thus, the rolling moment and the rolling moment coefficient will be zero. As shown in Figs. 6a and 7a, when the aircraft nose enters the front tail vortex field from about 12 meters from the centerline of the two vortices, the sum of positive and negative torque acting on the wing will be zero. The rolling torques of the engine, fuselage, and tail will be rather small, meaning that the rolling torque coefficient will also be small – thus, in this case, the airplane will hardly roll.
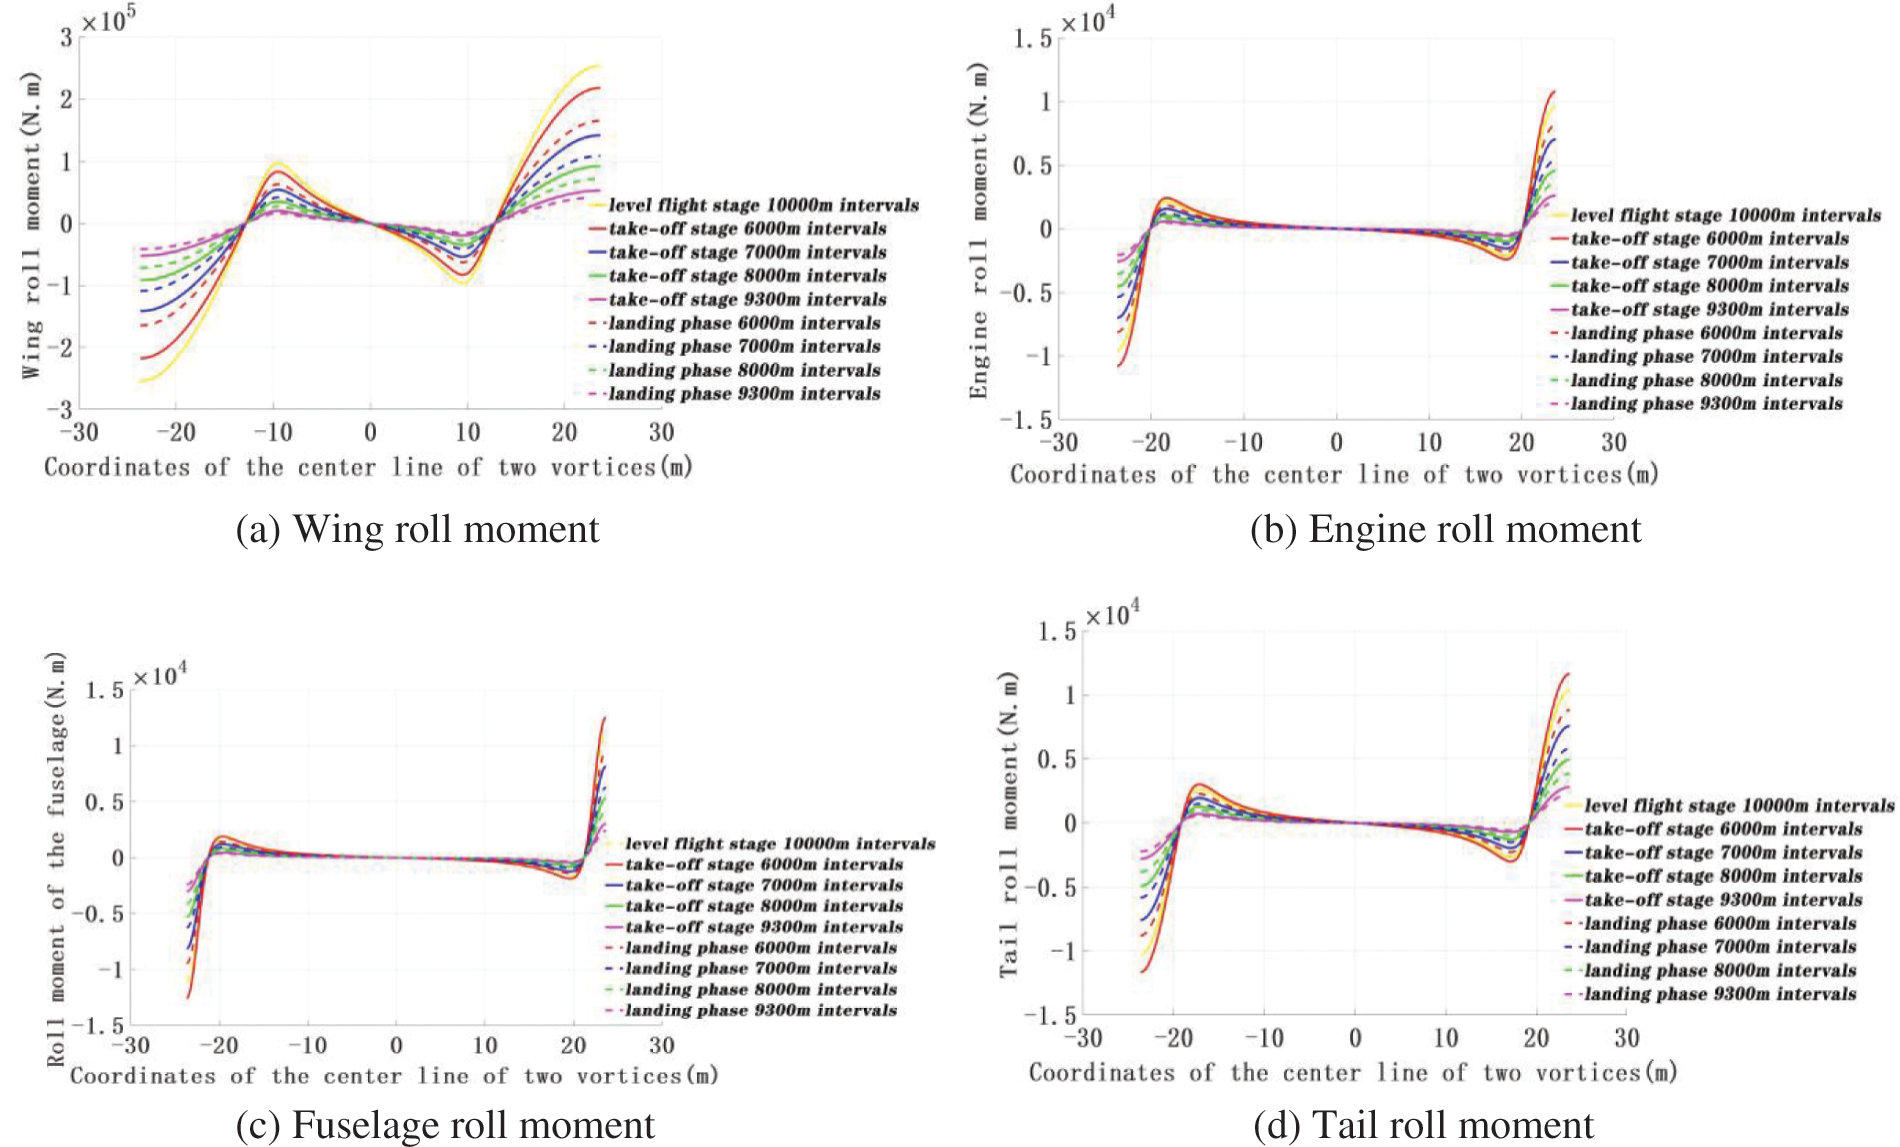
Figure 6: The rolling moment of various ARJ21 parts
When entering the front tail vortex field at the center between the vortexes and 12 m from the center, the aircraft will only be affected by the downwashing force, which will reduce the height. There will be no roll affecting the control balance; therefore, it is safer to enter from the above three positions. The wing roll moment and roll moment coefficients are much larger than their counterparts for the other three parts. For this reason, the wing has a primary role when it comes to aircraft stability and maneuverability. Additionally, at the same interval, the roll moment and roll moment coefficient during the take-off phase is greater than that during the landing phase. As the interval increases, the wake vortex slowly dissipates, and the aircraft roll moment and roll moment coefficient decrease. As shown in Figs. 7 and 8, when the aircraft longitudinally enters the center of the single vortex, it will be exposed to the largest rolling moment and the largest rolling torque coefficient. This might harm the aircraft balance, resulting in rolling unbalance–thus, this is the most dangerous way to enter the wake vortex field.
Figure 7: The rolling moment coefficient of different ARJ21 parts. (a) Wing roll moment coefficient, (b) Engine roll moment coefficient, (c) Fuselage roll moment coefficient, (d) Tail roll moment coefficient
The approach for entering the single vortex longitudinally through the wake vortex field was analyzed using the limit idea. It was assumed that the front vortex field produces the maximum induced velocity at each point of the following airplane. In the observed case, the induced rolling moment coefficient of the airplane was the largest and the most dangerous. The overall airplane roll moment coefficient was ranging between 0.05 and 0.07 was the maximum value that the airplane roll control authority can use through the aileron control. If said safety threshold is exceeded, the airplane will lose stability and control. At the same time, the RECAT-PWS-EU uses the wing roll moment coefficient as a measure of the wake encounter severity. By observing more than 700 wake encounter experiments, it was concluded that the wing roll moment coefficient of 0.04 results in the critical value of small disturbance caused by the front aircraft wake vortex on the following aircraft [6].
Fig. 8 shows the wing roll moment at different safety intervals, while Fig. 9 shows the wing roll moment coefficient. Both the rolling moment and its coefficient are larger during the take-off phase compared to the landing phase. This is due to the aircraft weight, which is greater during the take-off; therefore, the tail vortex is stronger and the induced speed is greater before the take-off. During the level flight, the air density is low and the turbulence dissipation rate is large. Furthermore, during the rapid decay phase, the wake vortex dissipates faster. Hence, the rolling moment coefficient during the level flight phase before reaching 7400 m will be greater than the rolling torque coefficient during the landing and take-off phases. However, following the level flight phase, the aircraft speed will be higher and the time of encountering the front vortex in the level flight phase will be shorter compared to that during the take-off and landing phases, given the same following distance. Therefore, the rolling moment coefficient in the level flight phase above 7400 m will be greater than that during the take-off and landing phases.
Figure 8: Variation of the ARJ21 wing rolling moment with distance
Figure 9: Variation of the ARJ21 aircraft wing moment coefficient with distance
Table 3 shows the rolling moment coefficients obtained for different aircraft parts, along with the minimum wake safety interval of each stage. In the near-earth phase, the ARJ21 follows the A330-200 (the preceding aircraft) at an ICAO wake interval of 9300 m. The rolling moment coefficient is 0.0259, the landing phase is 0.0219, and the level flight phase is 0.0253 (at 10,000 m intervals). Both values are below 0.05, meaning that the ailerons can control the aircraft roll. According to the maximum rolling moment coefficient the wing can withstand, the minimum wake safety interval can be obtained. The take-off phase was reduced by 2521 m relative to the current wake standard, which yields a reduction rate of 27.1%. Further, the landing phase was reduced by 3025 m, and the reduction rate was 32.53%. Finally, the level flight phase was reduced by 3645 m compared to the current wake standard, which is a reduction of 36.45%, thus greatly improving the operating efficiency.
1) In this paper, the HB wake-induced velocity model was used to study the wake vortex dissipation mechanism. The strip model was applied to calculate the lift force, roll moment, and roll moment coefficient of the wing, tail, engine, and fuselage of the ARJ21 following the A330-200. The wake vortex field effect was observed at different intervals during the take-off, level flight, and landing phase. The results have shown that the variation of take-off lift and roll moments are greater than those during the landing (given the same interval), providing a reference for the safety analysis of aircraft encountering the wake vortex.
2) It is proposed to use the overall aircraft roll moment coefficient to determine whether the roll control of the aircraft can be achieved via the aileron. Moreover, it is also proposed to use the wing roll moment coefficient as an index to measure the safety of encountering wakes. Through simulation calculations, it is concluded that the ARJ21 aircraft will be safer when entering from the center of the two A330-200 vortexes 12 m from the center to either the left or right. When longitudinally entering the center of the wake vortex pair, the rolling moment coefficient will be the largest, implying that it is the most dangerous following mode. In this following mode, the overall aircraft roll moment coefficient was below 0.05 in all three stages. The wing roll moment coefficient was less than 0.04, verifying the safety of the current wake interval standard.
3) The wake interval standard for the AJR21 aircraft was shortened compared to the existing safety interval standard. The take-off, level flight, and landing phases were shortened by 27.1%, 32.53%, and 36.45%, respectively. This greatly improves the airport and airspace capacity, as well as the operational efficiency.
In the future, more accurate calculations will be carried out based on the weather conditions, combinations of aircraft types, and actual on-site observation data to establish a safety interval standard that can be used by different aircraft.
Funding Statement: This work is supported by the [1] National Natural Science Foundation of China, Key Technology of Aircraft Wake Evolution and Risk Control in the Near-Earth Phase, Approval No. U1733203; [2] Civil Aviation Administration Safety Capability Building Project, Research on Technology of Reducing Control Interval Based on Aircraft Wake Prediction, Project No. TM2018-9-1/3; [3] Research on the Safety Interval of J21 Aircraft Taking Off and Landing TM2019-16-1/3; [4] Sichuan Science and Technology Project (Grant No. 2021JDRC0083).
Conflicts of Interest: The authors declare that they have no conflicts of interest to report regarding the present study.
1. Zhao, X. D., Jia, R. Z. (2009). Research on key technologies of ARJ21 aircraft engineering simulator. Journal of System Simulation, 21(21), 6856–6858+6864. [Google Scholar]
2. Crow, S. C. (2003). Stability theory for a pair of wake vortices. AIAA Journal, 2172–2179. DOI 10.2514/3.6083. [Google Scholar] [CrossRef]
3. Greene, G. C. (2012). An approximate model of vortex decay in the atmosphere. Hampton, Virginia: NASA Langley Research Center, NTRS. [Google Scholar]
4. Proctor, F. H., Ahmad, N., Switzer, G. S. (2010). Three-phased wake vortex decay. AIAA Atmospheric and Space Environments Conference. [Google Scholar]
5. Frech, M., Holzäpfel, F. (2022). A probabilistic prediction scheme for wake vortex evolution in a convective boundary layer. Air Traffic Control Quarterly, 10, 23–42. DOI 10.2514/atcq.10.1.23. [Google Scholar] [CrossRef]
6. Proctor, F. H., Hamilton, D. W. (2009). Evaluation of fast-time wake vortex prediction models. AIAA Journal, 47(341–10. DOI 10.2514/6.2009-344. [Google Scholar] [CrossRef]
7. Baren, G. V., Treve, V., Rooseleer, F. (2017). Assessing the severity of wake encounters in various aircraft types in piloted flight simulations. AIAA Modeling and Simulation Technologies Conference, Denver, Colorado. [Google Scholar]
8. Schwarz, C., Hahn, K. U., Fischenberg, D. (2010). Wake encounter severity assessment based on validated aerodynamic interaction models. AIAA ASE Conference, Anaheim, California. http://www.wakenet.eu/fileadmin/user_upload/Workshop2014/Presentations/WakeNetEurope_Workshop2014_204_Winckelmans.pdf. [Google Scholar]
9. Burnham, D. C., Hallock, J. N. (1982). Wake vortex decay. In: Chicago monostatic acoustic vortex sensing system, vol. IV. Springfield, VA. National Information Service. [Google Scholar]
10. Winckelmans, G., de Visscher, I. (2014). RMC-based severity metrics: Possibilities and scalings. WakeNet-Europe Workshop. http://www.wakenet.eu/fileadmin/user_upload/Workshop2014/Presentations/WakeNetEurope_Workshop2014_204_Winckelmans.pdf. [Google Scholar]
11. Wang, X., Pan, W. J. (2022). Numerical simulation of wake vortices generated by an A330-200 Aircraft in the nearfield phase. Fluid Dynamics & Materials Processing, 18(1), 173–188. DOI 10.32604/fdmp.2022.017869. [Google Scholar] [CrossRef]
12. Li, G., Cao, Y. (2021). Numerical simulation of the wake generated by a helicopter rotor in icing conditions. Fluid Dynamics & Materials Processing, 17(2), 235–252. DOI 10.32604/fdmp.2021.014814. [Google Scholar] [CrossRef]
13. Han, H. R., Li, N., Wei, Z. Q. (2012). Safety analysis of aircraft encountering wake vortex. Journal of Traffic and Transportation Engineering, 12(1), 45–49. [Google Scholar]
14. Gu, R. P., Dai, S. W., Wei, Z. Q. (2021). Formation flight optimization analysis based on wake effect. Flight Mechanics, 39(1), 23–28. DOI 10.13645/j.cnki.f.d.20201112.001. [Google Scholar] [CrossRef]
15. Deng, W. X., Pan, W. J., Liang, H. J. (2020). Research on the optimization of the departure wake interval of close parallel runways. Ordnance Equipment Engineering Journal, 41(2), 204–208. DOI 10.11809/bqzbgcxb2020.02.041. [Google Scholar] [CrossRef]
16. Wei, Z. Q., Xu, X. H. (2010). Research on modeling and simulation calculation of aircraft wake vortex field. Transportation System Engineering and Information, 10(4), 186–191. [Google Scholar]
17. Pan, W. J., Liang, Y. A., Liang, H. J. (2019). Safety analysis of single runway take-off interval based on numerical calculation model. Aeronautical Computing Technology, 49(4), 4–8. DOI 10.3969/j.issn.1671-654X.2019.04.002. [Google Scholar] [CrossRef]
18. Jia, B. H., Du, J. X., Li, Y. H. (2014). Research on optimization method of flight string based on genetic algorithm. Journal of Civil Aviation University of China, 41(4), 451–462. DOI 10.1002/j.2161-4296.1994.tb01890.x. [Google Scholar] [CrossRef]
19. NASA/TM-2014-218152 (2014). NASA AVOSS fast-time wake prediction models: User’s guide. https://ntrs.nasa.gov/api/citations/20140002399/downloads/20140002399.pdf. [Google Scholar]
20. Sarpkaya, T. (1998). Decay of wake vortices of large aircraft. AIAA Journal of Aircraft, 36(9), 1671–1679. DOI 10.2514/2.570. [Google Scholar] [CrossRef]
21. Sarpkaya, T., Robins, R. E. (2000). Wake-vortex eddy-dissipation model predictions compared with observations. Journal of Aircraft, 38(4), 687–692. DOI 10.2514/2.2820. [Google Scholar] [CrossRef]
22. Fuhrmann, L., Luckner, R., HaHne, G., Fuhrmann M. (2004). Hazard criteria for wake vortex encounters during approach. Aerospace Science and Technology, 8(8673–687. DOI 10.1016/j.ast.2004.06.008. [Google Scholar] [CrossRef]
23. Anderson, J. D., Yang, Y., Song, W. P. (2014). Fundamentals of aerodynamics (Bilingual Teaching Version) (5th ed.pp. 1–1106. Beijing: Aviation Industry Press. [Google Scholar]
24. Liu, P. Q. (2021). Aerodynamics (1st ed.pp. 1–608. Beijing: Science Press. [Google Scholar]
 | This work is licensed under a Creative Commons Attribution 4.0 International License, which permits unrestricted use, distribution, and reproduction in any medium, provided the original work is properly cited. |