| Fluid Dynamics & Materials Processing |
DOI: 10.32604/fdmp.2022.021972
ARTICLE
Modeling of the Photovoltaic Module Operating Temperature for Various Weather Conditions in the Tropical Region
1Efficiency and Energetic Systems Research Group, Alioune Diop University, Bambey, Senegal
2Laboratoire Eau, Energie, Environnement et Procédés Industriels (LE3PI), Université Cheikh Anta Diop, Bambey, Senegal
*Corresponding Author: Mactar Faye. Email: mactar.faye@uadb.edu.sn
Received: 15 February 2022; Accepted: 27 April 2022
Abstract: The operating temperature is a critical factor affecting the performances of photovoltaic (PV) modules. In this work, relevant models are proposed for the prediction of this operating temperature using data (ambient temperature and solar irradiance) based on real measurements conducted in the tropical region. For each weather condition (categorized according to irradiance and temperature levels), the temperatures of the PV modules obtained using the proposed approach is compared with the corresponding experimentally measured value. The results show that the proposed models have a smaller Root Mean Squared Error than other models developed in the literature for all weather conditions, which confirms the reliability of the proposed framework.
Keywords: Photovoltaic; operating temperature; PV module; weather condition
Nomenclature
| C1 and C2: | Empirical coefficients |
| NOCT: | Nominal operating cell temperature (°C) |
| Opt1: | Proposed model 1 |
| Opt2: | Proposed model 2 |
| POA: | Plane of array |
| RMSE: | Root mean squared error |
| Tamb: | Ambient temperature (°C) |
| Tm: | Module temperature (°C) |
| Tref: | Reference temperature (°C) |
| TaNOCT: | Ambient temperature considered for NOCT conditions (°C) |
| Gt: | Irradiance (W/m²) |
As the PV power sector grows rapidly, favorable support policy and the cost of PV modules is becoming more and more affordable, the use of PV modules to generate electricity is increasing. PV modules are made up of multiple single solar cells that are connected in a series-parallel fashion to boost power and voltage over a single solar cell [1]. The PV module temperature, which affects the module’s power output, is considered as an essential parameter in the modeling of it [2].
In the PV conversion process, the solar irradiance can only be absorbed in a particular range of wavelengths depending on the material of the cell. The rest is absorbed as heat, which increases the temperature of the PV cells [3]. The performance of the PV cell is specified under standard test conditions as follows: solar radiation of 1000 W/m2, module temperature of 25°C and air mass of 1.5. These conditions are usually only obtained in the laboratory.
The climate in Senegal is a tropical one, characterized by fast changes in radiation caused by large variations in the cloud cover. There is a Sahel zone in the north, characterized by fresh nights and hot days, and a hot and wet zone in the south. The daily maximum and minimum average temperatures are respectively 35°C and 23°C. The country has a high solar potential with an annual average sunshine duration of about 3000 h and an overall daily radiation average of 5.5 kWh/m2/day [4].
PV modules generally operate in an environmental condition that is different from the manufacturer’s optimal PV module conditions. Therefore, the use of PV modules in situ is often associated with losses in performance. The PV module temperature varies depending on various factors such as the irradiance, convection due to wind and air [5].
Several authors have shown the existence of a correlation between PV modules temperature and climatic conditions.
The impact of dust deposition, solar radiation, wind speed and ambient temperature on the temperature of PV modules were investigated in Iran by Rouholamini et al. [6] .The results revealed that dust deposition increases the PV module temperature. As a consequence, a reduction in PV module power is observed. The authors also found that PV module temperature was constantly higher than the ambient temperature. In addition, the PV module temperature has a direct correlation with the solar irradiation that is received.
Andrea et al. [7] examined the influence of dust on the temperature of PV modules. The difference in the temperature between clean and dirty modules has been observed during experimental test. The results reported that the temperature of the soiled module are higher than the clean module. Due to the accumulation of dirt, the solar irradiation coming onto the panel tends to be impeded. This is why the dirty module has a higher temperature compared to the clean module.
Jaszczu et al. [8] assessed the temperature distribution in the PV module in different climatic conditions. The results show that the operating temperatures of the PV modules depend mainly on the ambient temperature and solar radiation. Wind speed and direction are also parameters that have a significant impact on module temperatures. In addition, the mounting conditions that are not considered by most models in the literature also play an important role in the transfer of the heat.
Zhou et al. [9] studied the impact of the environmental conditions and the gap between the adjacent cells on the PV module temperature. The influence of wind speed on the PV module is evident when it rises from 0 to 1 m/s. A higher wind speed improves the PV module’s electricity efficiency. The results show that the module temperature decreases with increasing the distance between the cells. Therefore, a larger gap between adjacent cells is required to improve the performance of PV modules.
The recently studies mentioned above were investigated the influence of different environmental conditions on the PV module temperature. Solar irradiation and ambient temperature are the environmental parameters that are identified as most affecting the temperature of PV modules.
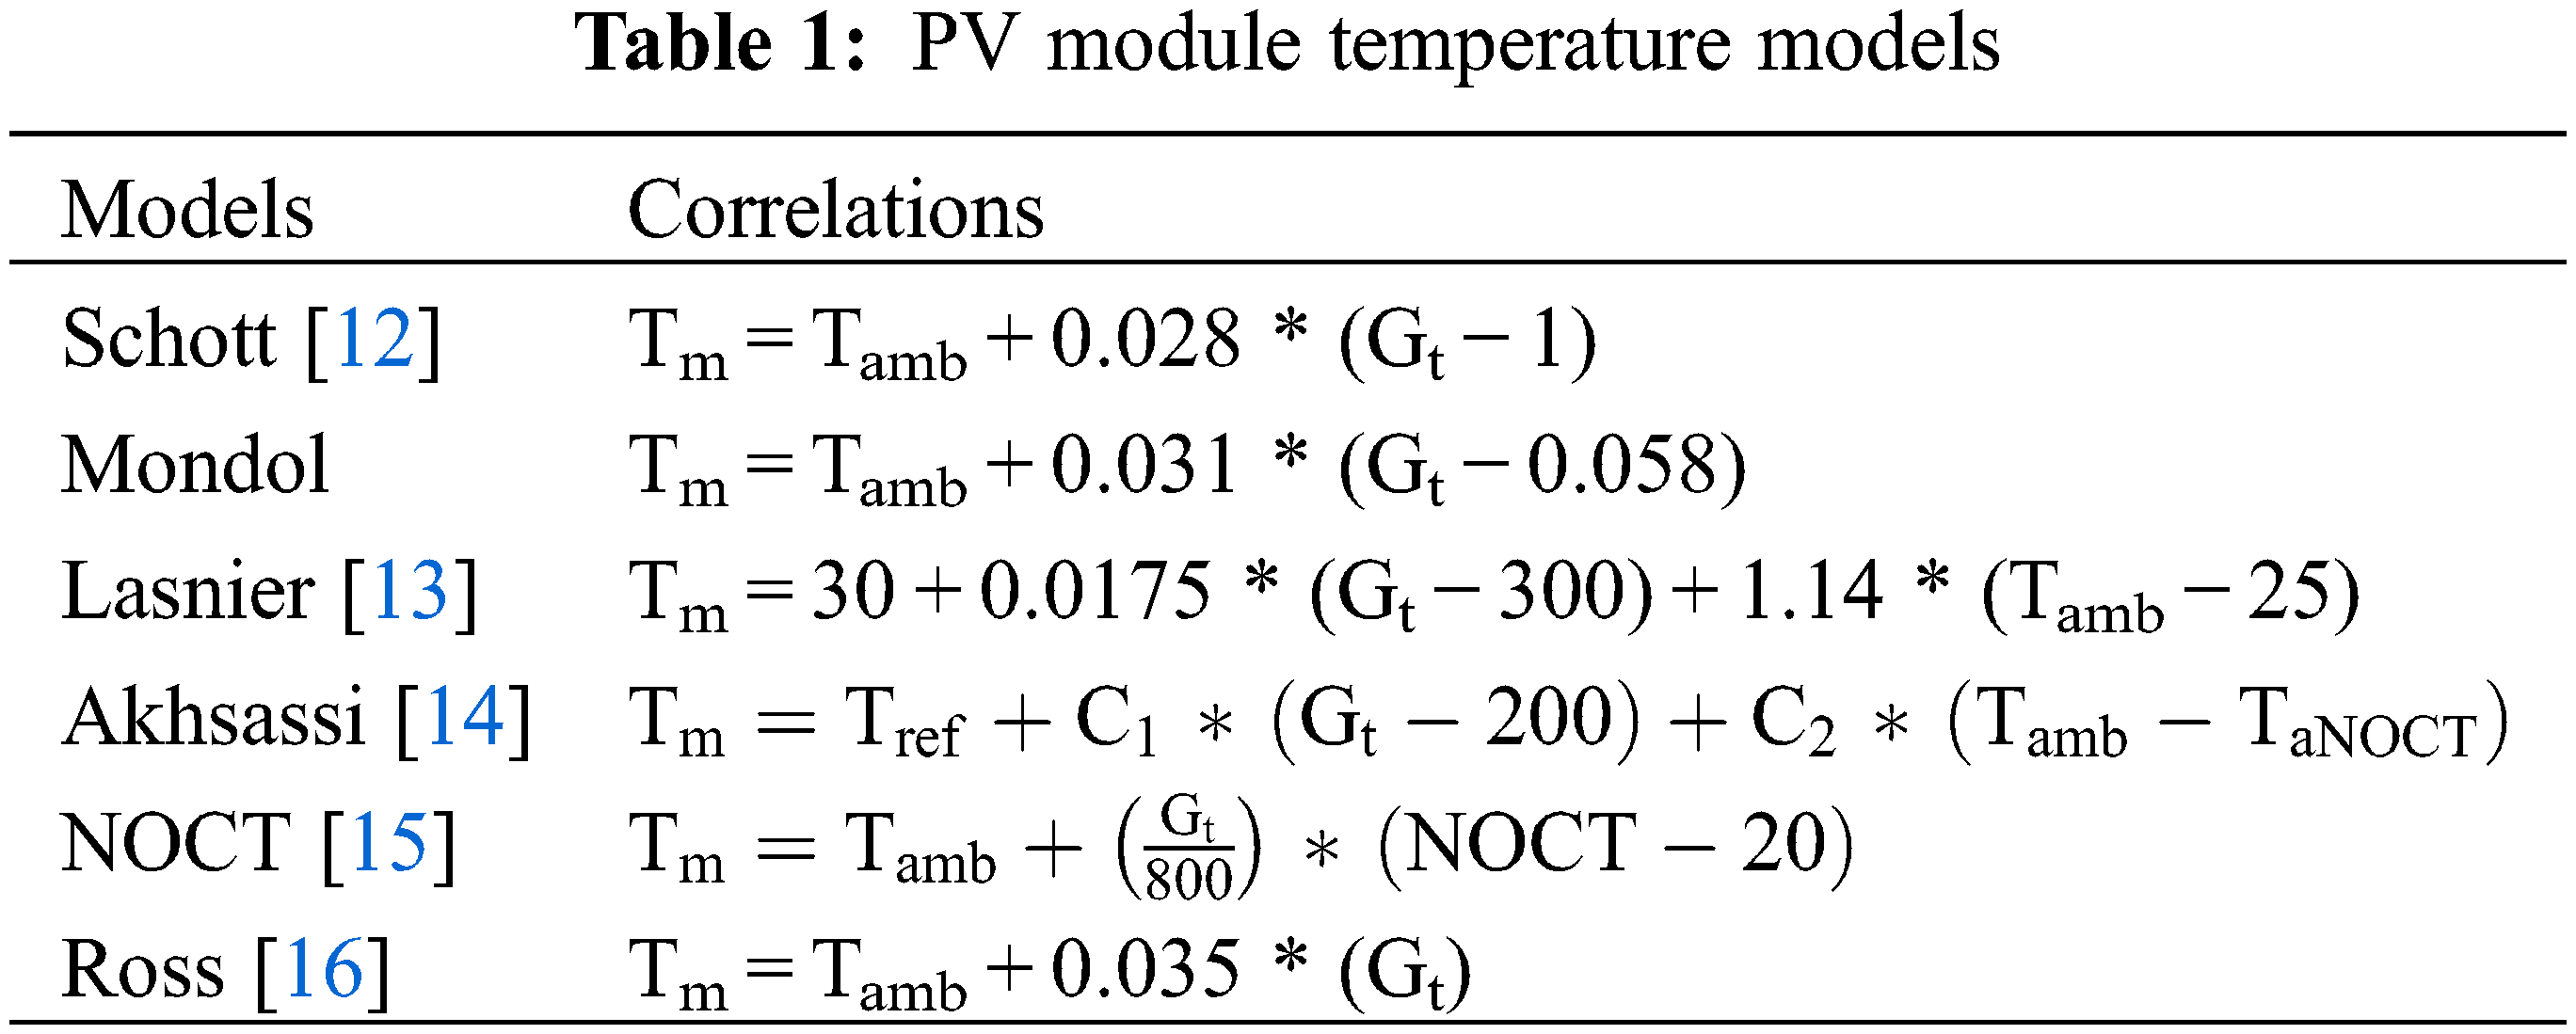
Several models for predicting the temperature of PV modules can be found in the literature [10,11]. Table 1 summarises a few of them. Most of the principal PV module temperature models, not including the wind parameter, are in the following two forms:
Models to predict PV module temperature as the available equations have been validated under given climatic conditions. Even if some studies are carried out in various climatic conditions, research in a tropical country like Senegal has not been exhaustively discussed in the published literature yet. Models to predict the best operating temperature of the PV module in this region are important on the PV performance modelling. The objective of this paper is to propose temperature models for PV modules in tropical regions using operational data.
2.1 Site of Experiment and PV Modules
Outdoor PV testing are located at solar power plants installed in Western Senegal. The temperatures in this zone differ from one region to the other, with the temperatures growing from coast to interior. The PV modules used to measure the operating temperature are of the polycrystalline type. They are mounted on support structures oriented to the south, inclined at 15 degrees to the horizon.
PV module temperature was measured with a single sensor placed at the back centre of the module of module, as shown in Fig. 1. The site is equipped with three temperature sensors installed on three different locations on the solar power plant. For each type of measurement, an average is calculated. The faulty results are excluded from the calculation of the average. To obtain an accurate measure, we have protected them from wind and humidity. Both of these factors can impact our temperature measurement.

Figure 1: Temperature sensor mounted on the backside of module
The metrological data including the solar irradiance, and the ambient temperature of various weather conditions are measured and used as input parameters for the models. The Fig. 2 shows the installed weather station and sensors radiation used to measure the outdoor ambient temperature and POA irradiance.
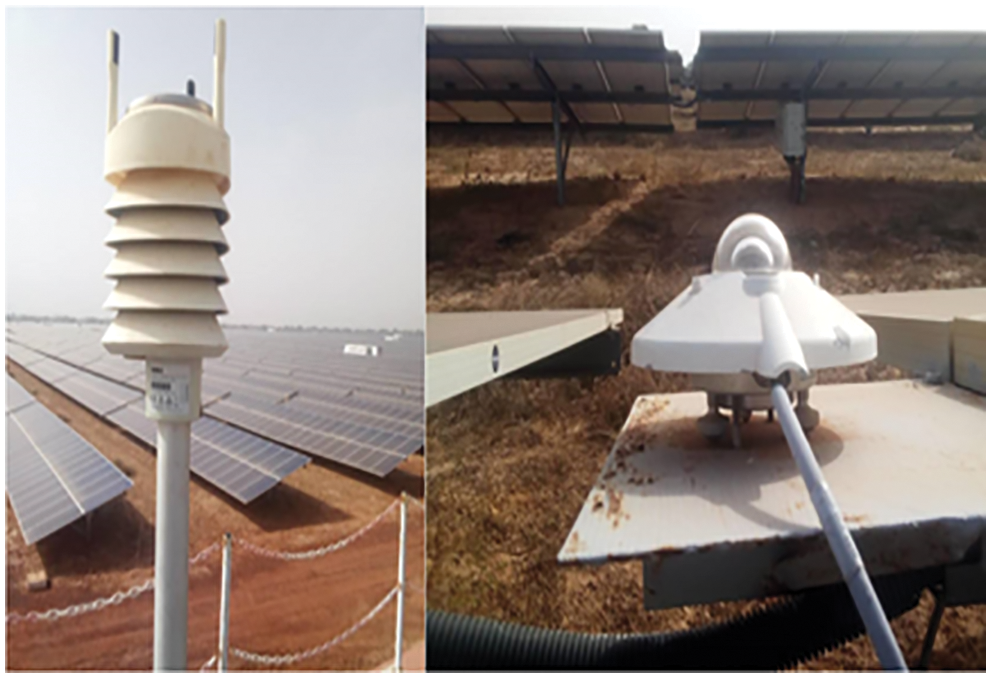
Figure 2: Weather station and irradiance sensors
2.3 Models Proposed Using Data Regression
Weather conditions are categorized based on irradiance and temperature levels and defined in Table 2.
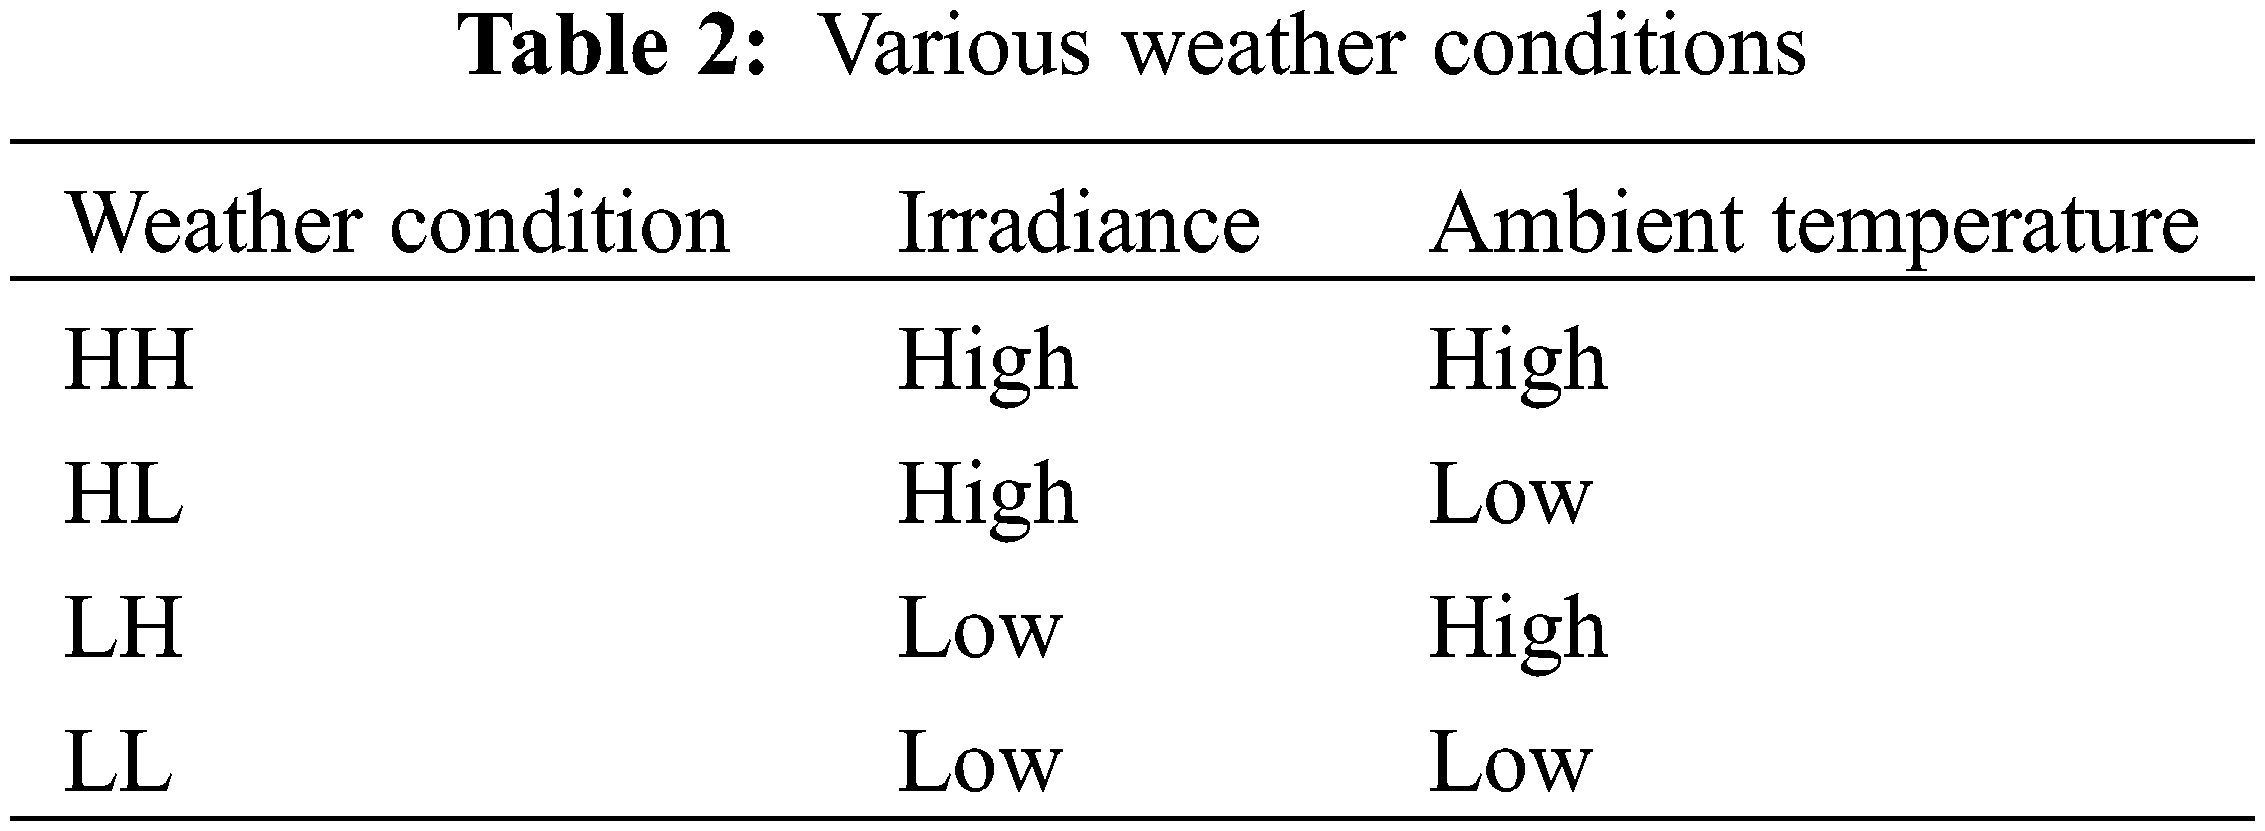
Fig. 3 shows evolution of irradiance and ambient temperature for different weather condition.
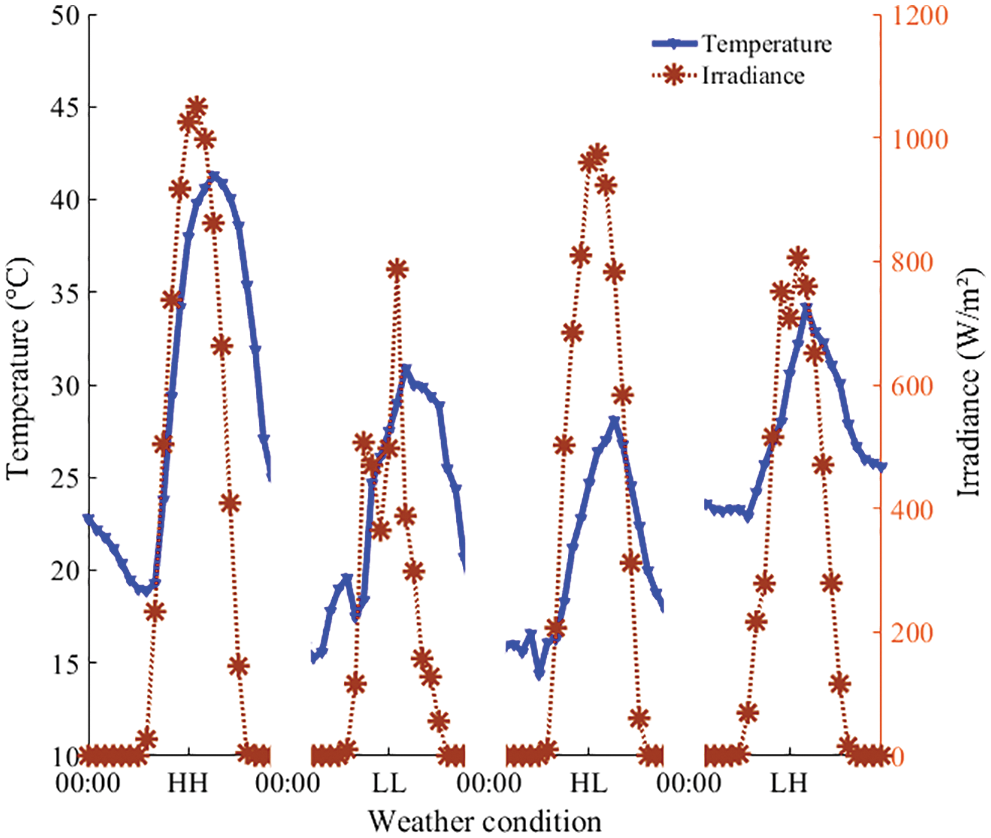
Figure 3: Characteristic weather conditions
HH and LL present high and low irradiance and ambient temperature, respectively. LH presents a low irradiance and high temperature. HL shows a high irradiance and low temperature.
The peak irradiance values take place in the dry season of November to June. This season is marked by a warmer period (March to June) and a cooler period (December to January).
The reduction in the irradiance value takes place during the wet season (July to October). This can be attributed to the majority of the days being overcast, reducing the amount of sunlight in this period.
This approach allows the assessment of the models for such a wide range of weather conditions.
A regression is used to finds a constrained minimum of models forms to forecast the PV module operating temperature of several variables starting at an initial estimate.
These models are examined and compared them against real data from outdoor PV testing. The optimal parameters to predicted PV module temperature are estimated for various weather conditions and named by Opt 1 and Opt 2.
Fig. 4 compares PV module temperature measured and modelled with various models and weather conditions. Results show that PV module temperature models Opt 1 and Opt 2 proposed are closer to the PV module temperature measured for weather conditions HH, LL and LH. Lasnier model is closer to the PV module temperature measured for the weather condition HL. Alkhassi and Lasnier models under-estimate the temperature compared to the temperature measured for weather conditions HH, LL and LH. Schott, Mondol, NOCT and Ross models over-estimate the temperature predicted compared to the temperature measured for all weather conditions.
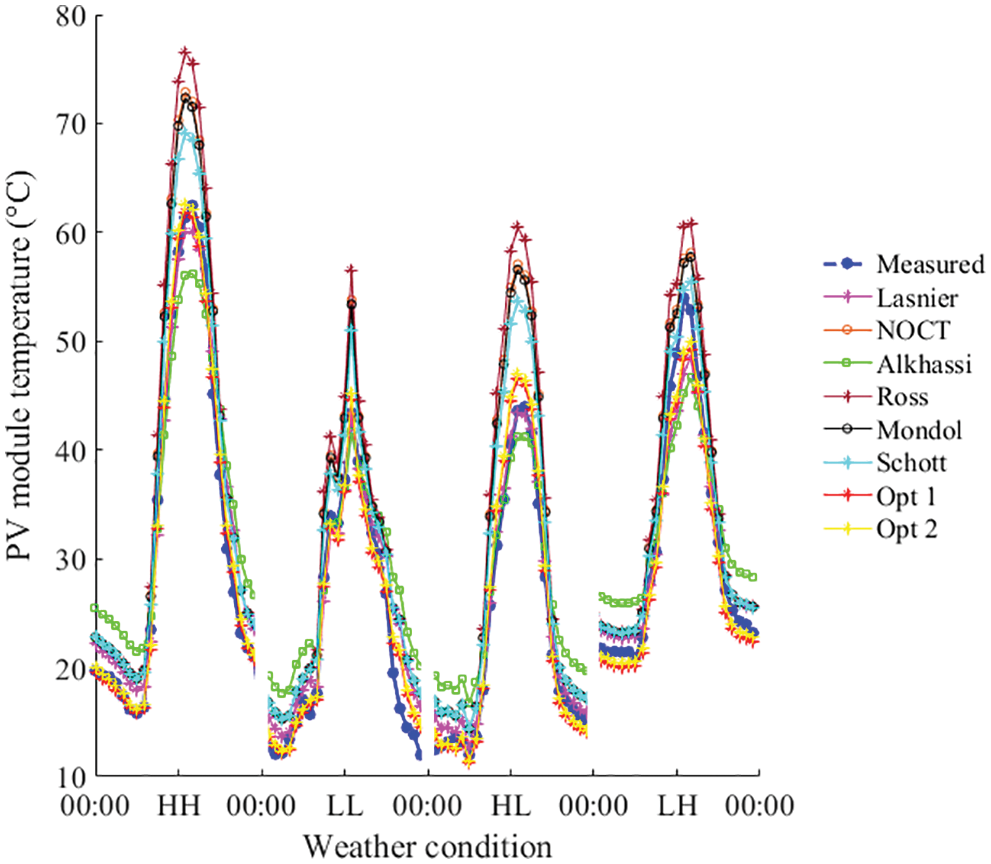
Figure 4: Operating temperature of PV module
Fig. 5 compares the root-mean-square-error (RMSE) of PV Module temperature models. Fig. 5a shows that under high irrigation conditions, a reduction of the ambient temperature causes an increase in RMSE of NOCT, Ross, Mondol, Opt 1 and Opt 2 models. In the other hand a drop in ambient temperature leads to a reduction in RMSE of Lasnier and Alkhassi models. Fig. 5b shows that under high temperature conditions, a decrease in irradiance leads to a decrease in the RMSE of the temperature models developed in the literature. In the other hand a decrease in irradiance results in a slightly increased in RMSE of Opt 1 and Opt 2 models.
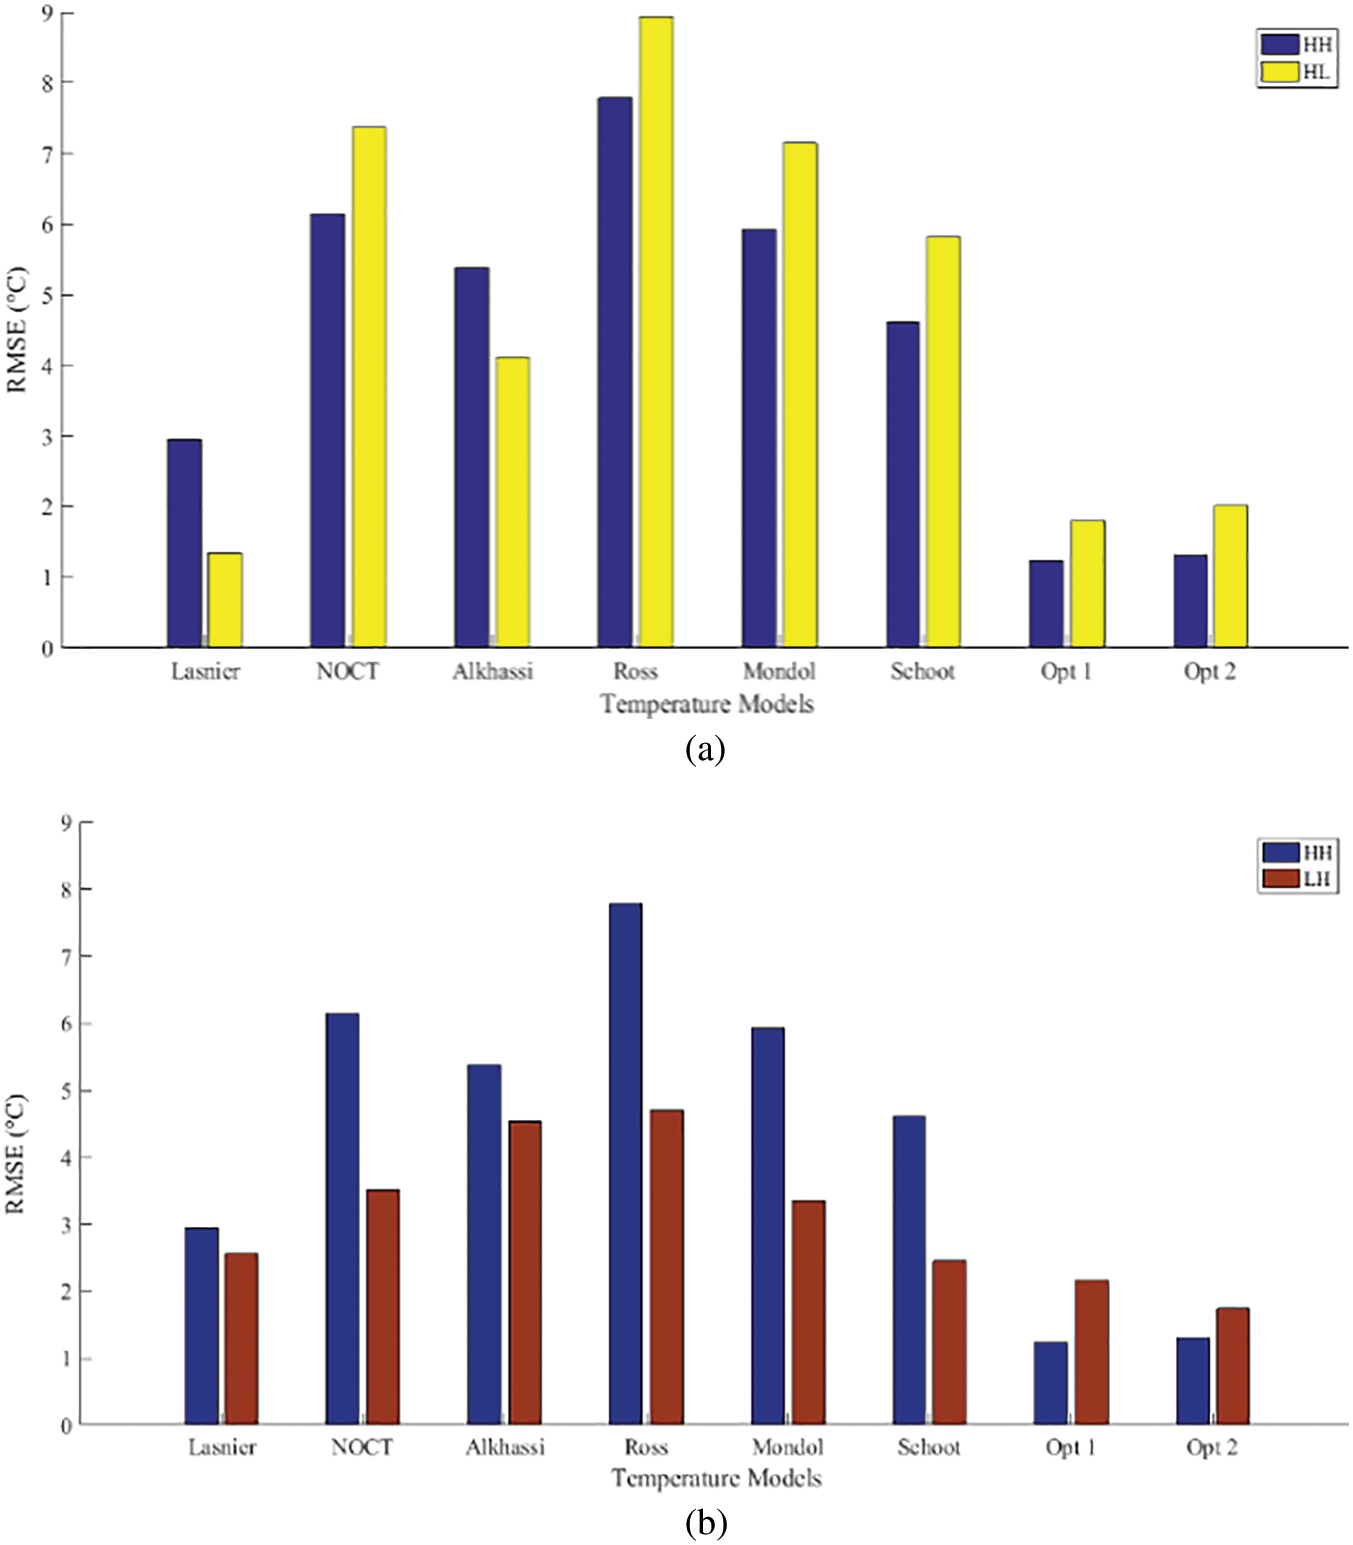
Figure 5: RMSE of PV module temperature models (a) under HH and HL weather conditions, (b) under HH and LH weather conditions
Fig. 6 shows that NOCT, Ross and Mondol give better results in low irradiation and temperature conditions (LL) than in high irradiation and temperature conditions (HH). Opt 1 and Opt 2 models give better results in high irradiation and temperature conditions (HH) and low irradiation and temperature conditions (LL). Lasnier and Alkhassi models give the same results in these two weather condition.
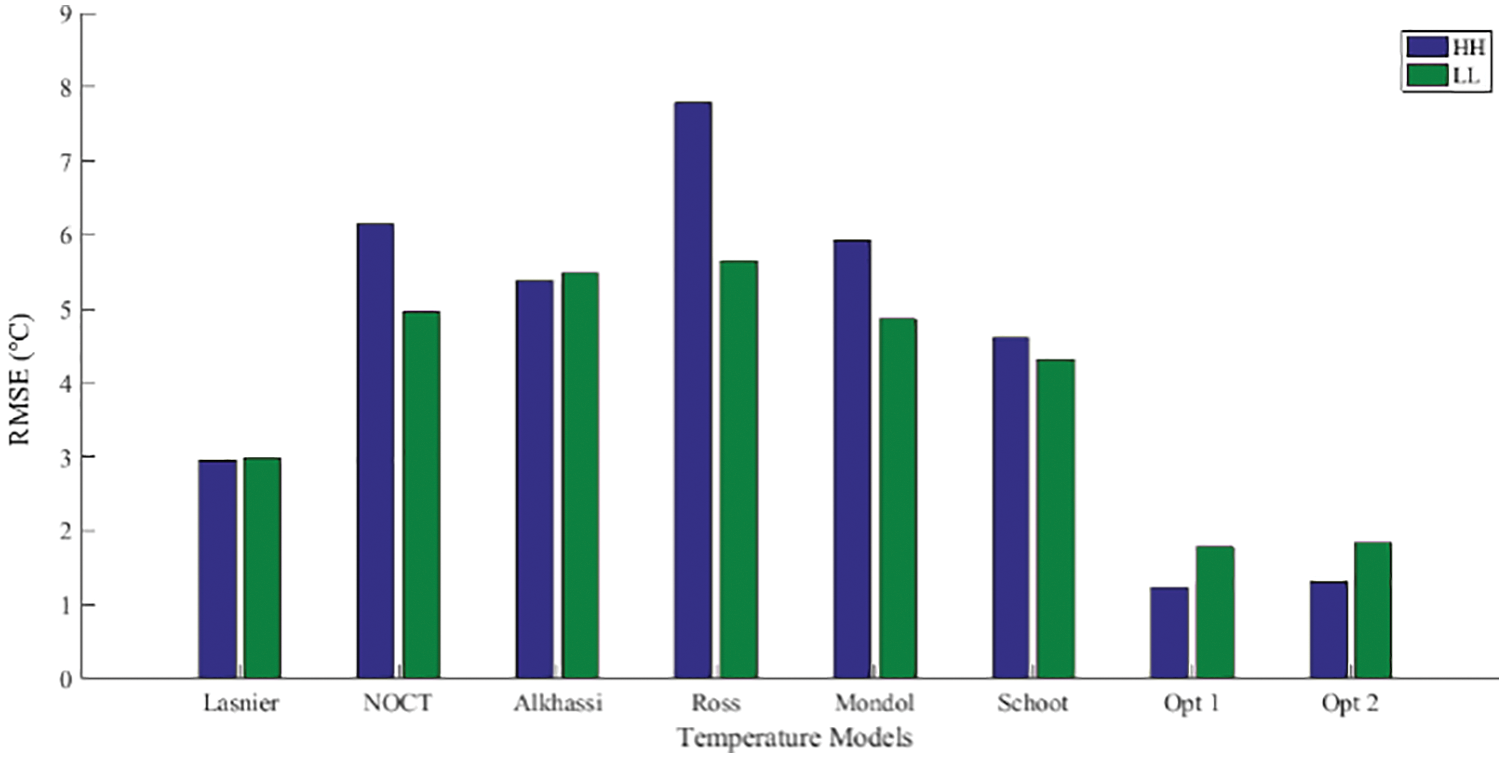
Figure 6: RMSE of PV module temperature models under HH and LL weather conditions
Results show that Opt 1 and Opt 2 models have the smallest values of RMSE in all weather condition except HL weather condition. For this weather condition Lasnier is the best model. The models proposed in this study are therefore more suitable for modelling the temperature of modules in tropical zone.
The residual graphs for the models Opt 1 and Opt 2 are shown in Fig. 7. The residue is the gap between the value that is measured and the value that is predicted by the regression.
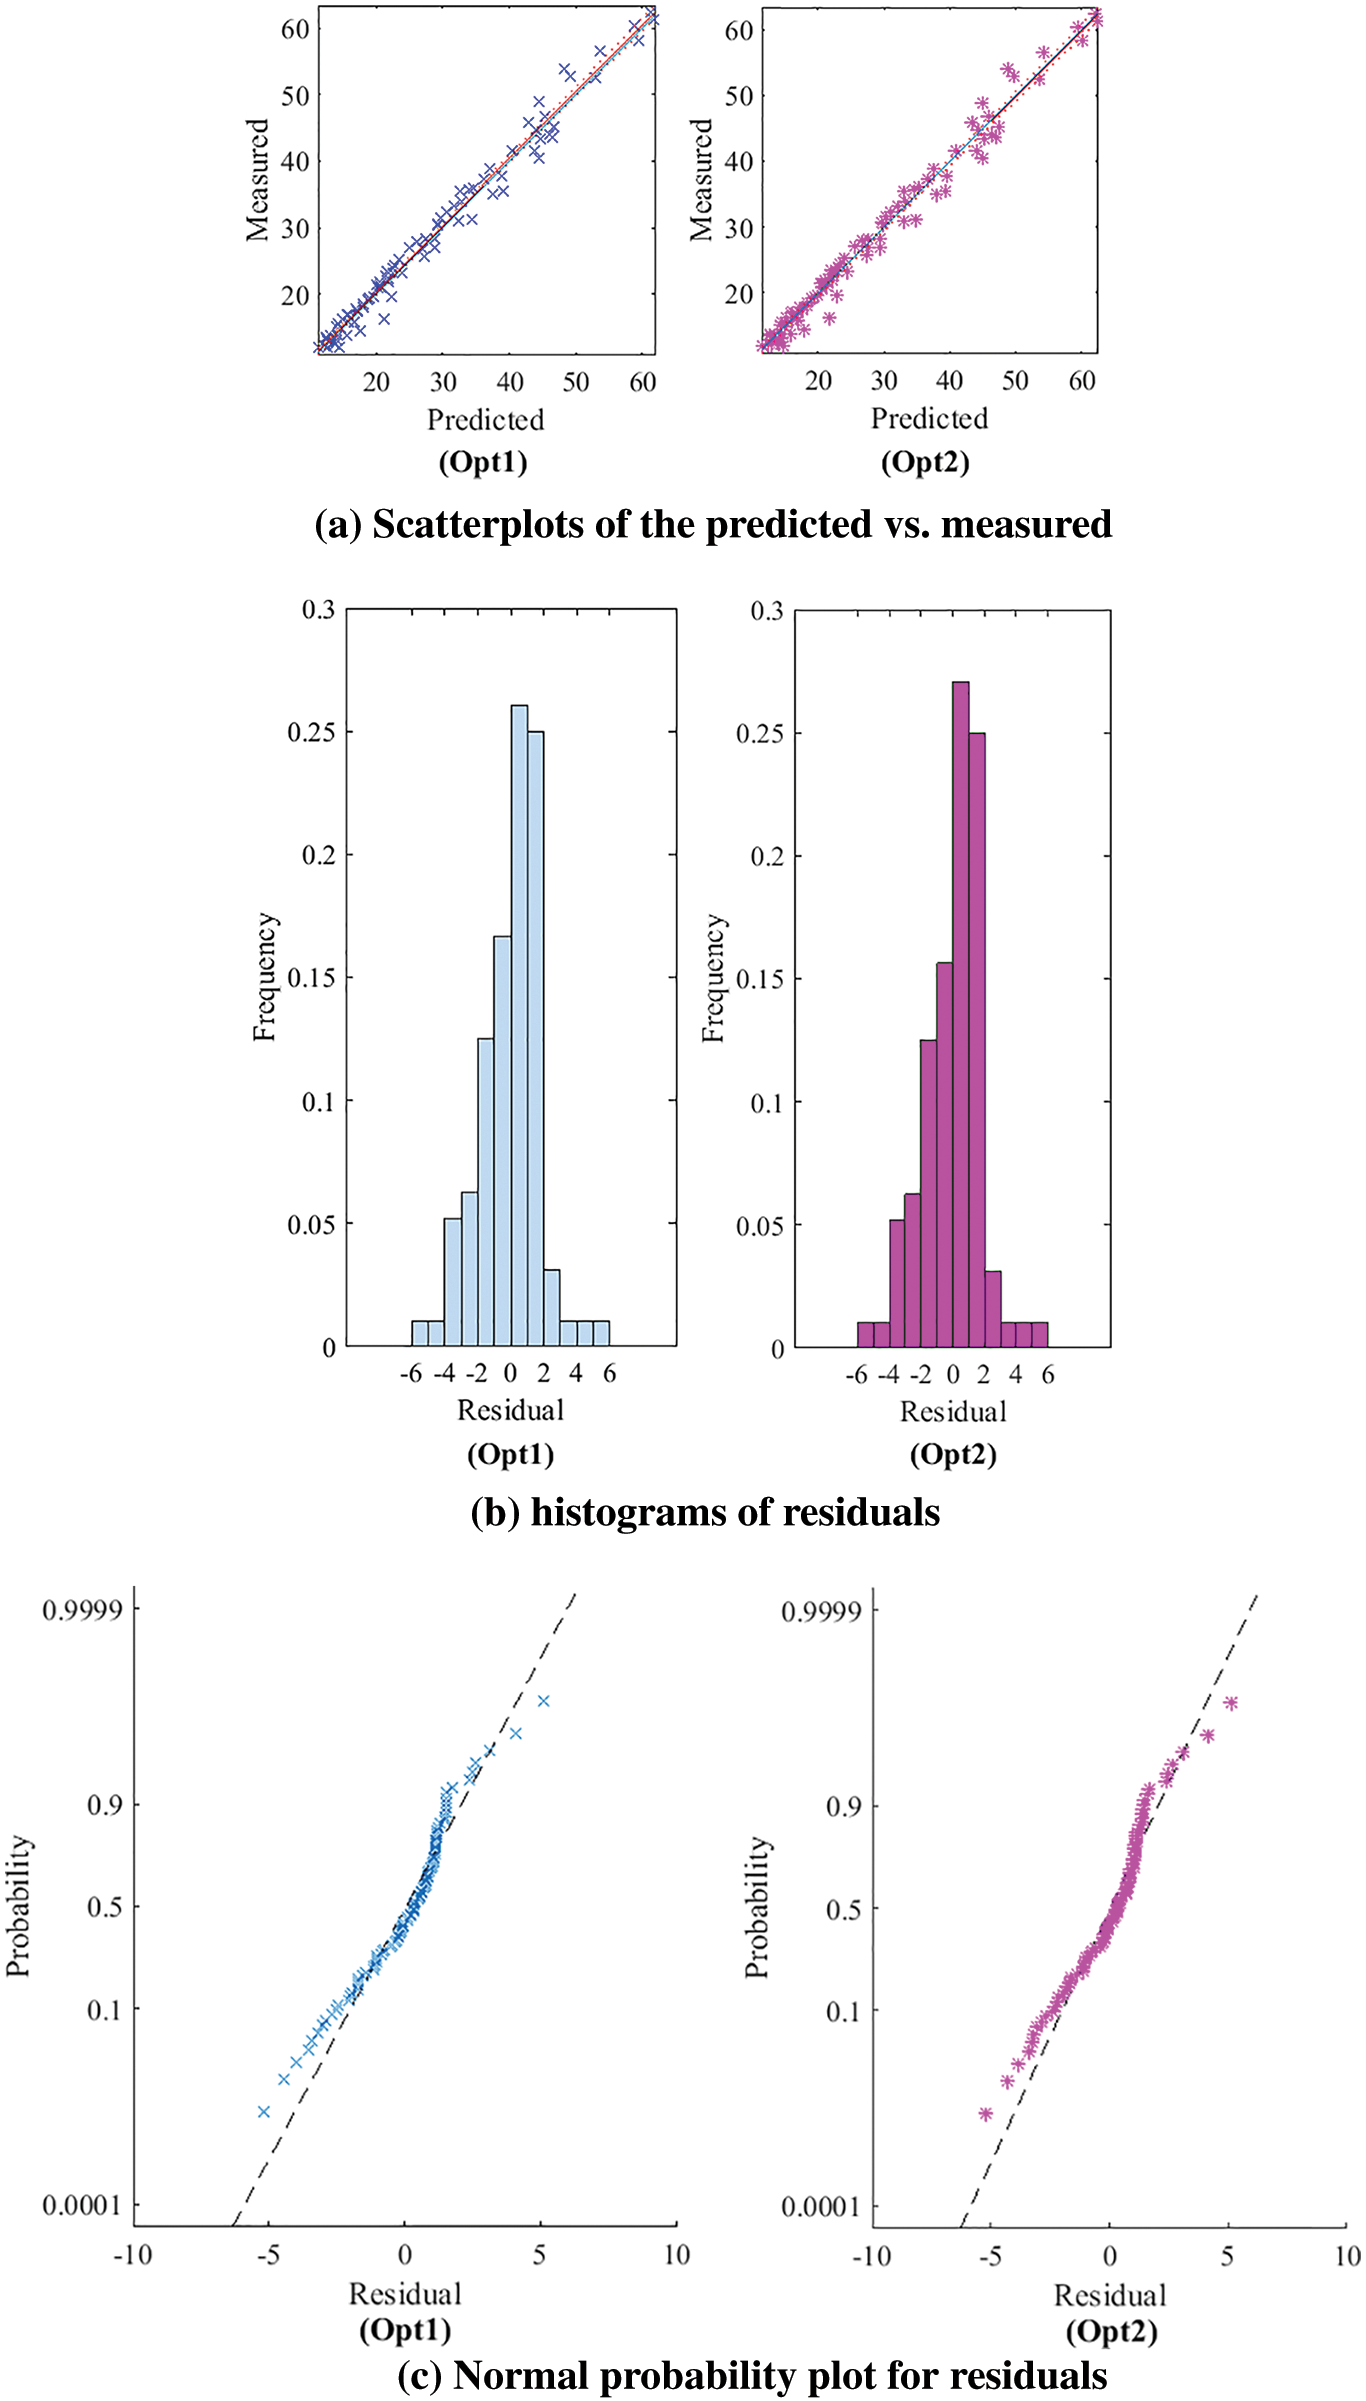
Figure 7: Residual graphs for residuals for the models Opt 1 and Opt 2
Scatterplots of the predicted vs. measured, are shown Fig. 7a, the R-squared and the adjusted R-squared values are the same to 0.983 for Opt 1 and Opt 2. The values show a high dependency and high correlation of the measured values on the predicted values of the response. The predicted values of operating temperature PV module were found to be very close to the measured results.
The residual histograms display the residual distribution for all the observations. The symmetry of the residual histograms (Fig. 7b) show that the errors are normally distributed for Opt 1 and Opt 2.
The verification of the residuals for normality is provided by the normal residual probability plot. The residuals are normally distributed if the points on the graph are close to the straight line. Fig. 7c shows that the models’ residuals are normally distributed.
The residual value curves show that the adjustments obtained are acceptable, since the point clouds follow the theoretical curve. This confirms the reasonableness of the choice of our models.
In this work, PV module temperature models are proposed using constrained minimization based on the field monitored real data. The estimation temperature of PV module and the RMSE of the temperature models change according to weather conditions. The PV module temperature Opt 1 and Opt 2 models presented the smallest of RMSE in HH; LH and LL. Lasnier model has the smallest value of RMSE in HL. PV module temperature models Opt 1 and Opt 2 are closer to the PV module temperature measured for weather conditions HH, LL and LH. Lasnier model is closer to the PV module temperature measured for the weather condition HL.
The PV module temperature Opt 1 and Opt 2 models take the smallest values of RMSE followed by Lasnier and Schoot models for all weather conditions.
The residual value curves show that the adjustments obtained are acceptable, since the point clouds follow the theoretical curve. This confirms the reasonableness of the choice of our models. Models Opt 1 and Opt 2 can be used to estimate PV module temperature for that location and for locations of similar climatic conditions. We are also interested in the sensitivity of weather factors on the PV module temperatures.
Acknowledgement: Ten Merina SA and Senergy PV SA are gratefully acknowledged for supplying the information on the PV solar plants surveyed.
Funding Statement: The authors received no specific funding for this study.
Conflicts of Interest: The authors declare that they have no conflicts of interest to report regarding the present study.
1. Mahachi, T. (2016). Energy yield analysis and evaluation of solar irradiance models for a utility scale solar PV plant in South Africa. South Africa, Stellenbosch University. https://scholar.sun.ac.z. [Google Scholar]
2. Rao, R. R., Mani, M., Ramamurthy, P. C. (2018). An updated review on factors and their inter-linked influences on photovoltaic system performance. Heliyon, 4(9), 1–34. DOI 10.1016/j.heliyon.2018.e00815. [Google Scholar] [CrossRef]
3. Thompson, N. (2015). Limiting effects of temperature on the performance of a Si-PV array in Trinidad and Tobago. Indies, The University of the West Indies. [Google Scholar]
4. McSweeney, C., New, M., et Lizcano, G. (2012). UNDP climate change country profiles Senegal. http://country-profiles.geog.ox.ac.uk/. [Google Scholar]
5. Prilliman, M., Stein, J. S., Riley, D., Tamizhmani, G. (2020). Transient weighted moving-average model of photovoltaic module back-surface temperature. IEEE Journal of Photovoltaics, 10(4), 1053–1060. DOI 10.1109/JPHOTOV.5503869. [Google Scholar] [CrossRef]
6. Rouholaminia, A., Pourgharibshahia, H., Abdolzadehb, M., Fadaeinedjad, R. (2014). Temperature of a photovoltaic module under influence of different environmental conditions-experimental investigation. International Journal of Ambient Energy, 37(3), 266–272. DOI 10.1080/01430750.2014.952842. [Google Scholar] [CrossRef]
7. Andrea, Y., Pogrebnaya, T., Kichong, B. (2019). Effect of industrial dust deposition on photovoltaic module performance: Experimental measurements in the tropical region. International Journal of Photoenergy, 2019, 1–10. DOI 10.1155/2019/1892148. [Google Scholar] [CrossRef]
8. Jaszczur, M., Hassan, Q., Teneta, J., Majewska, E., Zych, M. (2018). An analysis of temperature distribution in solar photovoltaic module under various environmental conditions. MATEC Web of Conferences, 240, 1–6. DOI 10.1051/matecconf/201824004004. [Google Scholar] [CrossRef]
9. Zhou, J., Yi, Q., Wang, Y., Ye, Z. (2015). Temperature distribution of photovoltaic module based on finite element simulation. Solar Energy, 111, 97–103. DOI 10.1016/j.solener.2014.10.040. [Google Scholar] [CrossRef]
10. Kamuyu, W. C. L., Lim, J. R., Won, C. S., Ahn, H. K. (2018). Prediction model of photovoltaic module temperature for power performance of floating PVs. Energies, 11(2), 1–13. DOI 10.3390/en11020447. [Google Scholar] [CrossRef]
11. Jakhrani, A., Othman, A., Rigit, A., Samo, S. (2011). Comparison of solar photovoltaic module temperature models. World Applied Sciences Journal, 14, 1–8, 113821572. [Google Scholar]
12. Schott, T. (1985). Operation temperatures of PV modules: A theoretical and experimental approach. Sixth EC Photovoltaic Solar Energy Conference, pp. 392–396.London, UK. [Google Scholar]
13. Lasnier, F., Ang, T. (1990). Photovoltaic engineering handbook. New York, Adam Hilger. [Google Scholar]
14. Zouine, M., Akhsassi, M., Erraissi, N., Aarich, N., Bennouna, A. et al. (2019). Mathematical models calculating PV module temperature using weather data: Experimental study. Proceedings of the 1st International Conference on Electronic Engineering and Renewable Energy(ICEERE 2018), vol. 519, pp. 630–639. DOI 10.1007/978-981-13-1405-6. [Google Scholar] [CrossRef]
15. Ross, R., Smokler, M. (1986). Flat-plate solar array project final report. Sciences and Reliability, 6, 1012–1125. [Google Scholar]
16. Ross, R. (1976). Interface design considerations for terrestrial solar cells modules. 12th IEEE Photovoltaic Specialist’s Conference, vol. 7, no. 10, pp. 801–806.Baton Rouge, LA, USA. [Google Scholar]
 | This work is licensed under a Creative Commons Attribution 4.0 International License, which permits unrestricted use, distribution, and reproduction in any medium, provided the original work is properly cited. |