| Fluid Dynamics & Materials Processing |
DOI: 10.32604/fdmp.2022.022057
ARTICLE
Production of Wood Fibers from Thermally Treated Wood
Université de Lorraine, INRAE, LERMAB, ERBE, Epinal, F-88000, France
*Corresponding Author: Maximilien Gibier. Email: maximilien.gibier@univ-lorraine.fr
Received: 18 February 2022; Accepted: 21 March 2022
Abstract: The reduction of the hygroscopicity of wood fibers was investigated through a Thermal Treatment (TT) on wood chips performed before the defibering process. The TT and defibering tests were both carried out on a continuous pilot at semi-industrial scale. The thermal treatment study of wood chips, equivalent to a low temperature pyrolysis, was achieved for four conditions (280°C–320°C) for a duration of 10 min. Mass quantification of solids, condensables and gases (FTIR) at the outcome of the thermal treatment allowed to achieve the mass balances for each condition. The increase of the reactor temperature from 280°C to 320°C leads to a lower solid yield (94%–82%) while gaseous (1%–3.8%) and condensable (3%–11%) products increase significantly. Thermally treated wood samples were afterwards successfully defibered in different conditions to produce suitable fibers for insulation panel production. The aim of the study is also to evaluate the effects of the TT on the lowering of energy consumption necessary for the defibering process while producing good quality fibers. Energy consumption during defibering process shows a significant decrease with the increase the TT severity. Fiber morphology is affected by TT and the morphological quality of the fibers decreases as TT severity increases. The mass percentage of dust was also quantified as a quality marker of produced fibers. Measurements of equilibrium moisture (at 20°C and 65% RH) of the different materials (wood chips before and after TT, produced fibers) show a significant effect of the TT on wood chips hygroscopicity (8.2% for untreated wood to 4.1% for TT at 320°C). However, the effect of the TT on the hygroscopicity reduction of thermally treated wood fibers is drastically less significant due to breaking of the wood structure during defibering process.
Keywords: Wood; fibers; thermal treatment; defibering process; hygroscopicity; energy consumption; fibers properties improvement
Nomenclature
| Ci(X) | Concentration of the gas X for the ith measure |
| Di(X) | Size distribution (%wt) with the ith sieve size of the X sample |
| EMC | Equilibrium moisture content (%) |
| MX | Mass of the component X (g) |
| MB | Mass balance (%) |
| MDF | Medium density fiberboard |
| QX | Flow of the gas X (L/min at STP) |
| SEM | Scanning electron microscopy |
| t | Sampling time (s) |
| TT | Thermal treatment |
| TTP | Thermal treatment process |
| V(X) | Volume of the X gas produced (L at STP) |
| ηsolid | Solid yield (%wt) |
| 280C | Wood sample thermally treated at 280°C |
| 295C | Wood sample thermally treated at 295°C |
| 310C | Wood sample thermally treated at 310°C |
| 320C | Wood sample thermally treated at 320°C |
Natural fibers are a solution to energy and environmental problems caused by global warming, highlighting its renewability, biodegradability and the abundance of resources [1]. Wood fibers are widely used in several applications such as polymer reinforcement, insulation panels, MDF, etc. [2]. Despite many advantages, wood has some drawbacks due to its hygroscopic behavior. The hygroscopicity of wood leads to a decrease in dimensional stability, insulation performance, and durability against fungi [3–6]. One well-known method to limit this hygroscopic behavior is the Thermal Treatment Process (TTP), similar to torrefaction or low-temperature pyrolysis, which allows improving some physical properties.
TTP occurs between 180°C and 340°C at atmospheric pressure, in the absence of oxygen [7,8]. Various papers have been published about TTP for different issues such as energy [5,7,9–11] and material applications (wood used in construction field [12–15] and wood composites [16–19]). The evolution of wood properties after Thermal Treatment (TT) is induced by chemical modifications depending on the treatment severity (combination of two parameters, namely, temperature level and duration [20]). The TTP makes the wood’s color darken [4,5], affects mechanical properties [6,12,21], and therefore decreases the energy necessary for grinding [8,9,11,21–24]. It has also been shown that TTP affects the polarity of wood leading to a best compatibility of wood with thermoplastic (non polar materials) which allows to avoid utilization of coupling agent (i.e., maleic acid) in wood plastic composite [16–19,25]. The thermally treated wood loses its fibrous structure when exposed to a severe treatment [22]. The reduction of the fibrous and tenacious nature of wood mainly results from the degradation of hemicelluloses matrix and cellulose depolymerization [3]. Therefore, less energy is required for the defibering process which leads to more brittle and shorter fibers.
Water in wood is located in two different places: in the cell cavities as free water and the cell walls as bound water. Bound water is attracted by wood constituents that contain hydroxyl groups through hydrogen bonding. Free hydroxyl groups are mainly located in hemicellulose chains and the non-crystalline region of the cellulose. During the TTP, the crystallinity index of cellulose increases [3,26]. Hemicelluloses are the most impacted molecule under 250°C [27], with the appearance of dehydration and depolymerization reactions [8,26,27]. At this temperature level, a decomposition of hydroxyl groups easily accessible to water occurs, mostly releasing condensables and gases such as CO and CO2. In a previous study, Windeisen et al. [28] showed a decrease in hydroxyl and acetyl groups (responsible for the acetic acid formation) contents in the wood after a TTP at 180°C–220°C for 4 to 6 h. Thereby, wood loses a part of its hydrophilic nature, and its durability against fungi is improved. The Equilibrium Moisture Content (EMC) is significantly reduced (by 30%–40% at 280°C for 15–60 min) [29].
Overall, it can be assumed that the effect of the TTP of wood and wood fibers/flour on different characteristics (hygroscopicity, color, mechanical properties, grindability, compatibility with polymers…) is widely studied and described in literature. Nevertheless, it still remains a lack of information regarding the quality of fibers produced from thermally treated wood neither on the effect of the defibering process on the hygroscopic behavior of wood fibers.
The aim of the present study was therefore to analyze a global process including two steps, TTP and defibering process, in order to evaluate the feasibility and the interest of the TTP as an industrial improvement way of fibers quality (hygroscopicity reduction) and to reduce the defibration energy. Products yields (solid, condensable, gas) and energy consumption were measured during TTP whereas measurement of defibering energy consumption was performed during defibering tests. Finally, the impact of the TTP on the hygroscopic behavior of raw and thermally treated wood chips and wood fibers as well as on the wood grindability and on the fibers quality were evaluated and discussed. Moreover, all experiments were performed on continuous pilot at middle scale (>5 kg/h), allowing to collect more reliable technical data suitable for upscaling analysis.
2.1.1 Thermal Treatment Process
Spruce wood chips (48% in moisture content) from the industrial PAVATEX (wood fiber insulation panels producer) were used as the test material in this study. Wood chips (≈25 kg per test) were oven-dried for one week at 80°C ± 5°C.
Samples used for the defibering process were virgin spruce wood chips and thermally treated wood chips at different temperatures (280°C, 295°C, and 320°C).
TTs of spruce chips were carried in a continuous middle-scale screw reactor-based at LERMAB in Epinal (France). The reactor allows to perform TTs up to 400°C for a period of up to 30 min. The matter flow rate is fixed at 4 kg/h for wood chips to keep a good homogeneity of the treatment and not overload the screw. Tests were performed at 280°C, 295°C, 310°C, and 320°C for a residence time of 10 min. These temperatures were used as set points for the four independent heating elements. Experimental sample temperature history is continuously measured during tests with four thermocouples placed along the screw in the middle of each heating zone. Fig. 1 shows the TT device.
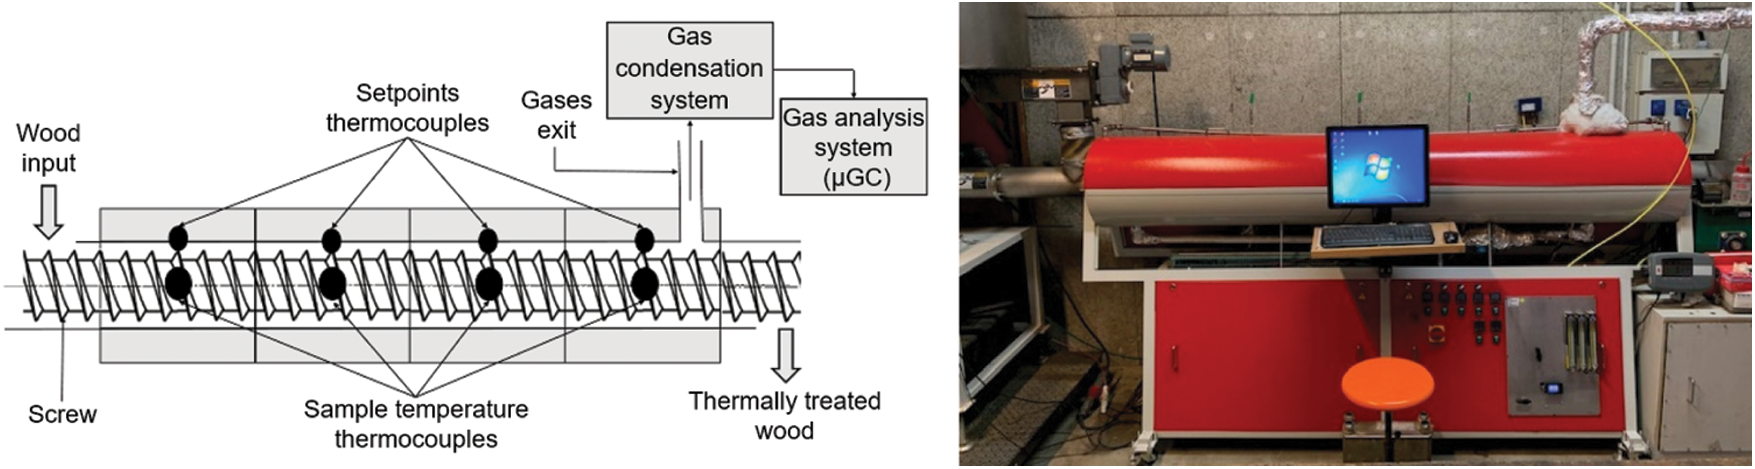
Figure 1: Sketch and picture of the screw reactor device
The reactor is sealed and TTs were carried out under a nitrogen flow (5 L/min at STP). The following physical values were measured for each test to carry out mass balances: input and output mass, the composition of the gases (μGC), the total flow of gas (volumetric flowmeter), treatment temperatures, etc. The mass balance of the experiment was calculated using Eq. (1):
In the equation above, MTT is the mass (kg) of the wood chips thermally treated collected, Mgas is the mass (kg) of produced gases, Mcond is the mass of condensables collected and MWood is the input mass (kg) of dry wood chips. Mass balance is close to 100% for each test. However, the ‘missing matter’ in the balance is related to the condensation and deposition of condensables in the process at cold spots. The solid yield ηsolid (%wt) of the experiment was calculated using Eq. (2):
The gases (mix of carrier gas and produced gases) were sent through a gas condensation system to trap condensables and particles. Clean and dry gases are then analyzed with a μGC (SRA INSTRUMENTS Gas Analyzer R-3000) which is regularly calibrated using gas standards bottles for following gases: CO, CO2, CH4, C2H2, C2H4 and C2H6. The values of concentrations of the different gases as a function of time given by the gas analyzer were used to evaluate the volume of gases produced during experiments following expression (3):
In Eq. (3), V(X) is the volume of the gas X produced during the experiment (L at STP), n is the number of measures, Ci(X) is the concentration of the gas X for the ith measure given by μGC analysis (%),
Defibering tests were carried out at the FCBA located in Grenoble (France) on a mechanical defibering pilot (20 kg/h) from ANDRITZ. Fig. 2 shows the mechanical defibering pilot.
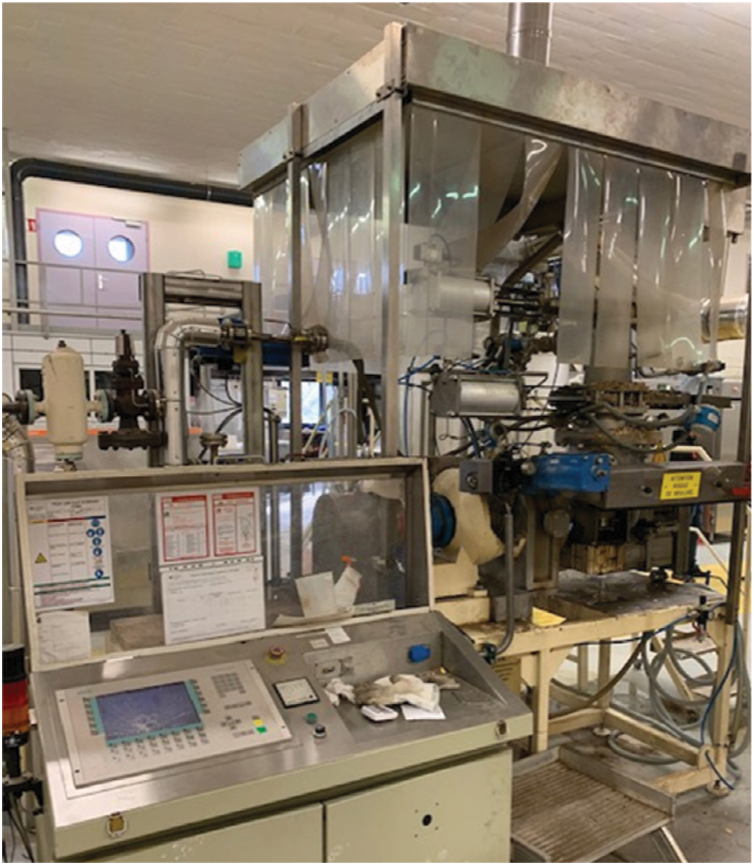
Figure 2: Defibering pilot
Untreated wood and thermally treated wood (280°C, 295°C, and 320°C) were defibered (≈20 kg/sample). During defibering tests, the energy required for defibration is measured. Fibers morphology depends on the discs’ airgap of the refiner. The smaller the airgap, the more the fiber is defibered, and the higher the power consumed by the pilot is. The airgap was adjusted for every sample of wood thermally treated to obtain fibers with approximately the same morphology (valued by an experienced technician from FCBA). The airgap needed to be adjusted due to changes in wood properties caused by the TTP.
Wood samples were firstly oven-dried at 103°C for 48 h and weighed with a three digits’ balance. Samples were then placed in a climatic chamber at 20°C and 65% RH for 14 days (until EMC is reached). The moisture recovery test is done on untreated/treated wood chips and produced fibers three times for each sample to obtain reproducibility between measures. EMC (%) was calculated using expression (4):
Meq is the mass of the sample at equilibrium and Mdry is the mass of the dry sample (g).
2.6 Particle Size Quality and Particle Size Contents
The wood fibers particle size was measured with a mechanical sieve (RETSCH AS200) to evaluate the size of fibers. The different sieves sizes used are 3.5, 1.7, 1 mm, 850, and 500 μm. About 10 grams of each sample of dry fibers were weighed and placed in the mechanical sieve for 10 min. The content of each sieve was weighed. The experiment was repeated three times for each sample for repeatability. The size distribution was calculated as a mass percentage with the expression (5):
Di(X) is the size distribution (%wt) with the ith sieve size of the X sample, Mi is the mass (g) of the ith sieve content, and M(X) is the mass that was introduced in the mechanical sieve.
The morphology of fiber surface was also examined in this study using Scanning Electron Microscopy (SEM) analysis (Hitachi TM3000).
The TT temperature at the heart of the reactor (closest to the matter) is measured for each heating zone. The treatment temperature is lower than the set temperature due to wood heating, heat losses and the coolers located on either side of the reactor. The treatment temperature remains stable during the test in each heating zone and is reported in Fig. 3.
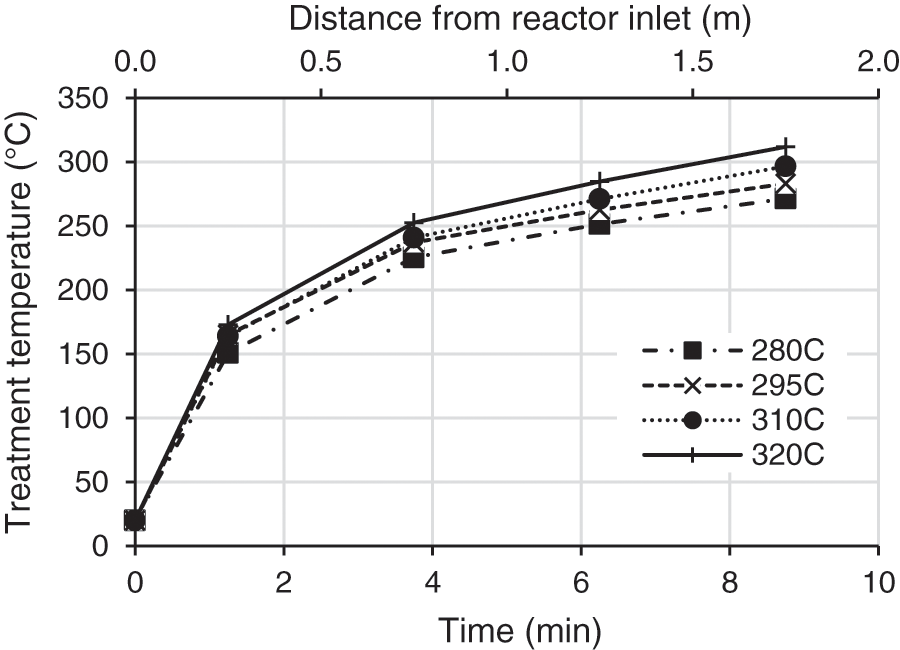
Figure 3: Temperature of wood as a function of time and distance from reactor inlet during the TT
The final treatment temperature varies from 270°C for a set point of 280°C to 313°C for a set point of 320°C. The standard deviation for the four heating zones is approximately 10°C, 6°C, 3°C, and 2°C respectively from the first to the fourth zone. The outcome of each test showed that the size of wood chips decreases and that wood color darkens by increasing the temperature due to the degradation reactions on hemicelluloses and the oxidation of wood products such as quinones [4,5]. Wood chips are transported in the reactor by a screw that crushes them to a smaller size. Grindability of wood is improved by TT, in accordance with results found in the literature [8,9,11,21–24]. The homogeneity of the treatment was evaluated by cutting wood samples and checking the homogeneity of the in-depth coloration.
Mass balances for each experiment are obtained by the method described in the TT pilot part. Fig. 4 shows the influence of the temperature on the distribution of the product during TTP. Since solid is the major product (i.e., Fig. 4a), Fig. 4 has been resized (Fig. 4b) by fixing the beginning value of the vertical axis at 75% to improve the readability of the graph.
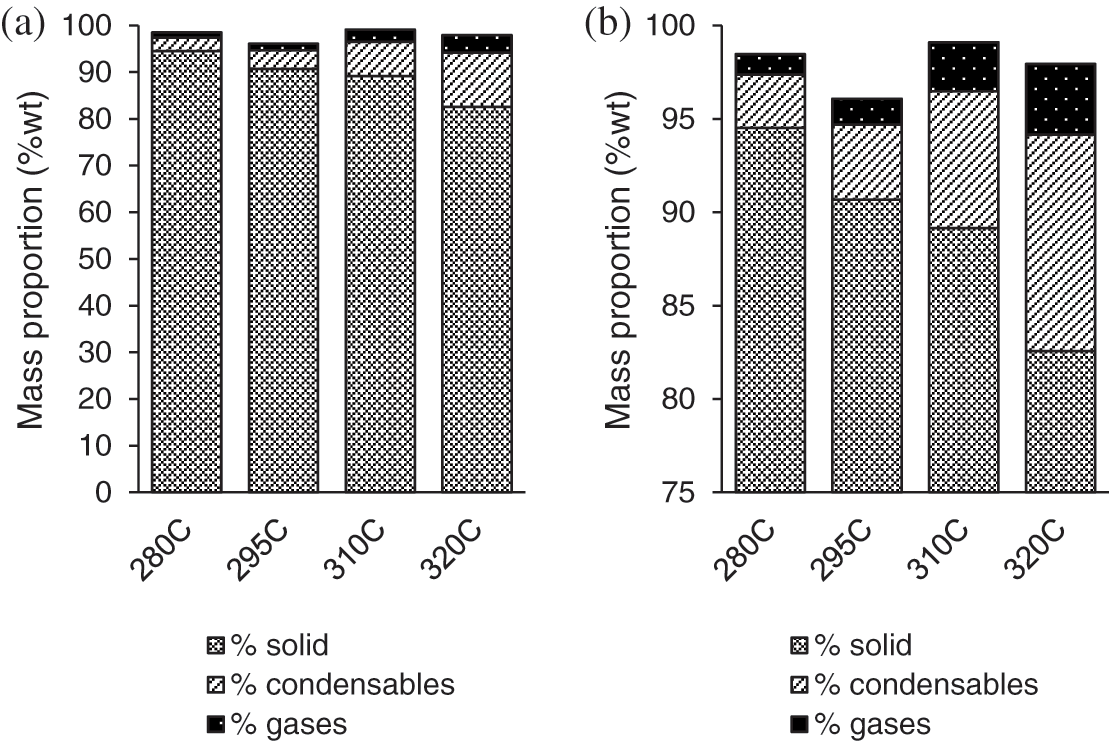
Figure 4: Evolution of wood products during TT of spruce chips at different temperatures
First of all, the global mass balance for the different experiments is in the range of 96% to 99% showing the accuracy of the results.
The increase of the TTP severity conducts to lower the solid yield in favor of condensables and gases products:
• Condensables gases are composed of water and many organic condensables such as acetic acid, furfural, formic acid, methanol, lactic acid and phenol, resulting from the degradation of cellulose and hemicelluloses [8,26–28,30];
• Non-condensables gases are mainly composed of CO and CO2. Light hydrocarbons (CH4, C2H2, C2H4, C2H6) and H2 are also produced as traces (less than 0.02% compared with total gas production).
When the treatment temperature increased from 280°C to 320°C, the solid yield decreased from 94% to 82% and the production of gases and thus condensables increased from 1% to 3.8% and 3% to 11%, respectively. These results are in complete agreement with the literature [8,11].
Volumes produced of the different gases during the treatment were acquired by the method described in the gas analysis part. As shown in Fig. 5a, the molar proportion of CO increased with TTP temperature to the detriment of CO2 content. Nevertheless, Fig. 5b shows that CO and CO2 gas flow increased with TTP severity. Indeed, an increased temperature leads to favor the degradation of hemicelluloses and more particularly the hydroxyl groups accessible to bound water [27].
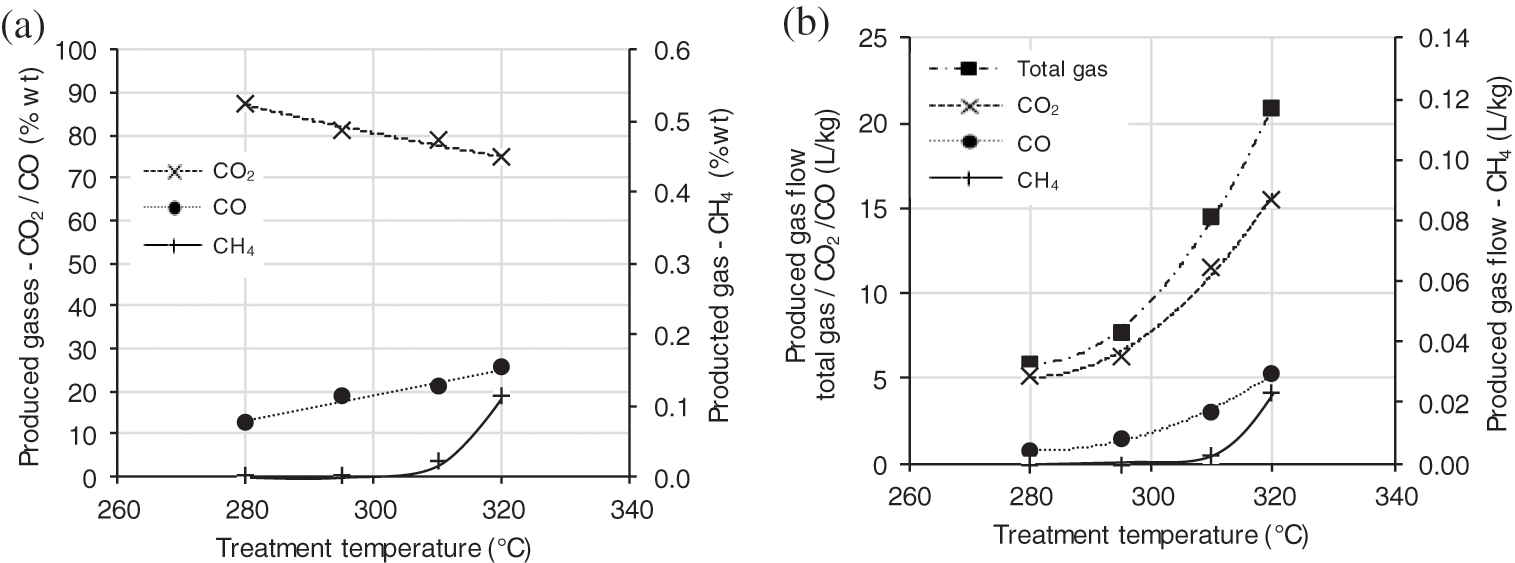
Figure 5: Evolution of gases production during TT of spruce chips as a function of temperature (with (a) in %wt and (b) in L/kg)
A slight amount (0.02%) of CH4 gas is detected from a temperature level of 310°C and goes up to 0.12% at 320°C. At this temperature level and for a short residence time, it can be deduced that only hemicelluloses start to be depolymerized. The decomposition of cellulose and lignin occurs at temperatures above 330°C [27].
To evaluate energy consumption during TTP according to temperature, a reference measurement was introduced for each condition. Indeed, before each experiment, the total power supply for heating elements was recorded two hours before beginning tests (“Power reference” curve). As expected, the power required to maintain the reactor temperature is dependent of the temperature and increases from 630 to 770 W between 280°C and 320°C (i.e., Fig. 6). During tests, the power needed to maintain the reactor temperature is recorded (“Power test” curve). The power needed for TTP was afterwards obtained by difference following Eq. (6):
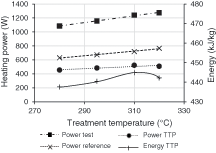
Figure 6: Heating power and energy delivered to wood during TT tests
The energy needed for TTP (“Energy TTP” curve) is then expressed in kJ/kg by dividing the “Power TTP” curve by the dry inlet biomass flow.
It can be observed that energy required for the TTP is temperature dependent and is in the range of 440 to 450 kJ/kg. These values are slightly lower than the one described by Colin [31] in the range of 520 to 550 kJ/kg for the same biomass mass loss. It also appears that TTP energy decreases slightly between 310°C and 320°C which could be attributed to exothermicity of biomass pyrolysis at higher temperature as ever referred in literature [32]. Nevertheless, values for biomass pyrolysis enthalpy reported in literature are widely variable [33–36] which does not allow to compare our results.
The energy needed for defibering process was also recorded during experiments and are reported in Fig. 7. The results show a drastic decrease from 720 kJ/kg (untreated wood) to 133 kJ/kg (TT at 320°C), showing the positive and very significant effect of TTP ever reported in literature [21–23]. A reduction of 24%, 33%, and 81% in power defibering consumption is measured during the defibration of wood samples treated respectively at 280°C, 295°C, and 320°C. For comparison, Colin et al. [11] reported a decrease of 82% in the energy required for at a mass loss of 25%, which is close to the 18% mass loss obtained with TT conditions of 320°C. This drastic reduction in defibering energy consumption is due to the extensive degradation of wood mechanical properties through to TTP [6,12,21]. The thermal degradation of hemicelluloses matrix and cellulose depolymerisation leads to the reduction of the fibrous and tenacious nature of wood [3,22].
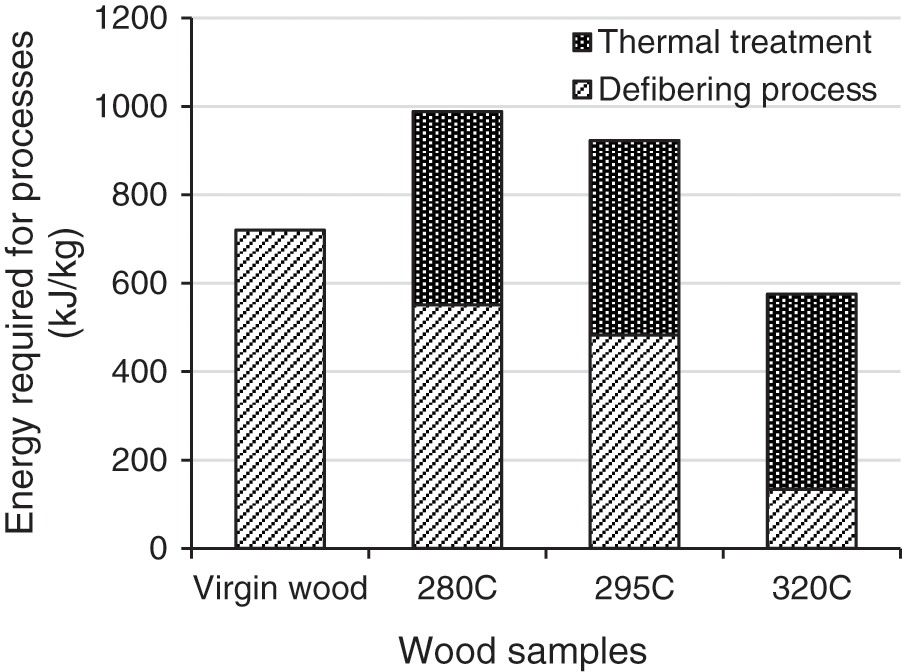
Figure 7: Energy required for defibering and TT processes as a function of temperature
In order to evaluate the interest of the TTP to save defibering energy, the sum of energies required for both steps are reported in Fig. 7. It clearly appears that only the higher TT severity allows to save energy.
3.5 Particle Size of Wood Fibers
Particle size of wood fibers samples was measured using a mechanical sieve to assess fibers quality. Fig. 8 shows the particle size distribution of wood fibers after the mechanical sieve process. This method is not optimal for the characterization of wood fibers because fibers fall vertically into the lower sieve floor but it can give an idea of fine particles content. Fibers morphology will be characterized more finely later.
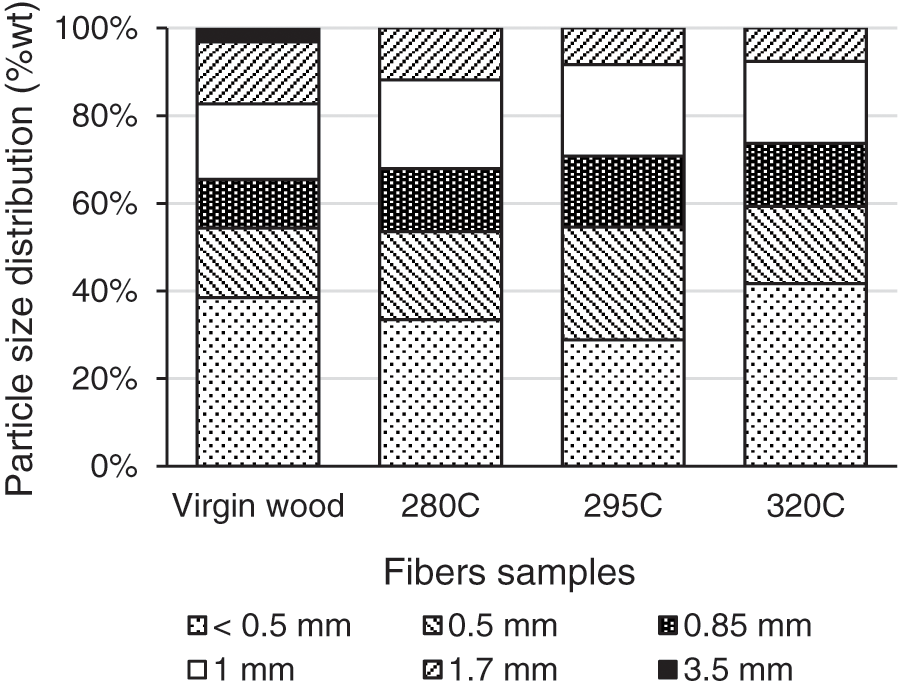
Figure 8: Particle size distribution of wood fibers with different sizes of sieves
At first, it can be seen in Fig. 8 that the particle size lower than 0.5 mm decreased from 38% for virgin fibers to 33% and 29% for wood treated at 280°C and 295°C. The particle size lower than 0.5 mm was about 42% for wood treated at 320°C. These results have to be qualified by visual observations. Indeed, in the case of virgin wood, particle size lower than 0.5 mm are represented by fine fibers of almost 1 mm length, whereas in the case of TT material, fibers are less observed in favor of dust (shorter length/width ratio). A second results which is observed is the reduction of the longest fibers proportion with the severity of the TTP. Fibers longer than 3.5 mm are no more present in fibers produced from TT material. This phenomenon can easily be explained by the reduction of mechanical properties and flexibility of wood with TTP, as described in the literature [8,9,11,21–24].
3.6 Equilibrium Moisture Content
The EMC of wood chips and fiber samples stabilized at 20°C and 65% RH was measured and the results obtained were summarized in Fig. 9. The EMC of wood chips decreased steadily from 8.2% for untreated wood to 4.1% at 320°C. It can be related to the depolymerization of carbohydrates, which reduces the amount of hydroxyl groups contained in holocellulose as the temperature of the TT increases [12,26–28]. In addition, the relative increase in the proportion of crystalline cellulose complicates the accessibility to water of hydroxyl groups [3,26]. Belgacem et al. [26] also assumed that repolymerization of lignin can reduce water accessibility on hydroxyl groups through increased cross-linking between lignin molecules.
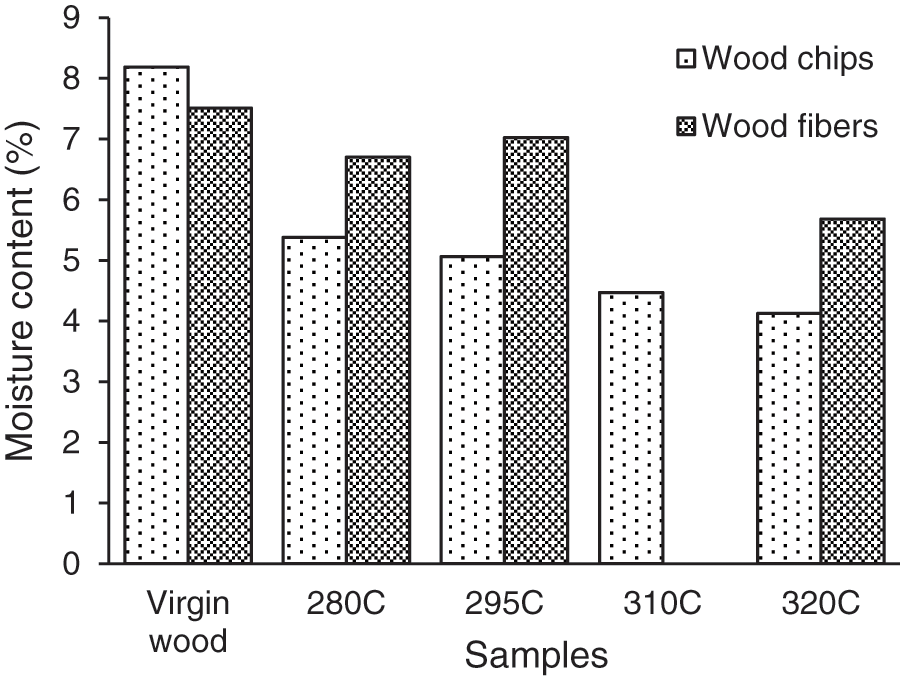
Figure 9: EMC of wood chips and fibers stabilized at 20°C 65% RH
EMC values of fibers produced from virgin wood and the virgin wood show quite similar results which was expected. For treated samples, it appears that defibering process leads to an increase of the material hygroscopicity since fibers EMC is higher than the one of the TT chips in the same conditions. It therefore shows that defibering process limits the positive effect of the TT on the hygroscopicity reduction. This point can be attributed to the fact that defibering process leads to the appearance of new accessible hydroxyl groups.
Fig. 10 shows a SEM picture of fibers obtained from TT wood chips at 295°C. It highlights the completely destructured surface of the fibers. It is therefore assumed that the lignin layer (obtained by repolymerization of lignin during TT [26]) on the surface of TT wood chips is destructured during the defibering process, leading to a redistribution of hydrophilic groups of the secondary wall of fiber cells, making the surface more hydrophilic. Moreover, the degradation of the fiber structure provides a higher porosity, which is also favorable for water adsorption.
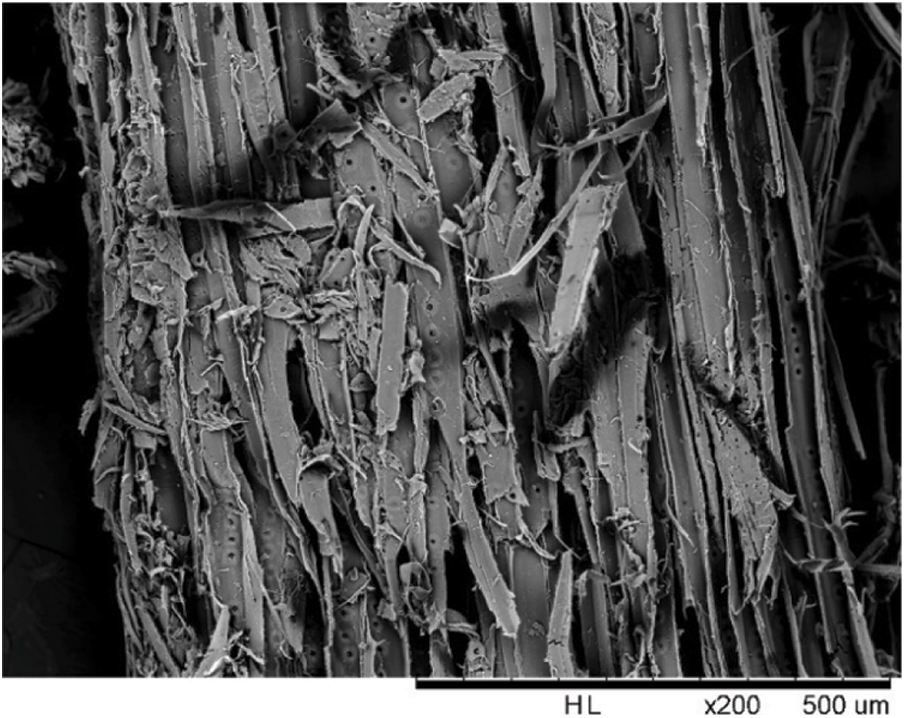
Figure 10: SEM picture (×200) of TT fibers surface (295°C)
In this study, the TT of wood chips was performed on a middle scale pilot (>5 kg/h) with a TT duration of 10 min for each temperature condition. The accuracy of the obtained results regarding gas analysis and pyrolysis product distribution was validated by mass balance calculation (in the range of 96% to 99%). The increase of the reactor temperature from 280°C to 320°C leads to a lower solid yield (94%–82%) while the gaseous (1%–3.8%) and condensable (3%–11%) products increase significantly. The main gaseous product after liquid condensation is represented by CO2 and CO being present in lower quantities.
The thermally treated wood chips were then defibered in a middle scale pilot (20 kg/h) to confirm the feasibility of fiber production from TT material. The energy consumption of both steps was measured. The energy required for TTP increases slightly with TT severity, from 440 to 450 kJ/kg. Energy required for the defibering process decreases drastically with TT severity. A decrease of 24%, 33%, and 81% is calculated for TT of 280°C, 295°C, and 320°C, respectively. The evaluation of the global two-step process energy consumption reveals that only the most severe conditions allow to save energy. The analysis of the size distribution shows a global decrease in fibers size with the TT severity. The most severe treatment leads to the production of short length fibers, mainly composed of dust and probably more suitable for WPC production than for applications like MDF or insulation panels. The measurement of the hygroscopicity of the produced materials reveals the positive effect of TT on wood chips EMC, which decreases from 8.2% for untreated wood to 4.1% for TT at 320°C (after storage at 20°C and 65% RH). Nevertheless, it also observed that defibering process leads to an increase of hygroscopicity of fibers because of degradation of the wood structure and the appearance of new hydroxyl groups on the fiber surface. Only the highest TT severity improves significantly the hygroscopicity in comparison with untreated fibers.
The initial main objectives of TTP studied in this paper were the reduction of fiber hygroscopicity of as well as the saving of energy consumption of the defibration step. Results obtained reveal that only the TT at 320°C allow to reach these targets. Nevertheless, the fibers produced under these conditions do not seem to be suitable for MDF or insulation panel applications because of their too short length. Considering these results, the interest of TTP for wood fiber improvement is more relevant for WPC production than for applications such as MDF or insulation panels, especially since the TTP leads also to the improvement of wood compatibility with thermoplastic polymers. The future path of this study is to investigate the production of reinforced WPC with TT fibers produced under high severity conditions.
Acknowledgement: This study was realized thanks to the financial support of the French Region “GrandEst” and the financial and technical support of LERMAB, mainly Stéphane AUBERT for his technical support to build the thermal treatment reactor and the software for regulation and data loggins. LERMAB is supported by a grant overseen by the French National Research Agency (ANR) as part of the “Investissements d’Avenir” Program (ANR-11-LABX-0002-01. Lab of Excellence ARBRE) and is part of ICEEL.
Funding Statement: The financial support was provided by Grand Est Regional Council.
Conflicts of Interest: The authors declare that they have no conflicts of interest to report regarding the present study.
1. Monteiro, S. N., Lopes, F. P. D., Ferreira, A. S., Nascimento, D. C. O. (2009). Natural-fiber polymer-matrix composites: Cheaper, tougher, and environmentally friendly. JOM, 61(1), 17–22. DOI 10.1007/s11837-009-0004-z. [Google Scholar] [CrossRef]
2. Irle, M., Barbu, M. C., Niemz, P., Carvalho, L. H. (2010). Wood-based panels: An introduction for specialists. England: Brunel University Press. [Google Scholar]
3. Pelaez-Samaniego, M. R., Yadama, V., Lowell, E., Espinoza-Herrera, R. (2013). A review of wood thermal pretreatments to improve wood composite properties. Wood Science and Technology, 47(6), 1285–1319. DOI 10.1007/s00226-013-0574-3. [Google Scholar] [CrossRef]
4. Tjeerdsma, B. F., Boonstra, M., Pizzi, A., Tekely, P., Militz, H. (1998). Characterisation of thermally modified wood: Molecular reasons for wood performance improvement. Holz Als Roh-Werkstoff, 56(3), 149–153. DOI 10.1007/s001070050287. [Google Scholar] [CrossRef]
5. Esteves, B., Pereira, H. (2009). Wood modification by heat treatment: A review. BioResources, 4(1), 370–404. DOI 10.15376/biores. [Google Scholar] [CrossRef]
6. Kamdem, D. P., Pizzi, A., Jermannaud, A. (2002). Durability of heat-treated wood. Holz als Roh-und Werkstoff, 60(1), 1–6. DOI 10.1007/s00107-001-0261-1. [Google Scholar] [CrossRef]
7. Dahlquist, E. (2013). Technologies for converting biomass to useful energy: Combustion, gasification, pyrolysis, torrefaction and fermentation. Netherlands: CRC Press. [Google Scholar]
8. Ciolkosz, D., Wallace, R. (2011). A review of torrefaction for bioenergy feedstock production. Biofuels Bioproducts and Biorefining, 5(3), 317–329. DOI 10.1002/bbb.275. [Google Scholar] [CrossRef]
9. Deng, J., Wang, G., Kuang, J., Zhang, Y., Luo, Y. (2009). Pretreatment of agricultural residues for co-gasification via torrefaction. Journal of Analytical and Applied Pyrolysis, 86(2), 331–337. DOI 10.1016/j.jaap.2009.08.006. [Google Scholar] [CrossRef]
10. van der Stelt, M. J. C., Gerhauser, H., Kiel, J. H. A., Ptasinski, K. J. (2011). Biomass upgrading by torrefaction for the production of biofuels: A review. Biomass Bioenergy, 35(9), 3748–3762. DOI 10.1016/j.biombioe.2011.06.023. [Google Scholar] [CrossRef]
11. Colin, B., Dirion, J. L., Arlabosse, P., Salvador, S. (2017). Quantification of the torrefaction effects on the grindability and the hygroscopicity of wood chips. Fuel, 197, 232–239. DOI 10.1016/j.fuel.2017.02.028. [Google Scholar] [CrossRef]
12. Boonstra, M. J., Acker, J., Tjeerdsma, B. F., Kegel, E. V. (2007). Strength properties of thermally modified softwoods and its relation to polymeric structural wood constituents. Annals of Forest Science, 64(7), 679–690. DOI 10.1051/forest:2007048. [Google Scholar] [CrossRef]
13. Bourgois, J., Guyonnet, R. (1988). Characterization and analysis of torrefied wood. Wood Science and Technology, 22(2), 143–155. DOI 10.1007/BF00355850. [Google Scholar] [CrossRef]
14. Dagbro, O. (2016). Studies on industrial-scale thermal modification of wood (Ph.D. Thesis). Luleå University of Technology, Sweden. [Google Scholar]
15. Boonstra, M. (2008). A two-stage thermal modification of wood (Ph.D. Thesis). Nancy 1, France. [Google Scholar]
16. Follrich, J., Müller, U., Gindl, W., Mundigler, N. (2010). Effects of long-term storage on the mechanical characteristics of wood plastic composites produced from thermally modified wood fibers. Journal of Thermoplastic Composite Materials, 23(6), 845–853. DOI 10.1177/0892705710369042. [Google Scholar] [CrossRef]
17. Follrich, J., Müller, U., Gindl, W. (2006). Effects of thermal modification on the adhesion between spruce wood (Picea abies Karst.) and a thermoplastic polymer. Holz als Roh-und Werkstoff, 64(5), 373–376. DOI 10.1007/s00107-006-0107-y. [Google Scholar] [CrossRef]
18. Arwinfar, F., Hosseinihashemi, S. K., Latibari, A. J., Lashgari, A., Ayrilmis, N. (2016). Mechanical properties and morphology of wood plastic composites produced with thermally treated beech wood. BioResources, 11(1), 1494–1504. DOI 10.15376/biores.11.1.1494-1504. [Google Scholar] [CrossRef]
19. Kaboorani, A., Faezipour, M., Ebrahimi, G. (2008). Feasibility of using heat treated wood in wood/thermoplastic composites. Journal of Reinforced Plastics and Composites, 27(16–17), 1689–1699. DOI 10.1177/0731684407084207. [Google Scholar] [CrossRef]
20. Rousset, P., Davrieux, F., Macedo, L., Perré, P. (2011). Characterisation of the torrefaction of beech wood using NIRS: Combined effects of temperature and duration. Biomass Bioenergy, 35(3), 1219–1226. DOI 10.1016/j.biombioe.2010.12.012. [Google Scholar] [CrossRef]
21. Repellin, V., Govin, A., Rolland, M., Guyonnet, R. (2010). Energy requirement for fine grinding of torrefied wood. Biomass Bioenergy, 34(7), 923–930. DOI 10.1016/j.biombioe.2010.01.039. [Google Scholar] [CrossRef]
22. Phuong, L. X., Shida, S., Saito, Y. (2007). Effects of heat treatment on brittleness of styrax tonkinensis wood. Journal of Wood Science, 53(3), 181–186. DOI 10.1007/s10086-006-0841-0. [Google Scholar] [CrossRef]
23. Gravelsins, R. J. (1998). Studies of grinding of wood and bark-wood mixtures with the szego mill (Ph.D. Thesis). University of Toronto, Canada. [Google Scholar]
24. Wang, L., Barta-Rajnai, E., Skreiberg, Ø., Khalil, R., Czégény, Z. et al. (2018). Effect of torrefaction on physiochemical characteristics and grindability of stem wood, stump and bark. Applied Energy, 227, 137–148. DOI 10.1016/j.apenergy.2017.07.024. [Google Scholar] [CrossRef]
25. Eslam, H. K., Saieh, S. E., Rajabi, M. (2011). Effect of steaming treatment on the physical and mechanical properties of WPC made of cotton flour and polypropylene. Australian Journal of Basic and Applied Sciences, 5(6), 1143–1150. [Google Scholar]
26. Belgacem, M. N., Pizzi, A. (2016). Lignocellulosic fibers and wood handbook: Renewable materials for today’s environment. USA: John Wiley & Sons. [Google Scholar]
27. Brito, J. O., Silva, F. G., Leão, M. M., Almeida, G. (2008). Chemical composition changes in eucalyptus and pinus woods submitted to heat treatment. Bioresource Technology, 99(18), 8545–8548. DOI 10.1016/j.biortech.2008.03.069. [Google Scholar] [CrossRef]
28. Windeisen, E., Strobel, C., Wegener, G. (2007). Chemical changes during the production of thermo-treated beech wood. Wood Science and Technology, 41(6), 523–536. DOI 10.1007/s00226-007-0146-5. [Google Scholar] [CrossRef]
29. Sarvaramini, A., Assima, G. P., Larachi, F. (2013). Dry torrefaction of biomass–torrefied products and torrefaction kinetics using the distributed activation energy model. Chemical Engineering Journal, 229, 498–507. DOI 10.1016/j.cej.2013.06.056. [Google Scholar] [CrossRef]
30. Deglise, X. (1982). Les conversions thermochimiques du bois. Nancy, France: AgroParisTech. DOI 10.4267/2042/21577. [Google Scholar] [CrossRef]
31. Colin, B. (2014). Modélisation de la torréfaction de plaquettes de bois en four tournant et validation expérimentale à l’échelle d’un pilote continu de laboratoire (Ph.D. Thesis). Ecole nationale des Mines d’Albi-Carmaux, France. [Google Scholar]
32. Rath, J., Wolfinger, M. G., Steiner, G., Krammer, G., Barontini, F. et al. (2003). Heat of wood pyrolysis. Fuel, 82(1), 81–91. DOI 10.1016/S0016-2361(02)00138-2. [Google Scholar] [CrossRef]
33. van der Stelt, M. J. C. (2011). Chemistry and reaction kinetics of biowaste torrefaction (Ph.D. Thesis). Technische Universiteit Eindhoven, Netherlands. [Google Scholar]
34. Prins, M. J. (2005). Thermodynamic 30 analysis of biomass gasification and torrefaction (Ph.D. Thesis). Technische Universiteit Eindhoven, Netherlands. [Google Scholar]
35. Ohliger, A., Förster, M., Kneer, R. (2013). Torrefaction of beechwood: A parametric study including heat of reaction and grindability. Fuel, 104, 607–613. DOI 10.1016/j.fuel.2012.06.112. [Google Scholar] [CrossRef]
36. Bates, R. B., Ghoniem, A. F. (2013). Biomass torrefaction: Modeling of reaction thermochemistry. Bioresource Technology, 134, 331–340. DOI 10.1016/j.biortech.2013.01.158. [Google Scholar] [CrossRef]
 | This work is licensed under a Creative Commons Attribution 4.0 International License, which permits unrestricted use, distribution, and reproduction in any medium, provided the original work is properly cited. |