| Fluid Dynamics & Materials Processing |
DOI: 10.32604/fdmp.2022.019998
ARTICLE
A Method for Identifying Channeling Paths in Low-Permeability Fractured Reservoirs
1Oil & Gas Technology Research Institute, PetroChina Changqing Oilfield Company, Xi’an, 710000, China
2School of Petroleum Engineering, Yangtze University, Wuhan, 430100, China
*Corresponding Author: Jialing Ma. Email: 201971195@yangtzeu.edu.cn
Received: 28 October 2021; Accepted: 13 December 2021
Abstract: Often oilfield fractured horizontal wells produce water flowing in multiple directions. In this study, a method to identify such channeling paths is developed. The dual-medium model is based on the principle of inter-well connectivity and considers the flow characteristics and related channeling terms. The Lorentz curve is drawn to qualitatively discern the geological type of the low-permeability fractured reservoir and determine the channeling direction and size. The practical application of such an approach to a sample oilfield shows that it can accurately identify the channeling paths of the considered low-permeability fractured reservoir and predict production performances according to the inter-well connectivity model. As a result, early detection of water channeling becomes possible, paving the way to real-time production system optimization in low-permeability fractured reservoirs.
Keywords: Low-permeability fractured reservoir; fracturing horizontal well; interwell connectivity; dual media; channeling paths
Fractured horizontal wells improve hydrocarbon production in low-permeability fractured reservoirs. Low-permeability fractured reservoirs frequently have microfractures and strong reservoir heterogeneity. Artificial fractures coexist with natural fractures in the process of fracturing. With the extension of production time following large-scale fracturing operations, some blocks exhibit low recovery degree, high water cut, water injection channeling, and inefficiency, which severely limit horizontal-well production [1–5]. There are no effective methods to verify and identify the direction, size, and channeling capacity of water after it breaks through fractured horizontal wells through production performance. Late adjustment measures are poorly targeted, making effective production difficult to achieve. This problem can be solved by accurately determining the channeling paths in horizontal wells.
The existing methods of identifying channeling paths mainly include interwell tracer analysis, water injection profile, well test, and numerical simulation identification methods [6–11]. The analysis and identification method of interwell tracer is quantitatively interpreted using interwell tracer interpretation software. It can estimate the horizontal and vertical heterogeneity of the reservoir, qualitatively evaluate the high-permeability bands in the formation, and quantitatively obtain some formation parameters. The water injection profile identification method analyzes the change in water absorption in each layer according to the water absorption profile data measured at different times and estimates whether the channeling paths are formed in combination with the change in other parameters of the logging curve. The well test identification method detects the high-permeability channel and its direction through pressure drop, pressure recovery, and interference well test. It can qualitatively predict the dominant channel of the reservoir. The numerical simulation method can quantitatively identify the dominant flow field and the dominant channel using a streamlined field through complex geological modeling and actual production dynamic simulation [12–15]. These methods have a certain guiding effect on the early stage of the reservoir and conventional reservoir development. However, for the low-permeability fractured reservoir with water control and oil stabilization measures, such as acid fracturing, profile control, and water plugging in the middle and later stage of reservoir development, the applicability and accuracy are poor and the channeling paths cannot be identified quickly and accurately in real time.
The reservoir is a dynamic equilibrium system. Well injection causes the connectivity characteristics of oil well liquid production fluctuation. The use of injection and production performance data to establish a fast interwell connectivity model has gradually become crucial in channeling paths identification [16]. Xu et al. [17] used the connectivity model to predict the accumulation and channeling performance in real oil fields to quickly and effectively calculate the oil–water performance of polymer flooding and quantitatively characterize the formation characteristics, guiding actual on-site development. Shen et al. [18] used the connectivity method to identify the dominant channeling paths of the fractured vuggy reservoir in 2018. To verify the correctness of the actual model, they calculated the water injection split from the water injection well to the surrounding wells, identified the dominant channel according to the water injection split, and obtained adjustment measures. The aforementioned research on identifying channeling paths using interwell connectivity is mainly used for a single medium. It is not suitable for dual medium and can only be identified using a splitting coefficient. The identification process is not sufficiently intuitive to accurately estimate the channeling type. Reservoir rocks containing fracture–pores or cave–pores are called dual-porosity media. There are two types of pores in the dual-porosity medium: the intergranular pore system comprising the pore space of solid rock particles, called matrix or primary pores; the other is the matrix or primary pores. The other is a pore system formed by fractures and pores, called fracture or secondary pores.
In this study, daily dynamic data was used to establish a data-driven model based on connectivity to solve the aforementioned problems. The model can assess the water breakthrough law of horizontal wells in low-permeability fractured reservoirs and quickly identify the channeling paths. The model accurately identifies the channeling paths of horizontal wells by qualitatively evaluating the channeling flow of well groups using the Lorentz coefficient and quantitatively characterizing the channeling flow using the splitting coefficient. In this study, a conceptual model is established to verify the recognition method and applied in practical blocks. Thus, it lays a foundation for the subsequent formulation of the corresponding injection–production system, profile control strategy, and long-term efficient and stable development.
2 Connectivity Model of Horizontal Wells in Fractured Reservoirs
The interwell connectivity model considers well points as the basic unit and simplifies the complex geological description between well points into two important characteristic parameters: the interwell conductivity Tij and the connected volume Vpi, which are solved using the conservation equation of matter. The interwell conductivity represents the seepage velocity under the unit pressure difference, indicating the average seepage capacity and dominant conduction direction between wells. Connected volume represents the material basis of the interwell connected unit, which can indicate the control range and volume of water flooding between wells. As shown in Fig. 1, let well i and well j be the production and injection wells, respectively, consider the injection–production unit comprising well i and well j as the reference. The material balance equation ignoring the influence of gravity is as follows:
where i and j represent the well number; Nw represents the total number of wells; Tijrepresents the average conductivity of wells i and j, m3/(d·MPa); n represent time step; pin and pjn represent the average reservoir pressure at time n in well i and j, respectively, MPa; qinis the volume velocity of well i at the nth moment, water injection is positive, oil production is negative, m3/d; Ct is the reservoir comprehensive compression coefficient, MPa−1; Δt is time interval, day; and Vpi is the connected volume of the drainage area of the first well, m3.
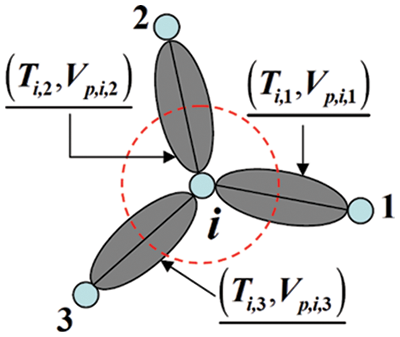
Figure 1: Schematic of connected unit centered on well i
According to the geological characteristics of low-permeability fractured reservoirs [19–25], the reservoir contains complex fractures and a matrix. To make the model simulation more accurate, this study extends the interwell connectivity model to a dual-medium model, divides the seepage system into matrix and fracture systems, and considers the channeling flow between fractures and a matrix. The specific equation is as follows:
where Tijkm is the conductivity of the matrix between i and j nodes, Tijkf is the conductivity of cracks between i and j nodes, Vikm is the connected volume of the matrix, and Vikf is the connected volume of cracks, τijkmf is the channeling term between fracture and matrix.
The saturation equation obtained by solving is as follows:
The pressure loss in the horizontal section is neglected in flow simulation for multiple perforation points of a horizontal well. The horizontal well is characterized as multiple connected virtual well points. After the liquid production index is used to calculate the injection–production capacity of each node, it can be introduced in the original material balance equation for the solution.
Before establishing the initial model, the initial values of conductivity and connectivity volume are assigned based on the physical properties of each wellpoint so that the initial connectivity model is consistent with that of the reservoir. To accurately show the actual condition of the reservoir, conducting the historical fitting, considering the conductivity and connected volume as the inversion parameters, and conducting automatic historical fitting are required. The dynamic indices calculated using the connectivity model are consistent with the historical dynamics by optimizing the inversion parameters. Specific fitting methods and formulas are reported in literature [26]. The interwell connectivity method only considers the two characteristic parameters of conductivity and connectivity volume, does not involve complex and rigorous geological modeling, can quickly and accurately reflect the natural state of the reservoir, greatly shorten the simulation time, and is suitable for real-time production performance prediction of the reservoir. This study identifies the channeling paths of the low-permeability reservoir based on this model.
3 Study on Identification Method of Channeling Paths
Using the fitted connectivity model parameters, considering the oil well as the center, calculate the cumulative seepage capacity and cumulative storage capacity of a series of well groups, draw the Lorentz curve, intuitively assess the degree of reservoir heterogeneity, and predict the possible direction of channeling flow through the Lorentz coefficient. Furthermore, considering the water well as the center, calculate the splitting coefficient from the water well to the oil well at each time step, clarify the water inflow direction and water quantity of each oil well, and realize the quantitative characterization of channeling paths
3.1 Qualitative Identification Method of Channeling Paths
The Lorentz curve is often used to reflect the inequality of income distribution in statistics, which is widely used because of its intuitive and convenient analysis. Since the 1990s, the Lorentz curve has been gradually used to evaluate the degree of reservoir heterogeneity [27,28], which enriches the method of describing reservoir heterogeneity. In this study, using the connectivity model and Lorentz curve to identify the degree of reservoir heterogeneity qualitatively, the following steps are observed.
(1) Calculate the connectivity coefficient and time constant. Considering oil well j as the center, the corresponding connectivity coefficient and time constant are calculated according to its conductivity and connectivity volume between adjacent wells. The calculation formula is as follows:
where φij is the connectivity coefficient between i and j wells; τij is a time constant, which characterizes the delay and attenuation between injection and production wells; Tij is the conductivity between wells i and j; Vij is the connected volume between well i and well j. i is the total number of wells associated with well j.
(2) Calculate cumulative seepage capacity and cumulative storage capacity. The calculation formulas of cumulative seepage capacity and cumulative storage capacity are as follows:
where Fij is the cumulative seepage capacity between the wells i and j and Cij is the cumulative storage capacity between the wells i and j.
(3) Evaluate the geological characteristics around the oil well according to the Lorentz curve. The Lorentz curve was depicted, considering the cumulative seepage capacity as the ordinate and the cumulative storage capacity as the abscissa. The Lorentz coefficient (Lcj) was calculated according to the decreasing order of the slope of each well. Lorentz coefficient refers to the closed graph area enclosed by the curve and the diagonal and the ratio of the area enclosed by the coordinate axis and the diagonal. The greater the Lorentz coefficient is, the stronger the plane heterogeneity of the well group is, and there may be channeling paths. By contrast, if the Lorentz curve approximately overlaps with the diagonal, the well group is a homogeneous reservoir. The Lorentz curves of three typical geological features are shown in Fig. 2.
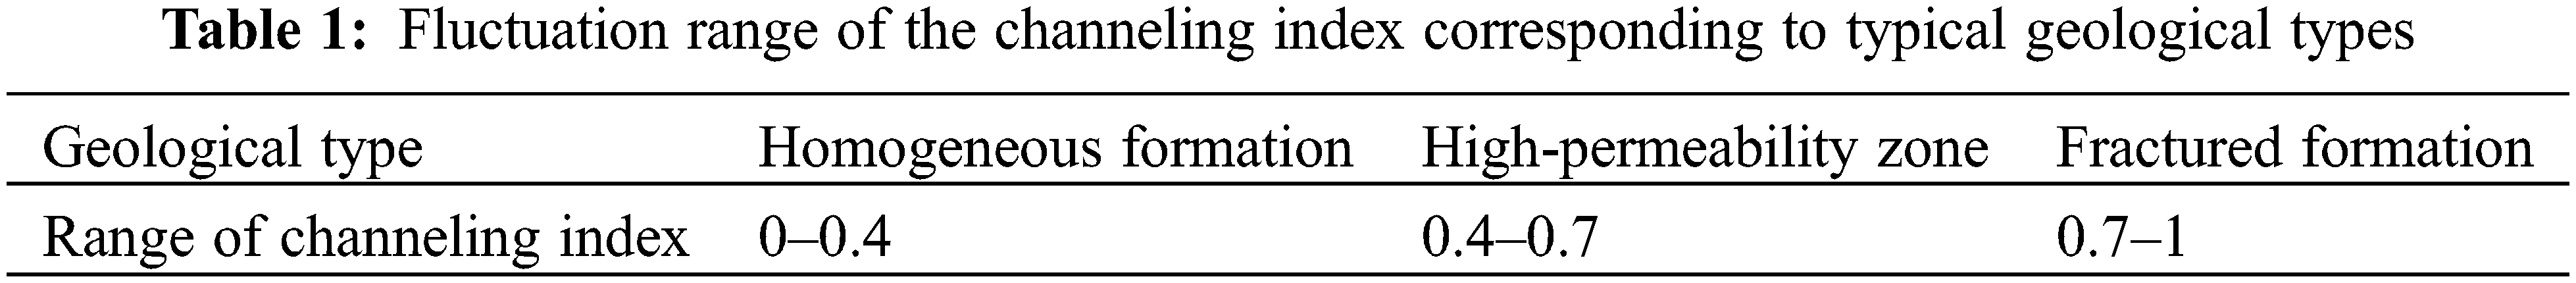
(4) Predict the possible direction of channeling. After screening out the wells that may have channeling paths, it is necessary to predict the possible direction of channeling paths. The interwell channeling index is a product of the connectivity coefficient and Lorentz coefficient. According to the size of the channeling index, the type of interwell channeling between injection and production wells can be determined. Table 1 shows the fluctuation range of the channeling index corresponding to typical geological types.
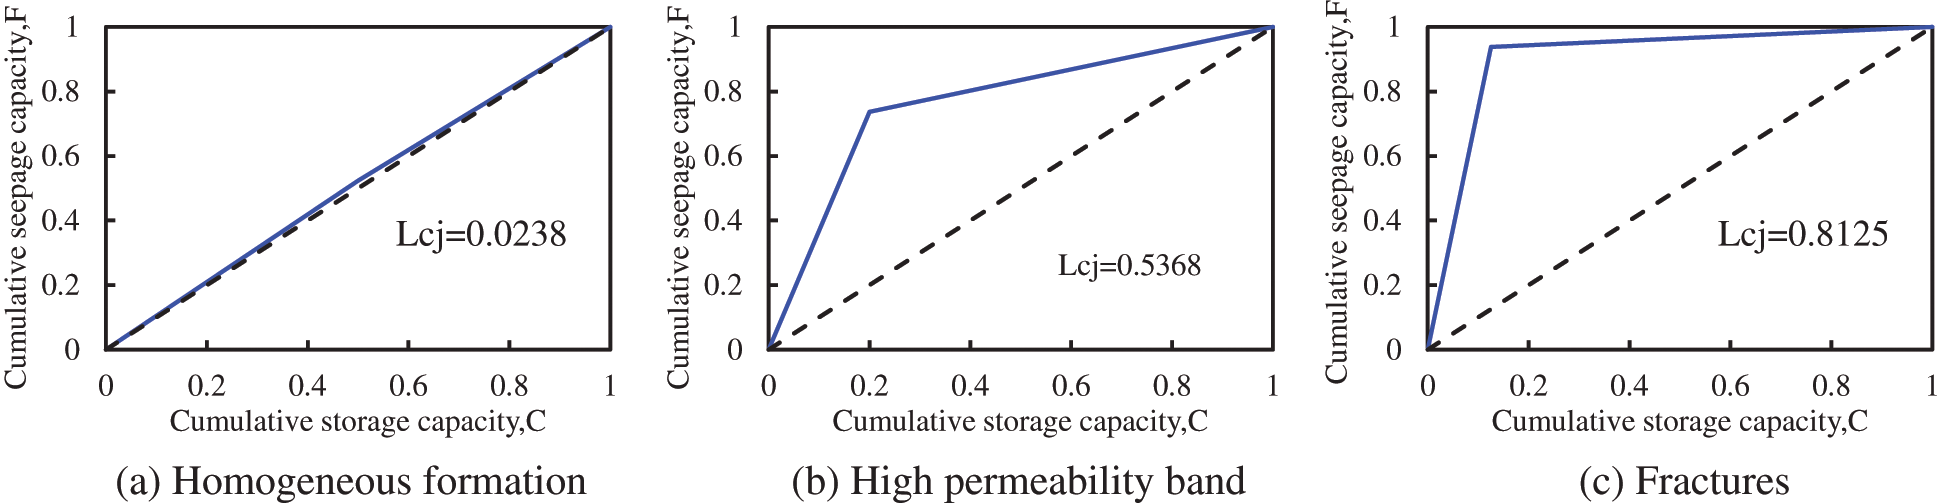
Figure 2: Lorentz curve of typical geological features
Through the aforementioned calculation and estimation, the Lorentz curve method can qualitatively identify the well groups and channeling types that may have channeling paths and preliminarily identify the injection–production well pairs that may have channeling paths. The channeling paths are further quantitatively characterized using the splitting coefficient method to clarify the specific water breakthrough position and water inflow size of horizontal wells.
3.2 Quantitative Characterization of Channeling Paths
The interwell connectivity model is used to obtain the flow and water saturation of each connected unit through numerical calculation. The directional splitting size of each injection–production well pair can be accurately calculated using the flow of each fluid. The splitting coefficient represents the percentage of liquid flowing to a production well in the total injected water for an injection–production well group centered on the water injection well. Assuming that in the nth time step, the number of injection well is i and the number of production well connected to it is j, the splitting coefficient from well i to well j is given as follows:
where nc represents the number of production wells associated with water injection well j.
The dynamic indices, such as water cut, are obtained using the connectivity model. The water injection splitting coefficient is calculated using nodes. The water injection utilization rate (oil production contributed by injecting 1 m3) is calculated considering the water and oil splitting volume between injection and production wells to clarify the effect of water injection and verify that there is a channeling path for injection and production wells with low water injection utilization rate.
A two-dimensional heterogeneous reservoir model with a high-permeability strip is selected for a demonstration to verify the reliability of the dual-medium model of interwell connectivity and the accuracy of the identification method of channeling paths. The reservoir model is an Eclipse reservoir simulator model of five injections and twelve horizontal wells, and the permeability distribution is shown in Fig. 3.
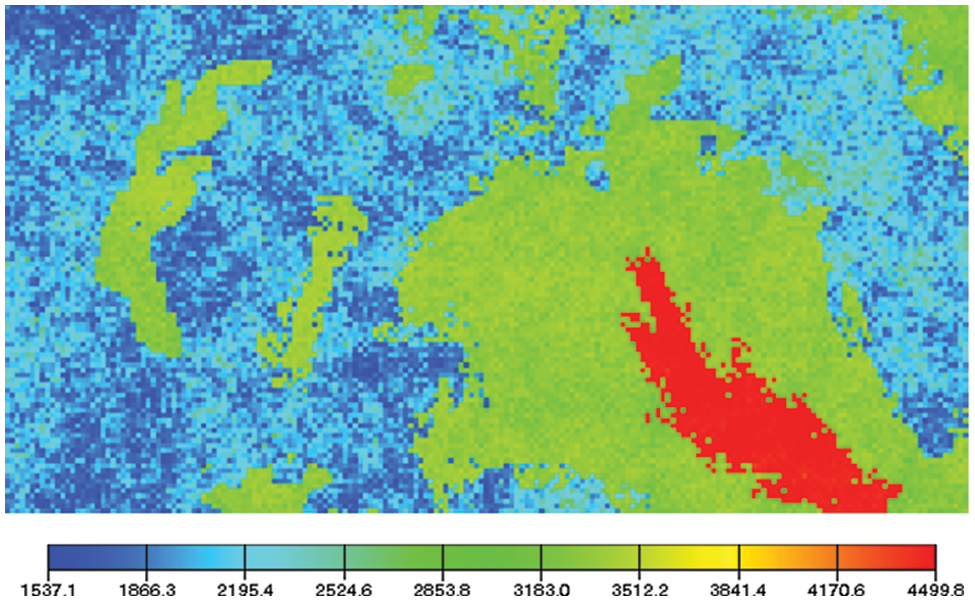
Figure 3: Permeability field of the conceptual model
The mesh number of the model is 191 × 101 × 1, considering dX = dY = 15 m. The initial oil saturation is 0.8, average porosity is 0.2, crude oil viscosity is 2.9 mPa.s, initial reservoir pressure is 25 MPa, and simulation production time is 900 d.
Fig. 4 shows the fitting results of oil accumulation and water cut of blocks and some production wells obtained using the historical fitting inversion of the connectivity model. The connectivity model after historical fitting has an excellent fitting effect with the Eclipse model, indicating that the model is reliable and can well simulate the production performance. Under the same simulation time, the connectivity model is calculated for 2 s and the Eclipse model is calculated for 16 s. The model greatly improves the simulation speed and lays the foundation for the real-time production optimization of low-permeability fractured reservoirs.
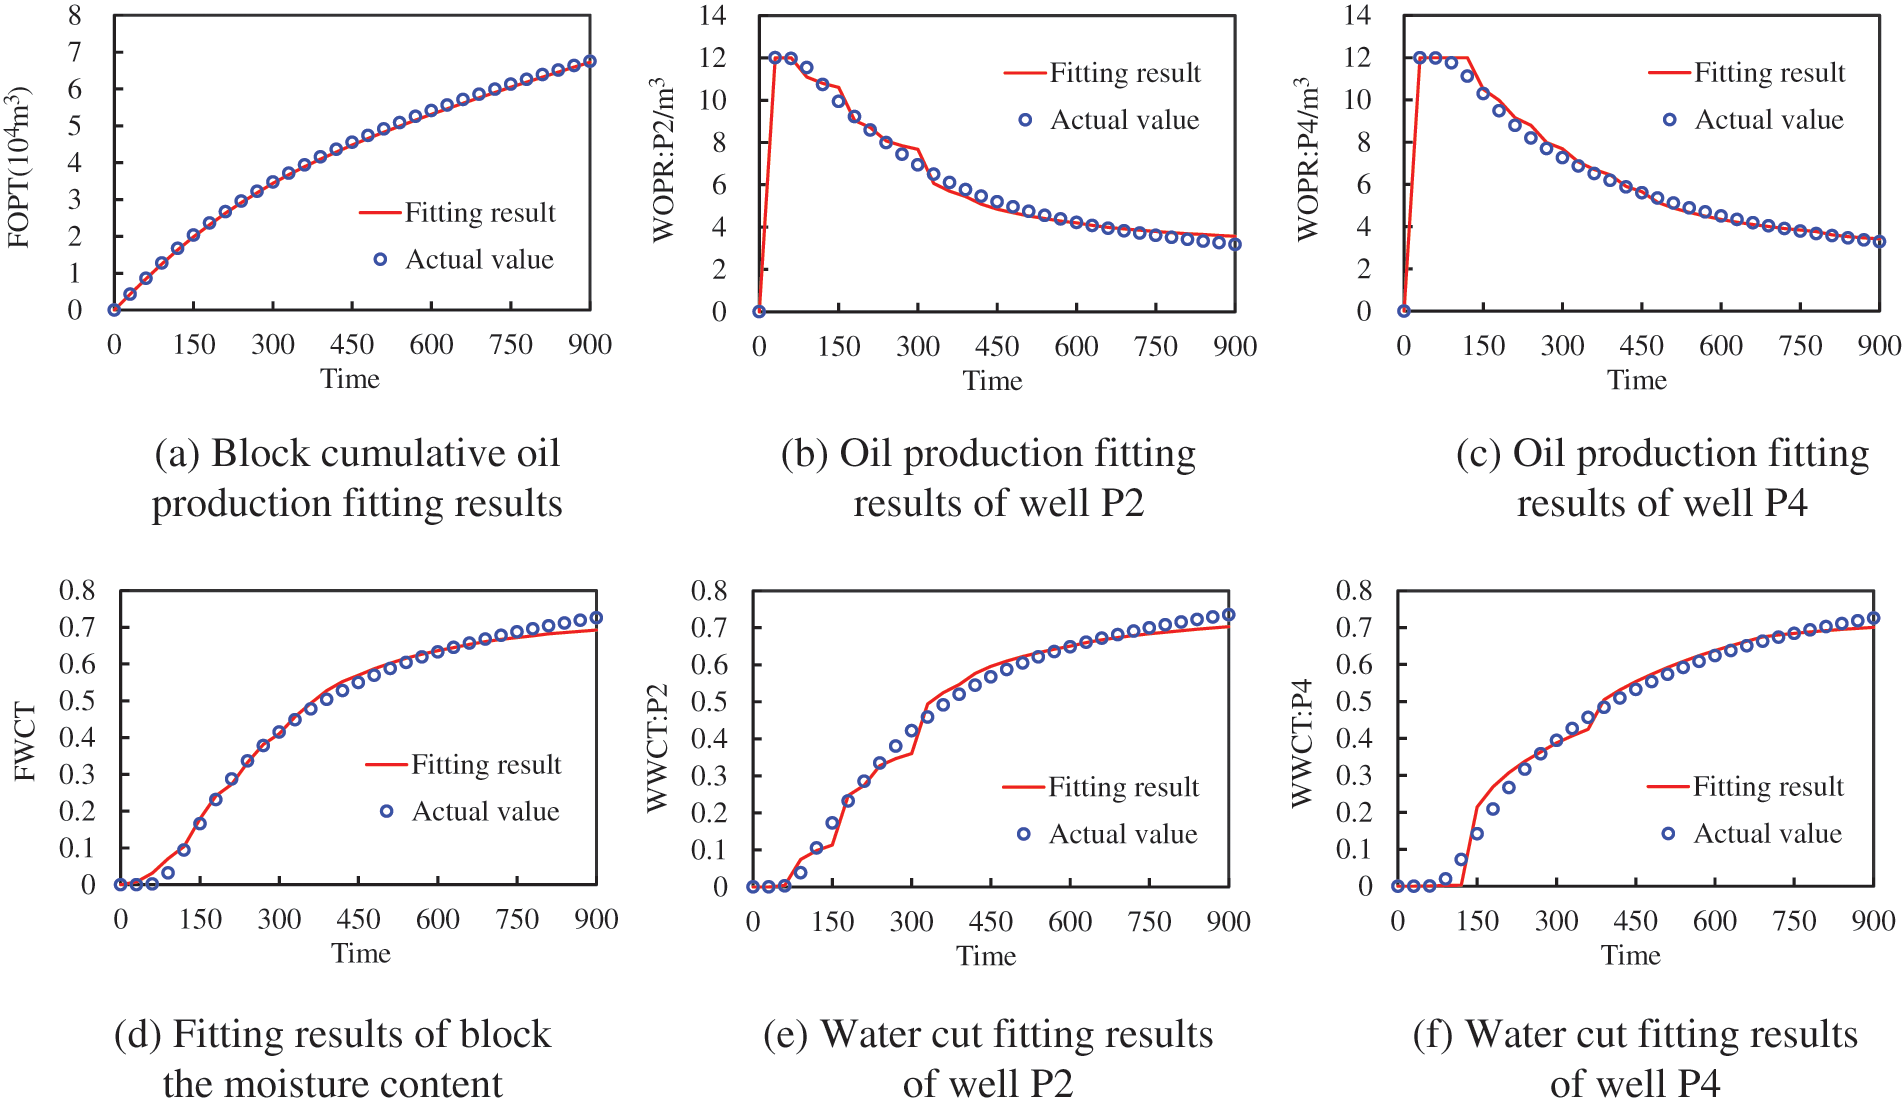
Figure 4: Fitting results of conceptual model block and some single wells
The fitting results of the model conductivity obtained using historical fitting are shown in Fig. 5. In Fig. 5, the conductivity of red is high and that of blue is low. Fig. 5 shows that the position of the conductivity line in red is consistent with the position of the high-permeability strip in the figure, which further verifies the reliability of the inversion parameters of the model.
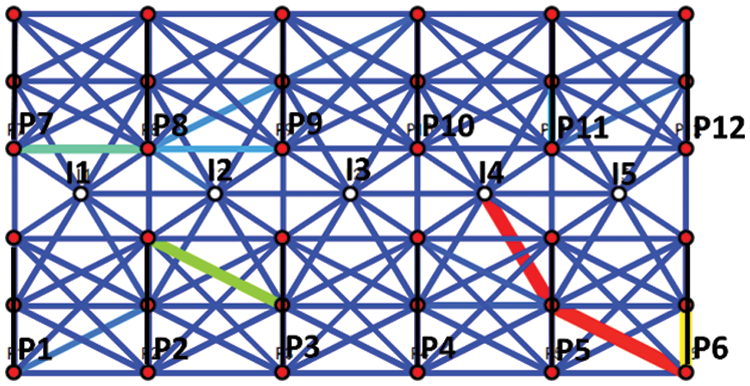
Figure 5: Fitting results of model conductivity
The Lorentz curve is depicted according to each injection–production well’s conductivity and connected volume. Fig. 6 shows the Lorentz curve of some horizontal wells. The Lorentz curve shows that the homogeneous and heterogeneous formations are near the P2 well and the P5, P9, and P11 wells, respectively. Furthermore, the heterogeneity is the strongest near the P5 well. On this basis, the channeling index between wells is calculated, as shown in Table 2.
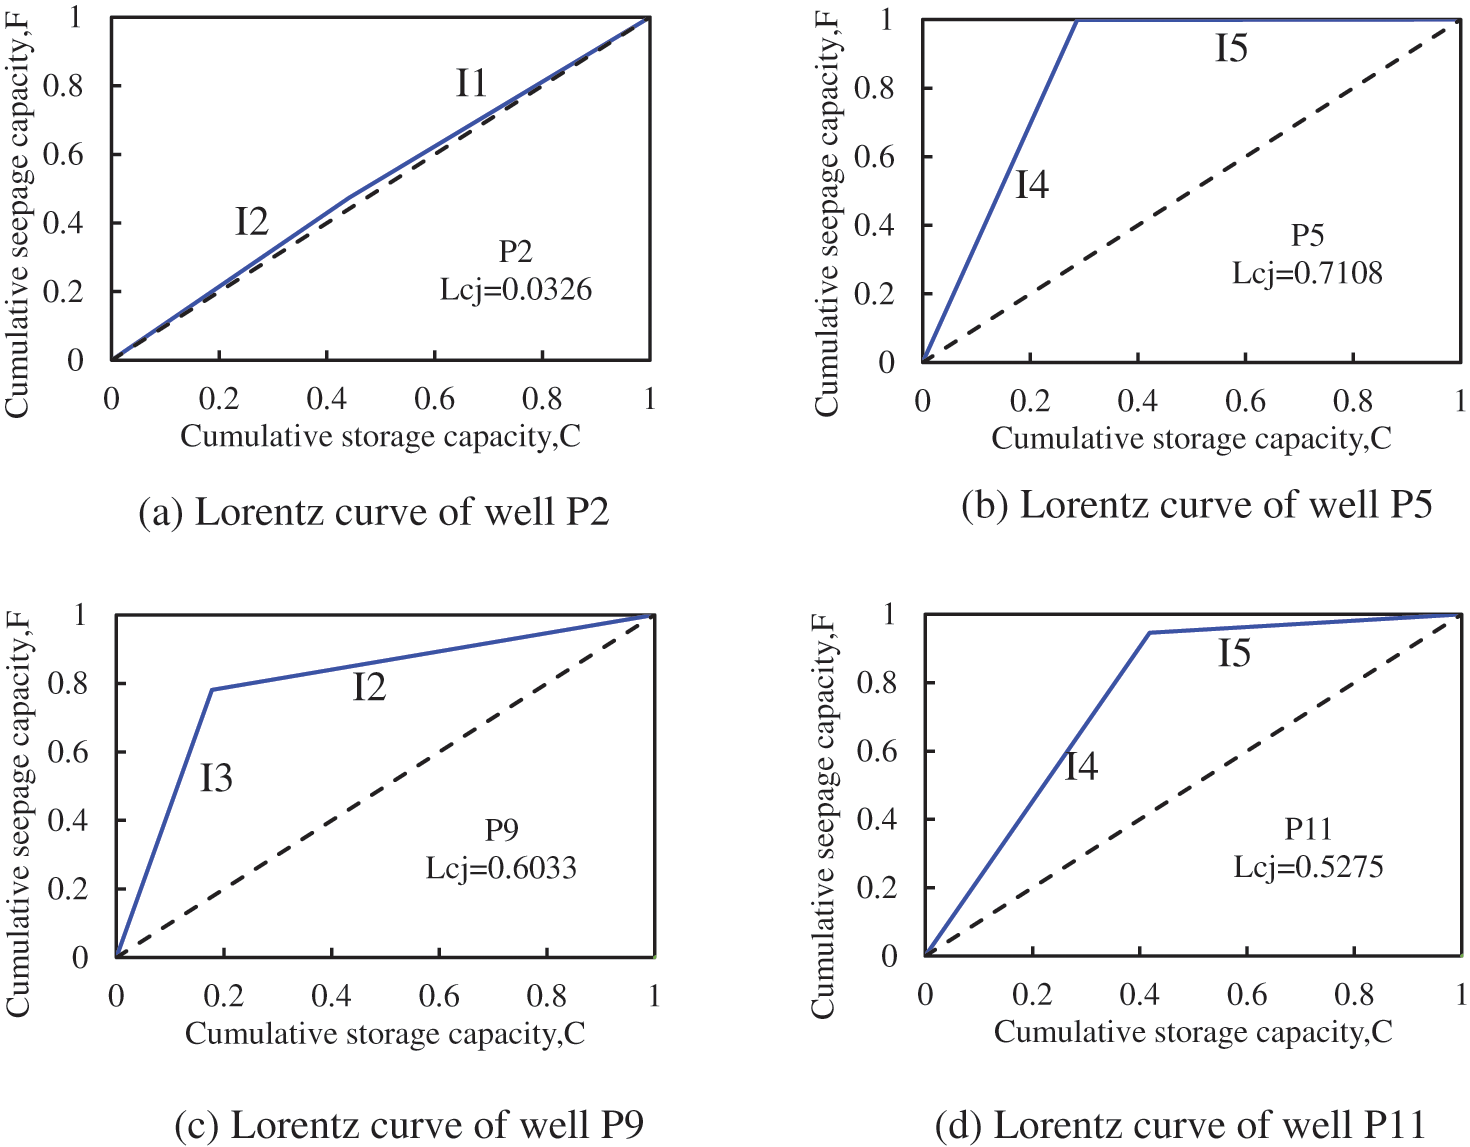
Figure 6: Lorentz curves of some horizontal wells
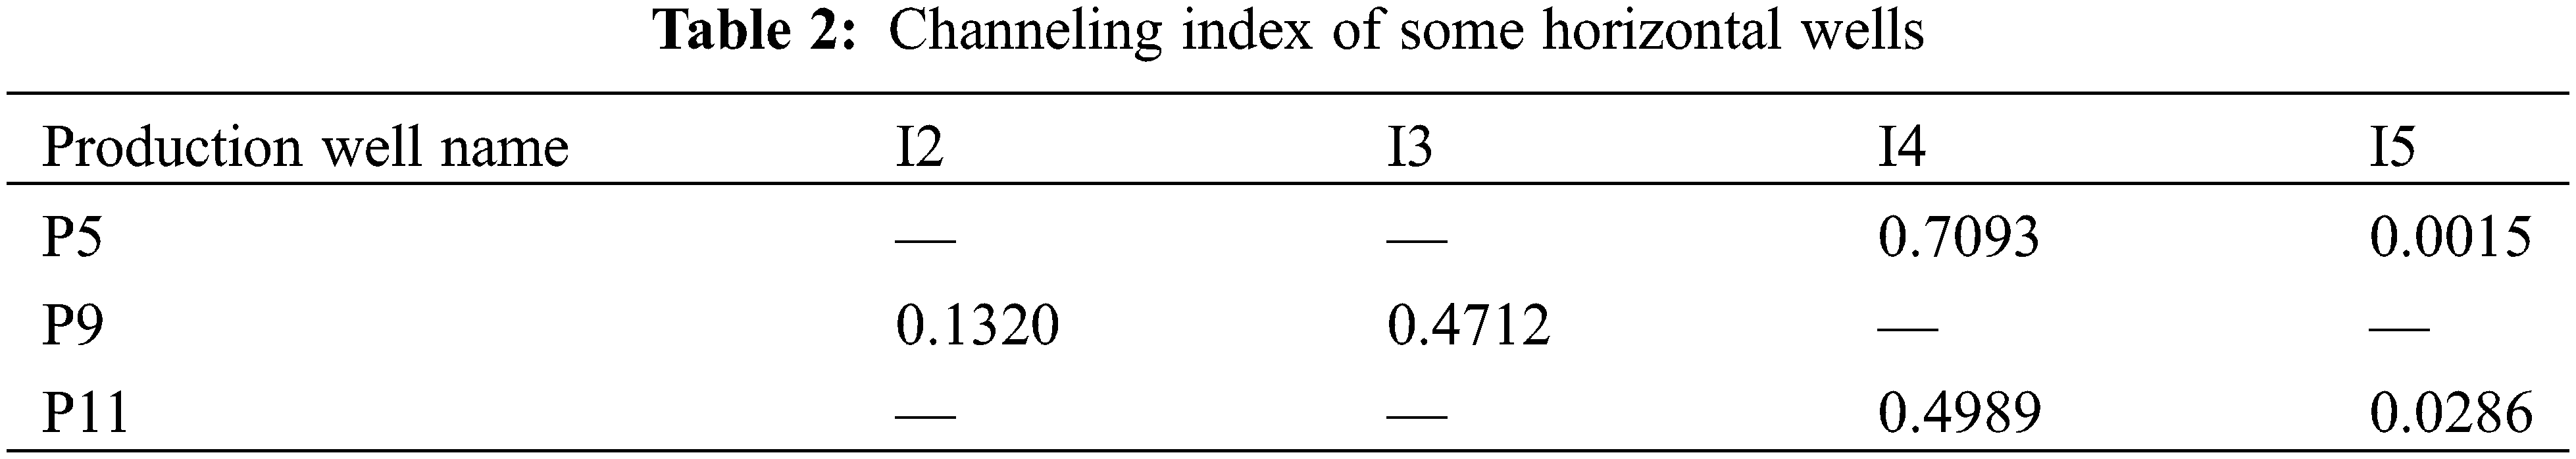
Table 2 shows that the interwell channeling index of the P5–I4 well is 0.7093, which indicates that there may be fractures. There may be high-permeability bands between P9–I3 and P11–I4 wells, and there may be channeling paths between these three wells.
The splitting coefficient and water injection utilization rate of the block are calculated to clarify the size of the channeling flow further and accurately identify the channeling paths. The distribution diagram of the splitting coefficient is shown in Fig. 7. The splitting coefficient of the I4 to P5 well is 0.407. The water injection utilization rate is 33.97%, which is quite different from the average water injection utilization rate of 50.41%; therefore, it is identified as the dominant channeling path. The conclusion is consistent with the initial geological modeling, which proves the accuracy of the channeling paths identification method.
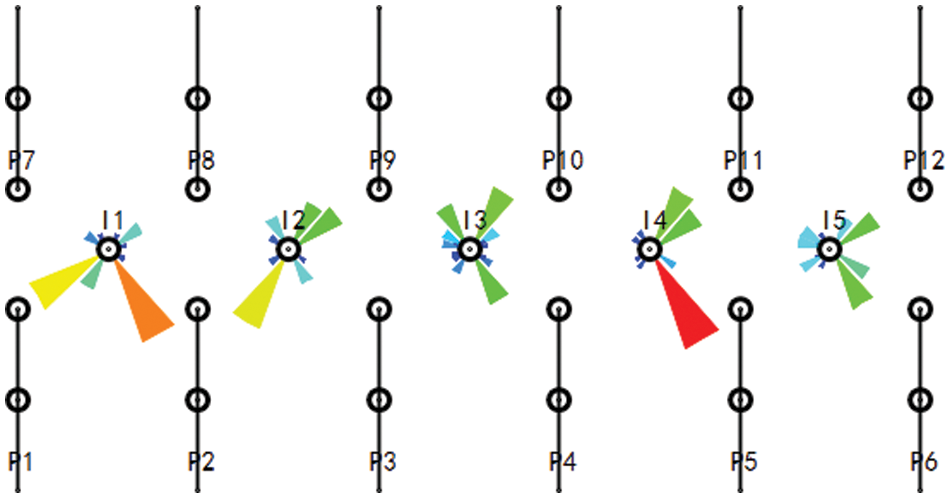
Figure 7: Distribution diagram of injection allocation factor
A low-permeability fractured reservoir is selected as an example. The average porosity is 0.119, and the average permeability is 0.35 mD. The total number of wells in the block is 154, including 87 production wells (51 horizontal and 36 vertical wells) and 67 injection wells. The production period is from 2010 to 2019, respectively. There are about 8∼15 perforation points in each horizontal well. If each perforation point is taken into account, the simulation efficiency will be reduced. In order to facilitate analysis and improve simulation efficiency, the perforation point number of each horizontal well is simplified to 4. After simplification, the total number of nodes in the reservoir is 322. Without affecting the fitting accuracy, this simplified method can reduce the amount of calculation, improve the calculation speed, and facilitate the location of water channeling.
Taking the oil production of a single well and block as the fitting index, the conductivity and connected volume of the connectivity model is automatically historically fitted. The inversion results of characteristic parameters are shown in Fig. 8, and the fitting indices of blocks and some single wells are shown in Fig. 9. The overall fitting rate exceeds 80%. The oil–water dynamic fitting results of blocks and single wells are more accurate. The automatic historical fitting stage of the model takes approximately 48 h, which is greatly shortened compared with the traditional numerical simulation software fitting of 7–14 days. The model has a good application effect on actual blocks and can provide help for real-time production optimization strategy formulation.
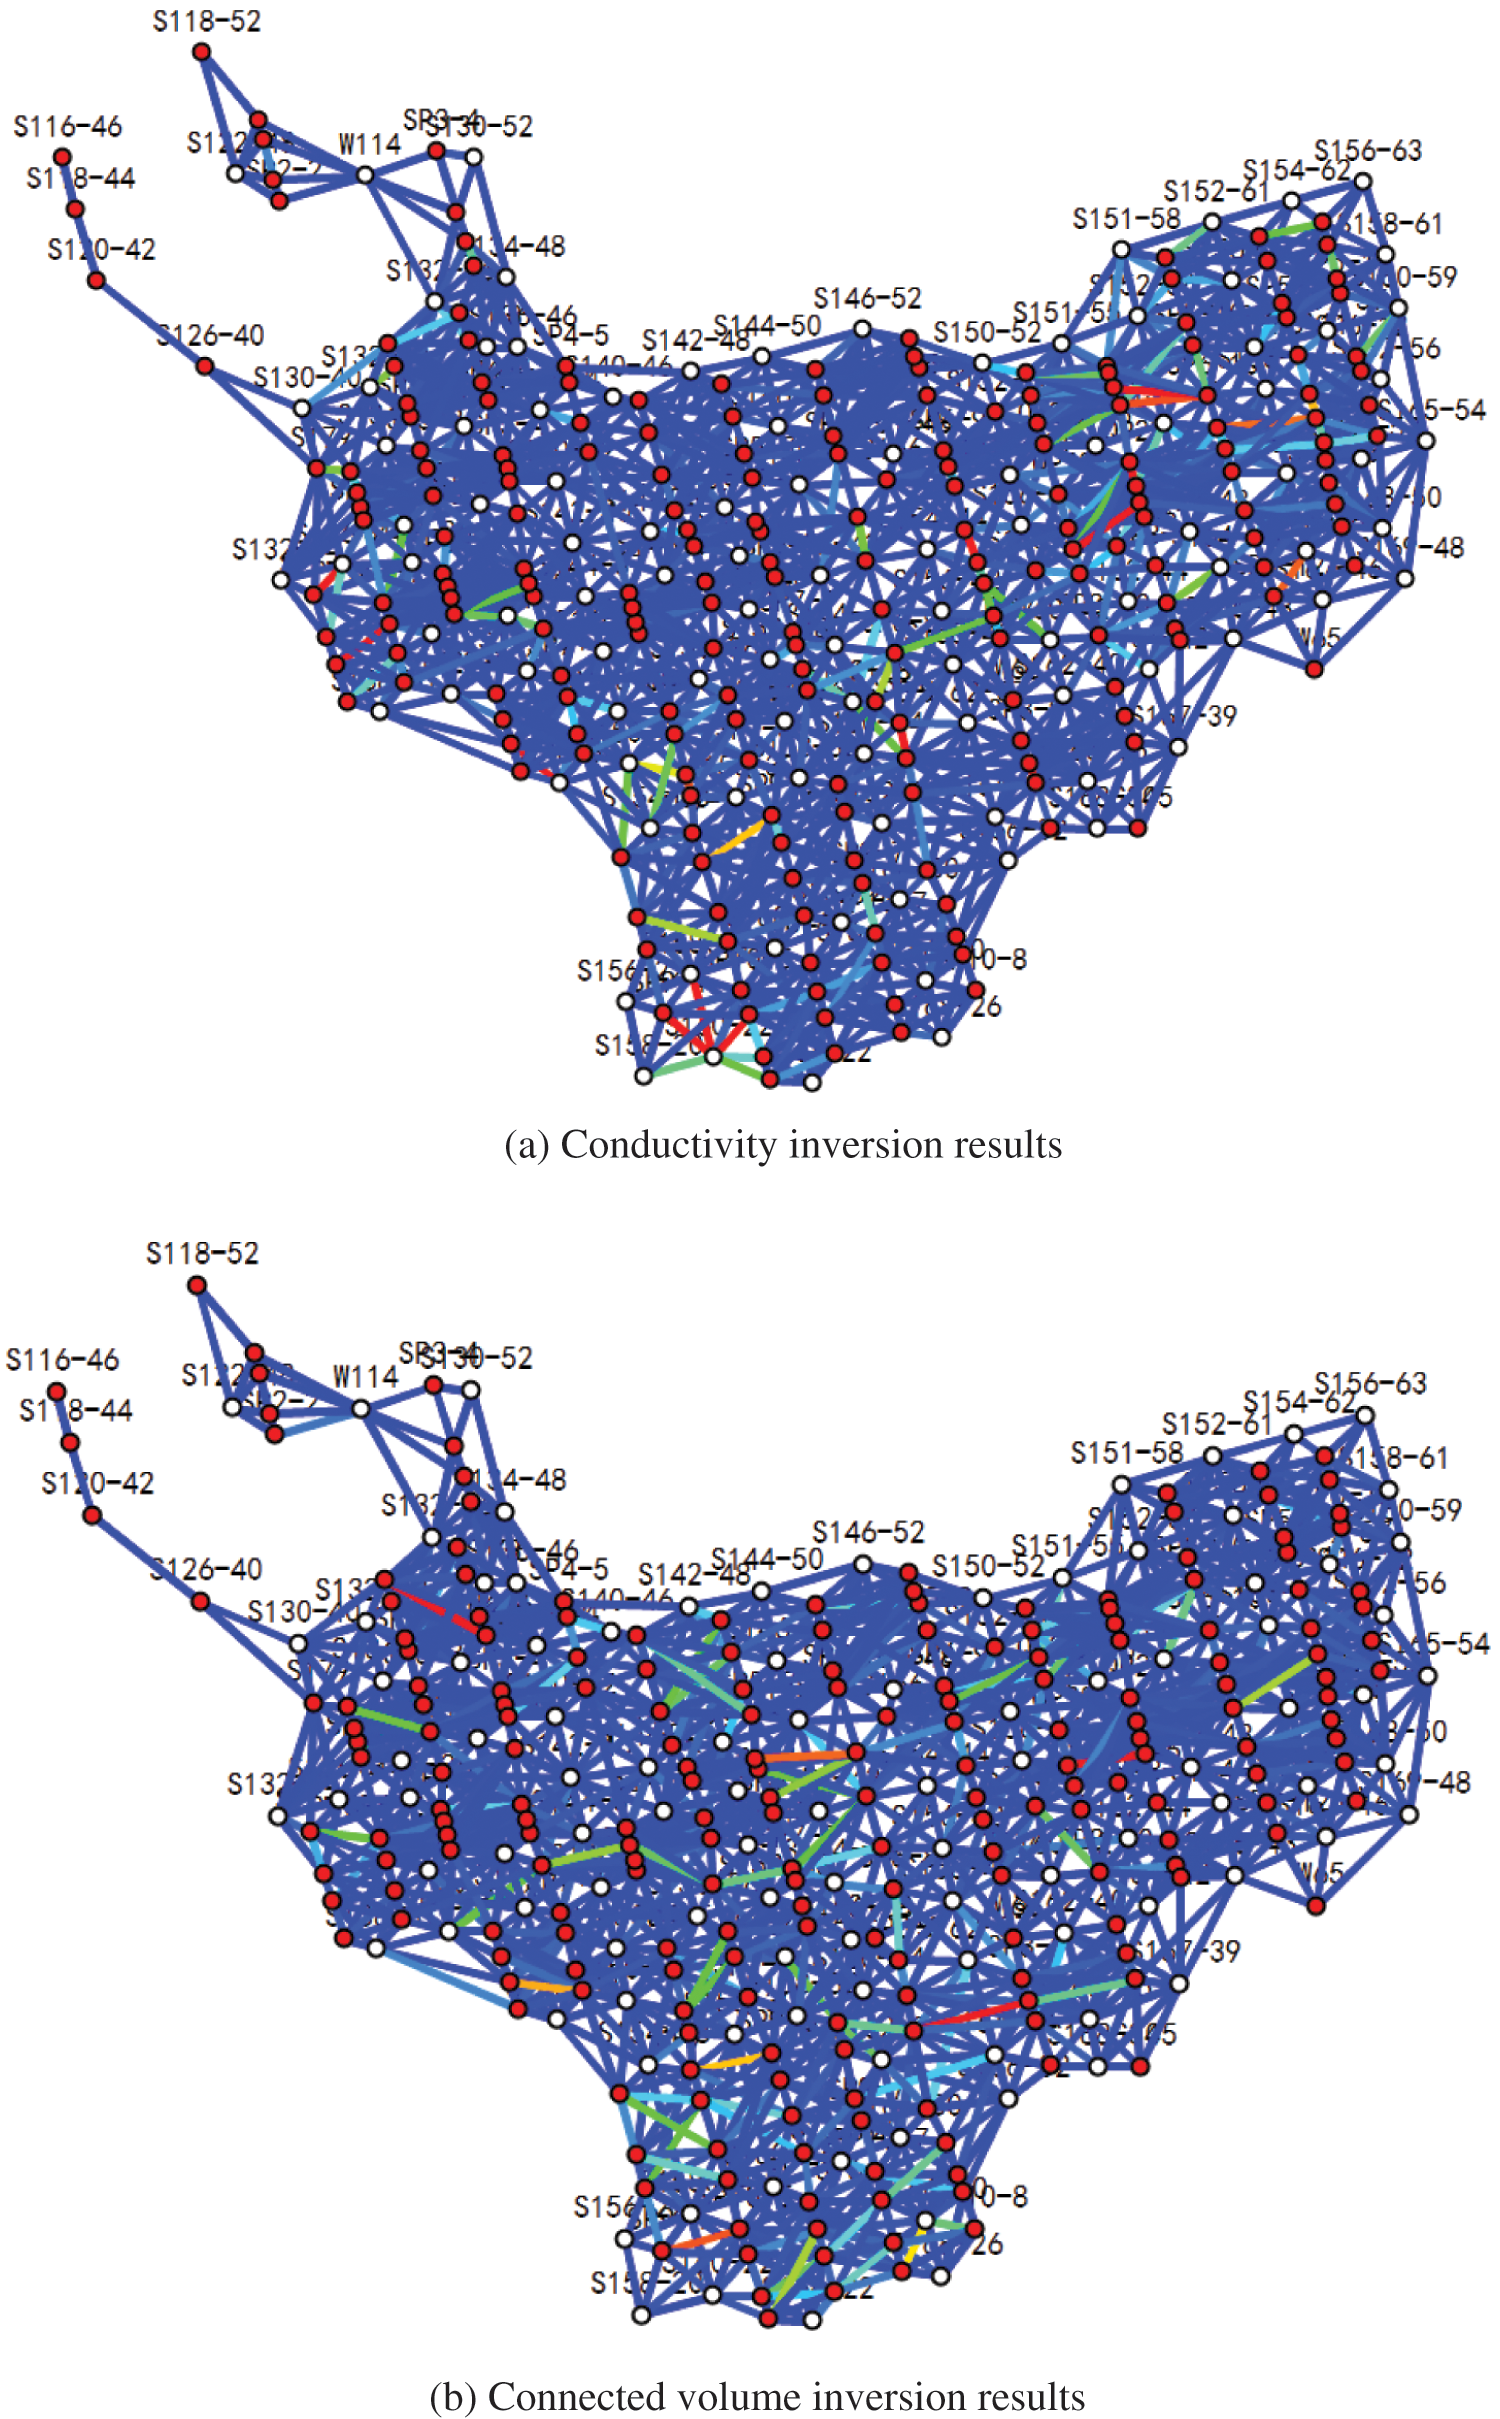
Figure 8: Inversion results of characteristic parameters
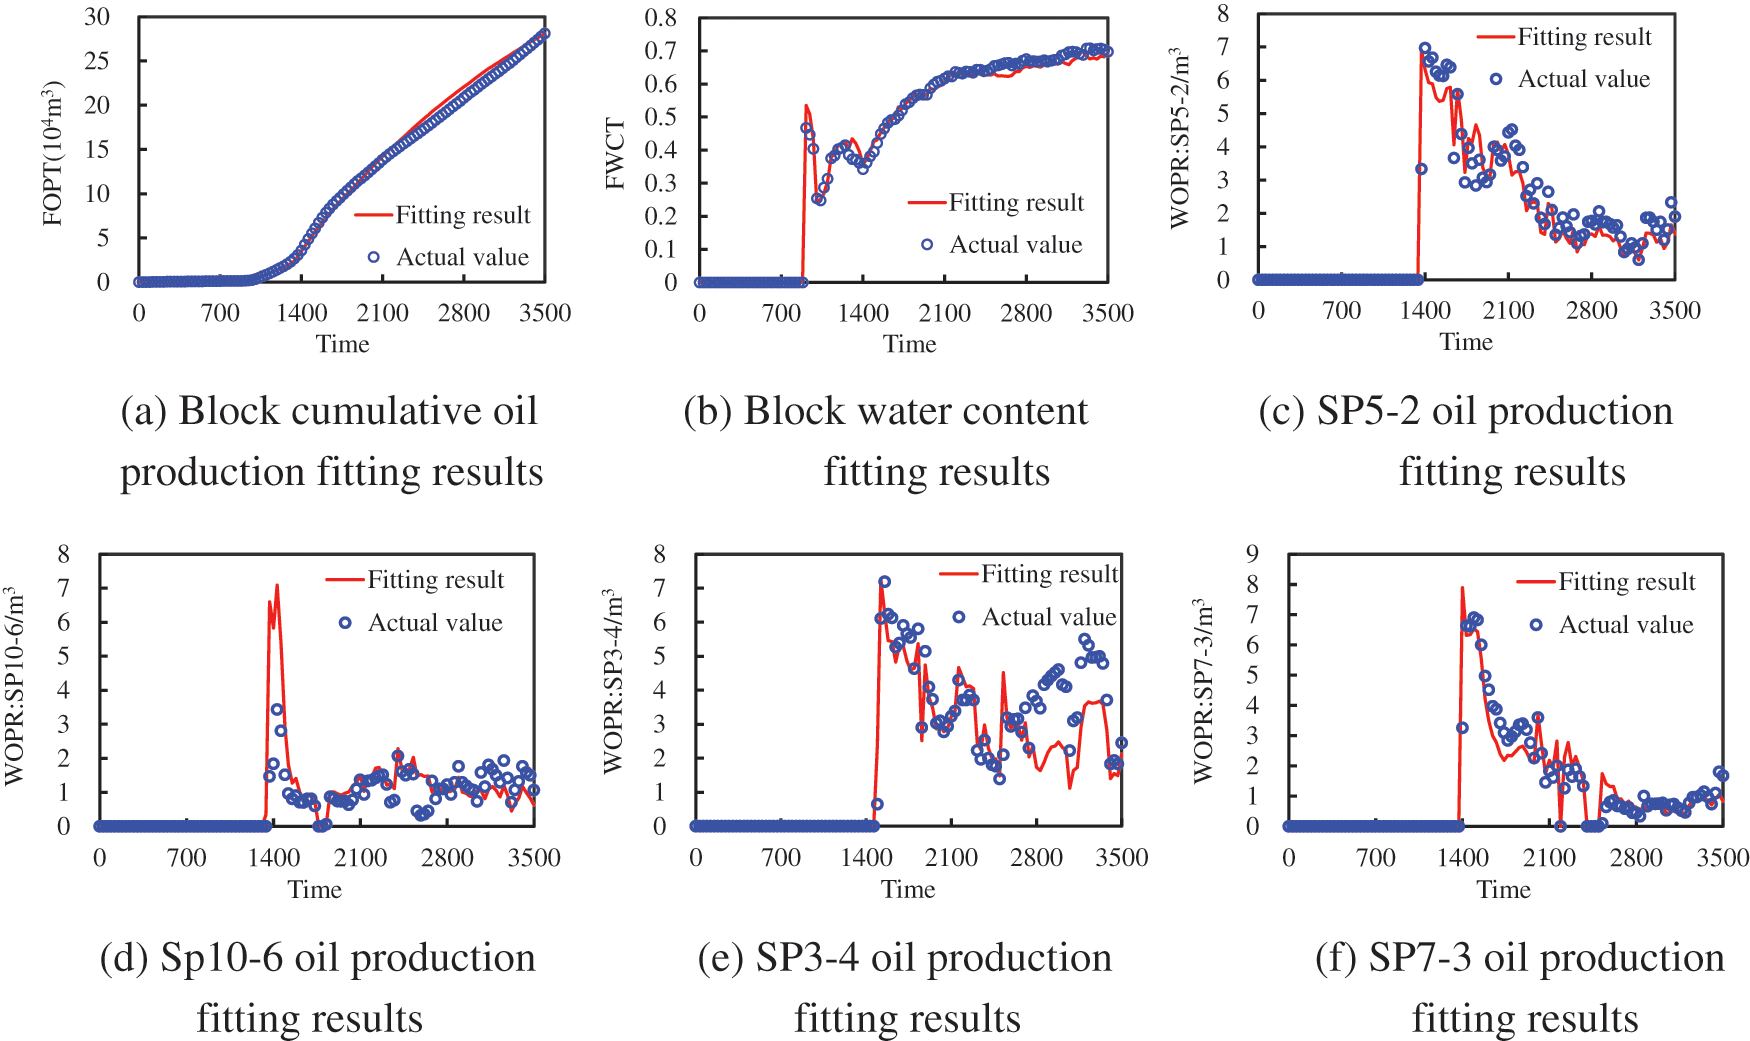
Figure 9: The fitting results of block and some single wells
The cumulative seepage capacity and storage capacity of each well can be calculated using the fitted model characteristic parameters. Then, the Lorentz curve can be drawn and the Lorentz coefficient as well as channeling index can be calculated. Fig. 10 is the Lorentz curve of some production wells. The Lorentz coefficient of SP4-5, SP5-3, and SP6-4 production wells is small, and the heterogeneity near them is weak. It is evaluated that there are no channeling paths. The Lorentz coefficient of SP10-6, SP7-6, and SP8-11 production wells is large, and the near heterogeneity is strong. It is possible to evaluate the existence of channeling paths.
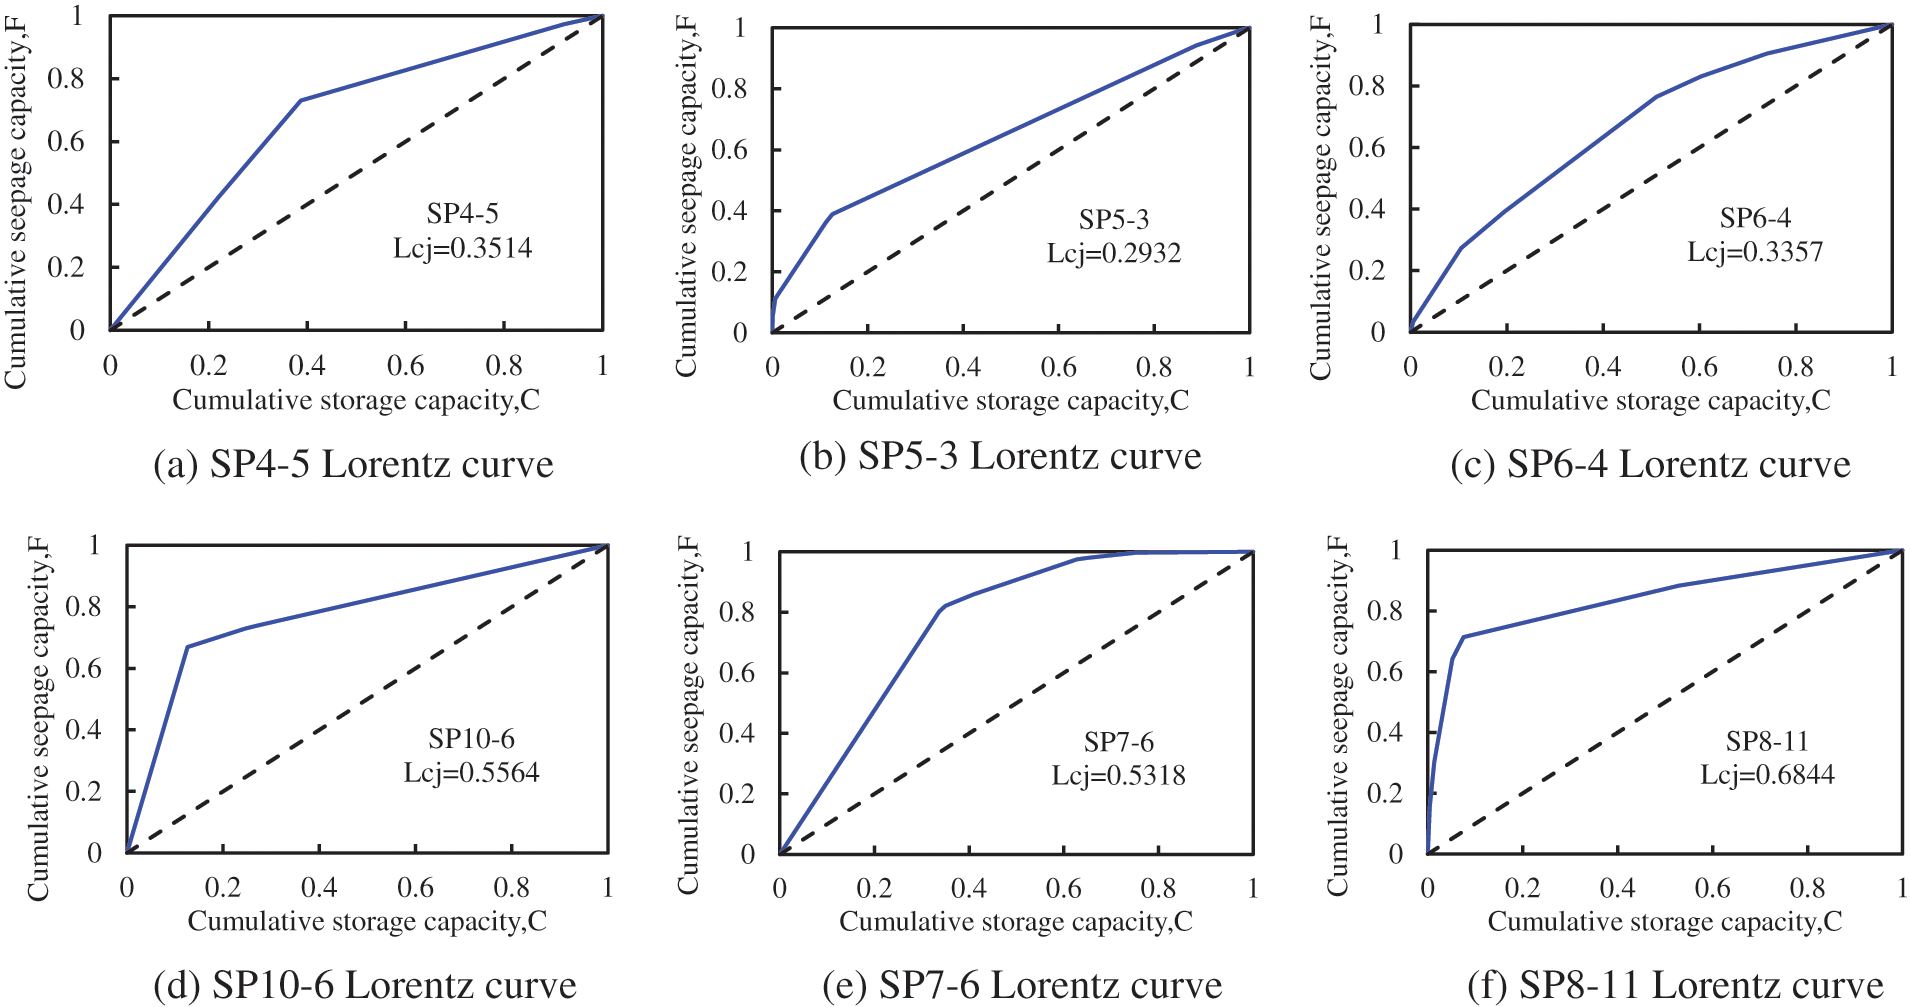
Figure 10: Lorentz curve of some production wells
Production wells with possible channeling paths are selected for further analysis. Owing to space constraints, only the channeling of well cluster SP10-6 well is particularly analyzed in this study. According to the fitting results, there are S162-28, S160-26, and S164-22 wells connected with SP10-6 well. The calculated channeling index is shown in Table 3, in which the channeling index between SP10-6 and S164-22 wells is 0.4224. It is evaluated that there may be dominant channeling paths with a high-permeability channel.
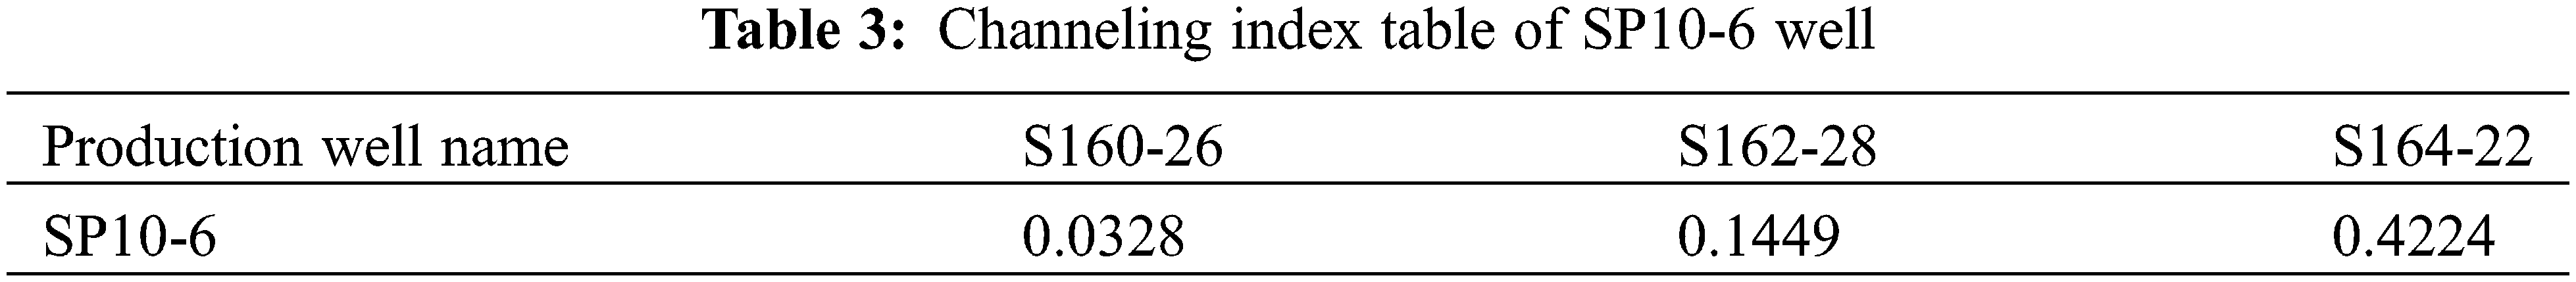
Fig. 11 shows the injection allocation factor of the SP10-6 well group. The water injection splitting shows that the injected water in S162-22 well is mainly distributed to SP10-6 well, and the injection well greatly influences SP10-6 well. After calculation, the water injection utilization rate of S164-22 well is 10.6%, that of S160-26 well is 36.4%, and that of S162-28 well is 55.5%. The water injection utilization rate of S164-22 well is far lower than that of other wells. It is assessed that there is a channeling path between the S164-22 well and SP10-6 well, and the water breakthrough direction is the tail of the horizontal well.
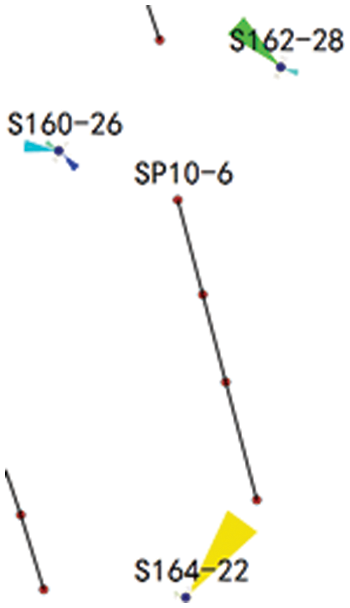
Figure 11: Injection allocation factor of SP10-6 well
To verify the accuracy of the identification results, the production performance and historical measures of the well group are summarized and analyzed, as shown in Fig. 12. There is a dynamic response between the S164-22 well and SP10-6 well. In December 2016, water channeling occurs after water injection splitting reaches 464 m3, and then the water channeling situation is improved by rotation injection. The production dynamic analysis results are consistent with the flow channel identification results, which verifies the accuracy of this method.
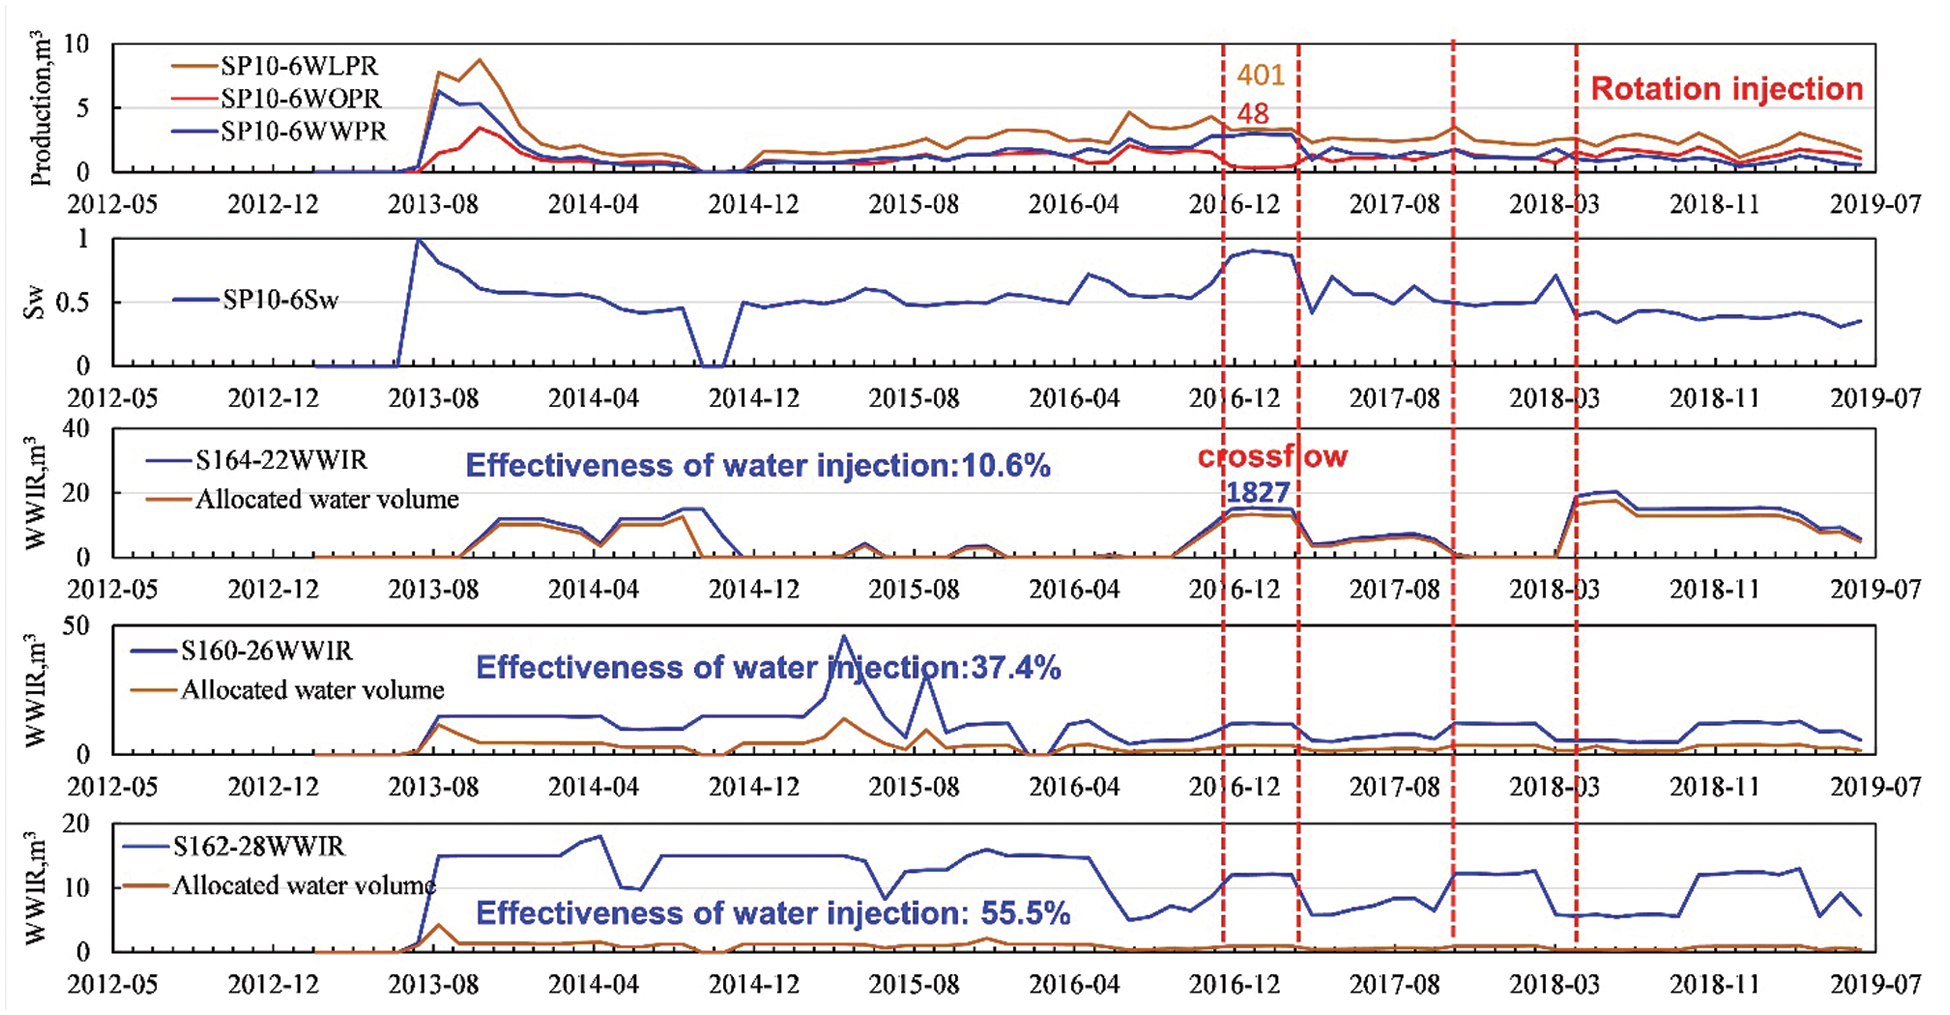
Figure 12: Production performance of SP10-6 well group
(1) A dual-medium model considering horizontal-well connectivity is established to simulate low-permeability fractured reservoirs. The simulation results show that the model can well match the actual production performance. The simulation speed is faster than traditional numerical simulation software, laying the foundation for real-time reservoir production optimization.
(2) A flow channel identification method for low-permeability fractured reservoir is proposed. The method is divided into two steps. In the first step, the Lorentz curve is used to qualitatively identify the heterogeneity between wells. In the second step, the split coefficient is used to quantitatively characterize the channeling paths and quickly identify the channeling path type and accurately characterize the channeling flow.
(3) Application of the proposed method to an oilfield shows that the proposed channeling path identification method can intuitively identify the channeling channel and predict the production performance based on accurate automatic history fitting inversion of the dual-medium model of interwell connectivity. Furthermore, it can give early warning of channeling in time for real-time optimization of production systems and strategy implementation.
Acknowledgement: Personally, I would like to thank support from our team members, and the reviews whose constructive and detailed critique contributed to the quality of this paper.
Funding Statement: The authors received no specific funding for this study.
Conflicts of Interest: The authors declare that they have no conflicts of interest to report regarding the present study.
1. Ding, D. Y. (2019). Modeling of matrix/Fracture transfer with nonuniform-block distributions in Low-permeability fractured reservoirs. SPE Journal, 24(6), 2653–2670. DOI 10.2118/191811-PA. [Google Scholar] [CrossRef]
2. Zhang, L., Chen, Q., Chunsheng, P. U., Feipeng, W. U., Sang, H. et al. (2015). Study and application of identification method of channeling-path in the fractured ultra-low permeability reservoir. Drilling & Production Technology, 38(6), 29–32+8. DOI 10.39697J.ISSN.1006-768X.2015.06.10. [Google Scholar]
3. Wang, Y. (2011). Research on waterflood development technology of low-permeability reservoirs in shanshan oilfield (Master Thesis). Northeast Petroleum University, China. [Google Scholar]
4. Bai, M., Elsworth, D., Roegiers, J. C. (1993). Multiporosity/multipermeability approach to the simulation of naturally fractured reservoirs. Water Resources Research, 29(6), 1621–1634. DOI 10.1029/92WR02746. [Google Scholar] [CrossRef]
5. Ding, D. Y., Farah, N., Bourbiaux, B., Wu, Y. S., Mestiri, I. (2018). Simulation of matrix/Fracture interaction in Low-permeability fractured unconventional reservoirs. SPE Journal, 23(4), 1389–1411. DOI 10.2118/182608-PA. [Google Scholar] [CrossRef]
6. Lei, X. (2018). Studying the advantage channels of waterflooding reservoir by using reservoir engineering methods (Master Thesis). China University of Petroleum (BeijingChina. [Google Scholar]
7. Bane, R. K., Parker, R. A., Storbeck, W. G., Sunde, R. L. (1994). Reservoir management of the fullerton clearfork unit. Permlan Basin Oil and Gas Recovery Conference, Midland, Texas. DOI 10.2118/27640-MS. [Google Scholar] [CrossRef]
8. Izgec, B., Kabir, S. (2011). Identification and characterization of high-conductive layers in waterfloods. SPE Reservoir Evaluation & Engineering, 14(1), 113–119. DOI 10.2118/123930-PA. [Google Scholar] [CrossRef]
9. Zhang, Y., Yang, Z., Li, D., Liu, X., Zhao, X. (2021). On the development of an effective pressure driving system for ultra-low permeability reservoirs. Fluid Dynamics & Materials Processing, 17(6), 1067–1075. DOI 10.32604/fdmp.2021.016725. [Google Scholar] [CrossRef]
10. Feng, Q., Wang, S., Gao, G., Li, C. (2010). A new approach to thief zone identification based on interference test. Journal of Petroleum Science & Engineering, 75(1–2), 13–18. DOI 10.1016/j.petrol.2010.10.005. [Google Scholar] [CrossRef]
11. Yuan, J., Jiang, R., Zhang, W. (2018). The workflow to analyze hydraulic fracture effect on hydraulic fractured horizontal well production in composite formation system. Advances in Geo-Energy Research, 2(3), 319–342. DOI 10.26804/ager. [Google Scholar] [CrossRef]
12. Shi, Z. (2019). Research on identification method of thief-zone between injection and production wells based on numerical simulation (Master Thesis). Northeast Petroleum University, China. [Google Scholar]
13. Ma, Q., Wu, J., Ma, X. (2019). Transient water injection pattern of block Ga0–21 in Daluhu Oilfield. Special Oil & Gas Reservoirs, 26(6), 103–107. DOI 10.3969/j.issn.1006-6535.2019.06.019. [Google Scholar] [CrossRef]
14. Asadi, M. (2005). An interwell water flood study: flow pattern and reservoir heterogeneity evaluation of tamabra formation of poza rica field area 1. SPE Europec/EAGE Annual Conference, Madrid, Spain. DOI 10.2118/94226-MS. [Google Scholar] [CrossRef]
15. Wang, W., Zheng, D., Sheng, G., Zhang, Q., Su, Y. (2017). A review of stimulated reservoir volume characterization for multiple fractured horizontal well in unconventional reservoirs. Advances in Geo-Energy Research, 1(1), 54–63. DOI 10.26804/ager. [Google Scholar] [CrossRef]
16. Zhao, H., Xu, L., Guo, Z., Liu, W., Shi, L. (2019). A new and fast waterflooding optimization workflow based on insim-derived injection efficiency with a field application. Journal of Petroleum Science and Engineering, 179, 1186–1200. DOI 10.1016/j.petrol.2019.04.025. [Google Scholar] [CrossRef]
17. Xu, L., Zhao, H., Xie, X., Zhang, X., Cao, L., Kang, X. (2017). A new prediction and identification method of polymer flooding crossflow performance. China Offshore Oil and Gas, 29(6), 92–99. DOI 10.11935/j.issn.1673-1506.2017.06.012. [Google Scholar] [CrossRef]
18. Shen, W., Zhao, H., Liu, W., Xu, L., Liao, M. (2018). Identification method of dominant channeling in fractured vuggy carbonate reservoir based on connectivity model. Fault-Block Oil & Gas Field, 25(4), 459–463. DOI 10.6056/dkyqt201804011. [Google Scholar] [CrossRef]
19. Zhao, H., Xu, L., Guo, Z., Zhang, Q., Kang, X. (2019). Flow-path tracking strategy in a data-driven interwell numerical simulation model for waterflooding history matching and performance prediction with infill wells. SPE Journal, 25(2). DOI 10.2118/199361-PA. [Google Scholar] [CrossRef]
20. Feng, L. (2017). Parameter optimization of the cyclic water flooding for the low-permeability fractured oilfield. Petroleum Geology & Oilfield Development in Daqing, 36(5), 114–118. DOI 10.19597/J.ISSN.1000-3754.201706060. [Google Scholar] [CrossRef]
21. Xie, W., Wang, X., Chen, L. I., Hou, X., Tian, F. (2018). Application of characteristics method for two-dimensional, two-phase seepage problem in dual-porosity medium based on streamline. Petroleum Geology and Recovery Efficiency, 25(1), 94–99. DOI 10.13673/j.cnki.cn37-1359/te.2018.01.015. [Google Scholar] [CrossRef]
22. Li, C. L. (2021). Study on fine identification method of dominant channel in low permeability fractured reservoirs. Proceedings of the International Field Exploration and Development Conference 2020, pp. 1354–1364. [Google Scholar]
23. Suri, Y., Islam, S. Z., Stephen, K., Donald, C., Thompson, M. et al. (2020). Numerical fluid flow modelling in multiple fractured porous reservoirs. Fluid Dynamics & Materials Processing, 16(2), 245–266. DOI 10.32604/fdmp.2020.06505. [Google Scholar] [CrossRef]
24. Shen, W., Li, X., Cihan, A., Lu, X., Liu, X. (2019). Experimental and numerical simulation of water adsorption and diffusion in shale gas reservoir rocks. Advances in Geo-Energy Research, 3(2), 165–174. DOI 10.26804/ager.2019.02.06. [Google Scholar] [CrossRef]
25. Meng, M., Chen, Z., Liao, X., Wang, J. L.(2020). A Well-testing method for parameter evaluation of multiple fractured horizontal wells with non-uniform fractures in shale oil reservoirs. Advances in Geo-Energy Research, 4(2), 187–198. DOI 10.26804/ager.2020.02.07. [Google Scholar] [CrossRef]
26. Hui, Z., Kang, Z., Zhang, X., Sun, H., Lin, C. et al. (2015). INSIM: A data-driven model for history matching and prediction for waterflooding monitoring and management with a field application. SPE Reservoir Simulation Symposium, Houston, Texas, USA. DOI SPE-173213-MS. [Google Scholar]
27. Jing, W., Huiqing, L., Zenglin, W. (2012). Quantitative models of development laws for heterogeneous sandstone reservoirs by water flooding. Open Petroleum Engineering Journal, 5(1), 26–35. DOI 10.2174/1874834101205010026. [Google Scholar] [CrossRef]
28. Tao, D. S. (2011). Study on inferring inter-well connectivity quantitatively from well signals in waterfloods and polymer floods (Master Thesis). China University of Petroleum, China. [Google Scholar]
 | This work is licensed under a Creative Commons Attribution 4.0 International License, which permits unrestricted use, distribution, and reproduction in any medium, provided the original work is properly cited. |