| Fluid Dynamics & Materials Processing |
DOI: 10.32604/fdmp.2022.022095
ARTICLE
Comparative Analysis of the Measured and Simulated Performances of a Grid-Connected Photovoltaic Power Plant
LPS, FSDM, University Sidi Mohammed Ben Abdellah, Fez, Fez-Atlas, 30003, Morocco
*Corresponding Author: Mourad Benfares. Email: benfaresmourad35@gmail.com
Received: 21 February 2022; Accepted: 24 March 2022
Abstract: The present study comparing actual data and simulated parameters was carried out using the PVsyst software for a 5.94 KWp grid-connected photovoltaic system, consisting of three types of mono-Si (2.04 KWp), poly-Si (2.04 KWp) and amorphous-Si (1.86 KWp) photovoltaic panels and a weather station. The research is based on data collected for one year (2020) of energy production Simulations were performed using long-term meteorological data generated by NASA and on-site measurement. A comparison of evaluated monthly and annually performance elements has also been considered: Eac, PR, FC. As shown by the results, each photovoltaic technology has certain advantages in different weather conditions. The uncertainties of the PVSyst software used to estimate the output of the photovoltaic installation have also been critically examined.
Keywords: PV technologies; simulation; productivity; performance analysis
Nomenclature
| PV: | Photovoltaic |
| Eac: | Energy injected into the grid |
| PR: | Performance ratio |
| FC: | Capacity factor |
Many users want to know and quantify the accuracy that can be expected from PVsyst simulation predictions. Some ask for guarantees on its operation, necessary for the evaluation of the financial balance sheet of the projected installations. These guarantees are notably required by investors (bankers). But this precision is difficult to evaluate. We cannot provide guarantees, as the results depend largely on the parameters provided at the input. Okello et al. [1], the performance of the system simulates using PVsyst software using measured and Metronome derived climate data sets (solar radiation, ambient temperature, and wind speed). The comparison between measured and simulated energy yield results were similar, better comparison between measured and predicted monthly energy yield is observed with simulation performed using measured weather data at the site.
As a result, the number of photovoltaic installers is increasing, who need to provide their customers with energy production forecast figures. Individuals also rightly want to know what a possible installation could bring them, or to check the validity of the performances announced by the installers. The production of energy by photovoltaic conversion depends on a very large number of parameters (sunshine, temperatures, etc.) which fluctuate significantly. It is therefore very difficult to make a precise evaluation. There are many software packages on the market that can be used to estimate this production. Here we will compare one of these software’s and try to determine if it is suitable for three given uses: use in a company, in a private home or for educational purposes, because the development of photovoltaics implies of course a development of teaching in this field [2]. Similar study is realized in Morocco, Boughamrane et al. [3] established the comparison of actual measurements collected on site with simulated estimates given by PVsyst located at Assa, southern Morocco, they concluded the simulation results gave a good approximation to measured energy output and irradiation; however, the simulation is less accurate when it comes to the ambient air temperature. In another study, Shukla et al. [4] presented a Simulation and performance analysis of 110 kWp grid-connected photovoltaic system for residential building in India, they concluded System simulation is necessary to investigate the feasibility of Solar PV system at a given location, to compares the performances of different PV technologies based on simulated energy yield and performance ratio. Zaoui et al. [5] found from experimental and simulation analysis, it is concluded that: The panel temperature and power are related to the irradiance and other external factors.The aim of this study is to evaluate the efficiency of grid-connected photovoltaic systems of 5.94 KWp between real data and simulated parameters using PVsyst software during one year 2020, composed of three different types of photovoltaic modules: mono-Si (2.04 KWp), poly-Si (2.04 KWp) and amorphous-Si (1.86 KWp) mounted on the rooftop of the Faculty of Sciences Dhar El Mahraz in Fez, Morocco.
This paper is structured as follows. The first and second sections of this paper are devoted to the description of the location of the installation and the different PV systems, followed by the definitions of the PVsyst software. The third section is focused on the evaluation and comparison of the performance of the grid-connected PV system between the real results collected experimentally and those simulated by the PVsyst software. Lastly, the results are summarised in the conclusion.
2 Description of the Test Installation
The photovoltaic solar panels with a total power of 5.94 KWp connected to the grid are installed on the roof of the Faculty of Sciences Dhar El Mahraz Fez, Morocco with 34°2’0" North latitude and 4°58’36" West longitude (see Fig. 1)
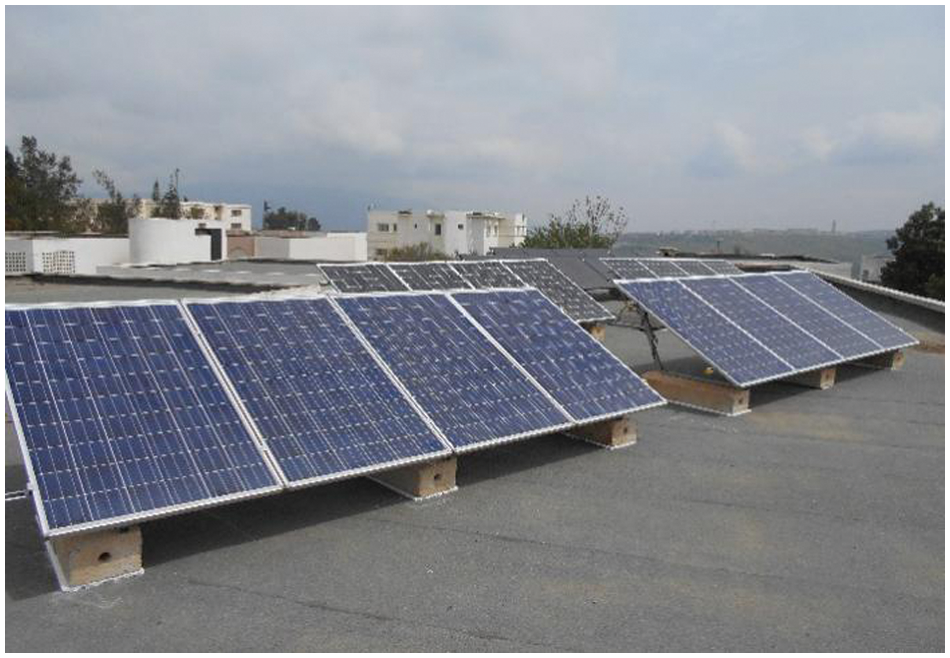
Figure 1: Photovoltaic systems
The installed grid-connected photovoltaic system is constructed of three technologies: 8 monocrystalline solar panels (mc-Si), 8 polycrystalline solar panels (poly-Si), each with a power of 255 Wp. and 12 amorphous silicon panels (amorphous-Si) each with a power of 155 Wp. The solar PV panels are installed facing south (Azimuth equal to 0) with a tilt angle of 31°. Each PV technology was attached to its specific Sunny Boy 2000 HF-30 inverter [6].
Meteorological data: horizontal and inclined solar irradiation, wind speed and direction, ambient temperature are collected by a weather station [7].
PVsyst [8] is a software developed by the University of Geneva. It is aimed at architects or engineers working in the field of renewable energies but is also suitable for education. The software is divided into four distinct parts: pre-dimensioning, project design and tools.
In the database part, the software asks to enter the site location data for a given project, in our case we can choose as Faculty of Sciences Dhar El Mahraz-Fez site. After having located the site, we click on the “import” button to import the meteorological data of the site in PVsyst, these monthly data represent the irradiation and the average temperature.
After the definition of the geographical parameters of the site, in the design part of the project, the active parameters of the site (inclination, Azimuth…) are specified. The PV system installed at FSDM is south facing (Azimuth = 0°), the tilt angle is 31°, see Fig. 2. Then, the characteristics of the solar panels of PV system are specified: Module brand, Number of modules, Module area and Nominal PV power.
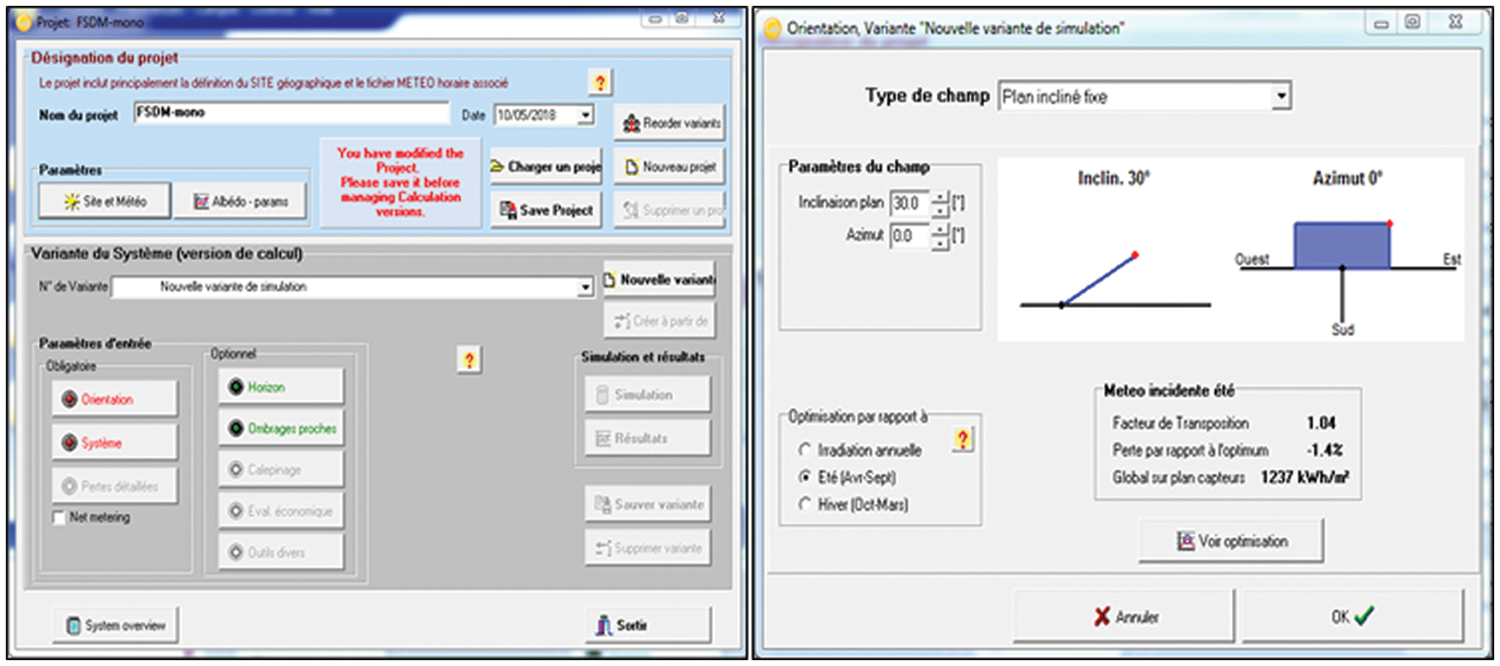
Figure 2: Project definition, orientation, and tilt of the PV system
After locating and importing the meteorological data of the site and characterizing the PV system in PVsyst software, the simulation is started for all three types of PV panels. Then a results window appears, through which simulation data can be retrieved of the three silicon technologies.
The analysis of the experimental performance of the three installed technologies (mono-Si, poly-Si, amorphous-Si) connected to the grid was carried out by using the indicators recommended by IEC 61724, NREL and SMA [9].
3.1 Comparison of Measured and Simulated Weather Data
NASA-SSE meteorological data [10] (irradiation, temperature) entered in PVsyst software are presented and compared with the data measured in the study site.
The measured average daily solar radiation derived from NASA shows a deviation that varies between 8% and 30% during most months in Fig. 3, except in April, when the deviation is zero. We can consider that these different irradiation data are identical for this month. It can be observed that the measured irradiations are lower than the simulated irradiations in the summer months. And opposite for the winter months.
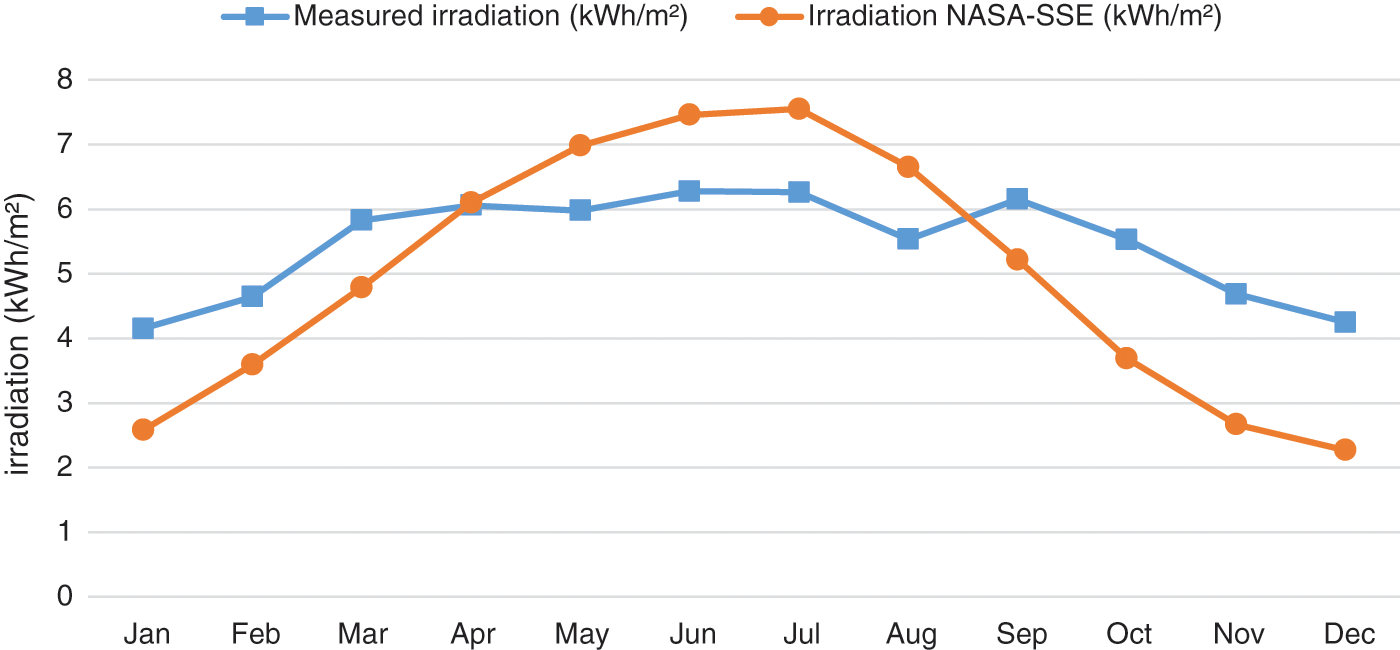
Figure 3: Average monthly tilted solar irradiance measured and simulated using NASA databases
Fig. 4 shows the monthly variations of the long-term mean values measured and simulated with PVsyst software for the ambient temperature, some differences vary between 3% and 19%. However, this difference decreased significantly from July to reach 2% in August.
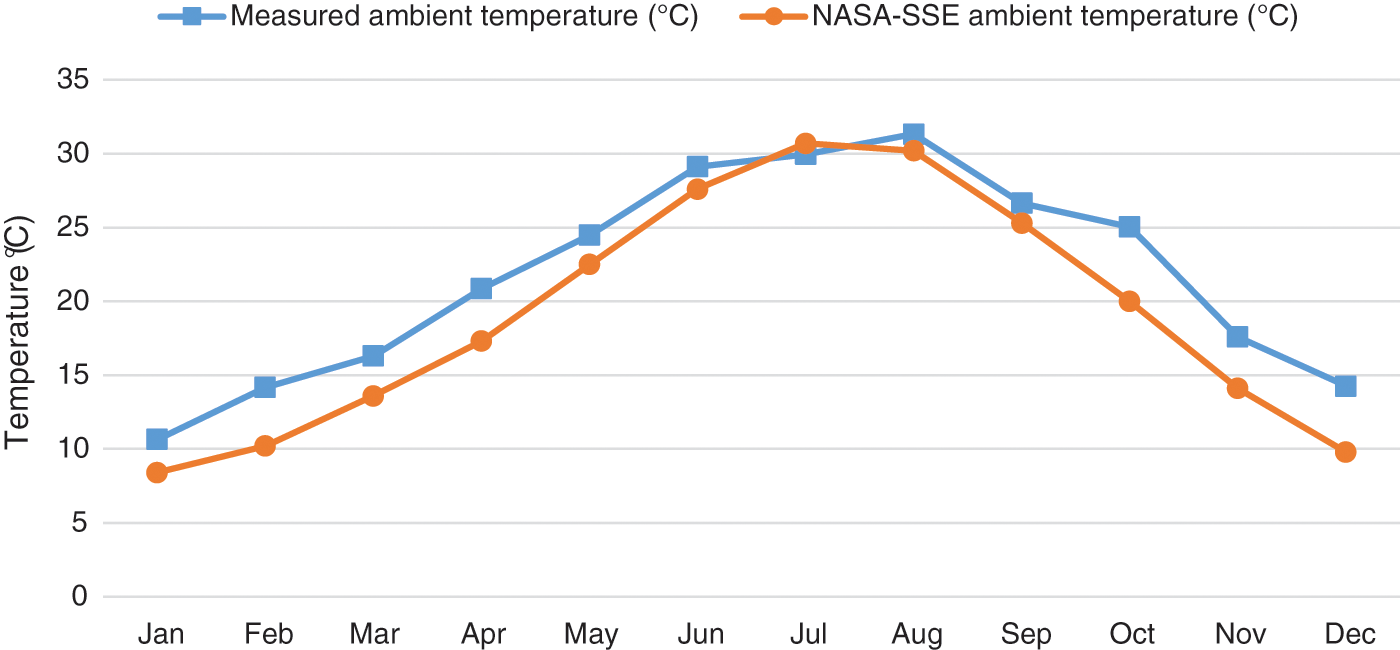
Figure 4: The monthly average ambient temperature measured and simulated using NASA databases
3.2 Comparison of Measured and Simulated Performance Parameters
The total monthly energy supplied to the grid and the energy estimated using PVsyst is directly related to the irradiation as shown in Fig. 5. In addition, energy production is affected by temperature change, so the correlation of energetics and irradiation is not always true.
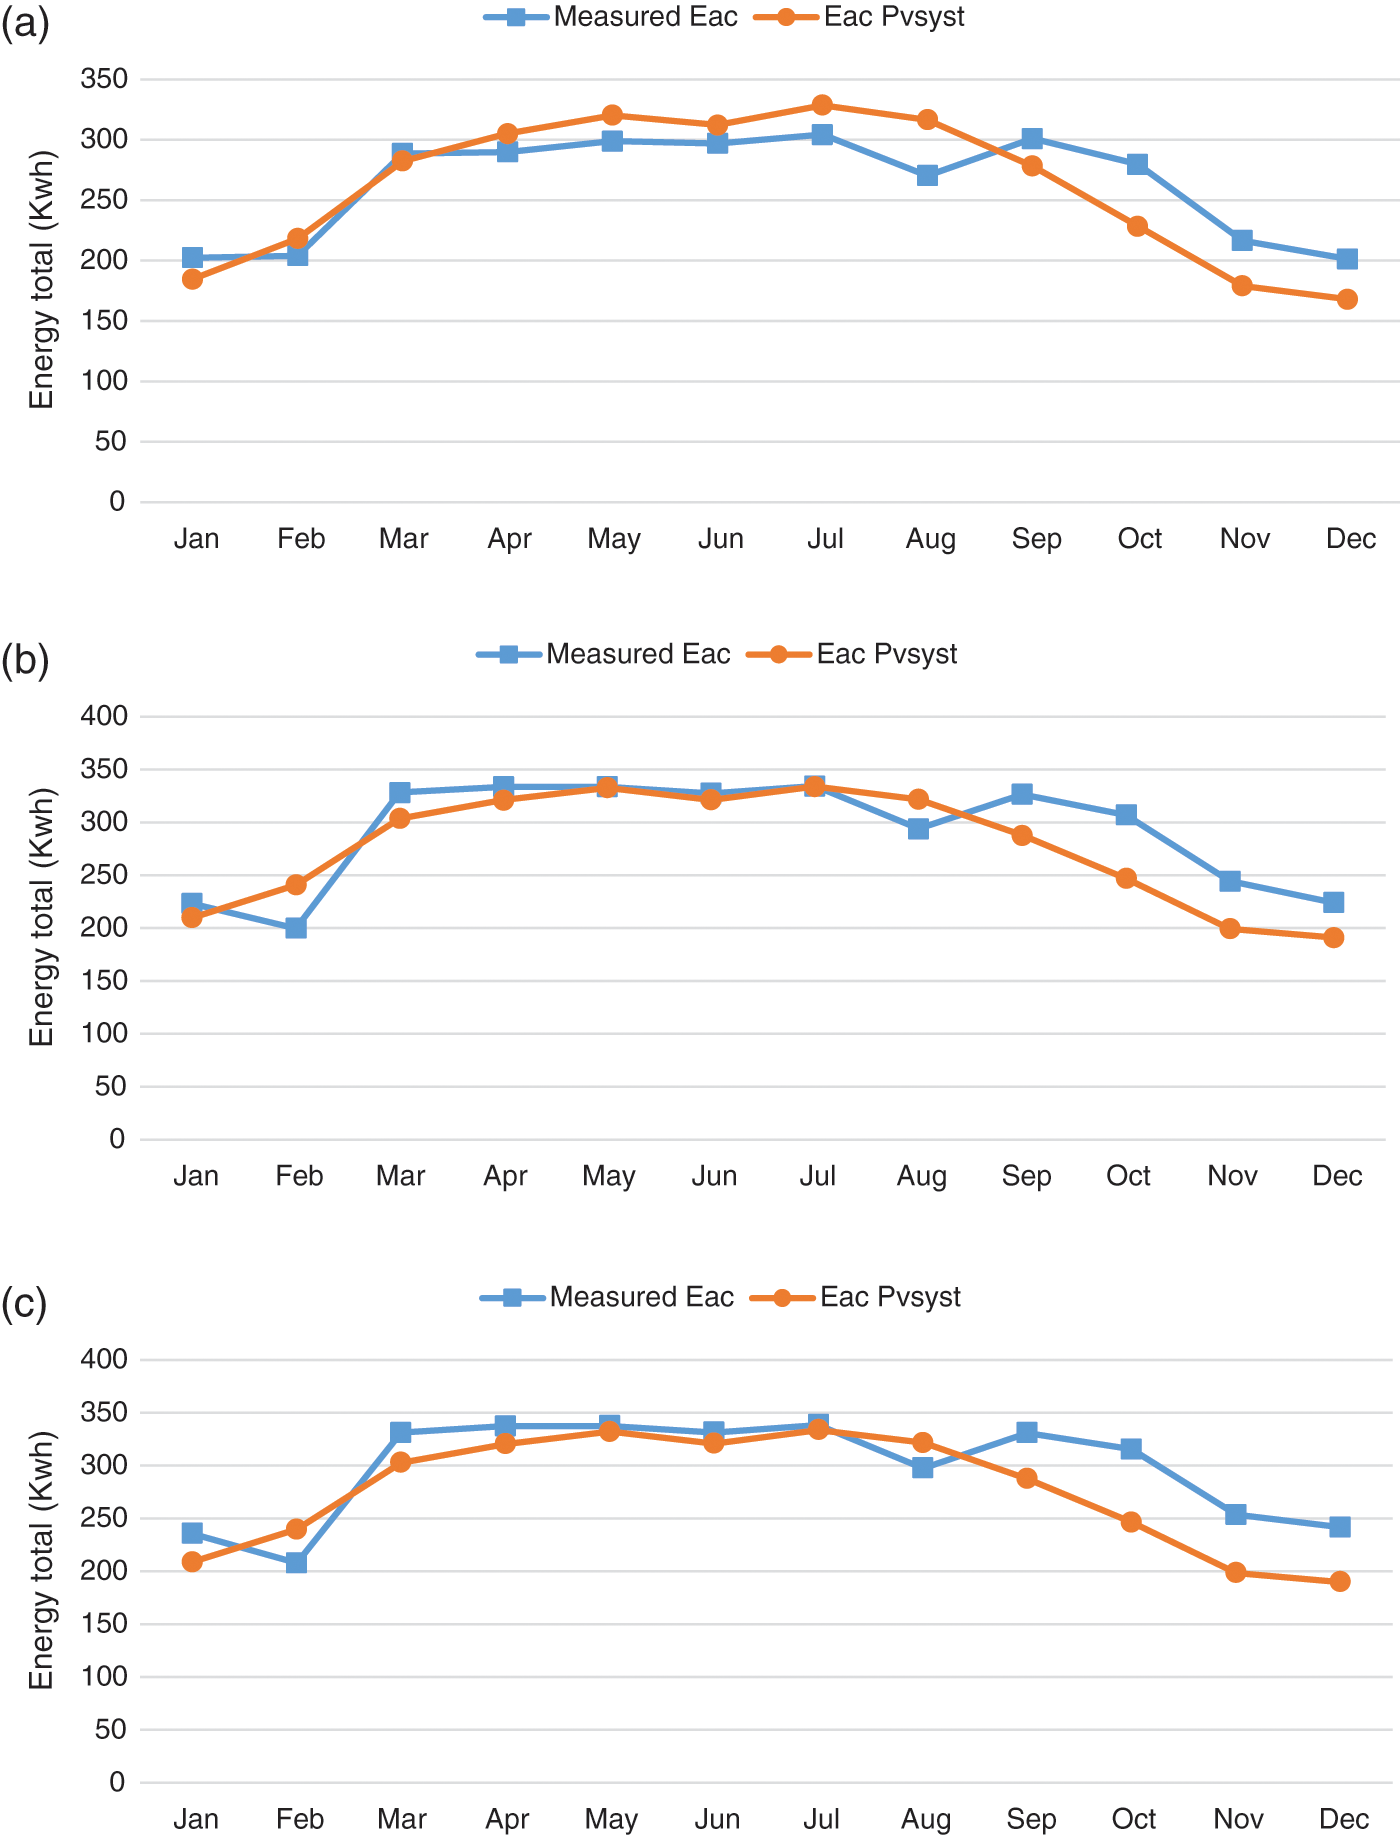
Figure 5: The total measured and simulated energy injected into the grid for amorphous-Si (a), mono-Si (b) and poly-Si (c)
The difference between the measured energy value and the energy estimated by PVsyst varies from 10% in October as a maximum value, and 1% in March as a minimum, for a-Si. Varies between 11% in October and 0% in May and July for a-Si. And between 12% as maximum value in October, November, and December and 1% as minimum value in May and July for poly-Si technology.
3.2.2 The Performance Ratio PR
The performance of the photovoltaic system is highly dependent on weather conditions such as shading, irradiation, surface temperature of the PV panels, etc. [11]. The performance of the PV panels was analyzed using the measured performance of the PV systems for the monitoring period. As performance deterioration and losses.
The performance ratio of the PV systems was simulated using the PVsyst software. Specified parameters provided by the PV component specifications are used and compared with the actual measured performance results of the PV systems (Fig. 6).
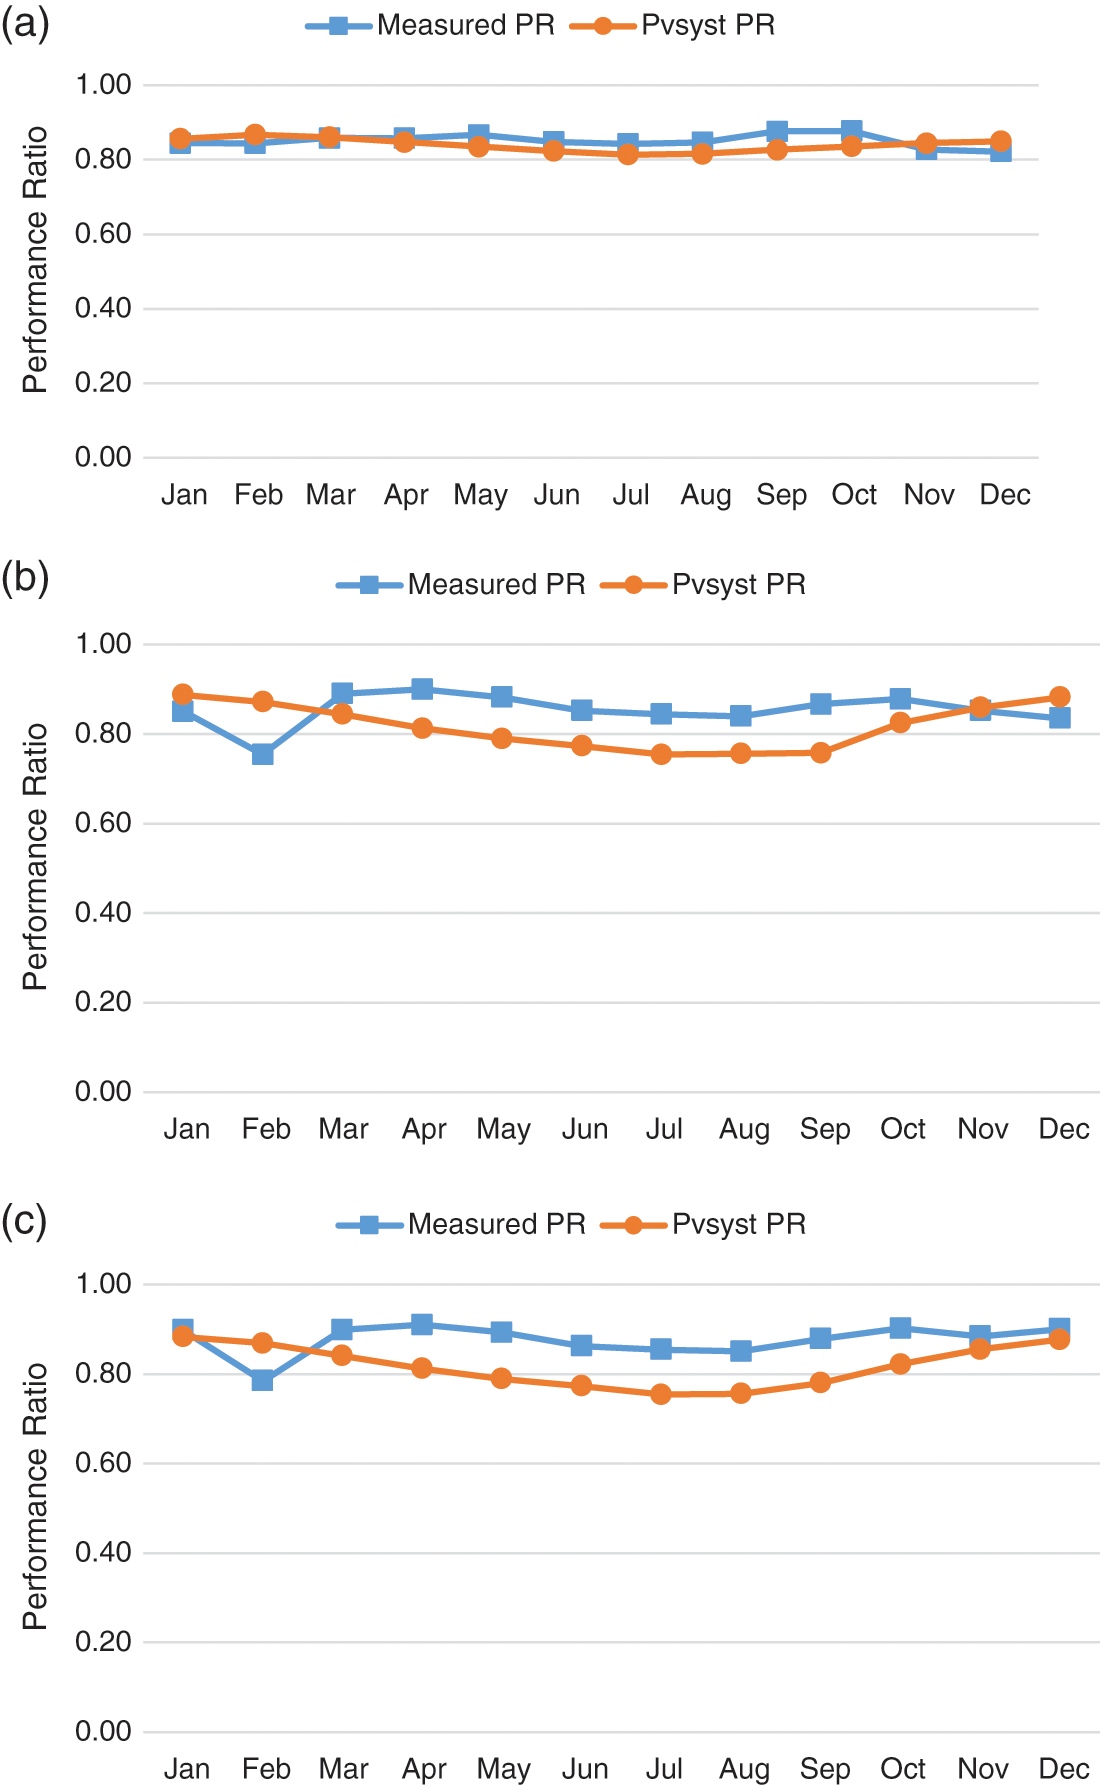
Figure 6: The measured and simulated monthly performance ratio (a) For amorphous-Si, (b) For mono-Si and (c) For poly-Si
The simulated results show that the PVsyst software gives the estimated results in agreement with the actual measured results, with an uncertainty ranging from 0% to 3% for the amorphous-Si technology. This uncertainty can be high for the other two technologies when it varies between 0% and 7%, this is since both mono-Si and poly-Si technologies are more sensitive to meteorological conductions when their performance is low if the amount of irradiation is decreased. This explains the reduced uncertainty between the measured and simulated results for a-Si technology which is not affected by the amount of irradiation.
The capacity factor is an indicator that represents the fraction for one year when the PV system is operating at its rated power [12]. In this section, the simulated and measured CF of the three technologies is graphically represented in Fig. 7. Minimum values (14%, 14%, and 15% respectively for amorphous-Si, mono-Si, and poly-Si) were recorded in January and December due to system failure during this period, for the minimum values simulated by the PVsyst software they are lower than those measured in the same periods.
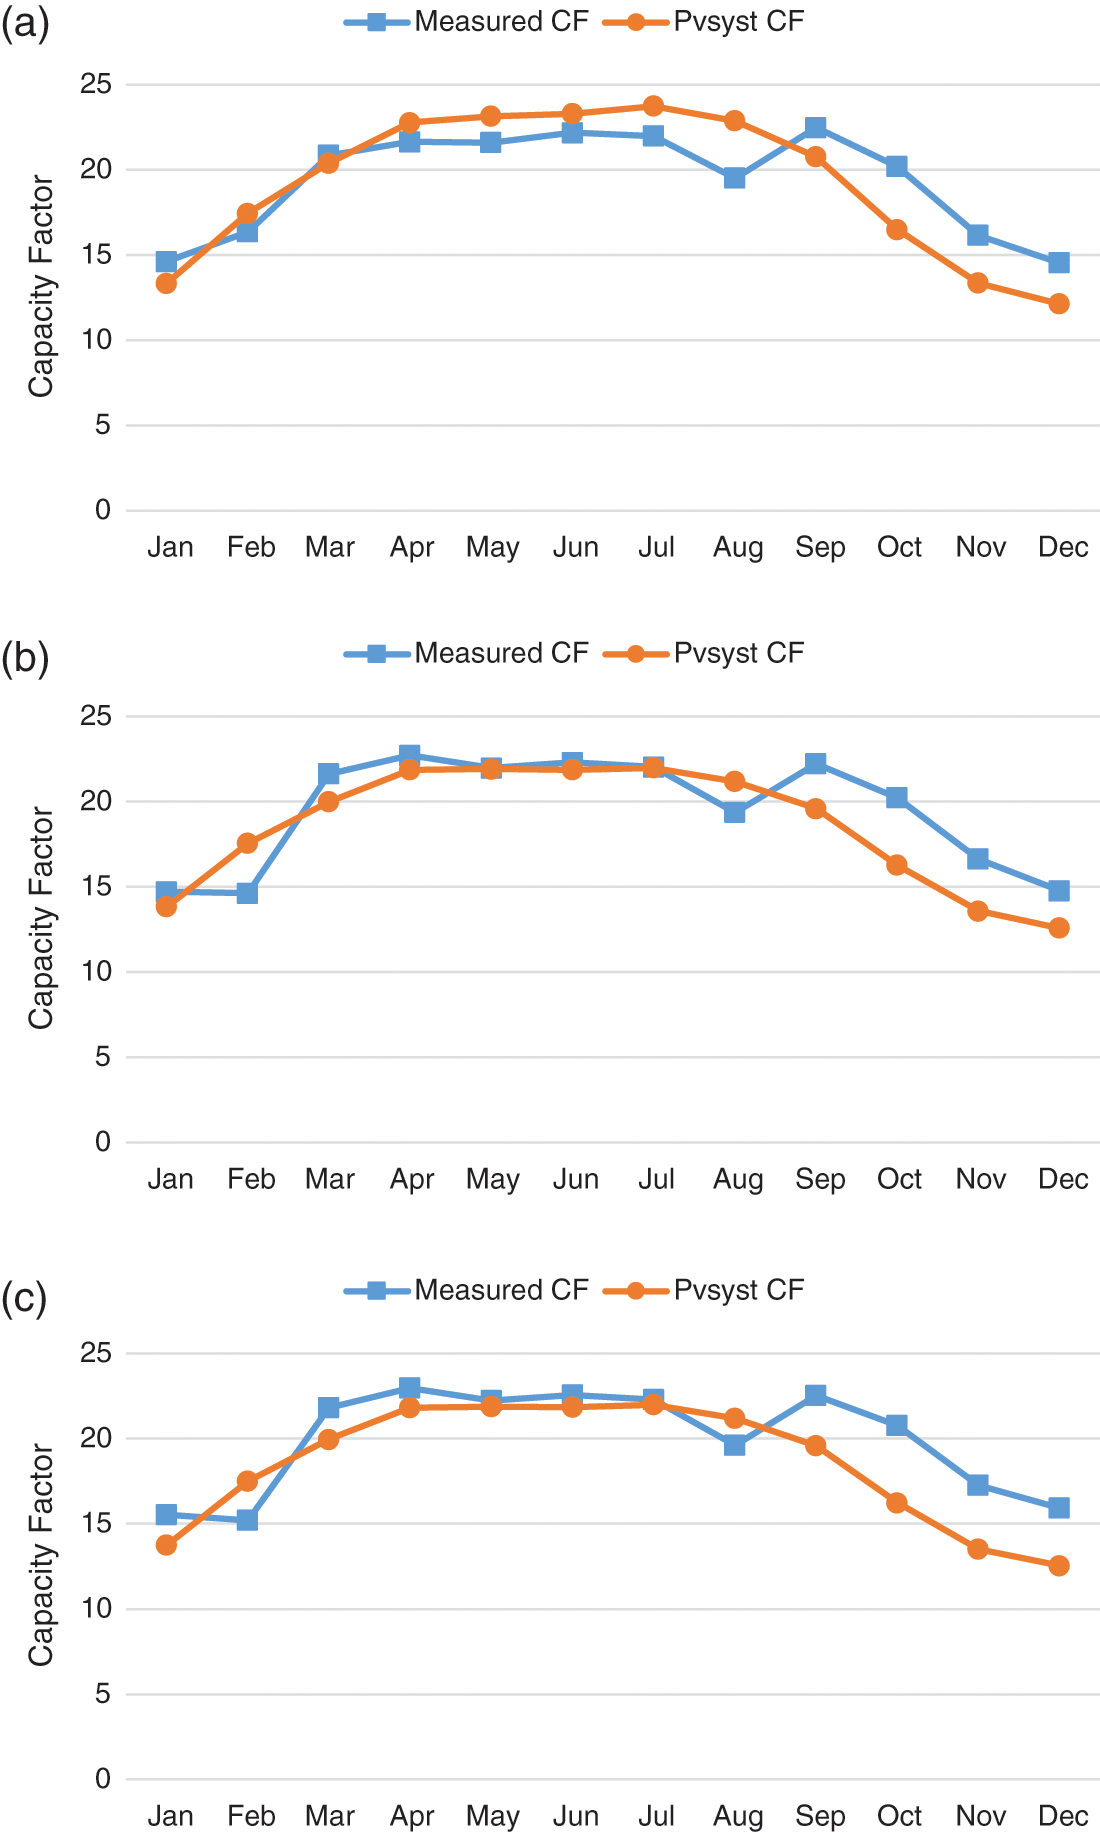
Figure 7: Monthly capacity factors measured and simulated. (a) For amorphous-Si, (b) For mono-Si, and (c) For poly-Si
It can be seen from the two curves (a) and (b) that the simulated values are in close agreement with the actual measured results with a deviation ranging from 0% to 2% for the three months May, June, and July. This may be since the energy productions are identical for these three periods, when the simulated solar radiation data are close to the measured data.
This paper investigated a comparative analysis between real data and simulated parameters using the PVsyst software. The performance study is based on experimental data collected in 2020 from mono-Si (2.04 KWp), poly-Si (2.04 KWp) and amorphous-Si (1.86 KWp) PV panels. The simulations were performed using long-term meteorological data generated by NASA and on-site measurements.
This study showed that the uncertainties of the PVSyst software used to estimate the output of a photovoltaic systems are drawn from this study.
The measured average daily solar radiation and temperature derived from NASA shows a deviation that varies between 8% and 30% for radiation. some differences vary between 3% and 19% for temperature.
The simulated results show that the PVsyst software gives the estimated results in agreement with the actual measured results, with an uncertainty ranging from 0% to 3% for the a-Si technology. 0% to 7% for mono-Si, and poly-Si technology.
The simulated values and are in close agreement with the actual measured CF results with a deviation ranging from 0% to 2% CF of the three technologies.
Finally, regardless of the discrepancies displayed by this commercial software, it can be considered that the results are generally useful, and their features and ease of use make them an essential tool for the planning and rapid evaluation of the performance of a PV installation.
Funding Statement: This work is part of the ‘Propre.Ma’ Project which has been sponsored by IRESEN (Morocco) since February 2014. In the name of all the rest of the consortium members, authors would like to thank IRESEN Board and Scientific Committee for financing this through the INNO’PV Program as well as its General Manager, Badr IKKEN, and the rest of the staff for their daily efforts. Authors are grateful to all the other members of the ‘Propre.Ma’ Consortium.
Conflicts of Interest: The authors declare that they have no conflicts of interest to report regarding the present study.
1. Okello, D., van Dyk, E. E.,Vorster, F. J. (2015). Analysis of measured and simulated performance data of a 3.2 kWp grid-connected PV system in Port Elizabeth, South Africa. Energy Conversion and Management, 100(2), 10–15. DOI 10.1016/j.enconman.2015.04.064. [Google Scholar] [CrossRef]
2. Huld, T. (2017). PVMAPS: Software tools and data for the estimation of solar radiation and photovoltaic module performance over large geographical areas. Solar Energy, 142(656), 171–181. DOI 10.1016/j.solener.2016.12.014. [Google Scholar] [CrossRef]
3. Boughamrane, L., Boulaid, M., Tihane, A., Sdaq, A., Bouabid, K. et al. (2016). Comparative analysis of measured and simulated performance of the moroccan first MV grid connected photovoltaic power plant of assa, Southern Morocco. Journal of Materials and Environmental Science, 7(11), 4064–4072. [Google Scholar]
4. Akash Kumar, S., Sudhakar, K., Prashant, B. (2016). Simulation and performance analysis of 110 kWp grid-connected photovoltaic system for residential building in India: A comparative analysis of various PV technology. Energy Reports, 2(5), 82–88. DOI 10.1016/j.egyr.2016.04.001. [Google Scholar] [CrossRef]
5. Zaoui, F., Titaouine, A., Becherif, M., Emzianex, M., Aboubou, A. (2015). A combined experimental and simulation study on the effects of irradiance and temperature on photovoltaic modules. Energy Procedia, 75(12), 373–380. DOI 10.1016/j.egypro.2015.07.393. [Google Scholar] [CrossRef]
6. Haibaoui, A., Hartiti, B., Elamim, A., Karami, M., Ridah, A. (2017). Performance indicators for grid-connected PV systems: A case study in Casablanca, Morocco. IOSR Journal of Electrical and Electronics Engineering, 12(2), 55–65. DOI 10.9790/1676-1202015565. [Google Scholar] [CrossRef]
7. Aarich, N., Erraissi, N., Akhsassi, M., Lhannaoui, A., Raoufi, M. et al. (2014). Propre.Ma project: Roadmap & preliminary results for grid-connected PV yields maps in Morocco. International Renewable and Sustainable Energy Conference (IRSEC), Ouarzazte, Morocco. [Google Scholar]
8. http://www.pvsyst.com/5.0/index.php. [Google Scholar]
9. Woyte, A., Richter, M., Moser, D., Reich, N., Green, M. et al. (2014). Analytical monitoring of grid-connected photovoltaic systems good practices for monitoring and performance analysis. IEA-PVPS T13-03: 2014. IEA PVPS Task 13, Subtask 2. International Energy Agency Photovoltaic Power Systems Programme. DOI 10.13140/2.1.1133.6481. [Google Scholar] [CrossRef]
10. https://power.larc.nasa.gov/common/php/SSE_ExSummary.php. [Google Scholar]
11. Mourad, B., Izeddine, Z., Ali Didi, S., Anouar, J., Mohammed El, G. (2020). Performance analysis of different grid-connected PV technologies under Fez weather conditions. MATEC Web of Conference, 330, 1014. [Google Scholar]
12. Lotfi, H., Boughamrane, L., Izbaim, D. (2020). Performance of different silicon PV technologies installedin Laâyoune–Morocco. Applied Journal of Environmental Engineering Science, 6(2), 160–172. DOI 10.48422/IMIST.PRSM/ajees-v6i2.20473. [Google Scholar] [CrossRef]
 | This work is licensed under a Creative Commons Attribution 4.0 International License, which permits unrestricted use, distribution, and reproduction in any medium, provided the original work is properly cited. |