| Fluid Dynamics & Materials Processing |
DOI: 10.32604/fdmp.2023.019971
ARTICLE
Numerical Simulation of Two-Phase Flow in Glutenite Reservoirs for Optimized Deployment in Horizontal Wells
1School of Petroleum Engineering, Yangtze University, Wuhan, 430100, China
2Key Laboratory of Drilling and Production Engineering for Oil and Gas, Wuhan, 430100, China
3Western Research Institute, Yangtze University, Karamay, 834000, China
4Heavy Oil Company, Xinjiang Oilfield Company of CNPC, Karamay, 834000, China
*Corresponding Author: Yuhui Zhou. Email: zhyhtree@yangtzeu.edu.cn
Received: 27 October 2021; Accepted: 11 December 2021
Abstract: It is known that the pore media characteristics of glutenite reservoirs are different from those of conventional sandstone reservoirs. Low reservoir permeability and naturally developed microfractures make water injection in this kind of reservoir very difficult. In this study, new exploitation methods are explored. Using a real glutenite reservoir as a basis, a three-dimensional fine geological model is elaborated. Then, combining the model with reservoir performance information, and through a historical fitting analysis, the saturation abundance distribution of remaining oil in the reservoir is determined. It is shown that, using this information, predictions can be made about whether the considered reservoir is suitable for horizontal well fracturing or not. The direction, well length, well spacing and productivity of horizontal well are also obtained.
Keywords: Glutenite reservoir; horizontal well; reservoir numerical simulation; residual oil; optimal deployment
Glutenite reservoir is an important type of oil and gas resources [1]. The heterogeneity of conglomerate reservoir is particularly prominent. It is controlled not only by tectonic and sedimentary facies, but also by lithofacies [2]. Conglomerate reservoir is a complex reservoir, which results in large size change of debris and various lithologic components [3]. The internal structure of the reservoir is complex, the lateral phase transformation is fast, and the plane prediction is difficult [4]. Composition and structure maturity is low, and conventional logging response is poor [5]. In addition, conglomerate reservoirs are usually dense and have poor reservoir properties. As a result, the development of conglomerate reservoir is difficult, the development cost is high and the economic benefit is low, which restricts the development of conglomerate reservoir [6–8]. The development practice of glutenite reservoir shows that low production and poor development effect are common problems in vertical Wells. However, compared with vertical Wells, horizontal Wells are better developed than vertical Wells under similar conditions [9–11].
WU reservoir is a typical conglomerate reservoir in the southwest of Mahu west slope in Junggar basin. The main pore types are intergranular pore, intergranular dissolved pore, micropore and microfracture. The pore filling degree is high, and the filling materials mainly include zeolite, authigenic quartz, illite, illite-montmorillonite mixed layer, etc. The capillary pressure curve of the reservoir core is mainly steep slope, indicating that the reservoir is highly heterogeneous. The reservoir has poor physical properties, with an average porosity of 8.7% and average permeability of 19.63 mD. WU reservoir was put into development in July 1993, and the production wells were all vertical Wells, which experienced two stages of natural energy development and water injection development. So far, the recovery degree of the reservoir is only 5.9%, the vertical well development effect is poor, and the remaining oil reserves are large. Therefore, it is urgent to change the development mode and improve the reservoir development effect. Since horizontal wells play a huge role in the development of low permeability tight reservoirs, they have the advantages of large contact area with oil layer, high production rate, slow decline rate and strong continuous production capacity [12–14]. Based on preliminary demonstration and analysis in WU reservoir, horizontal well development can achieve better development results, but it will be affected by a variety of factors, such as the length and spacing of horizontal wells [15,16].
Therefore, in order to improve the development effect of horizontal well in Wu reservoir, it is necessary to deepen the understanding of reservoir structure, sand body spatial distribution and physical property distribution, and establish a fine 3D reservoir geological model based on the fine reservoir description study. Combined with production dynamic data, a reservoir numerical simulation model is established. Through numerical simulation, the oil saturation and remaining oil distribution in the reservoir are clarified. Identify favorable areas for horizontal well deployment. Finally, reservoir engineering method is used to demonstrate horizontal well direction, horizontal well section length, well spacing and productivity, and reasonable horizontal well deployment parameters are obtained.
2 Geological Characteristics of the WU Reservoir
2.1 Geological Characteristics
The Junggar Basin entered the stage of formation, evolution and development in late Paleozoic. From the late Carboniferous to the Early Permian, the Junggar block collided with the Siberian plate and formed a foreland depression near the uplifted orogenic belt. The mountainous open Marine basin in Junggar Basin has been transformed from the sedimentation center to the inland basin and then to the tectonic system of the mountainous basin. The northwest margin basin also experienced several stages of tectonic sedimentary development and evolution.
2.2 Fine Sublayer Division and Correlation
With the application of high-resolution sequence stratigraphy theory in the field of petroleum exploration and development, the method of sequence division and cycle isochronal correlation based on base-level cycle principle has also been widely used in sand body comparison [17]. The technical method not only considers the relationship between base-level cycle and reservoir structure, but also considers the relationship between horizontal and multi-level cycle classification criteria of relevant reservoir structure. In long-term stratigraphic cycles, the isochronicity of flood surface and sequence interface is emphasized. In short-term stratigraphic cycles, it is emphasized that the isochronicity of flood surface and sequence interface controls the genetic type, sedimentary sequence, sedimentary location and sand body geometry. At the same time, the sand body is described and tracked in the isochronous stratigraphic framework of corresponding time scale and grade by using the multi-level correlation technique of long-term high cycle returning to short-term low cycle.
According to the regional geological characteristics, combined with the lithology and electrical characteristics, the marker layer is accurately selected. At the same time, considering the reservoir horizon distribution, determine the typical wells, establish the comprehensive columnar section and skeleton correlation section of the reservoir, gradually track and compare horizontally, realize the “closure” of the whole region, and finally determine the stratigraphic division scheme.
The main oil-bearing layer of the oil layer is P3w1 formation, which belongs to the glutenite sedimentary reservoir of the main channel and channel beach of the diluvial fan. There is little lateral change in thickness, poor comparability of spontaneous potential formation, strong comparability of natural gamma curve formation, and formation correlation is dominated by gamma curve, supplemented by spontaneous potential, resistivity and other curves.
The P3w1 formation is located in the lower part of the reservoir. According to the sedimentary cycle and lithologic assemblage, the oil-bearing strata can be divided into three sand body groups and five small layers.
2.3 Stratigraphic Characteristics
It can be seen from the north-south and east-west connecting well sections that the sand formation of P3w1 pinches out in the north and southwest of the reservoir, the top is denuded to varying degrees from west to east, and is in angular unconformable contact with the overlying strata (Figs. 1 and 2).

Figure 1: East-west interwell contrast section

Figure 2: North-south interwell contrast section
According to the analysis of mercury injection data of rock samples in the formation, the reservoir belongs to the reservoir type of fine throat-micro throat, small pore-micro pore. The capillary pressure curve platform is not obvious, mainly steep inclined type, reservoir heterogeneity is strong. The physical property of the reservoir is poor, the average porosity is 8.7%, mainly located between 6%–10%, the average permeability is 19.63 mD, mainly located between 0.1–100 mD, the whole belongs to ultra-low porosity, low-medium permeability reservoir. Overall, P3w11 substratum has poor physical properties, P3w12 substratum is slightly better, and P3w13 substratum had no core analysis data. According to the logging interpretation results, the physical properties are the worst.
3 Research on Three-Dimensional Geological Modeling and Reservoir Numerical Simulation
3.1 Three-Dimensional Geological Modeling
Reservoir geological model is the concrete expression of the distribution and change of reservoir characteristics and heterogeneity in three-dimensional space. In fact, reservoir modeling is to establish a three-dimensional spatial distribution and change model of reservoir parameters representing reservoir physical properties. Reservoir parameters include porosity, permeability, oil saturation and reservoir thickness. Reservoir modeling is based on database. The richness and accuracy of data determine the accuracy of the model to a great extent. According to the needs of 3D geological modeling, collect and sort out various data, load them into the modeling software, and establish the 3D geological modeling working area of the study area. On the basis of fine stratigraphic classification and correlation and microstructure research, and constrained by P3w1 surface structure data, the structural model of each single layer in this area is established. In this model, the isochronous stratigraphic framework model in this area is established by combining the control of formation thickness and fine stratification of well points.
Based on the isochronous stratigraphic grid model, the lithology interpretation results of 114 wells in WU reservoir were statistically sorted out. The lithology was appropriately classified, and then imported it into the modeling software for discretization. The sedimentary facies model was established under the control of the distribution of single-layer plane sedimentary microfacies.
The establishment of sedimentary facies model is also based on the tectonic stratigraphic grid model. The establishment process of sedimentary facies model is to digitally import the four single-layer plane sedimentary microfacies distribution maps in this area into the software in turn. With the plane sedimentary microfacies distribution as the trend constraint, and the single-well facies interpretation data of 114 wells in the south-of-area as the known control point data, the three-dimensional geological model of sedimentary facies of WU reservoir is established through weight analysis, source direction setting and geostatistics interpolation.
The reservoir parameter model is mainly based on the log interpretation porosity, permeability, oil saturation and other data of 114 wells in Wu reservoir. The geostatistics method is adopted and the sedimentary facies model is taken as the control condition. Reservoir physical parameters are regarded as regional variables with a certain distribution range. Through the calculation of variogram, fit the appropriate variogram model, predict and simulate the inter well reservoir parameters, and obtain the three-dimensional model of reservoir parameters, so as to establish the three-dimensional geological model of reservoir.
The results of reservoir modeling provide three-dimensional data volume of reservoir properties. The reservoir characteristic parameters outside the well point are defined. Researchers can slice along any direction as needed to observe the changes of reservoir physical parameters. Thus, it provides conditions for quantitative analysis of reservoir properties. For example, the inter well variation of reservoir parameters, inter well connectivity of sand body and inter layer heterogeneity can be observed through vertical profile or inter well profile and grid diagram. The plane distribution of reservoir parameters obtained by the three-dimensional model can visualize and quantify the macro geometry of the reservoir, the connectivity between sand bodies and wells, lateral extinction and physical property changes, so as to reveal the heterogeneity of the reservoir. As shown in the figure, the three-dimensional model of porosity (Fig. 3) and permeability (Fig. 4) in the south area can clearly reveal the spatial changes of reservoir physical parameters and fluids. The study of 3D geological model provides an important reference for reservoir heterogeneity research, reservoir optimization, well pattern deployment, well pattern improvement and target optimization.

Figure 3: Three-dimensional porosity model of WU reservoir
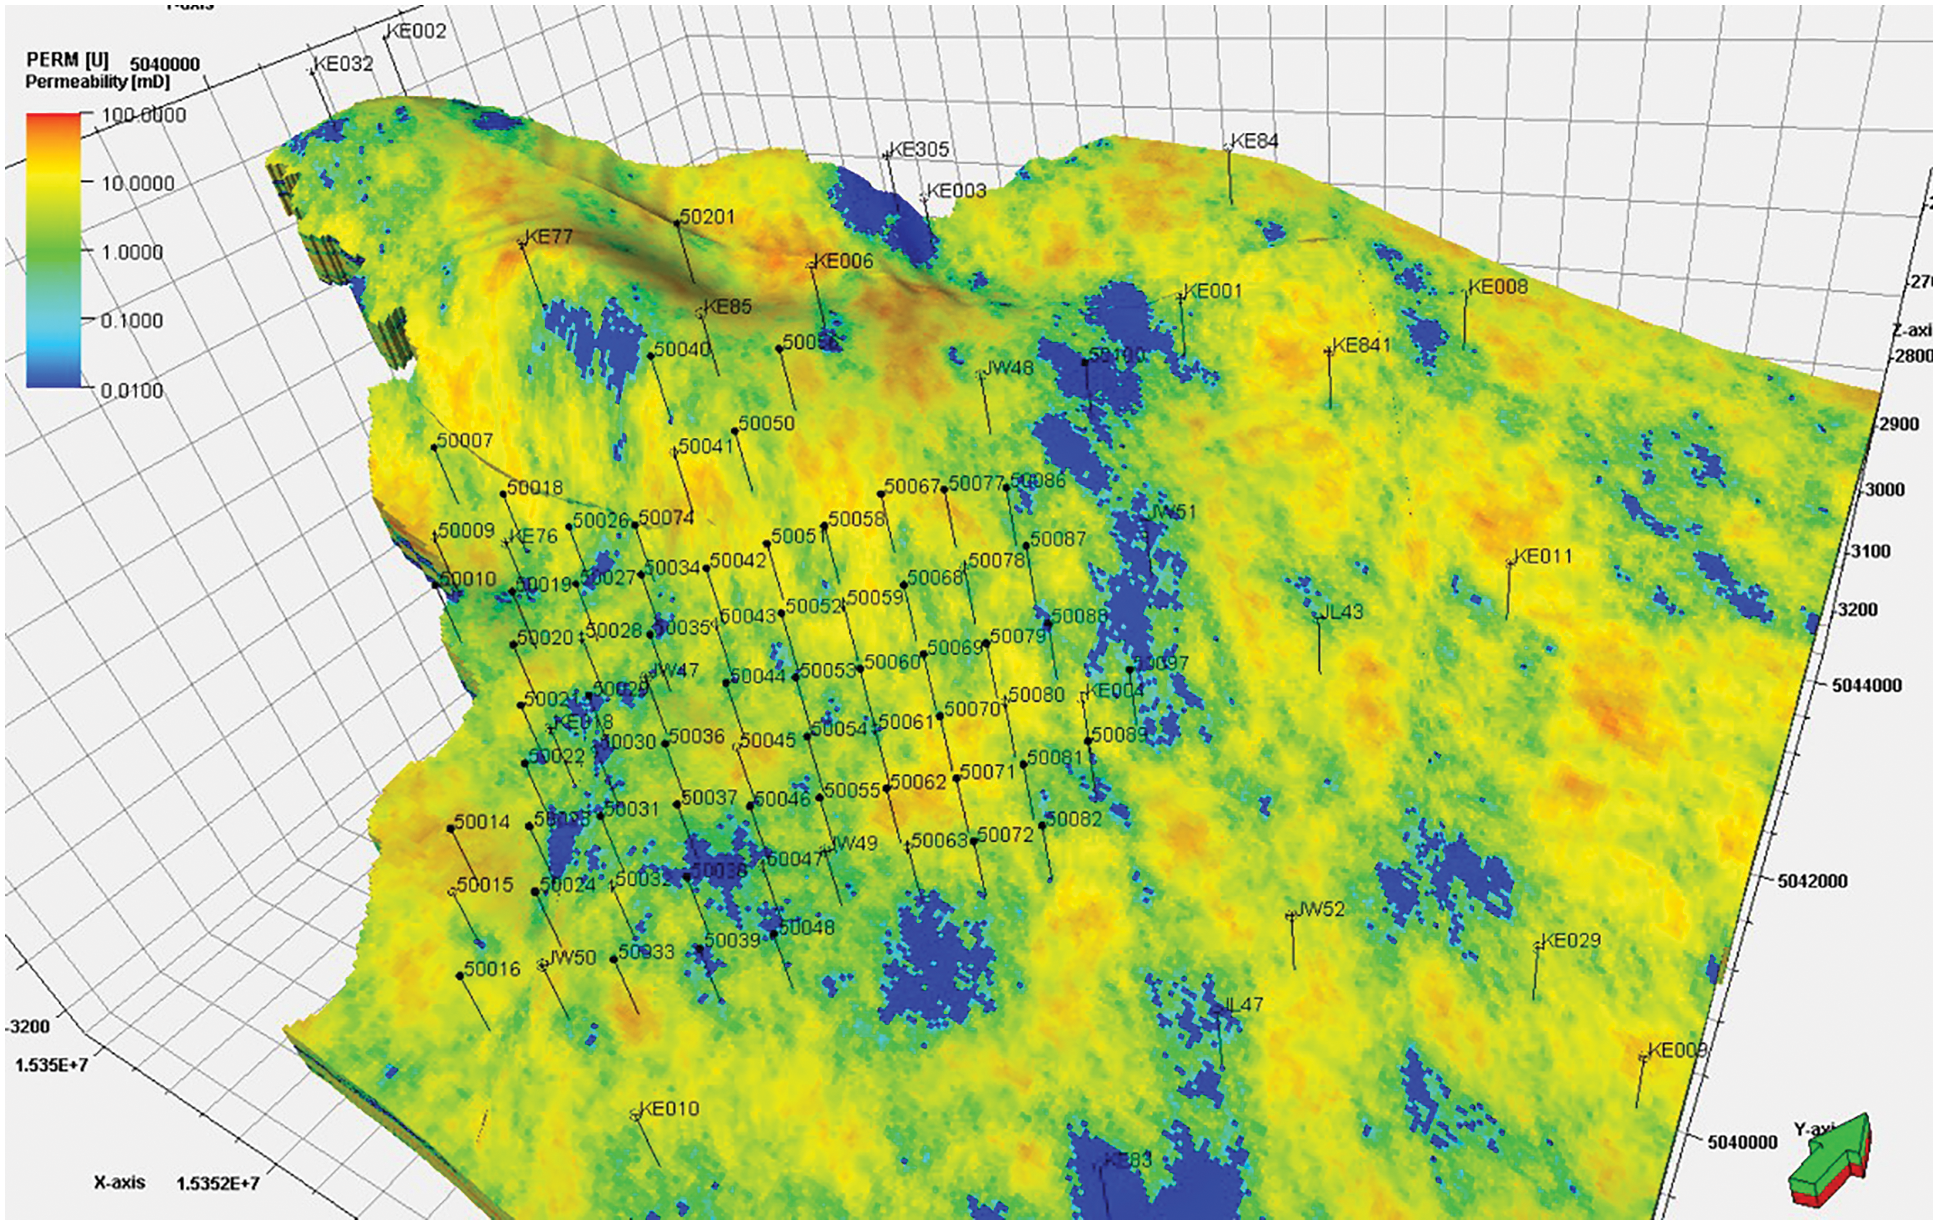
Figure 4: Three-dimensional permeability model of WU reservoir
3.2 Research on Three-Dimensional Reservoir Numerical Simulation
WU reservoir contains four oil-bearing substratum (w11, w12–1, w12–2, w13). In the reservoir numerical simulation model, longitudinal small layers are the main simulation layers, and each layer is further subdivided. Wells are located in the center of the grid, and more than two grids should be kept between each well as far as possible. Edges and local well locations are sparse, and faults are regarded as closed boundary faults. The grid plane area is determined by the superimposed area of oil-bearing areas in each layer, and the grid step is 40 m × 40 m. The number of grids in each small layer was 30807 (189 × 163), and 61 layers were divided vertically. The total number of grids in the model was 1,879,227, and the total number of effective grids was 301,541 (Fig. 5).
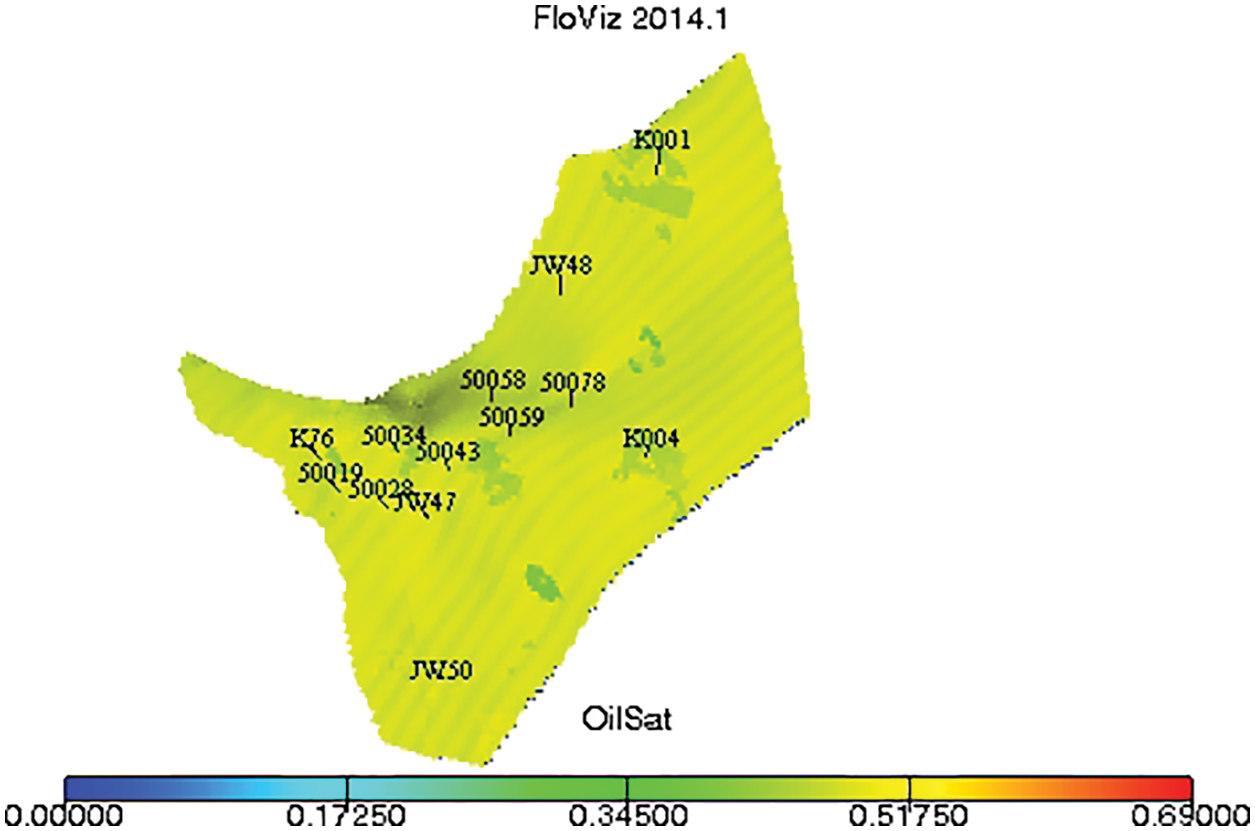
Figure 5: Numerical simulation model of WU reservoir
Due to the limitations of the understanding of reservoir geology, the reservoir physical property parameters used in the reservoir model may not accurately reflect the actual situation of the reservoir. Therefore, it is necessary to fit the production history of the reservoir. The fitting parameters include geological reserves, water appearance time, water cut and production per well. Firstly, the water content of the block and reservoir pressure were fitted (Figs. 6 and 7), and then the water content of a single well was fitted. The fitting rate of a single well reached over 85%, meeting the research accuracy requirements.
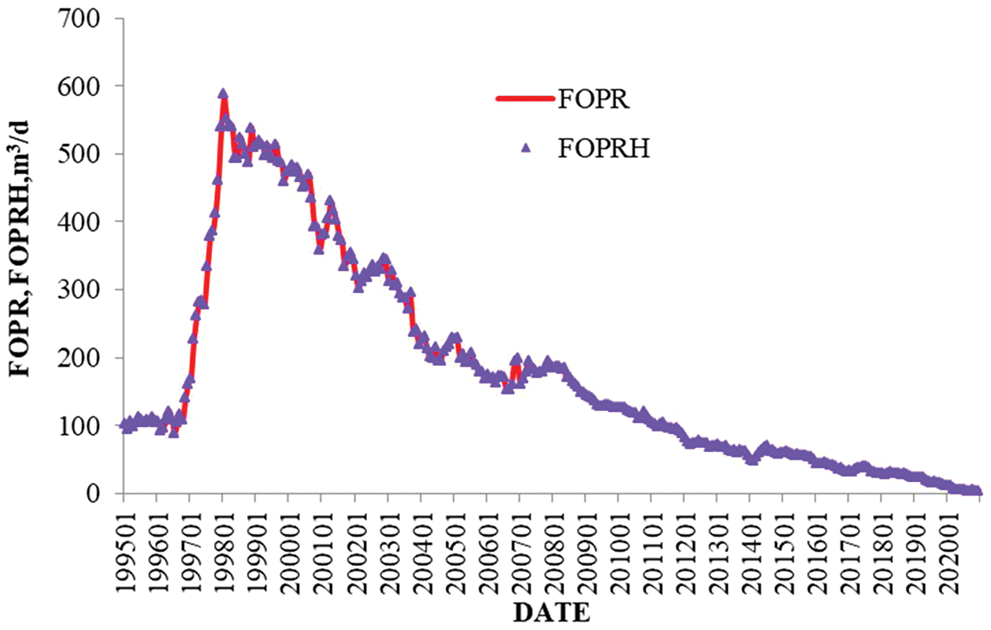
Figure 6: Daily oil production fitting curve of WU reservoir
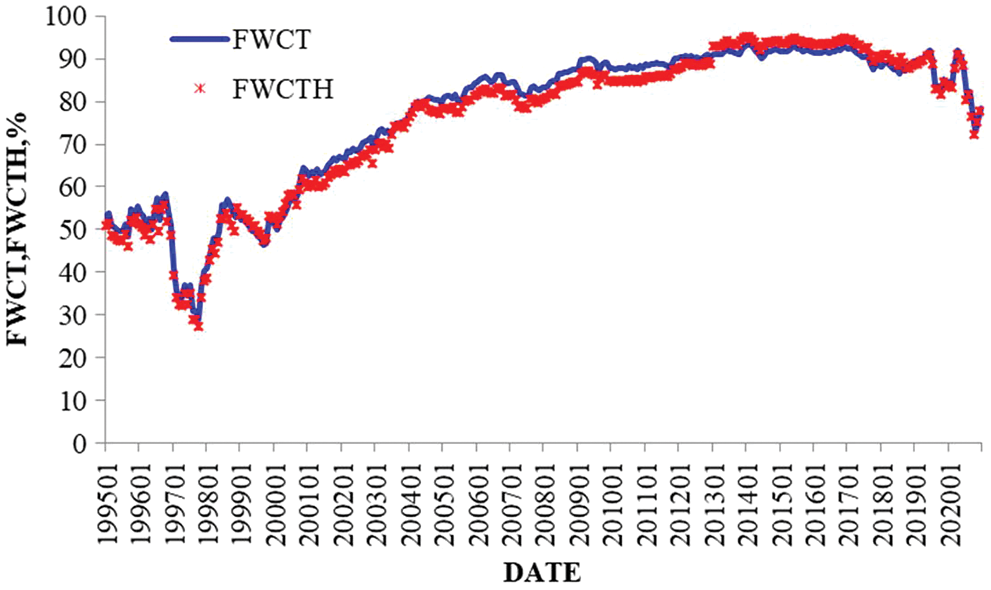
Figure 7: Water cut fitting curve of the WU reservoir
Through the fine reservoir numerical simulation research, the distribution map of residual oil saturation in each layer and the longitudinal residual oil continuous well section in sublayers can be obtained (Fig. 8). Since the recovery degree of the reservoir is only 6.0%, and it mainly rely on natural energy. On the whole, the oil saturation of planar and vertical individual sublayers is high.
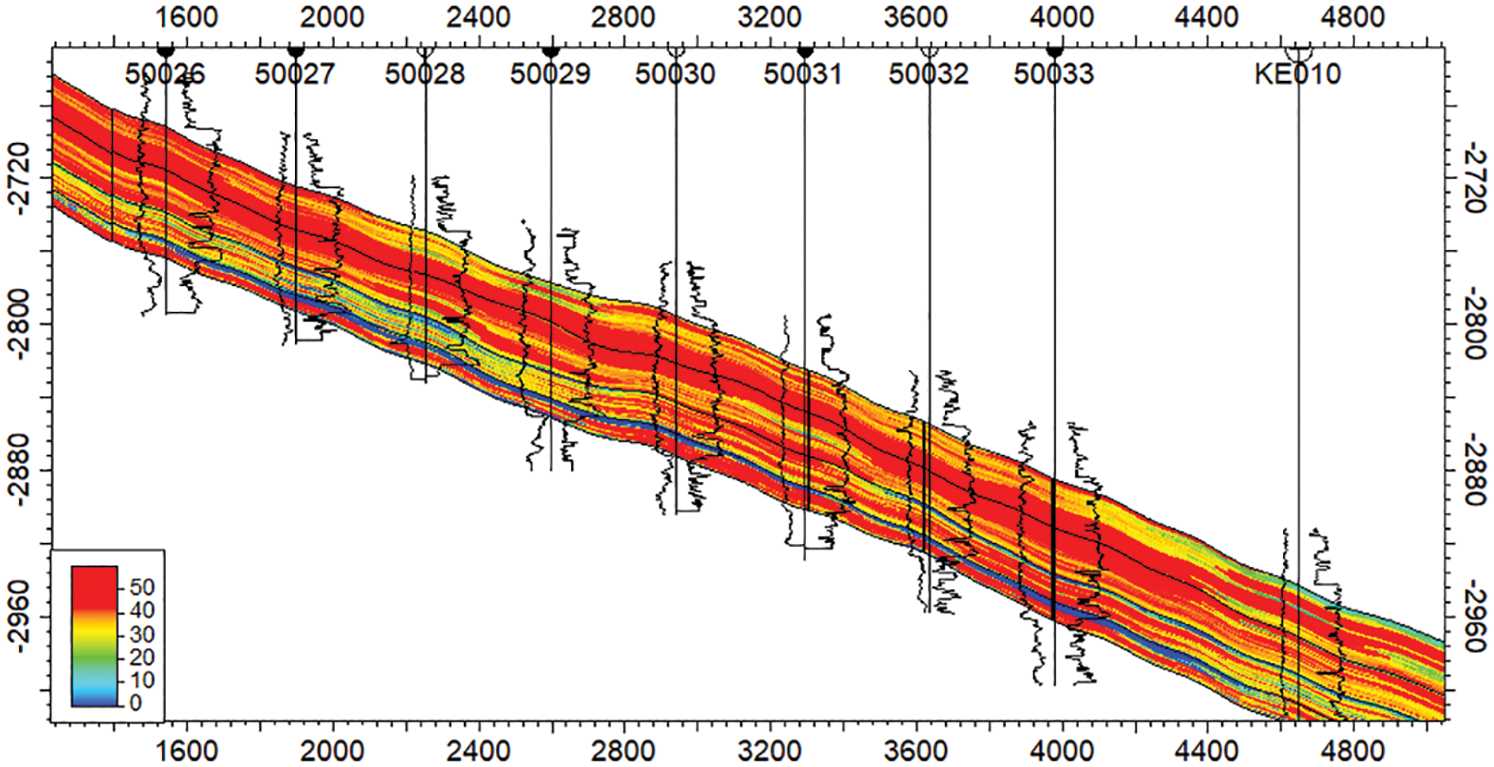
Figure 8: Oil-bearing saturation well section of the WU reservoir
At the same time, according to the current remaining oil saturation, the abundance distribution map of reservoir remaining oil reserves can be calculated (Fig. 9). It can be seen that the remaining oil in the 50,041, 50,050, 50,054, 50,055 and 50,034 areas, located in the middle of the main area, is distributed in a row, with high abundance of utilized and unutilized reserves, Vertically, the remaining oil reserves abundance of P3w11 and P3w12–1 are relatively high and contiguous, which are the main intervals to tap the potential in the next step.
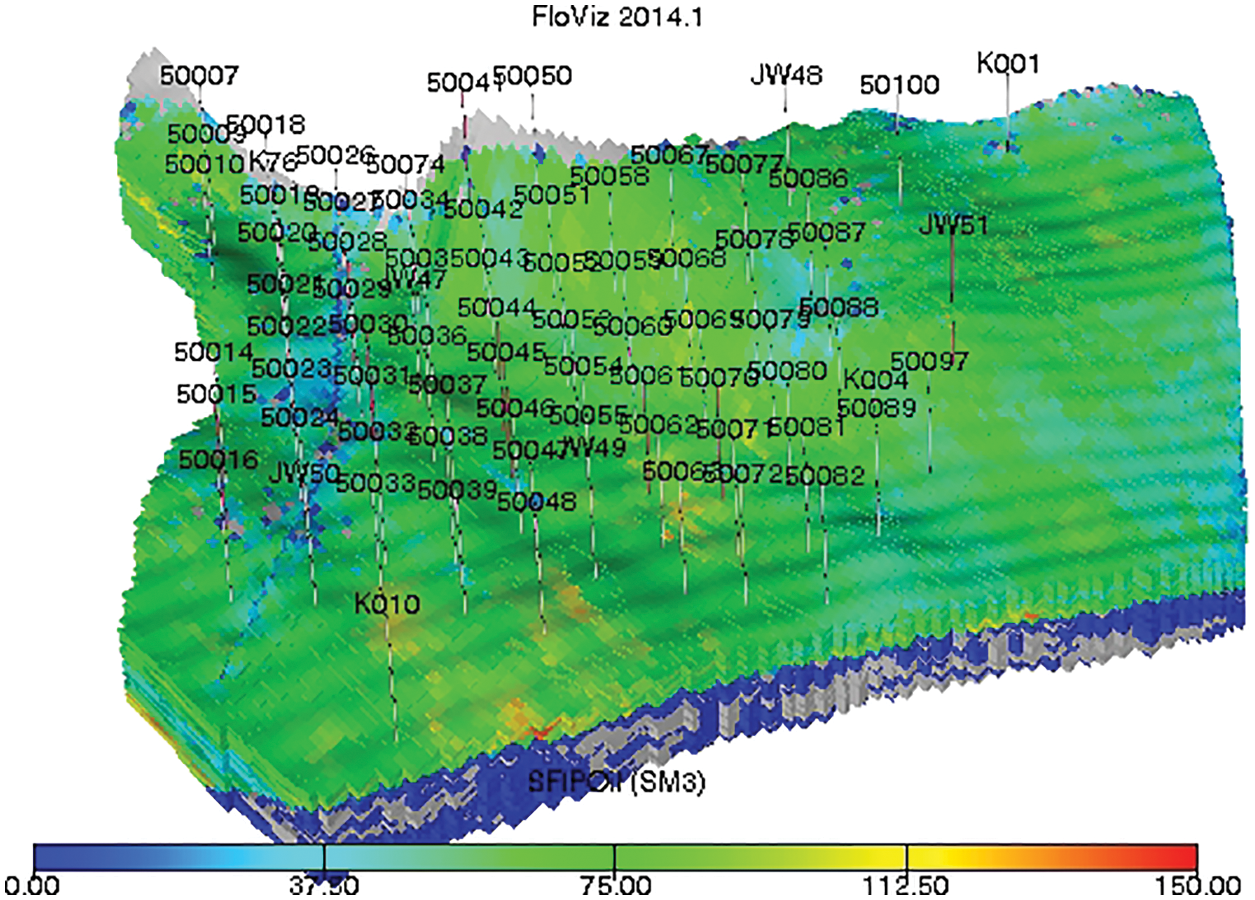
Figure 9: Reservoir abundance distribution of WU reservoir
4 Optimization Design of Horizontal Well Development Scheme
4.1 Selection of Recovery Method
4.1.1 Poor Development Effect of Reservoir Vertical Well
Affected by unfavorable factors such as poor reservoir physical properties, strong water sensitivity and strong heterogeneity, the water injection efficiency of vertical wells of the reservoir is only 14.75%. And the effect time is short, with an average of only 6.5 months. The wells accounting for 85.3% of the total number of wells have no effect in low production or breakthrough channeling, and the water flooding development effect is poor.
After stopping water injection, reservoir decline further increases, the average annual decline rate is more than 30%. Up to now, the cumulative oil production in the developed area is 38.69 × 10⁴ t, and the average single well cumulative oil production is 0.56 × 10⁴ t. The degree of recovery is only 6.7%, which is far lower than the predicted recovery rate of horizontal well volume fracturing development.
4.1.2 Better Effect in Horizontal Well Development for the Same Type of Reservoir
The initial productivity of horizontal wells in Bai oilfield which is adjacent to Wu oilfield is 3.4 times that of the surrounding vertical wells, and the cumulative oil production is 6.3 times that of the surrounding vertical wells. In another similar adjacent glutenite oilfield, the initial productivity of horizontal wells is 3.5 times that of the surrounding vertical wells, and the cumulative oil production is 5.3 times that of the surrounding vertical wells. At the same development stage, the production effect of horizontal wells in the two similar reservoirs is far better than that of vertical wells.
According to the initial productivity obtained by the above analogy, the cumulative oil production of the horizontal well volume fracturing development method can be calculated by reservoir engineering method according to the permeability and thickness parameters of Wu oilfield. Finally, the oil recovery is predicted to reach 14.0%, higher than other development methods.
4.2 Horizontal Well Design Demonstration
Reservoir development practice shows that the development effect of horizontal well is affected by many factors. So it is necessary to optimize the deployment parameters [18–20].
4.2.1 Wellbore Direction of Horizontal Section of Horizontal Well
The current maximum horizontal principal stress direction of the reservoir in WU reservoir is close to the east-west direction. Horizontal well trajectory direction should generally be perpendicular to the direction of maximum horizontal principal stress.
The formation in WU reservoir is a southeast inclination monoclinic structure. Comprehensively considering the maximum horizontal principal stress, structural characteristics, the degree of oil formation mobilization, the influence of old well pattern and the need to drive oil with gas after the completion of the gas-driven in K75 block. It is determined that horizontal wells should be drilled mainly in the north-east to south-west direction, and the angle between the horizontal wells and the maximum principal stress is about 60°, which is close to the parallel structure drilling, and it is convenient to form the complex fracture network and carry out natural gas flooding development in the future.
4.2.2 Length of Horizontal Section of Horizontal Well
The morphology form of the Upper Urho in WU reservoir is NE-SW towards, with a length of 4.5∼5.6 km. It is controlled by the morphology of deployment area, and considering the full utilization of reservoir, three rows of horizontal wells are designed, of which two rows of horizontal wells are designed in the developed zone, and the length of horizontal section is 1000∼1200 m. A row of horizontal wells is designed in the unutilized area, and the length of horizontal section is 1500∼1700 m.
4.2.3 Well Spacing of Horizontal Well
(1) Analogy method of similar reservoir
In analogy with the demonstration results of adjacent areas, the development test of 150 m small well spacing needs to meet the single well control reserves not less than 10 × 104 t, the lower limit of reserves abundance is 40 × 104 t/km2, and the lower limit of reservoir thickness is 10 m.
The remaining reserves abundance in the unutilized area of the reservoir in the south-of-area is 39.0 × 10⁴ t/km2, and the main oil layer thickness is 11.7 m. It has the material foundation for carrying out the small well spacing test, and the well spacing is determined to be 150 m.
(2) Effective utilization radius method
The monitoring data of hydraulic fracture of the formation in WU reservoir were statistically analyzed, and the artificial fractures in five wells were monitored. The average fracture half-length was 81.6 m. The repressurization test data of three development wells in the reservoir were statistically analyzed. The influence radius of shut-in is 53.5∼70.6 m, with an average of 61.5 m. Comprehensively considering the pressure fracture half-length and reservoir drainage radius, the horizontal well spacing of the reservoir is designed to be 260∼280 m.
The well spacing determined by effective radius method is the maximum well spacing of horizontal wells. Due to the start-up pressure gradient in low permeability reservoir, when the well spacing exceeds 2 times of “half-length of hydraulic fracture and matrix seepage radius”, some reserves between wells are not effectively developed.
(3) Economic limit cumulative production method
According to the above analysis, as shown in Fig. 10, the horizontal section length of the horizontal well in the reservoir is between 1000∼1700 m. Under the stepped oil price, the economic limit cumulative oil production of a single well is 1.90∼3.05 × 10⁴ t.
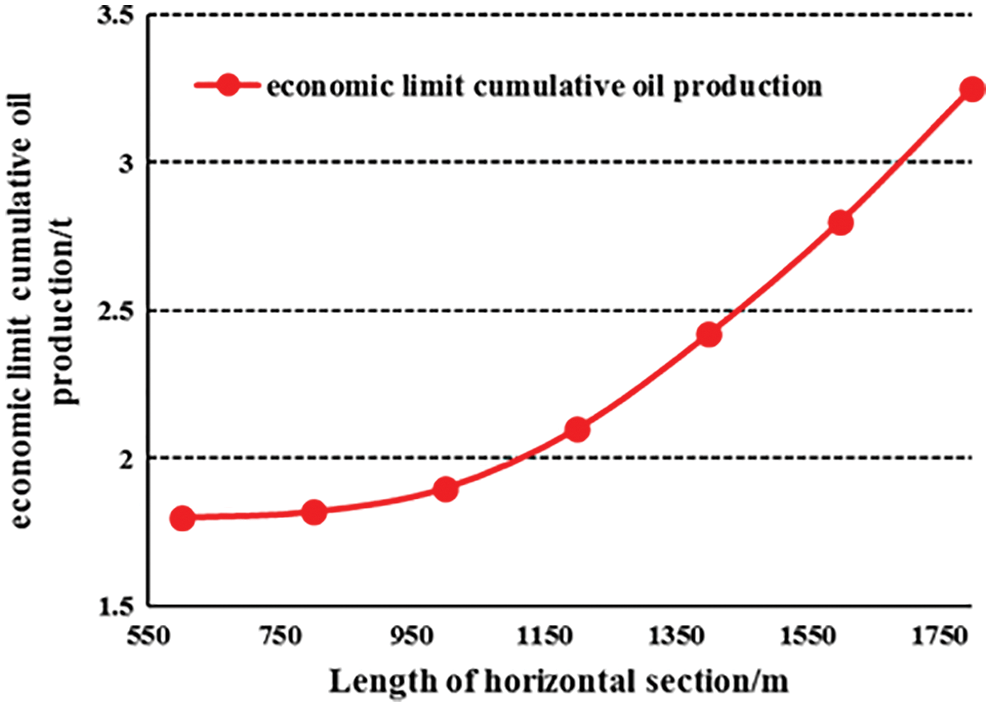
Figure 10: Economic limit of oil production in horizontal wells with different horizontal section lengths
With the deepening understanding of development, it is considered that sandy conglomerate reservoir is suitable for small spacing development of horizontal wells and can improve oil recovery.
As shown in Fig. 11, it is predicted that when 150 m well spacing is adopted in the undeveloped area of the reservoir in Wu oilfield, the recovery can reach 22.0%. When the horizontal section length of horizontal well is 1700 m, the recoverable reserves are controlled to be 3.22 × 10⁴ t, which is greater than the cumulative oil production of single well economic limit.
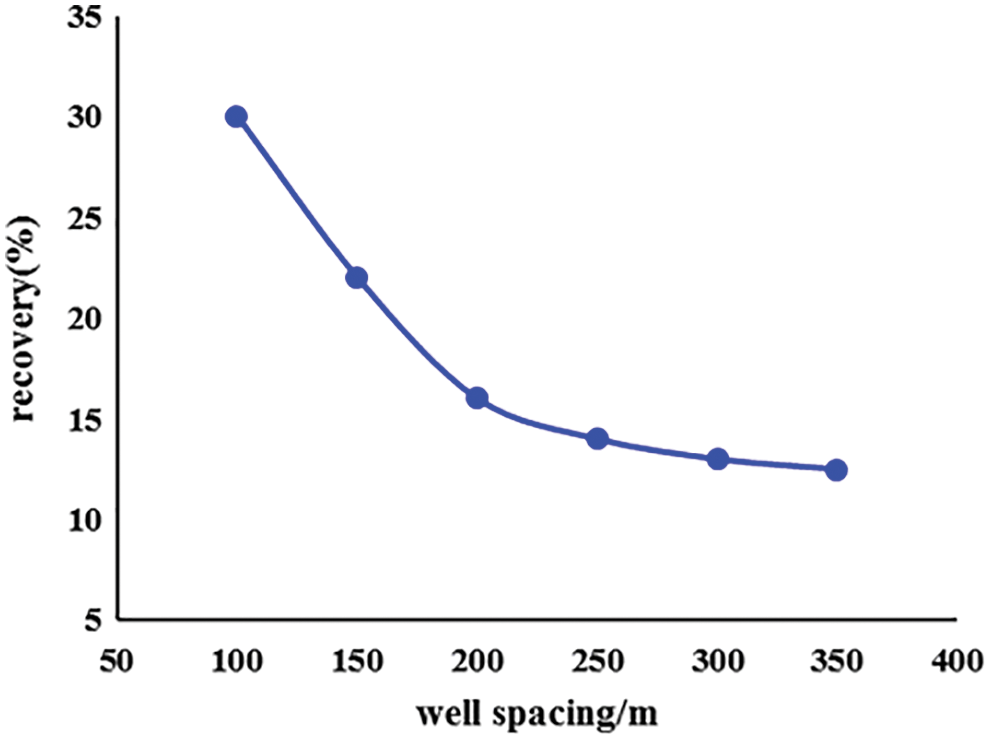
Figure 11: Recovery under different well spacing
According to the research results of analogy method, effective utilization radius method and economic limit cumulative production method, it is suggested that the horizontal well spacing in the undeveloped area of the upper member of the reservoir is 150 m.
4.2.4 Horizontal Well Productivity Design
(1) Analogy method of similar reservoir
By analyzing the one-year production of horizontal wells in adjacent reservoir, it found that there is a positive correlation between the horizontal section length and production. During this year. As shown in Fig. 12, the relationship is as follows:
where: Q represents one-year production (t/d), x is the horizontal section length (m).
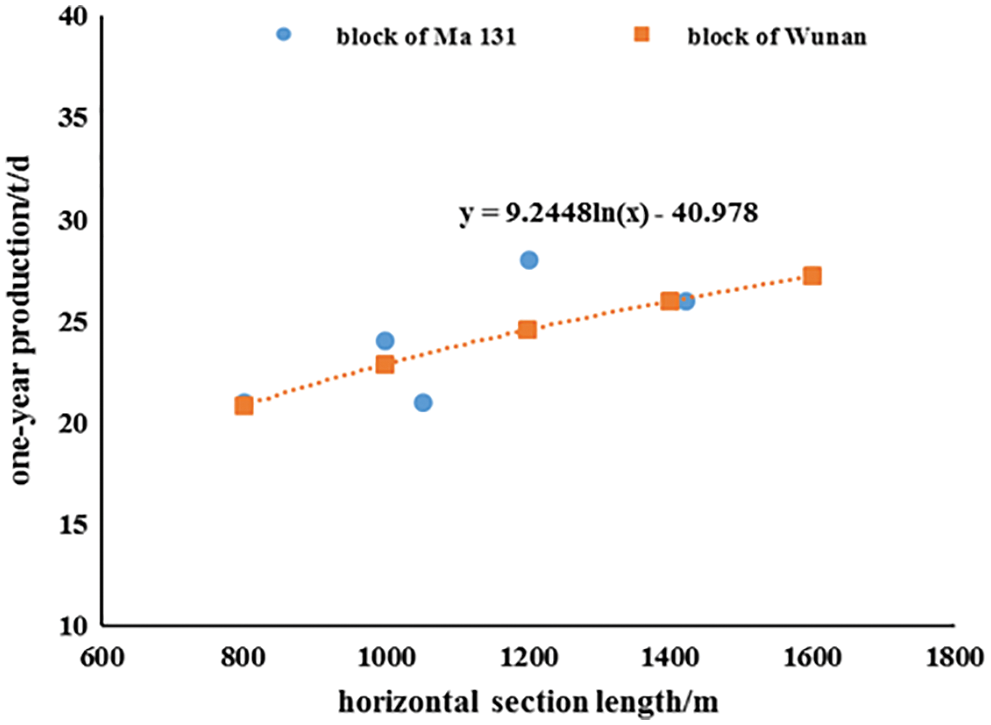
Figure 12: Variation of one-year production with length of horizontal section
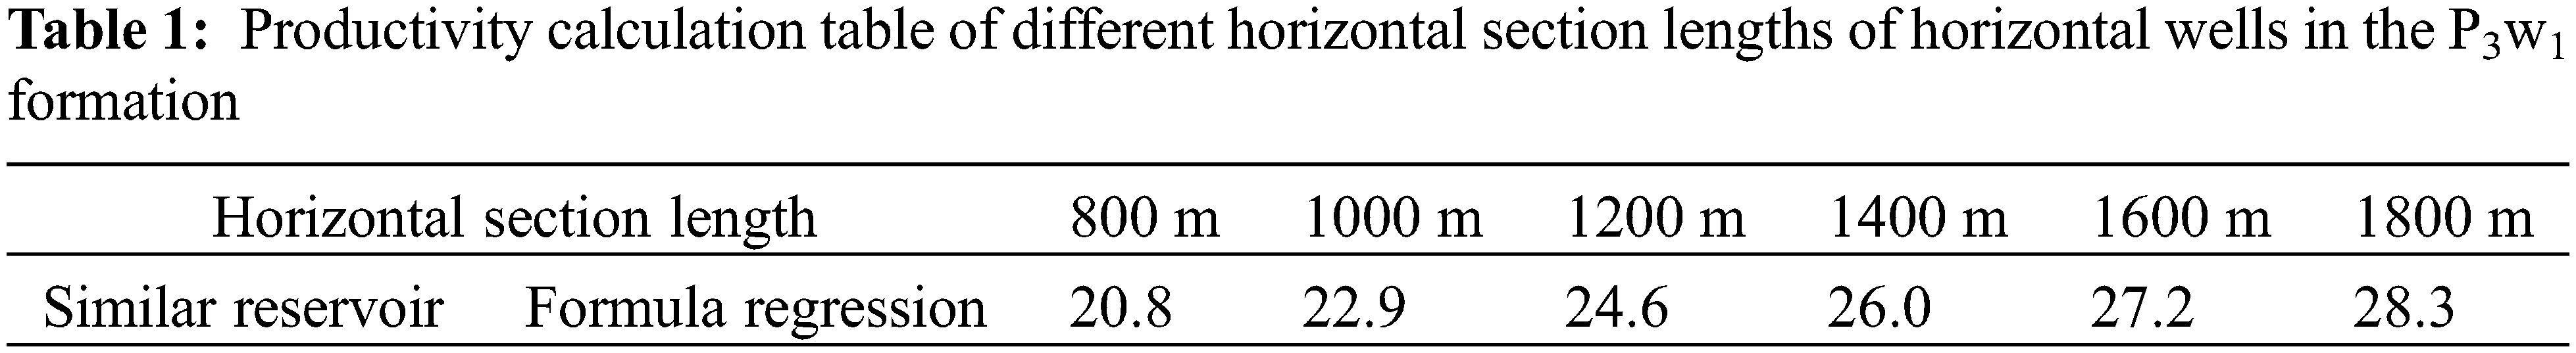
By analogy with the relationship between one-year production of horizontal well and horizontal section length in adjacent similar reservoirs, the productivity under different horizontal section length in the reservoir in WU reservoir is designed (Table 1).
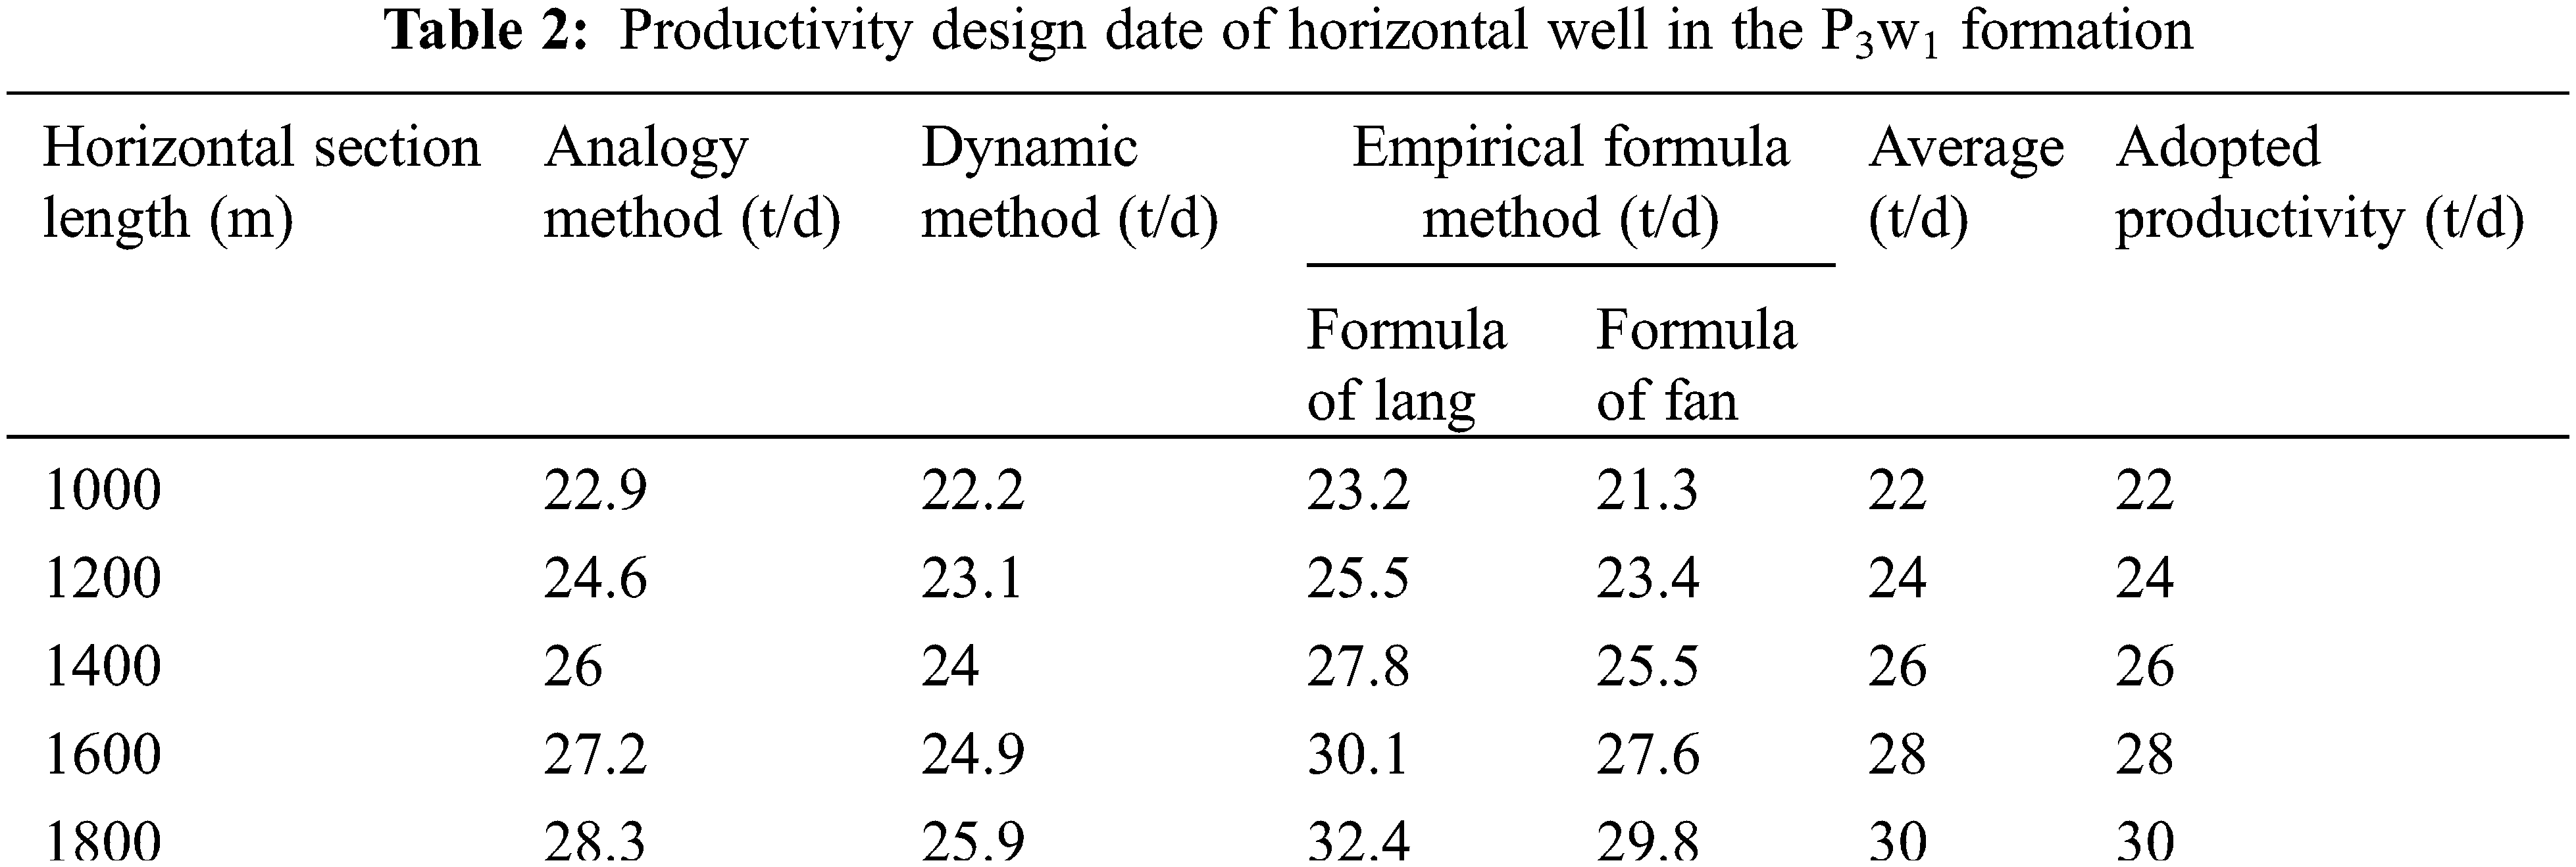
(2) Dynamic calculation method
Since 2018, the average cumulative production of a single well in the reservoir has been 302 days, and the converted average daily oil production is 7.4 t. According to the productivity relationship between horizontal wells and vertical wells in the similar reservoirs, the productivity of volume fracturing horizontal wells in this reservoir can be designed according to 3∼3.5 times of the productivity of vertical wells. Through analogy calculation, the horizontal well productivity is 22.2∼25.9 t.
(3) Empirical formula method
According to different productivity calculation formulas of horizontal wells, when the length of horizontal section is 1000∼1800 m, the single well productivity of horizontal well is 21.25∼32.41 t/d.
Through the comprehensive analysis of analogy method, dynamic method and empirical formula method, it is determined that the horizontal section length of P3w1 in Wu oilfield is 1000∼1400 m and the productivity is 22.0∼30.0 t/d. During the actual deployment, the horizontal section of the horizontal well in the developed area is 1200 m, and the production capacity of the horizontal well is 24 t/d When the length of horizontal section of horizontal well in undeveloped area is 1600 m, the productivity is 28 t/d (Table 2).
4.3 Horizontal Well Deployment Optimization Design
The principles for optimal design of horizontal well deployment are as follows:
(1) The oil layer selected in the deployment area has a clear understanding, and a single oil layer is continuous and the effective thickness is greater than 10 m.
(2) It is mainly developed by multi well platform construction and horizontal well volume fracturing. The horizontal well spacing is about 150 m.
(3) During the specific implementation of horizontal well, the trajectory of horizontal well needs to be flexibly adjusted according to the development of oil layer. The horizontal section can cross P3w11 and P3w12–1 sections.
(4) When horizontal wells are deployed in the developed area, attention should be paid to avoiding the perforated well sections of the surrounding vertical wells.
Based on these deployment principles, 31 horizontal wells were deployed in the Wu reservoir and the formation was transformed using volumetric fracturing techniques.
5 Horizontal Well Trajectory Optimization Design
According to the oil layer distribution of existing wells in this area, the geological model of P3w1 formation was established. The profile was cut along the horizontal section direction, and the data of trajectory control point coordinates, altitude, top and bottom of the oil layer and well inclination angle were read.
The horizontal well trajectory was designed in the three-dimensional geological model. According to the development of the target oil layer of the vertical well around the horizontal well, the horizontal well trajectory profile was established, and the trajectory control point parameters of the horizontal well into the target point and the final target point are read.
By loading the optimized trajectory of 31 horizontal wells into the reservoir numerical simulation model after historical fitting, the oil saturation distribution of the grid crossed by each horizontal well can be obtained, as shown in Fig. 13. Overall, the average oil saturation of the grid traversed by horizontal well trajectory is high in the numerical simulation model. Then, the production system with constant bottom hole flow pressure is used to predict for fifteen years, and the initial production, initial water cut and cumulative oil production indexes of each horizontal well are obtained. The initial production of thirty-one newly designed horizontal wells is 20.4∼52.5 t/d, with an average of 35.3 t/d, and the cumulative production of single well is 2.52 × 10⁴ t∼11.11 × 10⁴ t, with an average of 6.0 × 10⁴ t, reaching the average design productivity. The reservoir simulation prediction shows that the development effect of horizontal wells is good.
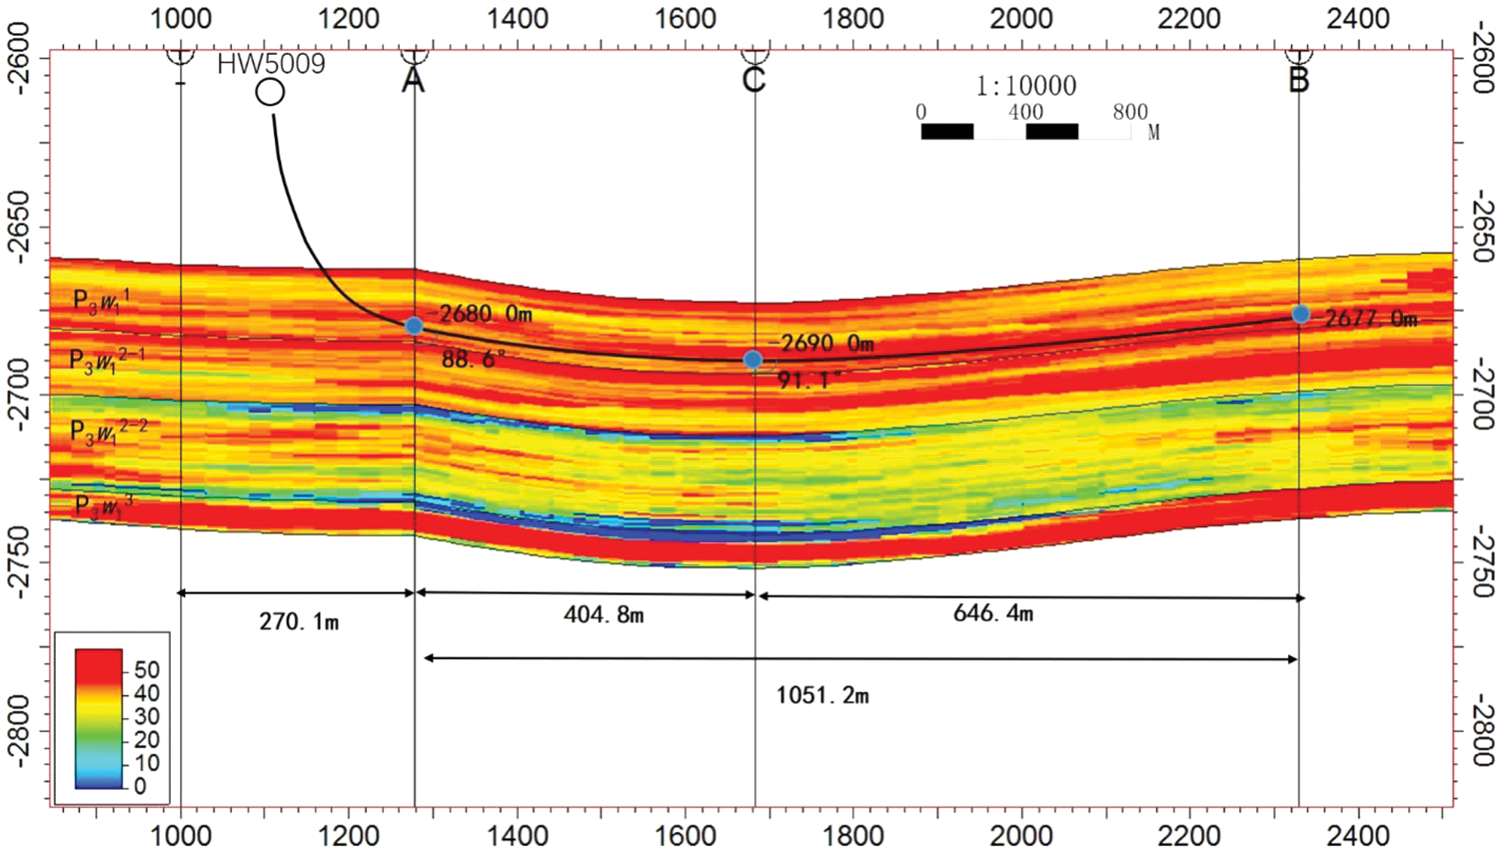
Figure 13: Horizontal well (HW5009) trajectory profile in WU reservoir
HW5001, a horizontal well designed in the scheme, has been put into production, and the actual drilling length of the well was 1024.0 m. According to the logging interpretation of single well, the thickness of good oil layer is 386.45 m, and the thickness of poor oil layer is 547.88 m. The total oil layer thickness is 934.33 m, and the oil layer penetration rate is 87%. The well was fractured by 12 stages and 46 clusters, with 14,049.9 m3 of fracturing fluid and 1305 m3 of sand, and the average cluster spacing was 22.8 m. The production capacity of the well reached 20 t/d at the initial stage of production, and the production effect was good. Compared with the vertical well, the production capacity was greatly improved, indicating that the trajectory optimization results had good reliability.
1) According to the research results of fine reservoir description, the distribution models of fault, structure, sedimentary microfacies and reservoir attributes are obtained, and a fine three-dimensional geological model of the reservoir is established.
2) On the basis of 3D fine geological model, a reservoir numerical simulation model is established. The coincidence rate of geological reserves is 97.5%. Then, based on the knowledge of reservoir dynamic analysis, the historical fitting analysis is carried out, and the fitting rate of block and single well reaches 89%, thus ensuring the reliability of the understanding of reservoir remaining oil distribution. Based on the reservoir model, the distribution of remaining oil saturation and remaining oil abundance is obtained.
3) The direction, length, well spacing and productivity of horizontal Wells are demonstrated by reservoir engineering methods, and the deployment parameters of horizontal Wells in the reservoir are obtained.
4) Based on the understanding of remaining oil saturation and remaining oil abundance distribution, combined with reservoir distribution and oil saturation analysis, the trajectory of 31 horizontal Wells was optimized. The horizontal development effect of a well put into production shows that the horizontal well with optimized well trajectory has achieved good production effect.
Funding Statement: The authors received no specific funding for this study.
Conflicts of Interest: The authors declare that they have no conflicts of interest to report regarding the present study.
References
1. Wu, M., Cao, J., Wang, X. L., Tang, Y., Wang, B. et al. (2014). Hydrocarbon generation potential of triassic mudstones in the Junggar Basin, Northwest China. AAPG Bulletin, 98(9), 1885–1906. DOI 10.1306/03111413022. [Google Scholar] [CrossRef]
2. Chen, Z. H., Cao, Y. C., Wang, X. L., Qiu, L. W., Tang, Y. et al. (2016). Oil origin and accumulation in the Paleozoic Chepaizi–Xinguang field, Junggar Basin, China. Journal of Asian Earth Science, 115, 1–15. DOI 10.1016/j.jseaes.2015.09.019. [Google Scholar] [CrossRef]
3. Du, J. H., Zhi, D. M., Li, J. Z., Yang, D. S., Tang, Y. et al. (2019). Major breakthrough of Well Gaotan 1 and exploration prospects of lower assemblage in southern margin of Junggar Basin, NW China. Petroleum Exploration and Development, 46(2), 216–227. DOI 10.1016/S1876-3804(19)60003-0. [Google Scholar] [CrossRef]
4. Lu, X. C., Shi, J. A., Zhang, S. C., Zou, N. N., Sun, G. Q. et al. (2015). The origin and formation model of permian dolostones on the northwestern margin of Junggar Basin, China. Journal of Asian Earth Science, 105, 456–467. DOI 10.1016/j.jseaes.2015.02.024. [Google Scholar] [CrossRef]
5. Guo, J. J., Huang, Y., Wang, Y. J., Pan, J. G., Huang, L. J. (2022). Quality evaluation of glutenite reservoirs of intergranular-secondary dissolution pore type using a quantitative method. Energy Geoscience, 3(2), 126–133. DOI 10.1016/j.engeos.2022.01.003. [Google Scholar] [CrossRef]
6. Liu, W. C., Zhang, Q. T., Zhu, W. Y. (2019). Numerical simulation of multi-stage fractured horizontal well in low-permeable oil reservoir with threshold pressure gradient with moving boundary. Journal of Petroleum Science and Engineering, 178, 1112–1127. DOI 10.1016/j.petrol.2019.04.033. [Google Scholar] [CrossRef]
7. Yin, F. L., Gao, Y. H., Zhang, H., Sun, B. J., Chen, Y. et al. (2021). Comprehensive evaluation of gas production efficiency and reservoir stability of horizontal well with different depressurization methods in low permeability hydrate reservoir. Energy, 239, 122422. DOI 10.1016/j.energy.2021.122422. [Google Scholar] [CrossRef]
8. Awotunde, A. A. (2006). Characterization of reservoir parameters using horizontal well interference test. SPE Annual Technical Conference and Exhibition, San Antonio, Texas, USA. SPE-106517-STU. [Google Scholar]
9. Britt, L. K., Smith, M. B. (2009). Horizontal well completion, stimulation optimization, and risk mitigation. SPE Eastern Regional Meeting, Charleston, West Virginia, USA. SPE-125526-MS. [Google Scholar]
10. Fan, D. Y., Yao, J., Sun, H., Zeng, H., Wang, W. (2015). A composite model of hydraulic fractured horizontal well with stimulated reservoir volume in tight oil & gas reservoir. Journal of Natural Gas Science and Engineering, 24, 115–123. DOI 10.1016/j.jngse.2015.03.002. [Google Scholar] [CrossRef]
11. Asad, A., Awotunde, A. A., Jamal, M. S., Liao, Q. Z., Abdulraheem, A. (2021). Simulation of wellbore erosion and sand transport in long horizontal wells producing gas at high velocities. Journal of Natural Gas Science and Engineering, 89, 103890. DOI 10.1016/j.jngse.2021.103890. [Google Scholar] [CrossRef]
12. Ning, B., Xiang, Z. P., Liu, X., Li, Z. J., Chan, Z. H. et al. (2020). Production prediction method of horizontal wells in tight gas reservoirs considering threshold pressure gradient and stress sensitivity. Journal of Petroleum Science and Engineering, 187, 106750. DOI 10.1016/j.petrol.2019.106750. [Google Scholar] [CrossRef]
13. Li, X. P., Cao, L. N., Luo, C., Zhang, B., Zhang, J. Q. et al. (2017). Characteristics of transient production rate performance of horizontal well in fractured tight gas reservoirs with stress-sensitivity effect. Journal of Petroleum Science and Engineering, 158, 92–106. DOI 10.1016/j.petrol.2017.08.041. [Google Scholar] [CrossRef]
14. Tian, F., Wang, X. D., Xu, W. L. (2019). A semi-analytical model for multiple-fractured horizontal wells in heterogeneous gas reservoirs. Journal of Petroleum Science and Engineering, 183, 106369. DOI 10.1016/j.petrol.2019.106369. [Google Scholar] [CrossRef]
15. Zhang, F. Z., Yao, Y. D., Huang, S., Wu, H., Ji, J. H. (2016). Analytical method for performance evaluation of fractured horizontal wells in tight reservoirs. Journal of Natural Gas Science and Engineering, 33, 419–426. DOI 10.1016/j.jngse.2016.05.013. [Google Scholar] [CrossRef]
16. Ai, S., Cheng, L. S., Huang, S. J., Fu, L. B., Wang, T. et al. (2014). Transient production prediction model for multiple factured horizontal wells in shale gas reservoirs. Natural Gas Geoscience, 25(10), 1661–1667. DOI 10.11764/j.issn.1672-1926.2014.10.1661. [Google Scholar] [CrossRef]
17. Michael, A. (2021). Hydraulic fractures from non-uniform perforation cluster spacing in horizontal wells: Laboratory testing on transparent gelatin. Journal of Natural Gas Science and Engineering, 95, 104158. DOI 10.1016/j.jngse.2021.104158. [Google Scholar] [CrossRef]
18. Awotunde, A. A. (2014). On the joint optimization of well placement and control. SPE Saudi Arabia Section Technical Symposium and Exhibition, Al-Khobar, Saudi Arabia. SPE-172206-MS. [Google Scholar]
19. Safari, R., Lewis, R., Ma, X., Mutlu, U., Ghassemi, A. (2017). Infill-well fracturing optimization in tightly spaced horizontal wells. Journal of Petroleum Science and Engineering, 22(2), 582–595. DOI 10.2118/178513-PA. [Google Scholar] [CrossRef]
20. Nwachukwu, A., Jeong, H., Pyrcz, M., Lake, L. W. (2018). Fast evaluation of well placements in heterogeneous reservoir models using machine learning. Journal of Petroleum Science and Engineering, 163, 463–475. DOI 10.1016/j.petrol.2018.01.019. [Google Scholar] [CrossRef]
 | This work is licensed under a Creative Commons Attribution 4.0 International License, which permits unrestricted use, distribution, and reproduction in any medium, provided the original work is properly cited. |