| Fluid Dynamics & Materials Processing |
DOI: 10.32604/fdmp.2023.021976
ARTICLE
Numerical Study on the Resin Transfer Molding Curing Process for Thick Composites Materials
1Laboratory of Materials and Energy, Faculty of Sciences, Ibn Tofail University, Kenitra, Morocco
2ENSEM, University Hassan II, Casablanca, Morocco
3LERMAB/IUT Longwy, Institut Carnot, Nancy, France
4Advanced Systems Engineering Laboratory, National School of Applied Sciences, Ibn Tofail University, Kenitra, Morocco
*Corresponding Author: Aouatif Saad. Email: saad.aouatif@uit.ac.ma
Received: 15 February 2022; Accepted: 30 March 2022
Abstract: The successful manufacture of thick composites is challenging since the highly exothermic nature of thermoset resins and limited temperature control make avoiding the onset of detrimental thermal gradients within the composite relatively difficult. This phenomenon is mainly caused by exothermic heat reactions. The so-called Michaud's model has been largely used in the literature to reduce the gap between experience and simulation with regard to the effective prediction of the temperature cycle in these processes. In this work, another solution is proposed to simulate the curing process for thick composites, namely preheating the resin to activate the curing reaction before resin injection into the mold. A good agreement between the experiment and the simulation is found. Moreover, in order to minimize the thermal gradient in the final composite, the thermophysical properties of the fiber and the torque (temperature, time) of the Plate have been varied leading to interesting results.
Keywords: Resin transfer molding; thick composite; curing; thermal gradient
Nomenclature
| ΔE | Activation Energy of a Reaction J/kg, |
| K | Thermal Conductivity W/mK, |
| T | Absolute Temperature K, |
| C | Heat Capacity J/K. |
A composite material is by definition a heterogeneous mixture of materials of different natures, fibers and matrix (resin) [1,2]. There are several types of composites, in particular thick composites; these later are used in industrial fields such as the manufacture of submarine hulls or bridge structures. As composite materials have many advantages in several areas, the manufacturing process for composite materials has become increasingly important. The Resin Transfer Molding (RTM) process makes it possible to obtain composite parts with precise dimensions and having a good surface condition over their entire surface. It is particularly suitable for small and medium series and one of the techniques used for the construction of thick parts. It consists of injecting a resin into a closed mold inside a fibrous reinforcement previously placed inside the mold before it is closed and locked [1,2]. As soon as the preforms are filled and the resin is released through the vent, the temperature cycle is imposed. Finally, after the curing stage, the final part can be ejected. The curing of thick composites [3–5] shows many defects caused by the low thermal conductivity of the composite which leads to an increase in processing time and exothermic heat [6–11]. Many researchers have worked on solving this anomaly [9,12]. Kamal et al. [9] proposed a model but unsuitable for low temperatures used for thick composites. Michaud carried out an experiment where he injected the vinylester resin into a mold which contains a fiberglass. He found that if the temperature range is between 80–100°C at the walls of the autoclave, there is a temperature increase of 200°C in the center of the composite, resulting in degeneration of the curing reaction. On the other hand with a temperature of 55°C, the temperature does not exceed 104°C. Michaud et al. [4] proposed a resin curing model so that the simulation to be consistent with experience, he performed 85% reduction in inhibitors and declared an apparent degree of curing.
The purpose of our study is in one hand to define other parameters allowing to adjust the difference between simulation and experiment, and in the other hand to look for methods to decrease the detrimental thermal gradient. For this, we have studied numerically the distribution of the temperature as a function of time in a mold as well as the generation of the heat described by the evolution of the degree of curing in the RTM process on the macroscopic scale.
To make the experimental results in agreement with the simulation, we proposed the preheating of the resin before the injection, this gives a good agreement, thanks to this relevant test, we have introduced a factor in Michaud’s model which describes the evolution concentration of inhibitors.
To minimize the thermal gradient, we opted for a set of measurements, namely different fibers (glass, Aramid and IM carbon) and different temperature cycle.
The production of a thick composite in an autoclave process is a mixture of fiber-resin cured uniformly in a mold; this process is controlled by two models:
Thermal model (energy equation) which describes the distribution of heat, with ρc, Cp are the density and the thermal capacity of composite:
Kinetic model of curing (Chemical reaction) is the product of the resin mass, the reaction heat ΔHR and the evolution of the degree of cuing [4].
The assumptions used in this model are as follows:
The heat is uniform in all directions of the mold; the direction of heat flow is one-dimensional according to the direction of temperature. The energy equation is as follows [4]:
The thermal diffusion and the curing reaction of the resin play an important role in the transmission of temperature field.
The degree of curing is represented by a model used by Michaud with αmax is the maximum degree of conversion and K the Arrhenius relation:
The initial conditions are: T = T0 = 25°C and α0 = 0 at t = 0 [4].
Temperature cycle
The polymerization cycle is treated at 60°C for a composite 2.54 cm thick. The simulation starts with a slope of 1.5385 °C/min to reach 60°C (Plate temperature). We have used the finite difference method for the discretization of the Eqs. (3) and (5), this gives:
In our simulation we have developed a numerical model using MATLAB. This model is based on the resolution of the energy equation which describes the coupling between the heat equation and the chemical reaction of the Dow Derakane 411-C50 resin in a thick composite. We will use the glass/vinlyester Dow Derakane 411-C50 resin, in two different cases:
1st case: the addition of inhibitors in the vinlyester resin makes it possible to stop the chemical reaction for 6 h, it is called induction time [4], it is calculated using the following Eq. (10):
Fig. 1 illustrates the development of temperature in the center of the composite during curing.

Figure 1: Comparison between Michaud’s simulation and the experience of temperature variation at the center level as a function of time
The temperature in the center of the mold increases from 25°C to 55°C thanks to the thermal conductivity of the composite, then it stabilizes at this temperature. For Michaud’s simulation, this stability lasts up to 549 min whereas in the experiment it is just 103 min, this difference is due to the effects of inhibitors which block the chemical reaction, after this stability the temperature increases to 416.4 K for the Michaud’s simulation, and 377 K for the experimental and then return to autoclave temperature, this increase is justified by the exothermic heat of the chemical reaction after consumption of the inhibitors.
A large temperature peak offset in the center between the experimental result and the simulation. Inhibitors present in the resin system have been found to significantly increase the processing time of the thick section. Although these inhibitors disappear quickly at normal processing temperatures, the kinetics of deactivation of the inhibitor can be very slow at lower temperatures necessarily to polymerize thick pieces. The only solution proposed by Michaud to confuse experimental and simulation is that the fibers of the composites absorb the inhibitors or the deactivation of 85% of the inhibitors, and a reduction of 30% in the maximum polymerization relationship (maximum degree of curing).
2nd case: We preheat the same resin to start the chemical reaction at a rate of α0 = 10−7, Fig. 2 shows the simulation of the degree of curing for 5 preheating temperature (25°C, 27°C, 31°C, 34°C and 37°C). The fact of preheating the resin triggers the chemical reaction before injection, Fig. 2 shows that the higher the temperature the shorter the evolution of degree of curing, and the preheating time to reach α0 = 10−7 is small.

Figure 2: Variation of degree of curing as a function of time with fixed temperature
Fig. 3 shows the preheating time required to reach α0 = 10−7 as a function of preheating temperature. For example, a temperature of 25°C we need 9.88 mn and 5,417 min with a temperature of 37°C.

Figure 3: The preheating time required to reach α0 = 10−7 as a function of preheating temperature
The boundary conditions used in what follows are T = T0 = 25°C and α0 = 10−7 at t = 0. Fig. 4 illustrates the development of the temperature at the center of the composite during curing. The injection of a preheated resin with a degree of curing α0 = 10−7 allows satisfactory results to be obtained between simulating temperature at the center of a thick composite and the experimental.

Figure 4: Comparison between the simulation and the experience of the temperature variation at the center level as a function of time
Preheating involves a variation in the concentration of inhibitors in the resin, the proposed model takes this variation into consideration. This model is an improvement of Michaud’s model.
A modification has been proposed in the variation of the degree of cure with respect to time by multiplying it by the term
With the same initial conditions as the first case, we have satisfactory results to be obtained between simulating temperature at the center of a thick composite and the experimental Fig. 5.

Figure 5: Comparison between the simulation new model and the experience of the temperature variation at the center level as a function of time
4 Minimization of the Thermal Gradients of a Thick Composite
To optimize the thermal gradient, we have simulated with the same initial conditions as the 1st case.
First, we have kept the Vinylester and we have changed the fiber type: Glass, Aramide and Carbone IM. Each element has its particularities which will allow us the optimization of the thermal gradient. The characteristics of the used fibers are given in Table 1.
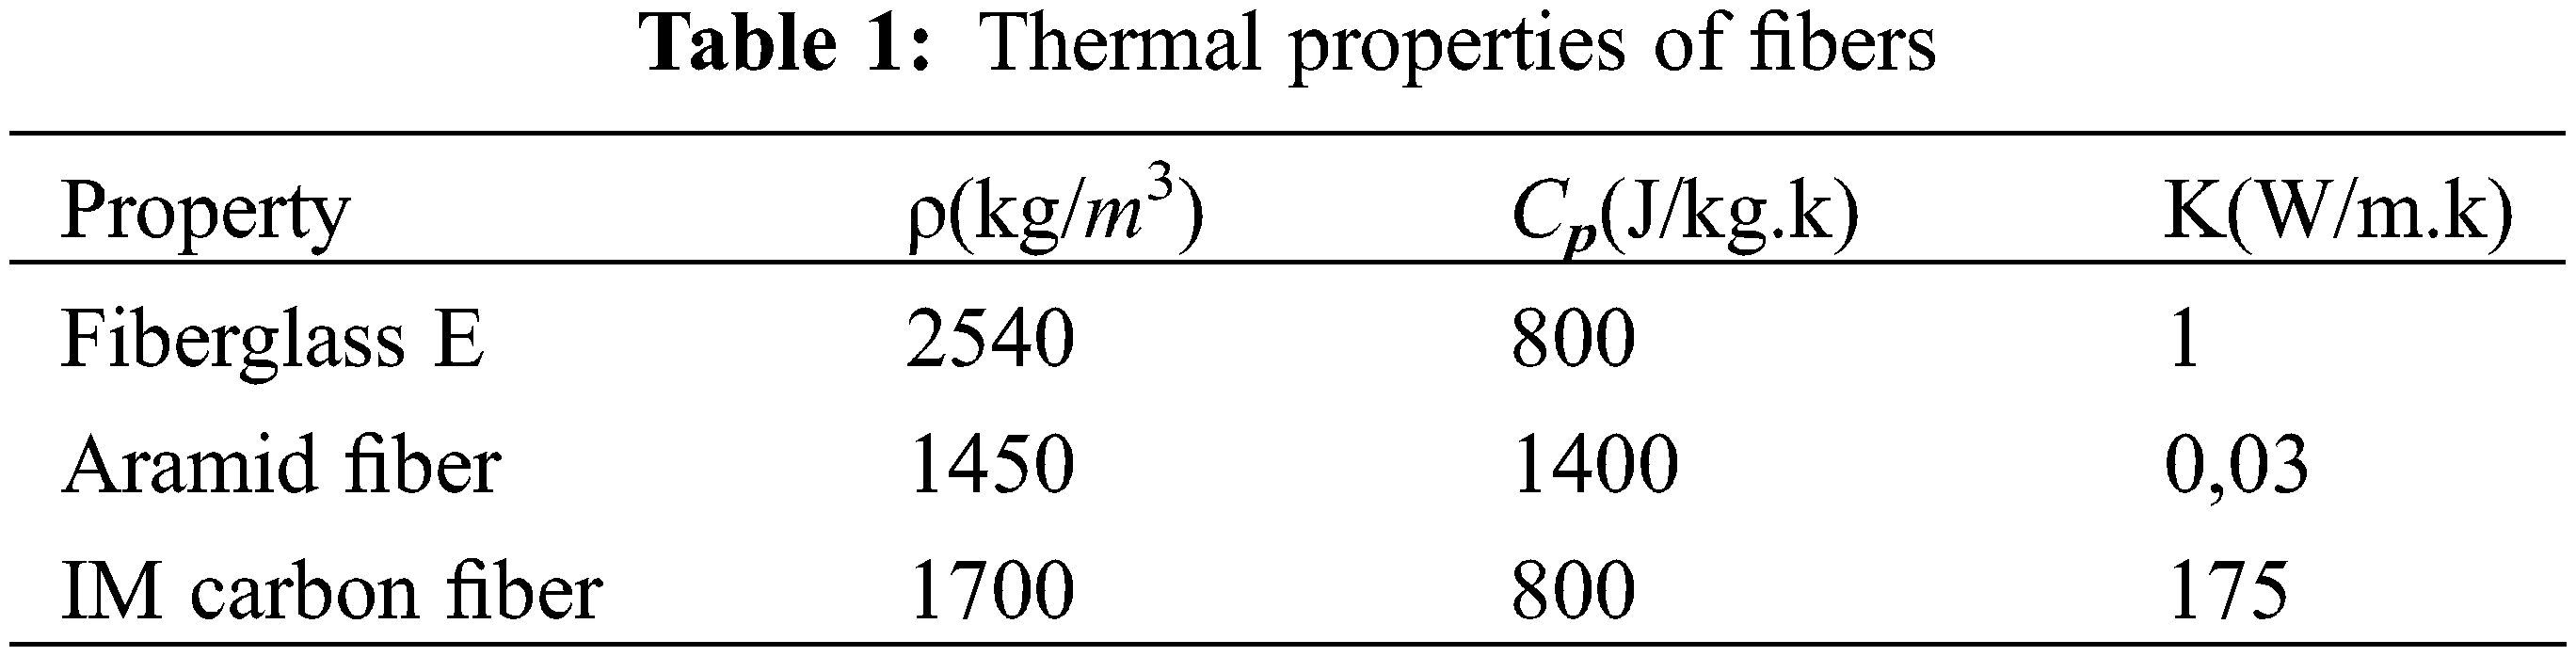
Carbon IM: This fiber unlike glassE or Aramid is recognized by its high thermal conductivity. This contribute to decrease the thermal gradient up to 359 K in Fig. 6 and the chemical reaction starts at 69 min and we note that the variation of degree of curing is very short to reach its maximum in Fig. 7.

Figure 6: Comparison of the temperature variation at the center (1/2) of the composite between vinlyester-glassE, vinlyester-aramide and vinlyester-carbone IIM

Figure 7: Comparison of the variation in degree of curing as a function of time between vinlyester-glassE, vinlyester-Aramide and Vinlyester-Carbone IM
The higher the thermal conductivity of the fiber, the shorter the curing cycle and the smaller the thermal gradient.
Aramide: The particularity of this fiber, is that it has a high calorific capacity, it made possible to eliminate the thermal gradient of a thick composite in Fig. 6 and the chemical reaction starts at 81 min with a duration of 249 min to have the curing of the composite in Fig. 7.
The greater the heat capacity, the lower the thermal gradient.
Secondly, we used two plates, the first has a temperature of 313 K and a duration of 23 min and the second has a temperature of 341 K and a duration of 100 min in Fig. 8. We had a temperature reduction of 13 K compared to the result in Fig. 6.

Figure 8: Temperature variation at the center of the composite for two plates (1st: 313 K-23 min and 2nd: 341 K-100 min)
We have carried out several simulations of maximum temperature at the center of the composite for different temperature and duration plate, to determine the optimal torque Fig. 9.

Figure 9: Maximum temperature at the center of the composite as a function of the plate duration for each chosen plate temperature
The torque obtained from the first plate is (328 K, 90 min) in order to have a minimum temperature of 421,9 K at the center for the thick vinlyester-glass composite with a decrease of 20,2 K (Fig. 10).

Figure 10: Temperature variation at the center of the composite for two plates (1st: 328 K-90 min and 2nd: 341 K-100 min)
In this article, we were able to approach the experimental results of the temperature variation at the center of a thick composite presented by Michaud thanks to the preheating method; this later has enabled us to develop a new model which takes into account the variation in the concentration of inhibitors as a function of the treatment time. In the second part, we have tried to determine the parameters and the adequate method in order to improve the performance of the thick composite and to avoid the thermal gradient that causes the degradation of the materials. The use of a fiber with a high calorific capacity or high thermal conductivity and the right choice of criteria (duration and temperature) of the plate makes it possible to reduce the thermal gradient. Despite these conclusions, it is observed that the time of the curing cycle remains very long compared to a thin composite. So it is a matter of research to find other ways to decrease the processing time.
Funding Statement: The authors received no specific funding for this study.
Conflicts of Interest: The authors declare that they have no conflicts of interest to report regarding the present study.
References
1. Asim, M., Jawaid, M., Saba, N., Nasir, M., Sultan, M. T. H. et al. (2017). Processing of hybrid polymer composites—A review. Hybrid Polymer Composite Materials, 2, 1–22. DOI 10.1016/B978-0-08-100789-1.00001-0. [Google Scholar] [CrossRef]
2. Kumar, H., Xavior, M. A. (2021). Composite materials production for automobile applications. In: Book reference module in materials science and materials engineering, pp. 640–651. Elsevier Inc., Amsterdam. [Google Scholar]
3. Hojjati M., Hoa, S.V., (1994). Curing simulation of thick thermosetting composites. Composites Manufacturing, 5(3), 159–169. DOI 10.1016/0956-7143(94)90025-6. [Google Scholar] [CrossRef]
4. Michaud, D. J. (1998). Curing behavior of thick sectioned RTM composites. Journal of Composite Materiales, 32(14), 1273–1296. DOI 10.1177/002199839803201402. [Google Scholar] [CrossRef]
5. Guo, Z. S., Du, S. Y., Boming, Z. (2005). Temperature field of thick thermo set composite laminates during cure process. Composites Science and Technology, 65(3–4), 517–523. DOI 10.1016/j.compscitech.2004.07.015. [Google Scholar] [CrossRef]
6. Abbassi, A. (2004). Numerical modeling of moldfilling and curing in non-isothermal RTM process. Applied Thermal Engineering, 24(16), 2453–2465. DOI 10.1016/j.applthermaleng.2004.03.005. [Google Scholar] [CrossRef]
7. Keller, A., Dransfeld, C., Masania, K. (2018). Flow and heat transfer during compression resintransfer moulding of highly reactive epoxies. Composites Part B: Engineering, 153, 167–175. DOI 10.1016/j.compositesb.2018.07.041. [Google Scholar] [CrossRef]
8. Raphael, K., Thomas, M., Christoph, C., Julia, H., Volker, A. et al. (2019). Thermal expansion of clay polymer nanocomposites as a function of aspect ratio and filler content. Polymer, 169, 74–79. DOI 10.1016/j.polymer.2019.02.036. [Google Scholar] [CrossRef]
9. Kamal, M. R., Sourour, S. (1973). Kinetics and thermal characterization of thermoset cure. Polymer Engineering & Science, 13(1), 59–64. DOI 10.1002/(ISSN)1548-2634. [Google Scholar] [CrossRef]
10. Yoon, J. S., Kibum, K., Seo, H. S. (2019). Computational modeling for cure process of carbon epoxy composite block. Composites Part B: Engineering, 164, 693–702. DOI 10.1016/j.compositesb.2019.01.082. [Google Scholar] [CrossRef]
11. El Youssfi, S., Saad, A., Echchelh, A., Hattabi, M. (2020). Thermal characterization and improvement of curing stage in resin transfer molding process. In: Handbook of research on recent developments in electrical and mechanical engineering, pp. 479–505. IGI Global. [Google Scholar]
12. Antonucci, V. (2001). A methodology to reduce thermal gradients due to the exothermic reactions in composites processing. International Journal of Heat and Mass Transfer, 45(8), 1675–1684. DOI 10.1016/S0017-9310(01)00266-6. [Google Scholar] [CrossRef]
 | This work is licensed under a Creative Commons Attribution 4.0 International License, which permits unrestricted use, distribution, and reproduction in any medium, provided the original work is properly cited. |