| Fluid Dynamics & Materials Processing |
DOI: 10.32604/fdmp.2022.022151
ARTICLE
Plus Energy Buildings: A Numerical Case Study
1EPF School of Engineering, Rosieres-Prés-Troyes, France
2Faculty of Engineering, Lebanese University, Hadath, Lebanon
3Centre Scientifique et Technique du Batiment, Health and Comfort Department, Saint-Martin-D’Hères, France
4Doctoral School of Science and Technologies, Lebanese University, Hadath, Lebanon
5Faculty of Technology, Department GIM, Lebanese University, Saida, Lebanon
6LMPS, Paris Saclay University, Paris, France
*Corresponding Author: Abdelatif Merabtine. Email: abdelatif.merabtine@epf.fr
Received: 23 February 2022; Accepted: 30 March 2022
Abstract: The feasibility of Plus Energy Building for a sample relevant case is investigated. After a literature review aimed to identify key aspects of this type of buildings, a preliminary evaluation of the thermal performance of a building constructed using conventional material is presented together with a parametric analysis of the impact of typical influential parameters. Solar domestic hot water (SDHW) and photovoltaic systems (PV) are considered in the study. Numerical simulations indicate that for the examined sample case (Beirut in Lebanon) the total annual energy need of conventional building is 87.1 kWh/y.m2. About 49% of energy savings can be achieved by improving the building envelope and installing energy efficient technologies. Moreover, about 90% of energy savings in domestic hot water production can be achieved by installing a SDHW system composed of two solar collectors connected in series. Finally, the addition of a grid connected PV array system can significantly mitigate the energy needs of the building leading to an annual excess of energy.
Keywords: Plus energy building; building performance simulation; parametric analysis; energy-efficient design; solar energy
The rapidly growing world energy use has raised concerns over supply difficulties, exhaustion of energy resources, and heavy environmental impacts, such as ozone layer depletion, global warming, and climate change. Demand for fossil fuels is rising with the rapid economic growth of developing countries. The rapid increase in fossil fuel prices will have short and long terms devastating impacts on economies and national securities of developed countries. The building sector accounts for about 40% of energy consumption in most countries and is responsible for emitting more than 30% of the greenhouse gas emissions [1,2]. However, thanks to the extensive research work, buildings demonstrated a huge potential to become highly efficient by deploying energy-efficient and innovative technologies and can offset all their energy use using renewable energy systems.
In the aim to decarbonize the building sector and enhance sustainable construction, developed countries have created and implemented in their policies several concepts, which aim at reducing building energy consumption and prompt the use of renewable energy systems. Net Zero Energy Building (nZEB) is a widely accepted concept and is defined as “a building that has a very high energy performance, as determined in accordance with Annex I. The nearly zero or very low amount of energy required should be covered to a very significant extent by energy from renewable sources, including energy from renewable sources produced on-site or nearby” [3].
Nowadays, considering the improved efficiency of building technologies and renewable systems, the concept of Plus Energy Building (PEB) is emerging. Some European research projects, such as Horizon 2020 project “Cultural-E”, have been initiated to investigate the buildings’ potential to achieve plus energy targets and propose a consistent definition framework. However, a clear and consistent definition is not established yet.
PEB concept represents a potential solution for the rapid increase of energy consumption in developing countries, such as Lebanon. For instance, Lebanon meets nearly all its energy needs from the importation of oil products because the country lacks conventional fossil fuel energy resources and is not effectively benefiting from the available renewable resources [4]. In 2019, more than 8.5 million toes (tons of oil equivalents) were imported, of which about 60% were consumed for electricity generation. However, renewable energy shared only about 3.5% of the total primary energy supply (TPES). The buildings sector stands for about 35% of the total final energy consumption. Therefore, reducing the energy consumption in the building sector represents a first and essential step towards reducing the country’s energy consumption, dependence on oil importation, and reducing environmental pollution.
The objective of this study is to investigate the feasibility of achieving Plus Energy Building in Beirut, the capital of Lebanon. In this consequence, the first step is to review the literature on PEBs within a climatic condition like those of Lebanon. This is important to identify the utilized metrics of balance, period of balance, type of balance, types of energy-use considered in the balance, and renewable energy supply options. Next, based on the identified key aspects of PEB, a research method based on dynamic building performance simulations is proposed for the investigations. The adopted approach is then applied to a representative case study. Finally, the obtained results are presented and discussed, and the main conclusions are stated.
Hawila et al. [5] carried out an extensive literature review on PEB to identify the key aspects that are needed to define a consistent framework for PEB. The authors identified 82 papers that fit the eligibility criteria of the study. Here, only the studies that present comprehensive investigations to achieve plus energy building under the Mediterranean climatic conditions are considered [6–25]. It is worth noting that studies that did not achieve plus energy balance are not considered in the analysis, such as [26–31]. The reviewed literature indicated that most of the studies considered new buildings in the investigations. About 80% of the studies were performed on residential buildings, while the rest were educational, offices, and other building types. Numerical simulations were significantly utilized in the evaluation, while experimental assessment focused on representative case studies [10,13,14,18,24].
Although the PEB concept is evolving and expected to become the target for new and renovated buildings, its definitions are still inconsistent. For instance, PEB is defined as, a Net Zero source energy building [32], a building that produces more energy than is needed, and exporting it to other buildings or systems [33]; a building that it produces more energy on site than it uses on annual basis [34]; the annual electrical energy surplus fed-in to the grid is greater than the annual electrical energy imported from the grid [35]; an energy efficient building that produces more energy than it uses via renewable energy sources, with high self-consumption rate and high energy flexibility over a time span of one year [36].
It is defined as the utilized metric to assess the final balance of the building. The European Commission stated that the plus energy target should be verified through primary energy balance, considering national conversion factors, final energy, or CO2 emissions. The reviewed studies show a tendency towards the use of final and primary energy as balancing metrics. Few studies considered other metrics, such as CO2 emissions [6], the non-renewable primary energy balance [17], and the renewable energy ratio [16,17]. The main advantage of using primary energy is that it considers different energy carriers. Besides, primary energy savings are more compatible with the decarbonization of the building sector by considering conversion and transportation losses. Nevertheless, final energy is transparent and easy to understand for building inhabitants as it is a measurable metric.
The period of balance is the time span during which the balance calculation is performed to understand the achieved balance. It is noticed that the annual balance is the most considered balancing period to assess the final energy balance of a building. Some studies utilize a monthly balance [15–17], and in a few cases the full life cycle of the building [8]. The pros and cons of possible periods of balance are summarized in [5]. The significant use of annual balance can be attributed to the fact that some parameters, such as building inhabitants and weather data, may vary every year, which led to variations in the final energy balance.
In theory, two methods are considered for evaluating the energy balance, load/generation, and import/export. The reviewed literature shows that the balance between building loads and renewable energy generation is the most common evaluation method. Only three studies of the considered literature evaluated the balance by comparing energy delivered to the building and energy feed to the grid [15,18,21]. This type of balance requires adding the estimation of energy generations to the calculated building loads, which makes it more practical compared to the import/export balance. This last requires estimates of self-consumption patterns and detailed simulations.
According to the international standard EN 15603:2008 [30], the energy rating calculation should obligatory include only the energy use that does not depend on occupant behaviour. Nevertheless, including user-related energy consumption in the balance leads to more reliable sizing of the renewable energy system. For instance, David et al. [37] and Dokka et al. [38] experimentally evaluated the performance of two buildings that were designed to achieve plus energy balance, both studies found that the building can only achieve the nZEB target due to an increase in user-related consumption during operation time. Most of the reviewed studies included the user-related energy consumption in the final balance evaluation.
2.6 Renewable Energy Supply Options
On-site and off-site renewable systems are the two possibilities to supply energy for PEB. The majority of the reviewed literature considered the on-site option, which can be installed within the building footprint or site [39]. On-site systems have gained popularity due to the continuous research work that aims to improve the performance of the renewable system, such as the integration of PV systems with building envelope and its improved efficiency. However, some buildings, such as compact and high-rise or buildings in urban areas, have limited areas for the installation of RE systems. Here, the off-site generation represents a potential option to offset the building needs.
Based on the reviewed literature, the final energy balance is adopted as the metric of balance, an annual time span is considered for the period of balance, the difference between generated renewable energy and building load is used as a type of balance, the included energy in the final balance is those required to maintain acceptable indoor environment and the user-related consumption, and lastly, on-site renewable energy generation is considered as the supply option.
In addition, dynamic building performance simulations are adopted to carry out the simulations. On the one hand, construction and monitoring campaigns are costly and have limitations in exploring potential variations in building design parameters. On the other hand, dynamic building performance simulations can provide adequate conclusions with less time and cost, as well as it enables analyzing different scenarios during the design phase without the need for an existing building. In this study, TRANSYS is used for modeling purposes.
The energy performance of a residential building located in Beirut, the capital of Lebanon, is considered for the investigations. The base case study is assumed to be occupied by a single family of four persons and constructed using conventional materials presented in the Lebanese market without using thermal insulation, efficient appliances, efficient lighting system and available renewable energies. The building is south-oriented and consists of two floors connected by internal stairs; the first and second floors plans are shown in Fig. 1. Construction properties for the house are listed in Table 1. It is assumed that the building is occupied by a family of four persons who perform light work. This represents a heat gain of 150 W per person based on ISO7730. The occupancy schedule that is assumed is fixed throughout the year. Fig. 2a shows the occupancy hours of the building during weekdays and weekends.
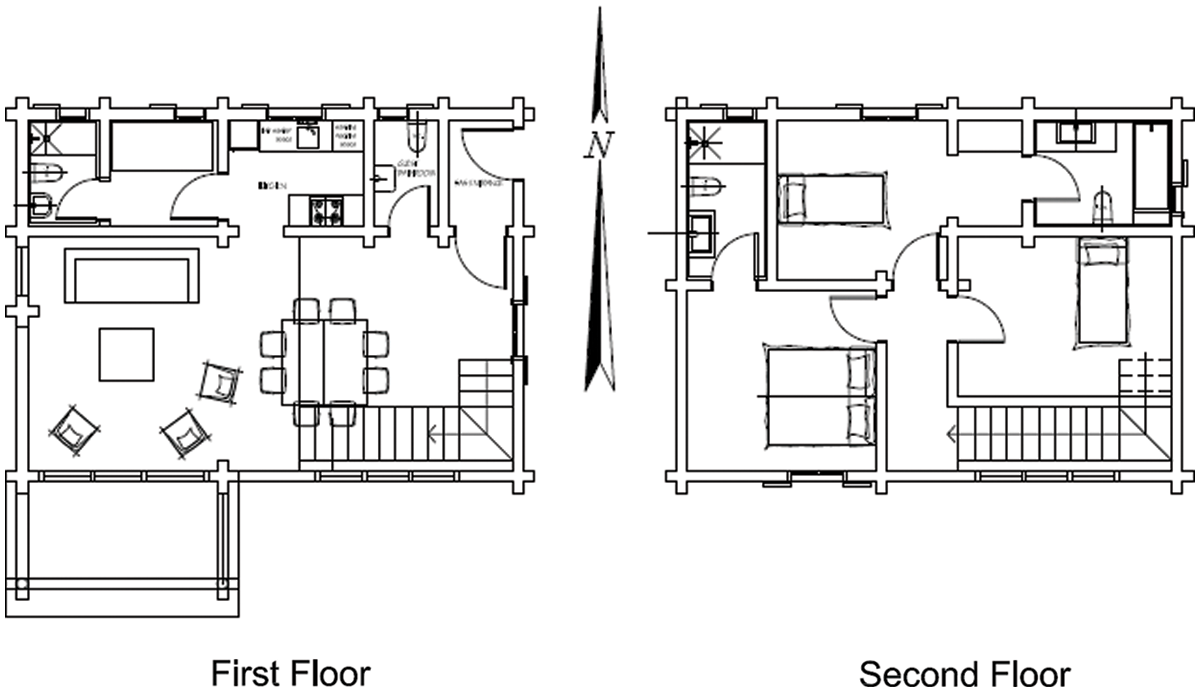
Figure 1: First and second floor plans of the building

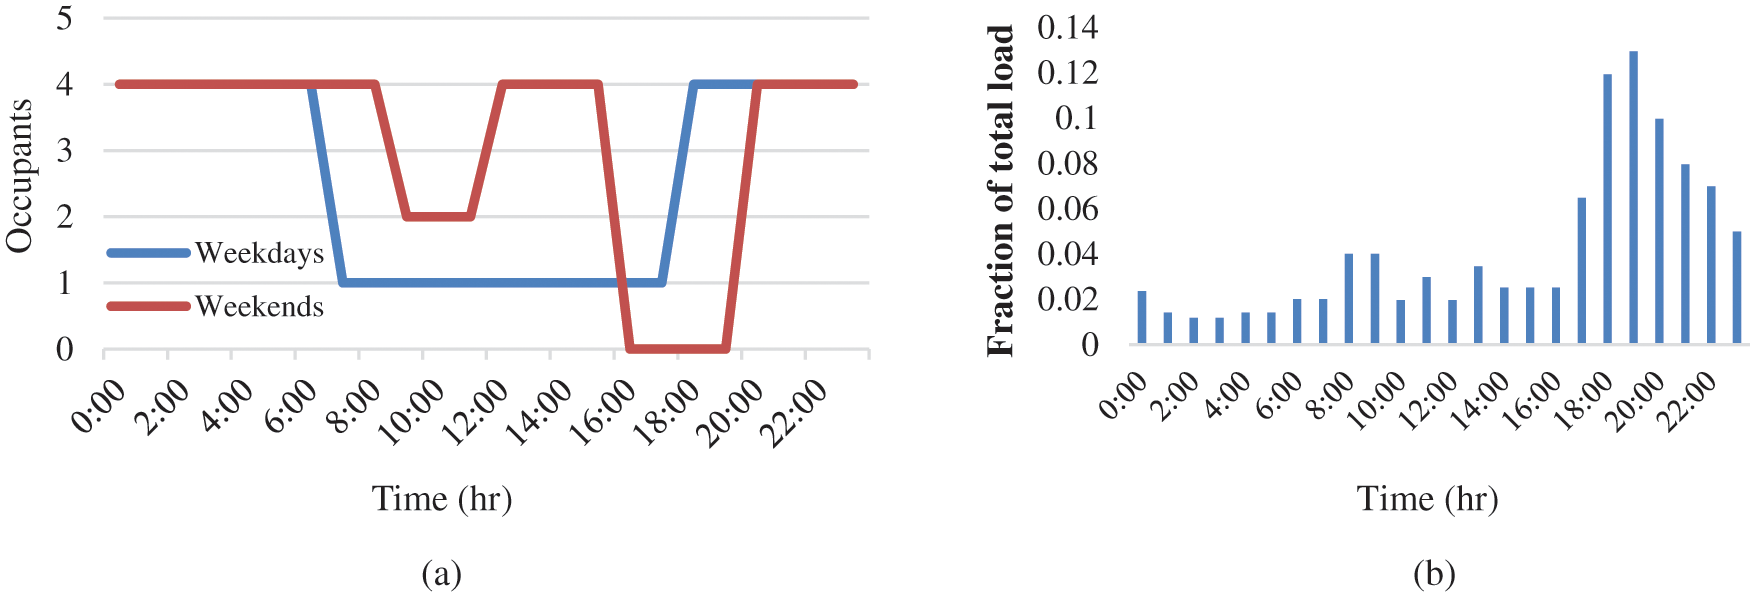
Figure 2: (a) Occupancy schedule of the house during weekdays and weekends, and (b) Estimated lighting and appliances hourly load profile
The ventilation rate of each zone is assumed to be 0.4 ACH during occupied hours, and it is calculated using ASHRAE standard requirements (0.05 L/s per square meter and 3.5 L/s per person). The cooling set-point temperatures are 24°C and 26°C during occupied and unoccupied hours, and the desired relative humidity is 50%. The heating set-point temperatures are 20°C and 18°C during occupied and unoccupied hours, respectively.
The hourly load profile for the lighting systems and electrical appliances (Fig. 2b) has been estimated using the monitored data presented in [40,41]. It is assumed that the total electrical load is instantly converted into heat and thus becomes a heat gain. The electric appliances considered include a refrigerator & freezer, washing machine, dishwasher, cooking equipment, audiovisuals, and PCs.
Domestic Hot Water (DHW) system is a conventional electric-based system. The total domestic hot water consumption is about 200 L/day. The DHW system uses a 2 kW electrical heater in the domestic water tank to provide the energy needed to meet the load requirements. This heater had a set point temperature of 60°C and a dead-band temperature of 5°C, and it is controlled using a thermostat. The supplied water temperature for domestic uses is assumed to be 45°C. Hourly DHW consumption profile (Fig. 3) is proposed to be fixed all the days of the year and estimated using the data presented in [42] by calculating the average consumption of each hour of the four seasons.
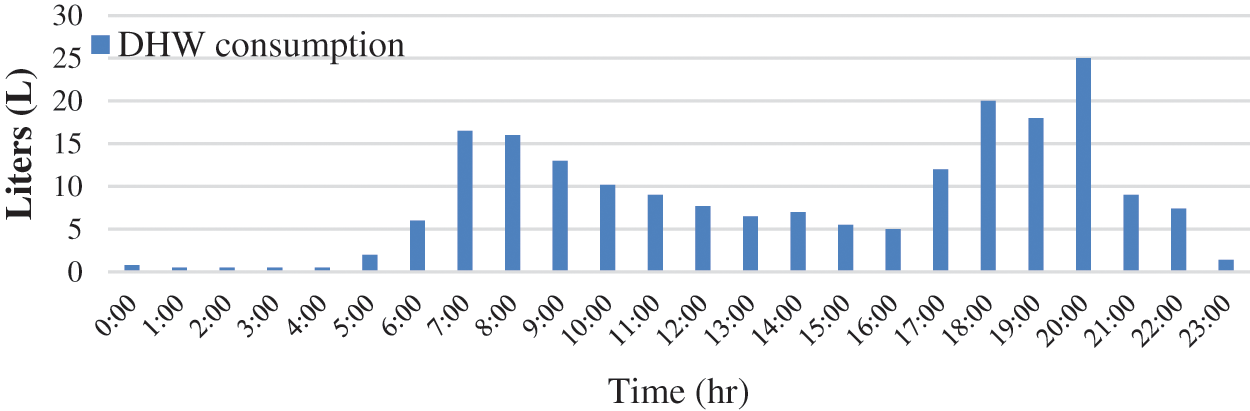
Figure 3: Hourly hot water consumption profile in a typical day
Fig. 4a shows the monthly distribution of direct and diffuse solar radiation in Beirut. Solar radiation is generally high throughout March–November. Fig. 4b illustrates the average, maximum, and minimum monthly dry bulb temperature distribution for a typical year. The annual highest temperature is 33.05°C and the lowest dry bulb temperature is 7.4°C.
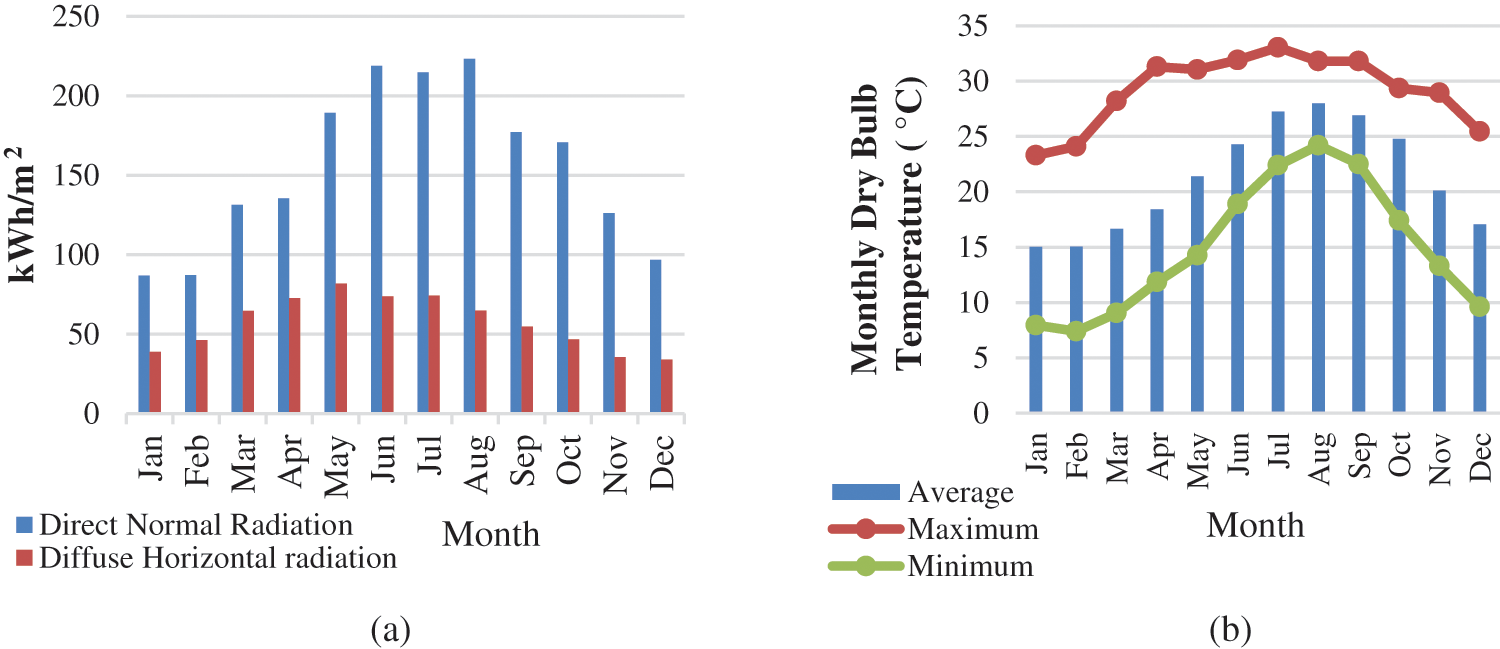
Figure 4: (a) Monthly solar radiation distribution profile in Beirut, and (b) Monthly dry bulb temperature distribution for a typical year in Beirut
This section aims at understanding the impact of varying building design parameters and operation alternatives on energy consumption; identifying the ones that would reduce space cooling and heating demand. Thus, reducing the total end use energy needs of the building. Various parameters, including insulation thickness, building orientation, glazing type, shading system, and lighting system and electrical appliances, are investigated.
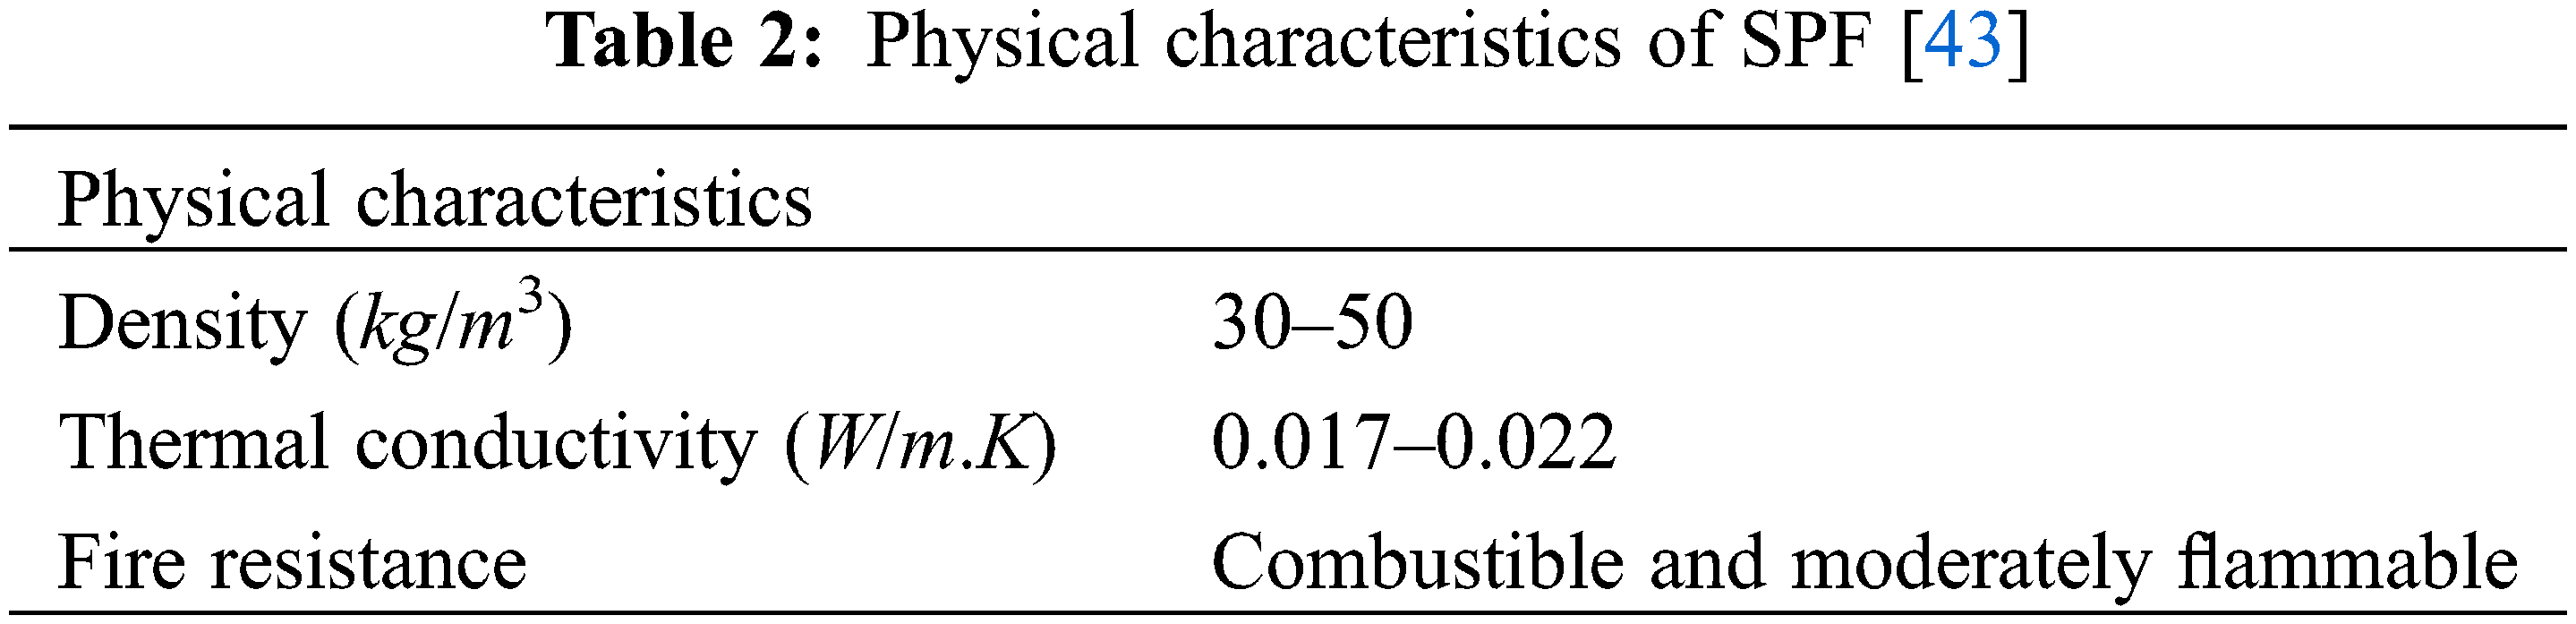
Six scenarios are considered for external walls and eight for the roof. Spray Polyurethane Foam (SPF) is the best insulation material available in the Lebanese market [43], so it is selected for investigations. Table 2 shows the physical characteristics of SPF, and Table 3 reports the different scenarios. “W” represents external wall options, and “R” denotes roof ones.

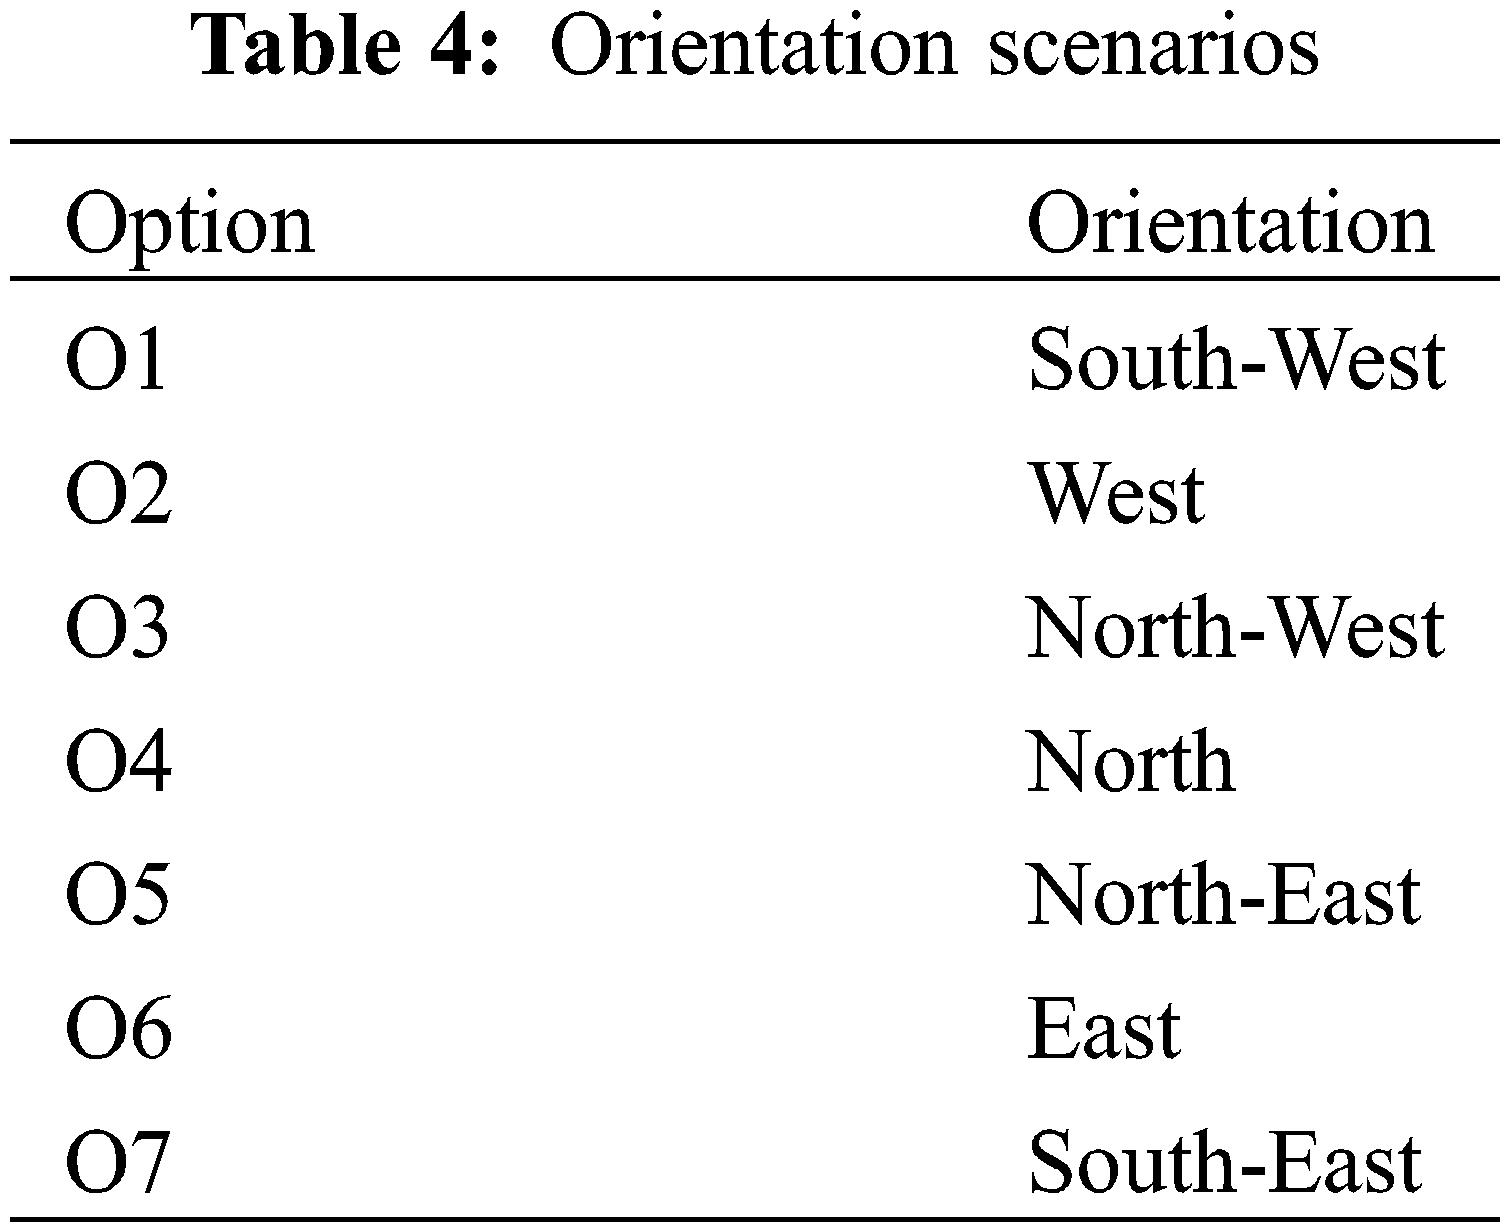
To assess the sensitivity of cooling and heating demand of the building to the variations in building orientation, a set of simulations are performed. The wall containing large window areas is taken as a reference for the building orientation. Table 4 shows the orientation scenarios of the building.
Window type, area, orientation, and shading should be jointly considered to effectively control the heat gain and heat loss of a building. Window types used in our optimization are chosen from the TRNSYS library. Two options are chosen, G1 is a double glazed (insulating glass) window with timber frames (4/16/4, U-value (W/m2 K) = 2.83, and g-value = 0.755), and G2 is a double glazed, argon filled, low emissivity (low-e) windows with timber frames (4/16/4, U-value (W/m2 K) = 1.4, and g-value = 0.589).
Controlling the solar gain through the windows has a significant impact on the heating and cooling load requirements of the house. The types of shading devices implemented in the parametric simulation are overhangs for all windows (S1), external blinds (S2), and internal blinds (S3). The fix shades involved overhangs and fins designed according to the sun path diagram. Overhangs (S1) with shading factors 0.7 for south and north and 1 for east and west oriented windows are investigated. The moveable blinds (S2, S3) are assumed to operate from 5:00–11:00, 9:00–15:00, and 13:00–19:00, for east, south, and west oriented windows.
3.4.5 Lighting System and Electrical Appliances
Four scenarios are considered for parametric simulations, L1 represents average energy lighting (10 W/m2), L2 denotes energy-efficient lighting (5 W/m2), L3 represents base case lighting system with efficient appliances, and L4 stands for the energy-efficient lighting and efficient appliances.
Lebanese climate has high solar irradiation with almost 300 sunny days annually (Fig. 4a), making the use of solar panels, thermal and photovoltaic, an increasingly popular option. This study will focus on solar as the renewable energy source. The proposed renewable energy system is solar thermal panels with a water tank for thermal inertia and a grid connected PV array.
Solar water heating is very common in both small and large applications. The basic elements used in solar water heaters can be assembled in many different configurations. Some common system layouts are natural circulation, one-tank forced-circulation, system with antifreeze loop and internal heat exchanger, and system with antifreeze loop and external heat exchanger [44]. Here, a one-tank forced-circulation solar system is assumed to be deployed. It is an active water heater that requires a pump to provide forced circulation. This type is usually controlled by a differential thermostat to turn the pump on when the temperature at the outlet of the collector is higher than the temperature of the water at the bottom of the tank by a set margin.
The PV array grid-connected system is comprised of a PV array, inverter for PV (from DC to AC), a distribution board, meters for export and import connected to the grid and electrical loads. Here we are not interested in just sizing the PV system, but we want to know when the PV output is generated in relation to when it is needed, when the system feeds back into the grid, and when the peaks occur, thus the use of TRNSYS becomes valuable.
The 3D modeling of the case study building is carried out by “Google SketchUp” software using a plug-in called TRNSYS3d. Fig. 5 shows two different 3D views for the whole building model in Trnsys3D. The created 3D model was imported to TRNBuild wizard to create Type56 (TRNSYS multi-zone building) and to set the different parameters of the building. Besides, all the previously defined hourly schedules are used to define the performance of different systems of the building. After defining all the building parameters using TRNBuild, the file was exported to TRNSYS simulation studio to simulate different energy loads of the building. A domestic water tank (Type60d), time-dependent forcing function for the water draws (Type14b), a tempering valve (Type11b), and tee piece (Type11h) were used to construct the electric DHW system. Then a new equation type component is used to calculate the total energy consumption of the system by summing the different loads presented in the building. The final system layout in the TRNSYS simulation studio is shown in Fig. 6. The other components were for logging and displaying simulation results to analyze the performance of the system.
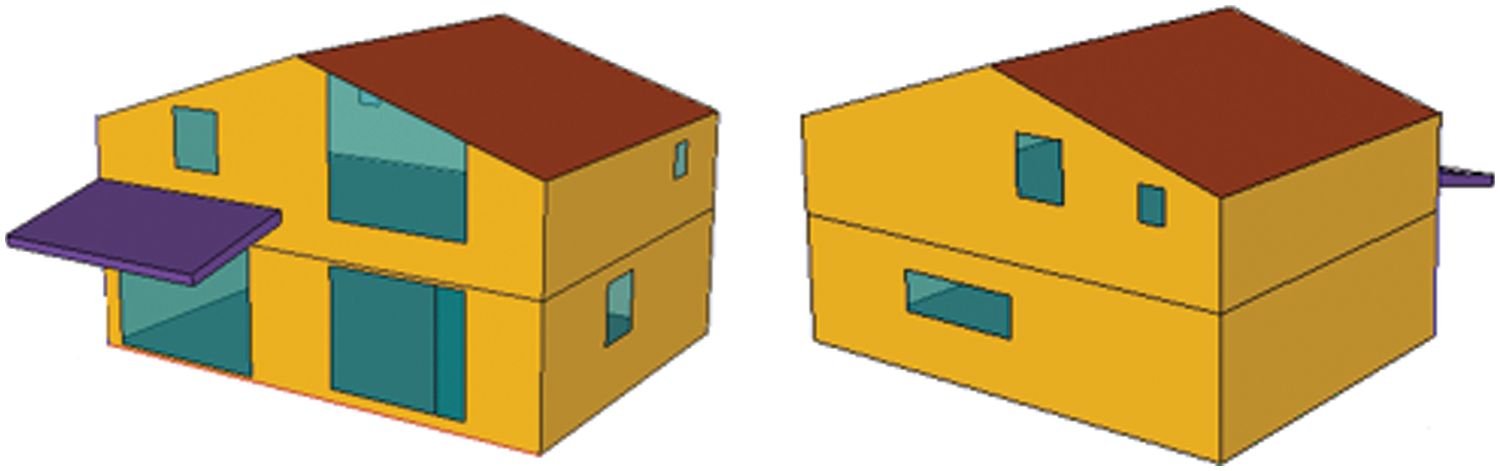
Figure 5: TRNSYS3d model of the building

Figure 6: Final system layout in TRNSYS (including SDHW and PV systems)
3.6.2 Solar Domestic Hot Water Model
SDHW system is created in TRNSYS by adding a solar loop to the electric DHW system configuration. In addition to the electric DHW model, this system requires a Flat Plate Collector (FPC) (Type1b), circulating pump (Type3b), and differential controller (Type2b). Recall that water is the circulated fluid in the collector loop. Viessmann Vitosol 100-F flat plate collector with an area of 2.494 m2 is used in our simulation. A ten-node tank is modeled for the SDHW system with a fluid density of 1000 Kg/m3, an overall loss coefficient of 3 kJ/hr.K.m2, and fluid specific heat of 4.19 kJ/kg.K to represent water.
The temperatures in the domestic tank are allowed to get much higher than the required delivery temperature. If there is solar energy to collect, it takes advantage of the available energy and stores it in the domestic water tank. This thermal storage allows the tank to meet higher load demands during times when there is no solar energy available to recharge the tank and greatly reduce the usage of the electric backup heater. Therefore, it is expected that the tempering valve is used often in this case, especially in the summer months.
System controls are implemented to ensure that the solar loop is running only when there is sufficient energy to be collected. This is done in TRNSYS using the Type2b differential controller. It monitors the temperature of the cold water at the bottom of the domestic tank and the outlet temperature of the solar collector to determine if there is energy to be collected. If the temperature of the water at the collector outlet is 5°C or more above the temperature of the water at the bottom of the tank, then the pumps are turned-on to collect this solar energy. The system continues to operate until this temperature difference falls below 2°C. The controller also monitors the temperature of the water at the top of the tank to ensure that it does not get too hot by using a high temperature cut-off of 90°C. If this temperature is reached during operation, the pumps stop so that the water in the domestic tank does not boil.
Photovoltaic array (Type94a) and DC/AC inverter (Type48a) are used to simulate a utility grid-connected renewable energy system under Beirut weather conditions; Type57 is used for unit conversion. The inverter will convert the direct current (DC) electricity produced by the PV array into alternating current (AC) electricity typically required for building loads with an efficiency of 0.8. PV modules used in our simulation are SHARP ND-R250A5 polycrystalline silicon solar cells.
The estimated annual thermal load of the building is 18515 kWh. Space cooling consumes 85% of this load (15775 kWh), while space heating consumes only 15% (2740 kWh). For the employed vapor compression heat pump, it is considered that the coefficient of performance (COP) is 2.9 for the cooling mode and 3.1 for the heating mode. Thus, the annual electrical load of the cooling system is about 5440 kWh, and that of the heating system is about 885 kWh. Moreover, the annual electrical load of the DHW is about 2665 kWh.
The total simulated amount of electrical energy annually consumed by the building per square meter is 87.1 kWh/y.m2. Fig. 7 shows the monthly distribution of the total simulated end use energy by type of energy use. The peak electrical load is in August because of the high demand for space cooling due to the high outdoor temperature during this month, whereas the least amount of consumed electrical load is in April due to the moderate climate season since almost all the time of the month there is no need for neither space heating nor space cooling. Space cooling consumes the largest amount of electrical energy 40.92 kWh/y.m2 (47%). Space heating consumes 6.65 kWh/y.m2 (7.6%), DHW consumes 20.03 kWh/y.m2 (23%), and the remaining (22.4%) are consumed by the lighting system 5.26 kWh/y.m2 (6%) and electrical appliances 14.24 kWh/y.m2 (16.4%).
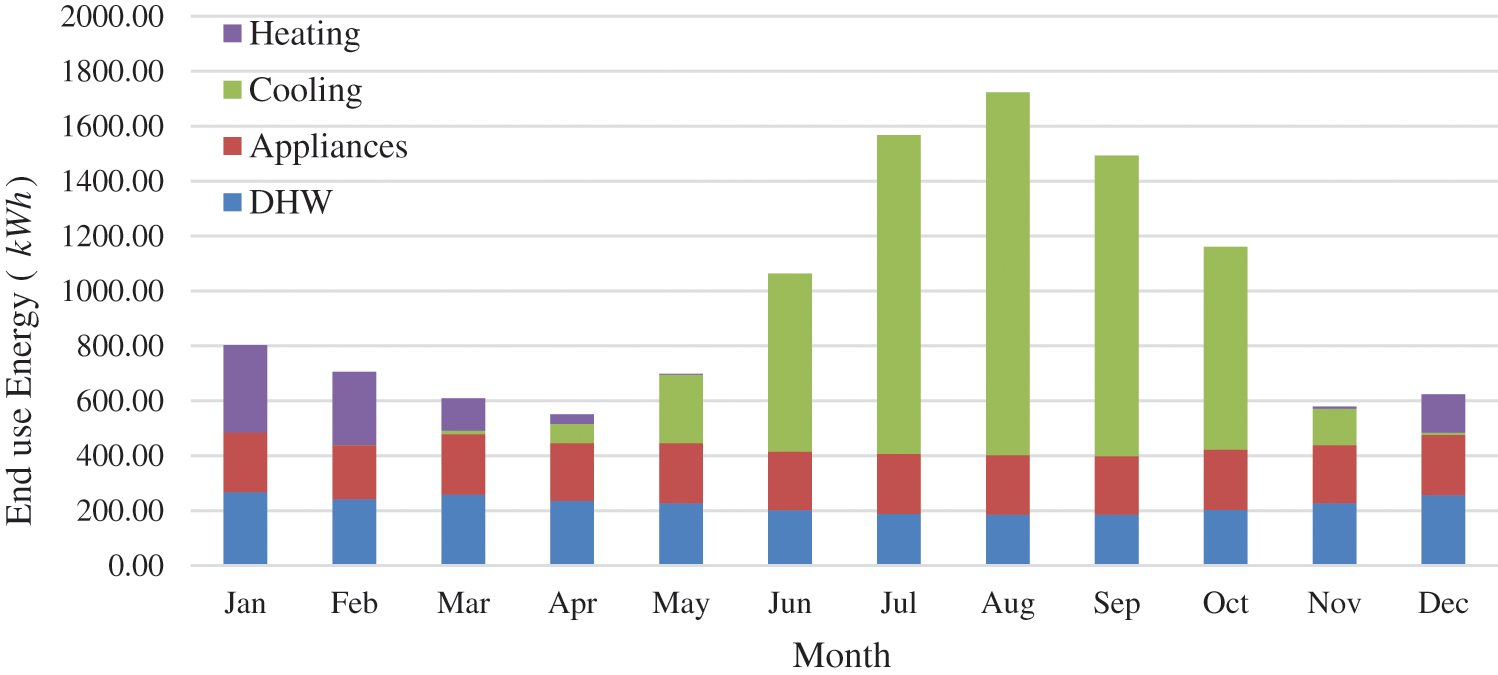
Figure 7: Monthly distribution of the total estimated electrical energy consumption by type of energy use
Therefore, to reduce the energy consumption of the building, a major trend is to reduce the space cooling load by improving the thermal performance of the building envelope, improving the efficiency of the lighting system and electrical appliances, and other options to be described in the next section.
Figs. 8 and 9 show the impact of external wall and roof insulation, respectively, on cooling, heating, and total end use energy of the building. The results indicated that cooling and heating loads decrease as the insulation thickness increase. This is correlated to the fact that increasing wall and roof insulation, leads to an increase in opaque surface U-value, which implies less heat loss from the building to the surrounding during the heating season and fewer heat gains from the outside during the cooling season. It is observed that above 3 cm of wall insulation and 5 cm of roof insulation the load is almost constant, and the added insulation thickness has almost no impact on the end use energy loads. Thus, they are considered as the best scenarios for our case study.
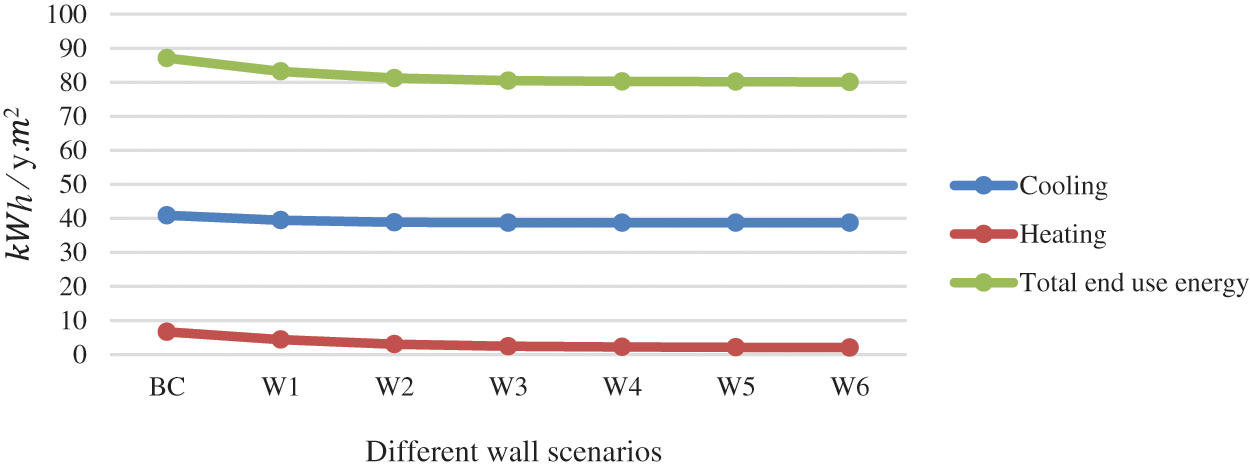
Figure 8: Space heating, space cooling and total end use energy demand for different eternal wall scenarios

Figure 9: Space heating, space cooling and total end use energy demand for different roof scenarios
The simulated space heating and cooling demand for the considered orientations are shown in Fig. 10. North orientation is the best among the others, and that is because of the reduction in solar gains by the glazing area, therefore reducing the cooling load and the total end use energy of the building.
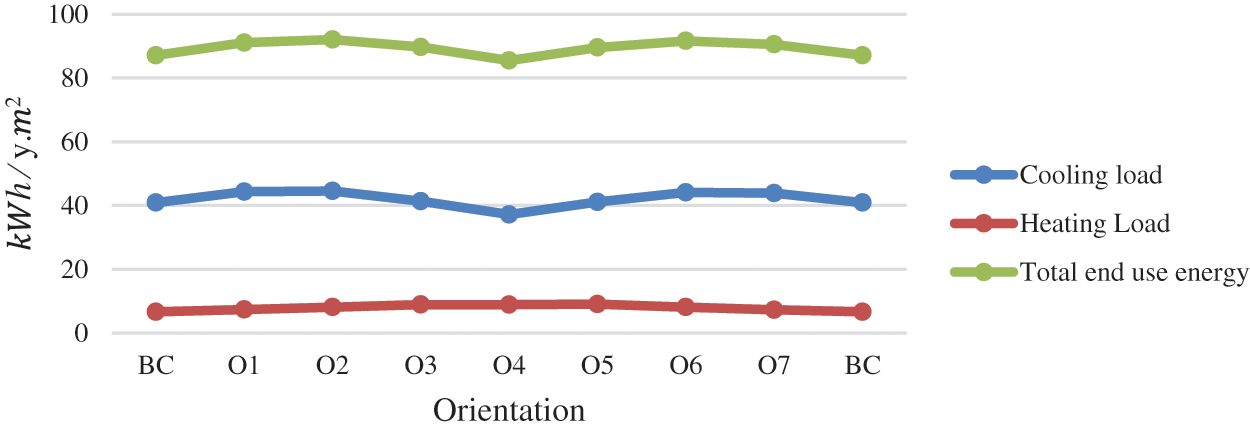
Figure 10: Space heating, space cooling and total end use energy demand for different building orientations
An improvement in both cooling and heating loads results from the installation of a double glazed, argon filled, low emissivity window (Fig. 11). And thus, a noticeable decrease in the total end use energy loads. Combining (G2) with the best orientation and adding a shading device will have a substantial influence on the total end use energy of the building.
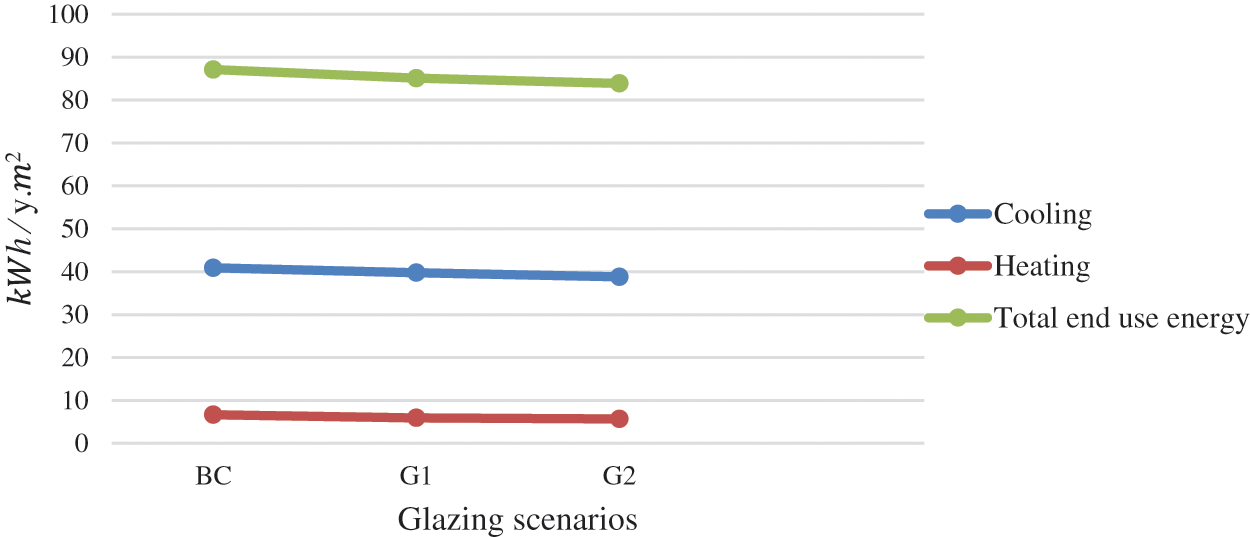
Figure 11: Space heating, space cooling and total end use energy demand for different window types
Fig. 12 shows a significant reduction of the cooling load in the three studied cases, because of the reduced solar gains in the presence of shading device. On the other hand, these issues contrary affect the heating load, and thus an increase in the heating load is presented in the three cases. Moreover, the total end use energy shows a better performance in the case of fix shades, thus fix shades will be considered as the better performing scenario among the other two cases.
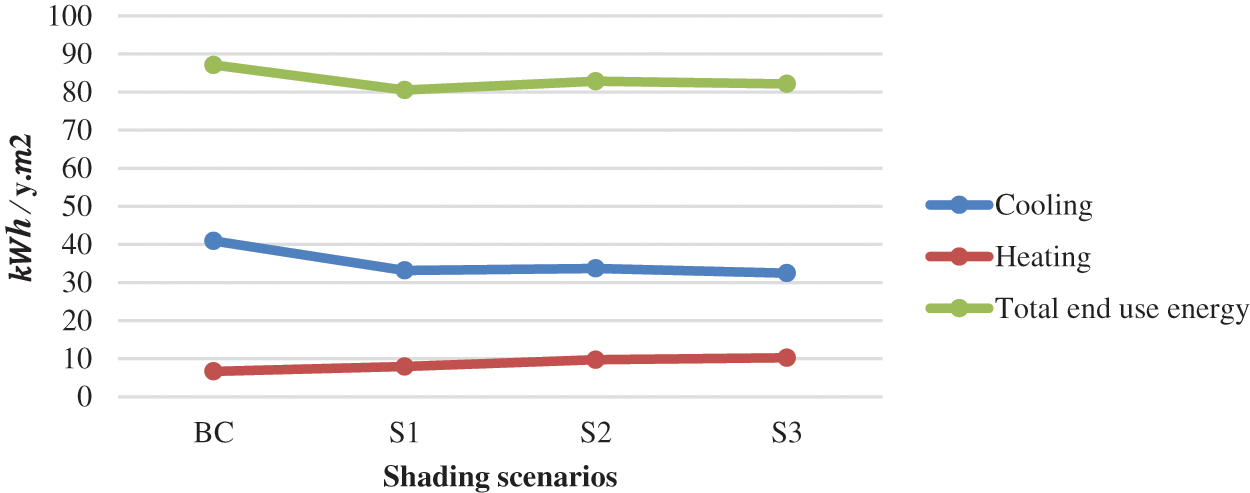
Figure 12: Space heating, space cooling and total end use energy demand for different shading types
Installation of a more efficient electrical lighting system and efficient electrical appliances (L4) has a positive impact in reducing the buildings’ sensible cooling loads. Likewise, there is a big drop in the total end use energy (Fig. 13) and that is because using the efficient system did not reduce the cooling load only, but also the electrical energy consumption of the lighting system and electrical appliances. Therefore, efficient lighting and electrical appliances are key factors in building of efficient design.
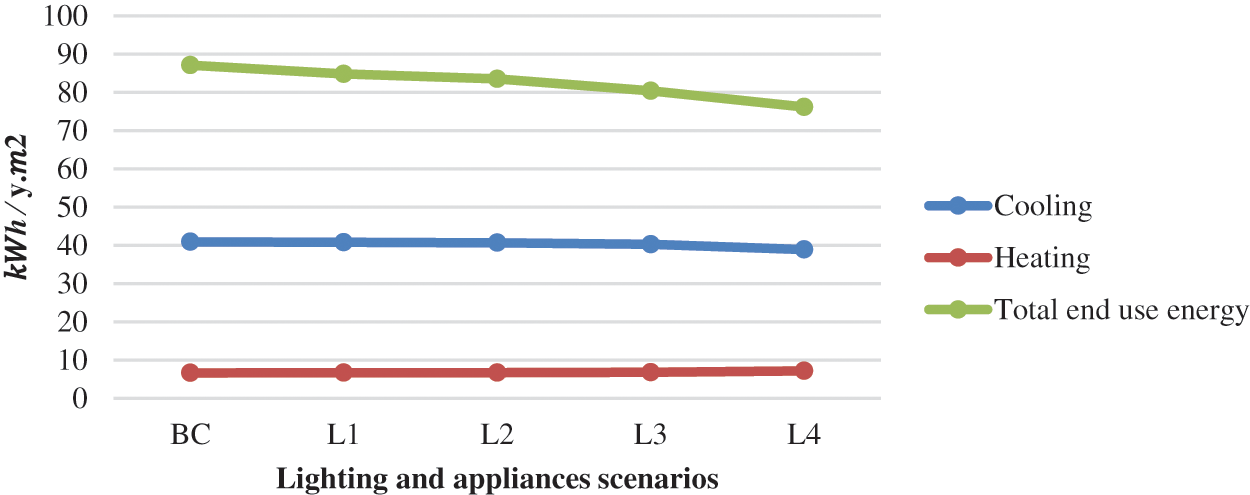
Figure 13: Space heating, space cooling and total end use energy demand for different lighting and appliances options
Combining the best scenarios of each investigated parameter leads to a significant reduction of building total end use energy. Fig. 14 shows the total simulated annual load by type of energy use for both base and efficient cases. About 70% reduction in the cooling demand of the building is the most influencing result since alone it stands for about 33% reduction in the total end use energy of the building. On the other hand, the efficient design led to a noticeable 85% reduction in buildings’ heating demand, thus leading to approximate elimination of the heating load of the building. In addition, efficient lighting system and electrical appliances led to a 10% reduction in the total end use energy of the building.

Figure 14: Total simulated annual load by type of energy use for both base and efficient cases
As a result of the efficient case study, significant energy savings (50.2% reduction in total end use energy) can be achieved by optimizing the heat gain by building envelope and heat loss from the building during cooling and heating seasons through better insulation of the building envelope, the north orientation of the largest glazed area, using of low emissivity double-glazing type for windows, introducing shading devices, and using efficient lighting system and electrical appliances. Finally, reducing the total energy use of the building is the first step in our study to approach plus energy building. More reduction in the load could be achieved by using a solar thermal system instead of an electrical DHW system, in addition to renewable systems to produce electrical energy.
As a first step, parametric simulations to optimize the performance of the SDHW system are performed. The considered parameters are the number of solar collectors connected in series, and different mass flow rates (10–70 kg/hr.m2). The solar collector’s mean annual efficiency and solar fractional energy saving are used to optimize the design parameters.
The obtained results indicated that there is an optimum mass flow rate for each number of solar collectors. For one solar collector, the optimum mass flow rate is 10 kg/hr.m2 and solar collectors mean annual efficiency decreases drastically with the increase of mass flow rate. For the remaining systems (2, 3, 4, and 5 FPCs), the optimum mass flow rate is 20 kg/hr.m2, and the changes of efficiency with the variation of mass flow rate tend to be slow. The maximum solar collector’s mean annual efficiency decreases with the increase of solar collector areas. In addition, the solar fractional energy saving increases when the number of solar collectors increases, and the annual solar fraction varies with different mass flow rates. As a result, two solar collectors connected in series with mass flow rate 20 kg/hr.m2 are selected for solar domestic hot water system. The mean annual efficiency is 30.09% and the annual solar fractional energy saving is 94.16%. Noting that, these results are obtained for a water storage tank 200 L. The annual required auxiliary energy is 270 kWh, which is about 10% of that of the conventional electric DHW load.
The simulation of photovoltaic module (250 WP, 1.64 m2) gives 370 kWh/year, and the simulated end use energy of the building after applying efficient design and installing the SDHW system is 3370 kWh/year. Therefore, the designed PV array system proposed for our simulation is composed of 10 PV modules, arranged in 2 strings with 5 modules connected in series in each string.
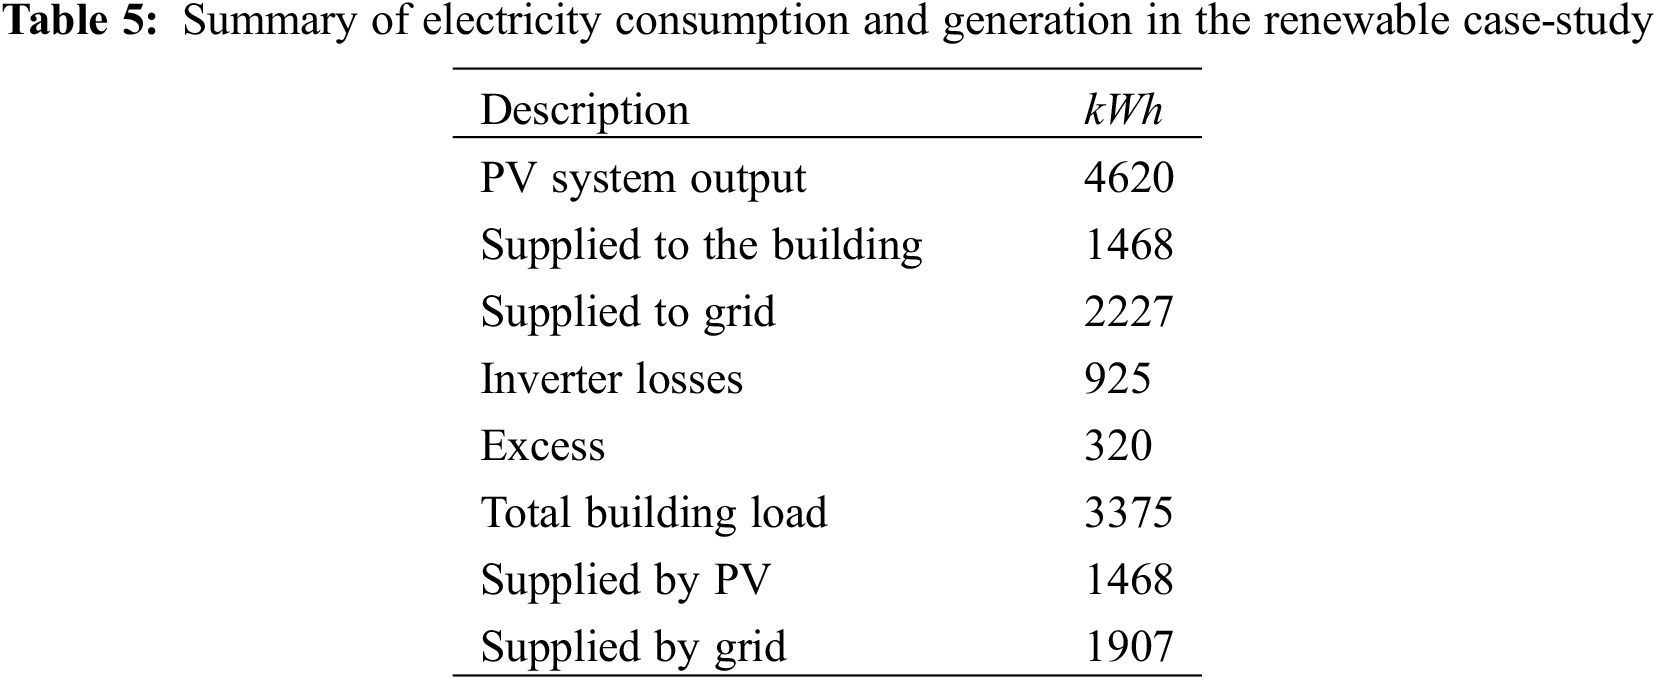
The annual electricity consumption and generation are summarized in Table 5. The annual electricity generated with PV is predicted to be about 4620 kWh, 3695 kWh are the inverter output and the remaining are losses. The electricity consumption from lighting, appliance, auxiliary heating, and circulation pump for SDHW and energy consumption in space cooling and heating system is 3375 kWh. The Excess electricity (320 kWh) can be financial gain from the sale back to the grid. These results indicate that it is theoretically possible to achieve the plus energy homes in Beirut, Lebanon. Bearing in mind that the roof area allows for more PV system installation, thus more renewable energy generation.
The obtained results indicated that achieving plus energy buildings within the Lebanese context requires two main steps, improving the building efficiency and installing efficient renewable energy systems. The performed parametric analysis revealed that insulation thickness for both roof and walls is the most critical parameter to achieve energy-efficient building, followed by the shading system. Improving both parameters result in improved thermal resistance of the building envelope. On the one hand, this allows the reduced transmission heat gain under hot weather conditions, which improves the cooling energy consumption. On the other hand, it reduces transmission heat loss under cold weather conditions, thus offsetting the heating energy needs.
Moreover, the location of the building, weather data, the efficiency of the installed renewable systems have a significant impact on the potential to achieve plus energy balance. The efficiency of the renewable systems is influenced by several parameters, such as the mass flow rate and the number of thermal collectors. Indeed, the water draw profile, collector type, and tank size are also influencing factors, which can be considered for the investigation in future studies.
Building compactness is another parameter to consider because it determines the available area to install renewable systems. For instance, more PV arrays can be installed in the considered case study, and the excess energy can be exported to the grid or nearby buildings. However, this leads to extra investment capital cost, thus cost analysis is required to study the feasibility of such an option.
In this study, the potential to achieve plus energy building within the Lebanese context was investigated. First, the study presented a literature review on studies performed within similar climatic conditions to identify the used metrics of balance, period of balance, type of balance, type of energy use included in the final balance, and the renewable supply options. Then, the adopted approach to perform the investigations was described. For the analysis, a single-family house with a total conditioned area of about 133 m2 representing the Lebanese construction market and dynamic performance simulations using TRNSYS was adopted.
Heating and cooling systems are assumed to be active all the time for the two floors, and an electric domestic hot water tank of 200 L is used. Numerical simulations indicated that the total annual energy needs of the conventional building were 87.1 kWh/y.m2. The cooling system accounted for 47% of the total energy use, followed by DHW (23%), electrical appliances and lighting system (22.4%), and heating system (7.6%).
Converting the conventional building into PEB passed through three phases:
(1) Improving building envelope and installing energy efficient technologies to reduce heating, cooling, and electrical loads. The total annual energy needs of the building after this phase were estimated at 43.38 kWh/y.m2. About 49% of energy savings were achieved.
(2) Adding an SDHW system to supply 200L DHW tank. Parametric simulations with TRNSYS have been undertaken with a different number of solar collectors connected in series, and different mass flow rates to optimize the design parameters. Two solar collectors (each of 2.494 m2) connected in series with mass flow rate 20 kg/hr.m2 were selected for SDHW. The obtained results indicated that the total annual energy needs of the auxiliary heater and circulation pump are 270 kWh resulting in about 90% energy saving in DHW production.
(3) Adding a grid connected PV array system for electric power generation. The TRNSYS simulation results for the Beirut climate show that each photovoltaic module (250 WP, 1.64 m2) produces 370 kWh annually. The designed PV array system proposed for our simulation is composed of 2 strings with 5 modules connected in series in each string. The total output of the PV system from the inverter to the load/grid is about 3695 kWh. As a result, 320 kWh are the annual excess energy is generated by the PV array system.
The obtained results indicated that achieving plus energy building within the Lebanese climatic conditions is theoretically achievable after improving the building envelope, using energy efficient technologies, and installing SDHW and PV systems.
The main limitations of the present study are that the dynamic simulation model is not validated due to the lack of relevant monitoring data. The sensitivity analysis was conducted by varying one parameter at a time and keeping the other parameters constant, which ignores the interactions between parameters. In addition, economic and environmental analysis are not considered in the investigations. Future works will be oriented towards overcoming these limitations by conducting a more comprehensive study.
1https://www.cultural-e.eu/project-description/.
Acknowledgement: The authors would like to express their gratitude to EPF school of Engineering and the Lebanese University for supporting this work by providing the necessary materials.
Funding Statement: The authors received no specific funding for this study.
Conflicts of Interest: The authors declare that they have no conflicts of interest to report regarding the present study.
References
1. Amirifard, F., Sharif, S. A., Nasiri, F. (2019). Application of passive measures for energy conservation in buildings–A review. Advances in Building Energy Research, 13(2), 282–315. DOI 10.1080/17512549.2018.1488617. [Google Scholar] [CrossRef]
2. Hawila, A. A. W., Merabtine, A. (2021). A Statistical-based optimization method to integrate thermal comfort in the design of low energy consumption building. Journal of Building Engineering, 33(1), 101661. DOI 10.1016/j.jobe.2020.101661. [Google Scholar] [CrossRef]
3. European Parliament (2010). Directive 2010/31/EU of the european parliament and of council of 19 May 2010 on the energy performance of buildings (Recast). Official Journal of the European Union, 153, 13–35. [Google Scholar]
4. Ibrahim, O., Fardoun, F., Younes, R., Louahlia-Gualous, H. (2013). Energy status in Lebanon and electricity generation reform plan based on cost and pollution optimization. Renewable and Sustainable Energy Reviews, 20(4), 255–78. DOI 10.1016/j.rser.2012.11.014. [Google Scholar] [CrossRef]
5. Hawila, A. A. W., Pernetti, R., Pozza, C., Belleri, A. (2022). Plus energy building: Operational definition and assessment. Energy and Buildings, 256, 112069. DOI 10.1016/j.enbuild.2022.112069. [Google Scholar] [CrossRef]
6. Ferrante, A., Cascella, M. T. (2011). Zero energy balance and zero on-site CO2 emission housing development in the Mediterranean climate. Energy and Buildings, 43(8), 2002–10. DOI 10.1016/j.enbuild.2011.04.008. [Google Scholar] [CrossRef]
7. Deng, S., Dalibard, A., Martin, M., Dai, Y. J., Eicker, U. et al. (2011). Energy supply concepts for zero energy residential buildings in humid and dry climate. Energy Conversion and Management, 52(6), 2455–60. DOI 10.1016/j.enconman.2010.12.054. [Google Scholar] [CrossRef]
8. Cellura, M., Guarino, F., Longo, S., Mistretta, M., (2015). Different energy balances for the redesign of nearly net zero energy buildings: An Italian case study. Renewable and Sustainable Energy Reviews, 45(5), 100–112. DOI 10.1016/j.rser.2015.01.048. [Google Scholar] [CrossRef]
9. Reda, F., Tuominen, P., Hedman, A., Ibrahim, M. G. E. (2015). Low-energy residential buildings in New Borg El Arab: Simulation and survey based energy assessment. Energy and Buildings, 93(4), 65–82. DOI 10.1016/j.enbuild.2015.02.021. [Google Scholar] [CrossRef]
10. Serghides, D. K., Dimitriou, S., Katafygiotou, M. C., Michaelidou, M. (2015). Energy efficient refurbishment towards nearly zero energy houses, for the Mediterranean region. Energy Procedia, 83(12), 533–543. DOI 10.1016/j.egypro.2015.12.173. [Google Scholar] [CrossRef]
11. Becchio, C., Dabbene, P., Fabrizio, E., Monetti, V., Filippi, M. (2015). Cost optimality assessment of a single family house: Building and technical systems solutions for the NZEB target. Energy and Buildings, 90(3), 173–187. DOI 10.1016/j.enbuild.2014.12.050. [Google Scholar] [CrossRef]
12. Recht, T., Schalbart, P., Peuportier, B. (2016). Eco design of a ‘plus-energy’ house using stochastic occupancy model,Life-cycle assessment and multi-objective optimisation. Building Simulation and Optimisation, Third International Building Performance Simulation Association, England, UK. [Google Scholar]
13. Cellura, M., Ciulla, G., Guarino, F., Longo, S. (2017). Redesign of a rural building in a heritage site in Italy: Towards the Net zero energy target. Buildings, 7(4), 68. DOI 10.3390/buildings7030068. [Google Scholar] [CrossRef]
14. Causone, F., Pietrobon, M., Pagliano, L., Erba, S. (2017). A high performance home in the Mediterranean climate: From the design principle to actual measurements. Energy Procedia, 140(12), 67–79. DOI 10.1016/j.egypro.2017.11.124. [Google Scholar] [CrossRef]
15. AbuGrain, M., Alibaba, H. (2017). Optimizing existing multistory building designs towards net-zero energy. Sustainability, 9(3), 399. DOI 10.3390/su9030399. [Google Scholar] [CrossRef]
16. Carpino, C., Bruno, R., Arcuri, N. (2018). Social housing refurbishment in Mediterranean climate: Cost-optimal analysis towards the n-ZEB target. Energy and Buildings, 174(9), 642–56. DOI 10.1016/j.enbuild.2018.06.052. [Google Scholar] [CrossRef]
17. Rey-Hernández, J. M., Velasco-Gómez, E., San José-Alonso, J. F., Tejero-González, A., Rey-Martínez, F. J. (2018). Energy analysis at a near Zero Energy building. A case-study in Spain. Energies, 11(4), 857. DOI 10.3390/en11040857. [Google Scholar] [CrossRef]
18. Causone, F., Tatti, A., Pietrobon, M., Zanghirella, F., Pagliano, L. (2019). Yearly operational performance of a NZEB in the Mediterranean climate. Energy and Buildings, 198(9), 243–60. DOI 10.1016/j.enbuild.2019.05.062. [Google Scholar] [CrossRef]
19. Kolokotsa, D., Vagias, V., Fytraki, L., Oungrinis, K. (2019). Energy analysis of zero energy schools: The case study of child’s asylum in Greece. Advances in Building Energy Research, 13(2), 193–204. DOI 10.1080/17512549.2018.1488612. [Google Scholar] [CrossRef]
20. Mokhtara, C., Negrou, B., Settou, N., Gouareh, A., Settou, B. (2019). Pathways to plus-energy buildings in Algeria: Design optimization method based on GIS and multi-criteria decision-making. Energy Procedia, 162(4), 171–80. DOI 10.1016/j.egypro.2019.04.019. [Google Scholar] [CrossRef]
21. Magrini, A., Lentini, G., Cuman, S., Bodrato, A., Marenco, L. (2020). From nearly zero energy buildings (NZEB) to positive energy buildings (PEBThe next challenge-the most recent european trends with some notes on the energy analysis of a forerunner PEB example. Developments in the Built Environment, 3(8), 100019. DOI 10.1016/j.dibe.2020.100019. [Google Scholar] [CrossRef]
22. Magrini, A., Lentini, G. (2020). NZEB analyses by means of dynamic simulation and experimental monitoring in Mediterranean climate. Energies, 13(18), 4784. DOI 10.3390/en13184784. [Google Scholar] [CrossRef]
23. Tumminia, G., Guarino, F., Longo, S., Aloisio, D., Cellura, S. et al. (2020). Grid interaction and environmental impact of a net zero energy building. Energy Conversion and Management, 203(1), 112228. DOI 10.1016/j.enconman.2019.112228. [Google Scholar] [CrossRef]
24. Alkhalidi, A., Abuothman, A., AlDweik, A., Al-Bazaz, A. (2021). Is it a possibility to achieve energy plus prefabricated building worldwide? International Journal of Low-Carbon Technologies, 16(1), 220–28. DOI 10.1093/ijlct/ctaa056. [Google Scholar] [CrossRef]
25. Tamm, M., Ortiz, J., Pascual, J., Kurnitski, J., Thalfeldt, M. et al. (2021). Primary energy balance driven integrated energy design process of positive energy building. E3S Web of Conferences, 246(3), 13001. DOI 10.1051/e3sconf/202124613001. [Google Scholar] [CrossRef]
26. Bruno, R., Bevilacqua, P., Cuconati, T., Arcuri, N. (2019). Energy evaluations of an innovative multi-storey wooden near Zero Energy Building designed for Mediterranean areas. Applied Energy, 238(3), 929–941. DOI 10.1016/j.apenergy.2018.12.035. [Google Scholar] [CrossRef]
27. Marino, C., Nucara, A., Panzera, M. F., Pietrafesa, M. (2019). Towards the nearly zero and the plus energy building: Primary energy balances and economic evaluations. Thermal Science and Engineering Progress, 13, 100400. DOI 10.1016/j.tsep.2019.100400. [Google Scholar] [CrossRef]
28. Pallis, P., Gkonis, N., Varvagiannis, E., Braimakis, K., Karellas, S. et al. (2019). Towards NZEB in Greece: A comparative study between cost optimality and energy efficiency for newly constructed residential buildings. Energy and Buildings, 198(9), 115–37. DOI 10.1016/j.enbuild.2019.06.005. [Google Scholar] [CrossRef]
29. Pallis, P., Gkonis, N., Varvagiannis, E., Braimakis, K., Karellas, S. et al. (2019). Cost effectiveness assessment and beyond: A study on energy efficiency interventions in Greek residential building stock. Energy and Buildings, 182(1), 1–18. DOI 10.1016/j.enbuild.2018.10.024. [Google Scholar] [CrossRef]
30. de Luca, G., Ballarini, I., Lorenzati, A., Corrado, V. (2020). Renovation of a social house into a NZEB: Use of renewable energy sources and economic implications. Renewable Energy, 159, 356–370. DOI 10.1016/j.renene.2020.05.170. [Google Scholar] [CrossRef]
31. Assimakopoulos, M. N., de Masi, R. F., Fotopoulou, A., Papadaki, D., Ruggiero, S. et al. (2020). Holistic approach for energy retrofit with volumetric Add-ons toward NZEB target: Case study of a dormitory in Athens. Energy and Buildings, 207(1), 109630. DOI 10.1016/j.enbuild.2019.109630. [Google Scholar] [CrossRef]
32. Thiers, S., Peuportier, B. (2012). Energy and environmental assessment of two high energy performance residential buildings. Building and Environment, 51, 276–84. DOI 10.1016/j.buildenv.2011.11.018. [Google Scholar] [CrossRef]
33. Kolokotsa, D., Rovas, D., Kosmatopoulos, E., Kalaitzakis, K. (2011). A roadmap towards intelligent net zero- and positive-energy buildings. Solar Energy, 85(12), 3067–3084. DOI 10.1016/j.solener.2010.09.001. [Google Scholar] [CrossRef]
34. Wronowski, M. (2013). Conceptual design of plus energy single family house in Warsaw, Poland. REHVA Journal, 58–62. [Google Scholar]
35. Bojić, M., Nikolić, N., Nikolić, D., Skerlić, J., Miletić, I. (2011). Toward a positive-net-energy residential building in Serbian conditions. Applied Energy, 8(7), 2407–2419. DOI 10.1016/j.apenergy.2011.01.011. [Google Scholar] [CrossRef]
36. Ala-Juusela, M., Rehman, H. U., Hukkalainen, M., Reda, F. (2021). Positive energy building definition with the framework, elements and challenges of the concept. Energies, 14(19), 6260. DOI: 10.3390/en14196260. [Google Scholar] [CrossRef]
37. David, A., Leeb, M., Bednar, T. (2017). Comparison of the planned and the real energy consumption of the world’s first (plus-) plus-energy office high-rise building. Energy Procedia, 132(10), 543–548. DOI 10.1016/j.egypro.2017.09.726. [Google Scholar] [CrossRef]
38. Dokka, T. H., Myrup, M., Solsem, M. (2019). Lia kindergarten–A plus energy building: First year experience with regard to energy use. IOP Conference Series: Earth and Environmental Science, 352(10), 012061. DOI 10.1088/1755-1315/352/1/012061. [Google Scholar] [CrossRef]
39. Torcellini, P., Pless, S., Deru, M., Crawley, D. (2006). Zero energy buildings: A critical look at the definition. Golden, CO: National Renewable Energy Laboratory. [Google Scholar]
40. Molin, A., Rohdin, P., Moshfegh, B. (2011). Investigation of energy performance of newly built low-energy buildings in Sweden. Energy and Buildings, 43(10), 2822–31. DOI 10.1016/j.enbuild.2011.06.041. [Google Scholar] [CrossRef]
41. Carrilho da Graça, G., Augusto, A., Lerer, M. M. (2012). Solar powered net zero energy houses for Southern Europe: Feasibility study. Solar Energy, 86(1), 634–646. DOI 10.1016/j.solener.2011.11.008. [Google Scholar] [CrossRef]
42. Houri, A., Salloum, H., Ali, A., Abdel Razik, A., Houri, L. (2009). Assessment of energy and financial performance of a solar hot water system in a single family dwelling: Case study from marjeyoun–South Lebanon. https://laur.lau.edu.lb:8443/xmlui/bitstream/handle/10725/6904/Assessment.pdf?sequence=1. [Google Scholar]
43. Comair, F. G., Mourtada, A., Chehab, S., Matar, T., Sebrini, C. (2011). Thermal insulation market in Lebanon. Beirut, Lebanon: Lebanese Association for the Mastery of Energy and the Environment. [Google Scholar]
44. Duffie, J. A., Beckman, W. A. (2013). Solar engineering of thermal processes, Fourth edition. Hoboken, NJ, USA: John Wiley & Sons, Inc. DOI 10.1002/9781118671603. [Google Scholar] [CrossRef]
 | This work is licensed under a Creative Commons Attribution 4.0 International License, which permits unrestricted use, distribution, and reproduction in any medium, provided the original work is properly cited. |