DOI:10.32604/iasc.2020.012069
| Intelligent Automation & Soft Computing DOI:10.32604/iasc.2020.012069 | |
| Article |
Canny Edge Detection Model in MRI Image Segmentation Using Optimized Parameter Tuning Method
1Anna University, Chennai, 600025, India
2Department of Electronics and Communication Engineering, C. Abdul Hakeem College of Engineering and Technology, Melvisharam, 632509, India
3Department of Electronics and Communication Engineering, Excel Engineering College, Komaraplayam, 637303, India
*Corresponding Author: Meera Radhakrishnan. Email: rathameera4041993@gmail.com
Received: 13 June 2020; Accepted: 24 July 2020
Abstract: Image segmentation is a crucial stage in the investigation of medical images and is predominantly implemented in various medical applications. In the case of investigating MRI brain images, the image segmentation is mainly employed to measure and visualize the anatomic structure of the brain that underwent modifications to delineate the regions. At present, distinct segmentation approaches with various degrees of accurateness and complexities are available. But, it needs tuning of various parameters to obtain optimal results. The tuning of parameters can be considered as an optimization issue using a similarity function in solution space. This paper presents a new Parametric Segmentation Tuning of Canny Edge Detection (PST-CED) model. It is based on the comparison of consecutive segmentation outcomes and the selection of one that yields maximum similarity. Besides, this paper employs an effective pre-processing technique at an earlier stage, i.e., before segmentation to improve the image quality. Here, a hybrid contrast stretching approach was employed depending upon the Top-hat filter and Gaussian function. The PST-CED technique was tested with benchmark MRI images and a detailed comparative analysis was conducted with state-of-the-art methods interms of Peak Signal to Noise Ratio (PSNR), detection accuracy, execution time and Mean Square Error (MSE).
Keywords: Parameter tuning; image segmentation; canny edge detection; contrast stretching
Brain Tumour (BT) signifies a group of anomalous tissues that multiplies without any control. Two kinds of brain tumour exist such as benign and malignant. The benign type has minimum tumours and it is mostly isolated from other brain cells, due to which it does not spread to other portions of the brain. Further, it is easy to be treated by surgical procedures thus eliminating the tumour cells. Malignant BT is acute and cannot be removed easily from nearby cells of the brain. As such, the removal of the affected cells from the brain without any associated risk is a complex operation. In recent years, it is found that the HHH people are highly prone to malignant BT. Based on the survey conducted by the American Cancer Society [1,2] in the US for 2017, it was inferred that the number of cases increased up by 30, from 23,770 in 2016 to 23,800. Further, a total of 16,700 calculated deaths is a maximum in comparison with other death cases of 2016 (16,050).
Magnetic Resonance Imaging (MRI) is a non-invasive technique that is generally used in the medical unit; often, it produces the images of the brain with a high spatial dimension as well as maximum contrast among delicate cells. MRI offers better details with regards to size, structure, and location of tumours for proper analysis and further treatment [3,4]. Most of the hospitals and research institutes leverage MRI images for accurate diagnosis and treatment. Different types of MRI sequences are established and are known to be weighted images, like Fluid-Attenuated Inversion Recovery (FLAIR), Proton-Density Weighted, T1-weighted, and T2-weighted. The T1-weighted image helps in obtaining an extended segmentation for brain cells because of the maximum contrast among gray and white matter [5]. Meanwhile, T1-weighted contrast improved images, as well as FLAIR, are commonly utilized for BT diagnosis, since they strongly show the affected area.
MRI depends on a multi-parameter image model that constructs different image parameters and carries more data. Fig. 1 shows the images of the brain, MRI with tumours, and the images that were obtained from four modalities: T1, T1c, T2, and FLAIR. FLAIR modalities are generally employed in the identification of expanded tumours and edemas. The most accurate portioning of BT obtained from MRI reveals an important and promising event in the diagnosis and preparation processes for further treatment. Image segmentation is an attentive action in the medical imaging process that contains a filtering process from one or more areas, which altogether forms the targeted interest. Different types of techniques have been designed in the survey to diagnose the disease integrated with threshold-based methods [6,7], region-based methods, deformable methods, classification methods, and deep learning. BT segmentation is a process of filtering the tumour area from an unaffected region which could be easily detected. Therefore accurate and efficient segmentation of tumours has been always a challenging operation due to their different sizes and locations.
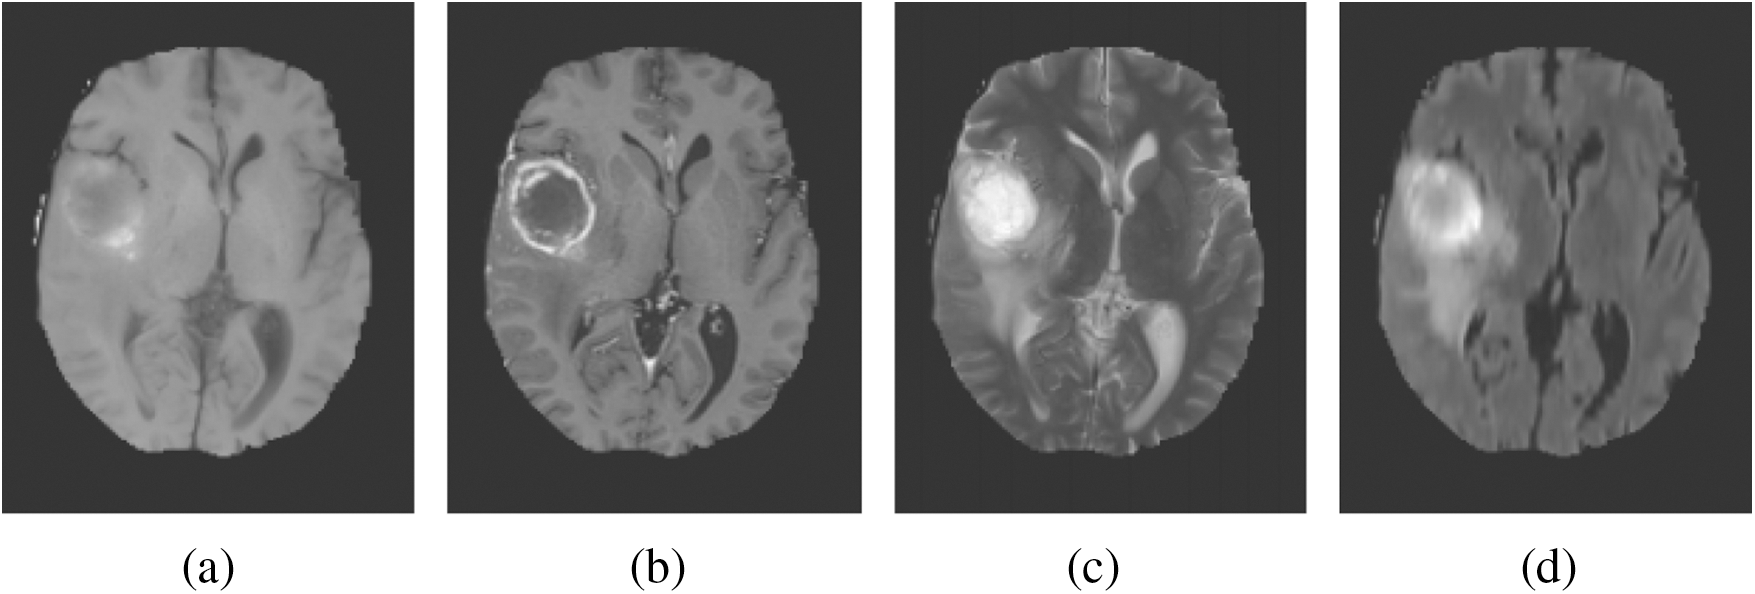
Figure 1: Sample BT images. (a) T1. (b) T1c. (c) T2. (d) FLAIR
Many studies have been conducted in medical imaging, especially in MRI imaging techniques. They are classified as the region-growing method, classifier method, clustering method, and Meta-heuristics method. Image segmentation is the most crucial stage used in the healthcare sector, whereas there are various other segmentation models developed by researchers. The study conducted in the past [8] projected the BT portioning model using K means clustering and fuzzy C means techniques. K-means method is more adaptable and an easy approach to treat tumors. The tumor area can be easily estimated by K-means, consuming less implementation time, whereas in the case of a chronic tumor, it is not suitable for producing better results. The proposed model utilized KIFCM to resolve the problem of the long iteration process and to enhance the segmentation accuracy. The authors [9] presented an approach that applies a color conversion technique with K-means clustering for identifying the lesion size accurately. It is used to transform the gray image to color space image, and as such, it helps the researchers to identify the exact size of the lesion. The research study [10] implemented the BT segmentation model depending on the feature extraction of MRI images. The implemented model obtained an Adaboost algorithm to segment the consistency features. This technique generally assists in assigning the weights of the classification models as well as enhancing the classifier efficiency. Fuzzy C means clustering is also one of the segmentation models applied last year. A technique was proposed by the authors [11] to preserve the number of data obtained from the actual image compared with many other models. A new model was proposed for spatial segmentation and tissue-based partition using a fuzzy C means technique. A model was proposed by the researchers [12] that performed the qualitative comparison of Fuzzy C means and K-means partitioning with the histogram-guided initializing process for different cells of tumor edema complex present in MRI brain images. This study clearly explained that many kinds of techniques use K means and fuzzy C means clustering approaches for segmenting the MRI images of brain tumors. A deep learning model was deployed in the study [13] for the auto brain tumor segmentation process. This study defined different segmentation models such as manual, semi, fully automatic segmentation and their problems. All the denoising techniques were reviewed in the literature [14] for the obtained MRI image which might be influenced by artifacts and noise. This could be eliminated by different methods such as wavelet, curvelet and filters. The performance measure was analyzed in different methods using PSNR.
A model was executed by researchers [15] to identify BT from histopathological specimen for earlier prediction. Due to complex behavior, it is tedious to identify the injury from histopathology specimens. Thus, the Convolutional Neural Network was used in the partition of the wound that was preserved automatically. In the study conducted by the authors [16], a mechanical BT segmentation was proposed with the help of Magnetic Resonance spectroscopy through a pattern recognition process. A combination of discrete wavelet transforms and unsupervised learning models were utilized in eliminating the wavelet features from the MRS signal. Clustering efficiency could be enhanced through the integration of DWT-based entire spectral analysis and unsupervised learning methods. Though distinct segmentation approaches [17,18] with various degrees of accuracies and complexities are available, they need fine-tuning of various parameters for attaining optimal results. In the literature [19], the input image was preprocessed by the Gaussian Kernel function to generate an image pyramid. Then, CNN was applied with different granularities and the feature fusion process was performed. At last, the score map of the feature fusion model was determined. An efficient image segmentation model was proposed in [20] using the multi-objective Particle Swarm Optimization (PSO) clustering technique. It offered a novel similarity computing method and an appropriate cluster count. In the study conducted earlier [21], a set of Two Dense-MobileNet models, Dense1-MobileNet and Dense2-MobileNet were developed for image classification. A new coverless real-time image information hiding model, using image block-matching and dense convolutional network, was developed in [22]. A deeper local search algorithm was developed in [23] for parameterized and approximation techniques for maximum internal spanning tree. The tuning of parameters can be considered as an optimization issue using a similarity function in the solution space. The current research paper presents a new Parametric Segmentation Tuning of Canny Edge Detection (PST-CED) model. It is based on the comparison of consecutive segmentation outcomes and selection of the best providing maximum similarity. Besides, this paper employs an effective pre-processing technique at an earlier stage, i.e., prior to segmentation in order to enhance the image quality. Here, a hybrid contrast stretching approach was employed depending upon the Top-hat filter and Gaussian function. At the beginning, the Top-hat filter was executed on input images and then the contrast enhancement was conducted through the inclusion of Top-hat filter and different Gaussian images. The PST-CED technique was tested with benchmark MRI images and a detailed comparative analysis was conducted with state-of-the-art methods interms of Peak Signal to Noise Ratio (PSNR), detection accuracy, execution time and Mean Square Error (MSE).
The presented PST-CED method involves a series of pre-processing steps to improve the view value of the input images. Then, the PST-CED method is applied onto the enhanced image. Generally, the techniques used to section BT images need various parameters to be set by the user prior to their testing and classification. The segmentation outcome is usually a binary image where the backdrop appears in black and the forefront in white or vice versa. The resultant images, gained with several values, are generally compared among each other or to a ground truth image, i.e., the image formed by an expert. These evaluations are prepared to identify the values that created it, to attain the optimal segmentation. The subsections, pre-processing and the PST_CED working processes are discussed in detail herewith.
Pre-processing is used to develop the visual feature of the input image. It eliminates various troubles similar to clarifying the effects, lighting, and problems caused by the worst contrast. The pre-processing method plays a crucial role in the field of image development since the worst contrast images influence the lesion fragmentation accuracy. In this study, a hybrid contrast stretching process was used on the basis of the Top-hat filter and Gaussian function. Primarily, the Top-hat filter is executed on an input image, and afterward, the lesion contrast is recovered by an additional Top-hat filter image and the variant of the Gaussian image. The development method is defined as follows:
Let  be the actual RGB image with the dimension,
  . The top-hat filter is applied on the original image which improves the affected parts in the applied image as follows:

where,  in Eq. (1) indicates the top-hat filtered image and S is the constructing element, whose first value is 9. The value of Sis heuristically initialized after various iterations. As the contrast of the infected part is based on the value of
  , the choice of
  develops the view quality of the infected part. The maximum value for
  enhances the view contrast of an image. Afterwards, a Gaussian function is implemented in the original image with the following formula:

in Eq. (2),  indicates the original image,
  is the mean of the input image, and
  indicates the scaling value that is evaluated as:

the original image is subtracted from the Gaussian function with the following method:

the highest and lowest valuesare evaluated from  and their outcome is added in the top-hat filtered image to handle the surrounding regions with the next formulas in (5) and (6):


At last, the improved image  is added with the Gaussian image to gain a new improved one. The new images are found to be considerably enhanced. At present, the images can handle brightness and worst contrast related issues. Additionally, the affected parts are extra visible compared to the original image.

The segmentation technique is generally used to section the brain image and needs various parameters to set by the user prior to testing and classification. In segmentation, the outcome is usually a binary image in which the backdrop appears in black and the forefront in white or vice versa. The resultant pictures are gained by several values and are generally evaluated among each other’s or to ground truth images, i.e., authorized pictures. These evaluations arrive at the value which helps it attain optimal segmentation.
The overall process of the CED model is shown in Fig. 2. In the segmentation technique (Canny), by changing a parameter in a series of values, the outcomes move from under-segmented image to over-segmented ones which are transient through a middle value, and the optimal outcome is gained herewith. It can be understood that the modifications among successive under-segmented and over segmented images are highly abrasive when evaluated with images formed nearer the best outcomes. This action is supposed to be the best outcome that seeks to find nearer value to the original image. The under-segmented and over-segmented outcomes communicate to the furthest values from the optimum one. In these outcomes, true edges or regions are removed (under-segmentation) or false ones are created (over-segmentation) while establishing the abrupt alters observed among them. Hence, if two consecutive under-segmented images are compared, the initial one is less segmented than the other one. When an initial image is assumed to be the ground accuracy, the determination has a maximum number of false positives and a minimum number of false negatives. Likewise, when evaluating two consecutive above-segmentation images, the initial one exists in less number of over-segmented values, than the second one. In this study, when the initial images are the ground accuracy, the authors resolve it to have a minimum number of false positives and a maximum number of false negatives. It should be declared that this observation is valid in diatom and brain images where the segmentations are extended to identify the shapes of the organs. Still, there is no validity in images where texture or difficult background is observed. Based on this principle, the following technique for changing parameters is presented.
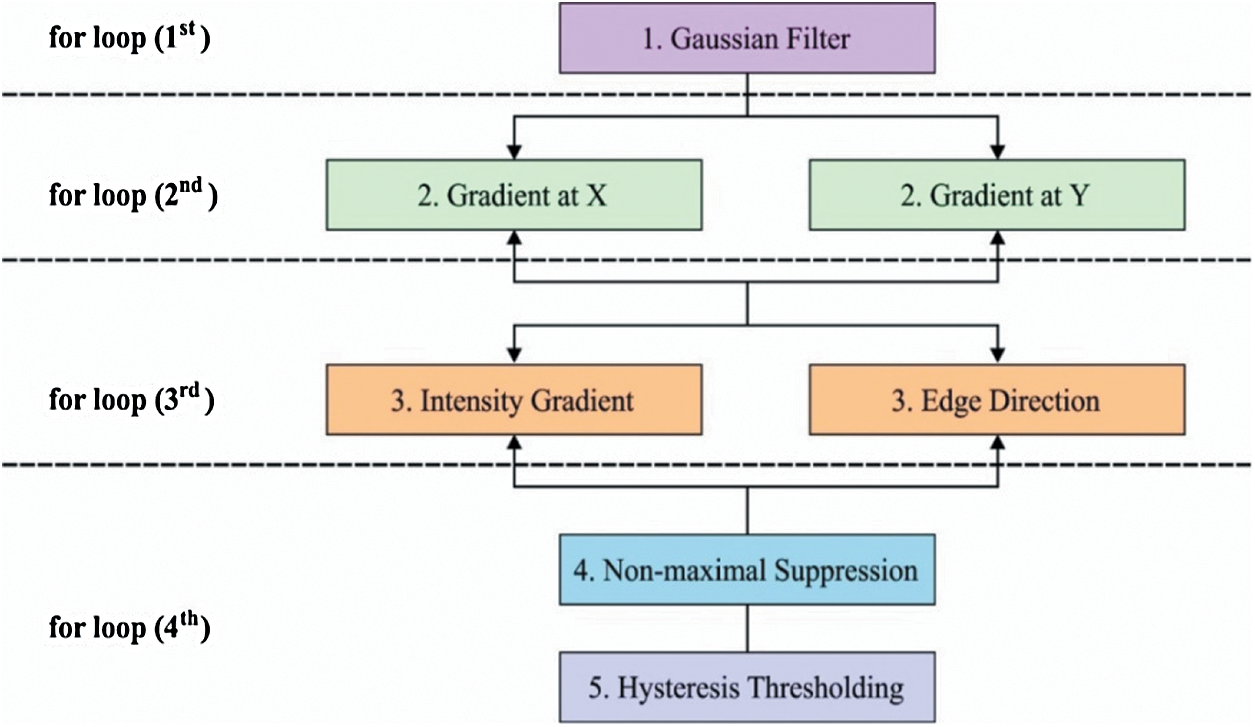
Figure 2: CED process
Let  stand for the conversion of an image,
  addicted denotes the binary one as an outcome of a segmentation algorithm which is specified with a certain number ® of parameters, i.e.,
  . In the binary image, level 1 stands for the object of interest and level
  denotes the background. Consequently, a
  -dimensional resultant space
  , created by the transformation
  , can be illustrated. In solution space, every coordinate is given by a parameter denoting spaces which in turn correspond to binary images. With regards to image segmentation as an optimization method, the optimal solution can be set up by exploiting a comparison function or reducing a distance used as standard function
  in
in  . In this method, the optimal result can be accomplished with sweeping the solution space. However, calculation of the cost function among every pair of the successive binary images varies. Every binary image
  is attained by altering at least one parameter of the segmentation technique
  . After using for the purpose of ease, it can be understood that the number of parameters is identical to one, i.e.,
  . In this case, the method consists of an iterative development that reduces the fault by evaluating two successive segmented images
  and
and  , i.e., while the parameter gets the values
  and
and  .
.
3.2.1 Definition of Segmentation Tuning as An Optimization Problem
To evaluate every a pair of successive image in the space of variables, it is essential to formalize the belongings of the binary image. The additions, various operators, and definitions concern the tuning method. A binary image  of sized
  , where
  and H are the width and height of the image correspondingly, can be signified as a binary vector α of size
Definition 1. Allow the binary group to be represented by  , 1
, 1 , then the
  -dimensional binary space is provided by:

Definition 2. An element α of  is a
is a  produced by
  with
with  . This is:

Definition 3. But  , the complement
  is described as the vector acquired by reversing every factor of α:

Definition 4. If  , the length of α is described as a function
  of the binary
  -dimensional space to the positive integer
 function is described as:

Definition 5. If  , the norm of α is described as a function
  of the binary
  -dimensional space to the positive real number
 Function is defined as
The operations among the elements are identified in the space,  .
.
Definition 6. Let  stand for two elements of the space
  . The dot operation
  is described as:

Definition 7. Difference Operation 
Let  stand for two elements of the space,
  . Various operations are described as a function
  :
:

It gets two binary images of  which compare their elements
  and allocates them a third image
  , using various elements in the following way. If
  an order rule, showing the comparison among the elements α, β is described as:

The following operation is essential to describe the order rules:
• If  , then
  . If
. If  , there is true positives. If
  there is true negatives.
• If  , then
  , i.e.,
  and
and  . So, there is a false negative.
• If , then  (2's complement), i.e.,
  and
and  . Then, there is a false positive.
Definition 8. Matches operation 
Let  are defined elements of the space,
  . The matches operations are described as a function:

It gets two binary images of  and evaluates their elements
  and allocates them a value and expresses in the form of
  . From the matches operation, it can be viewed that:
•  is the number of matches when
•  is the number of matches when
•  is the number of matches when
•  is the number of matches when
If  is a
is a  -dimensional binary space (see Definition 1),
  is a transformation of the image
  in a binary image
  , based on
  , then the transformation
  creates a group of binary images
  based on the basis of every
  in all the space of
  Provided
  and
and  , a similarity function can be described as

here,  evaluates
  with
with  in every space of
  (see Definition 8). If
  is congruent with
  , and
, and  is the segmented optimum image, based on the best parameter, the
  , i.e.,

(subject to  and
and  . The
. The  function is an index related to every pair of successive binary images
  of
of  . From the argument i.e., best of
  , the optimal binary segmented image is found to be
The best values of  parameters of a segmentation technique can be established using the PST method. A similarity indicator is utilized to evaluate binary successive images, i.e.,
 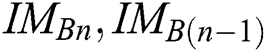 . The corresponding technique works in concentration by adjusting every parameter is in steps, obtaining the segmented images, and evaluating them by pairs to discover the parameters which create the nearby similarity among them. The best similarity function
  , in the space of parameters
 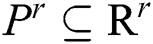 , join at a region of least locals. By this, it can be understood that while infrequent, it is probable to discover above one solution, i.e., canny edge detector, to the segmentation problem. This result is very close and is visually matching. To authorize the PST steps, Canny edge detector is applied. This method is generally used during analytical steps and in recognition of diatoms and the exposure of other brain images. A Canny edge detector is indicated as
  . It utilizes three parameters:
 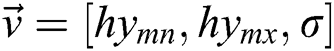 where
where  is the standard deviation of a convolution mask provided by the initial derivate of the Gaussian function. The
  and
and  is the thresholds used in the hysteresis process. The reason to perform this procedure is to decrease the formation of false contours and local highest values created by noise.
To verify the effectiveness of the proposed method, a set of experiments was carried out using the benchmark BRATS 2015 dataset which includes a collection of MRI brain images [18]. The applied dataset includes a set of three distinct subsets of brain MRI images, such as Training, Leader board, and Challenge. Here, training as well as challenge datasets were employed. The first one comprises of a set of twenty (20) High-Grade Tumour (HGT) images and 10 Low-Grade Tumour (LGT) images with ground truth images from different professionals. The MRI images in the training dataset were applied to train the classifier. Besides, the second sub dataset holds a collection of 10 HGT images with their individual ground truth images. A set of two classes of images exist, namely malignant and benign types.
To validate the proposed model, a set of measures, namely MSE, PSNR, detection accuracy, and execution time was determined. Fig. 3 shows the outcome from the pre-processing step. The first and third rows indicate original image, whereas the corresponding contrast-enhanced images are shown in the second and fourth rows. The figure clearly states that the contrast level of the image got significantly increased by the applied model. It will be highly helpful to carry out the segmentation process.
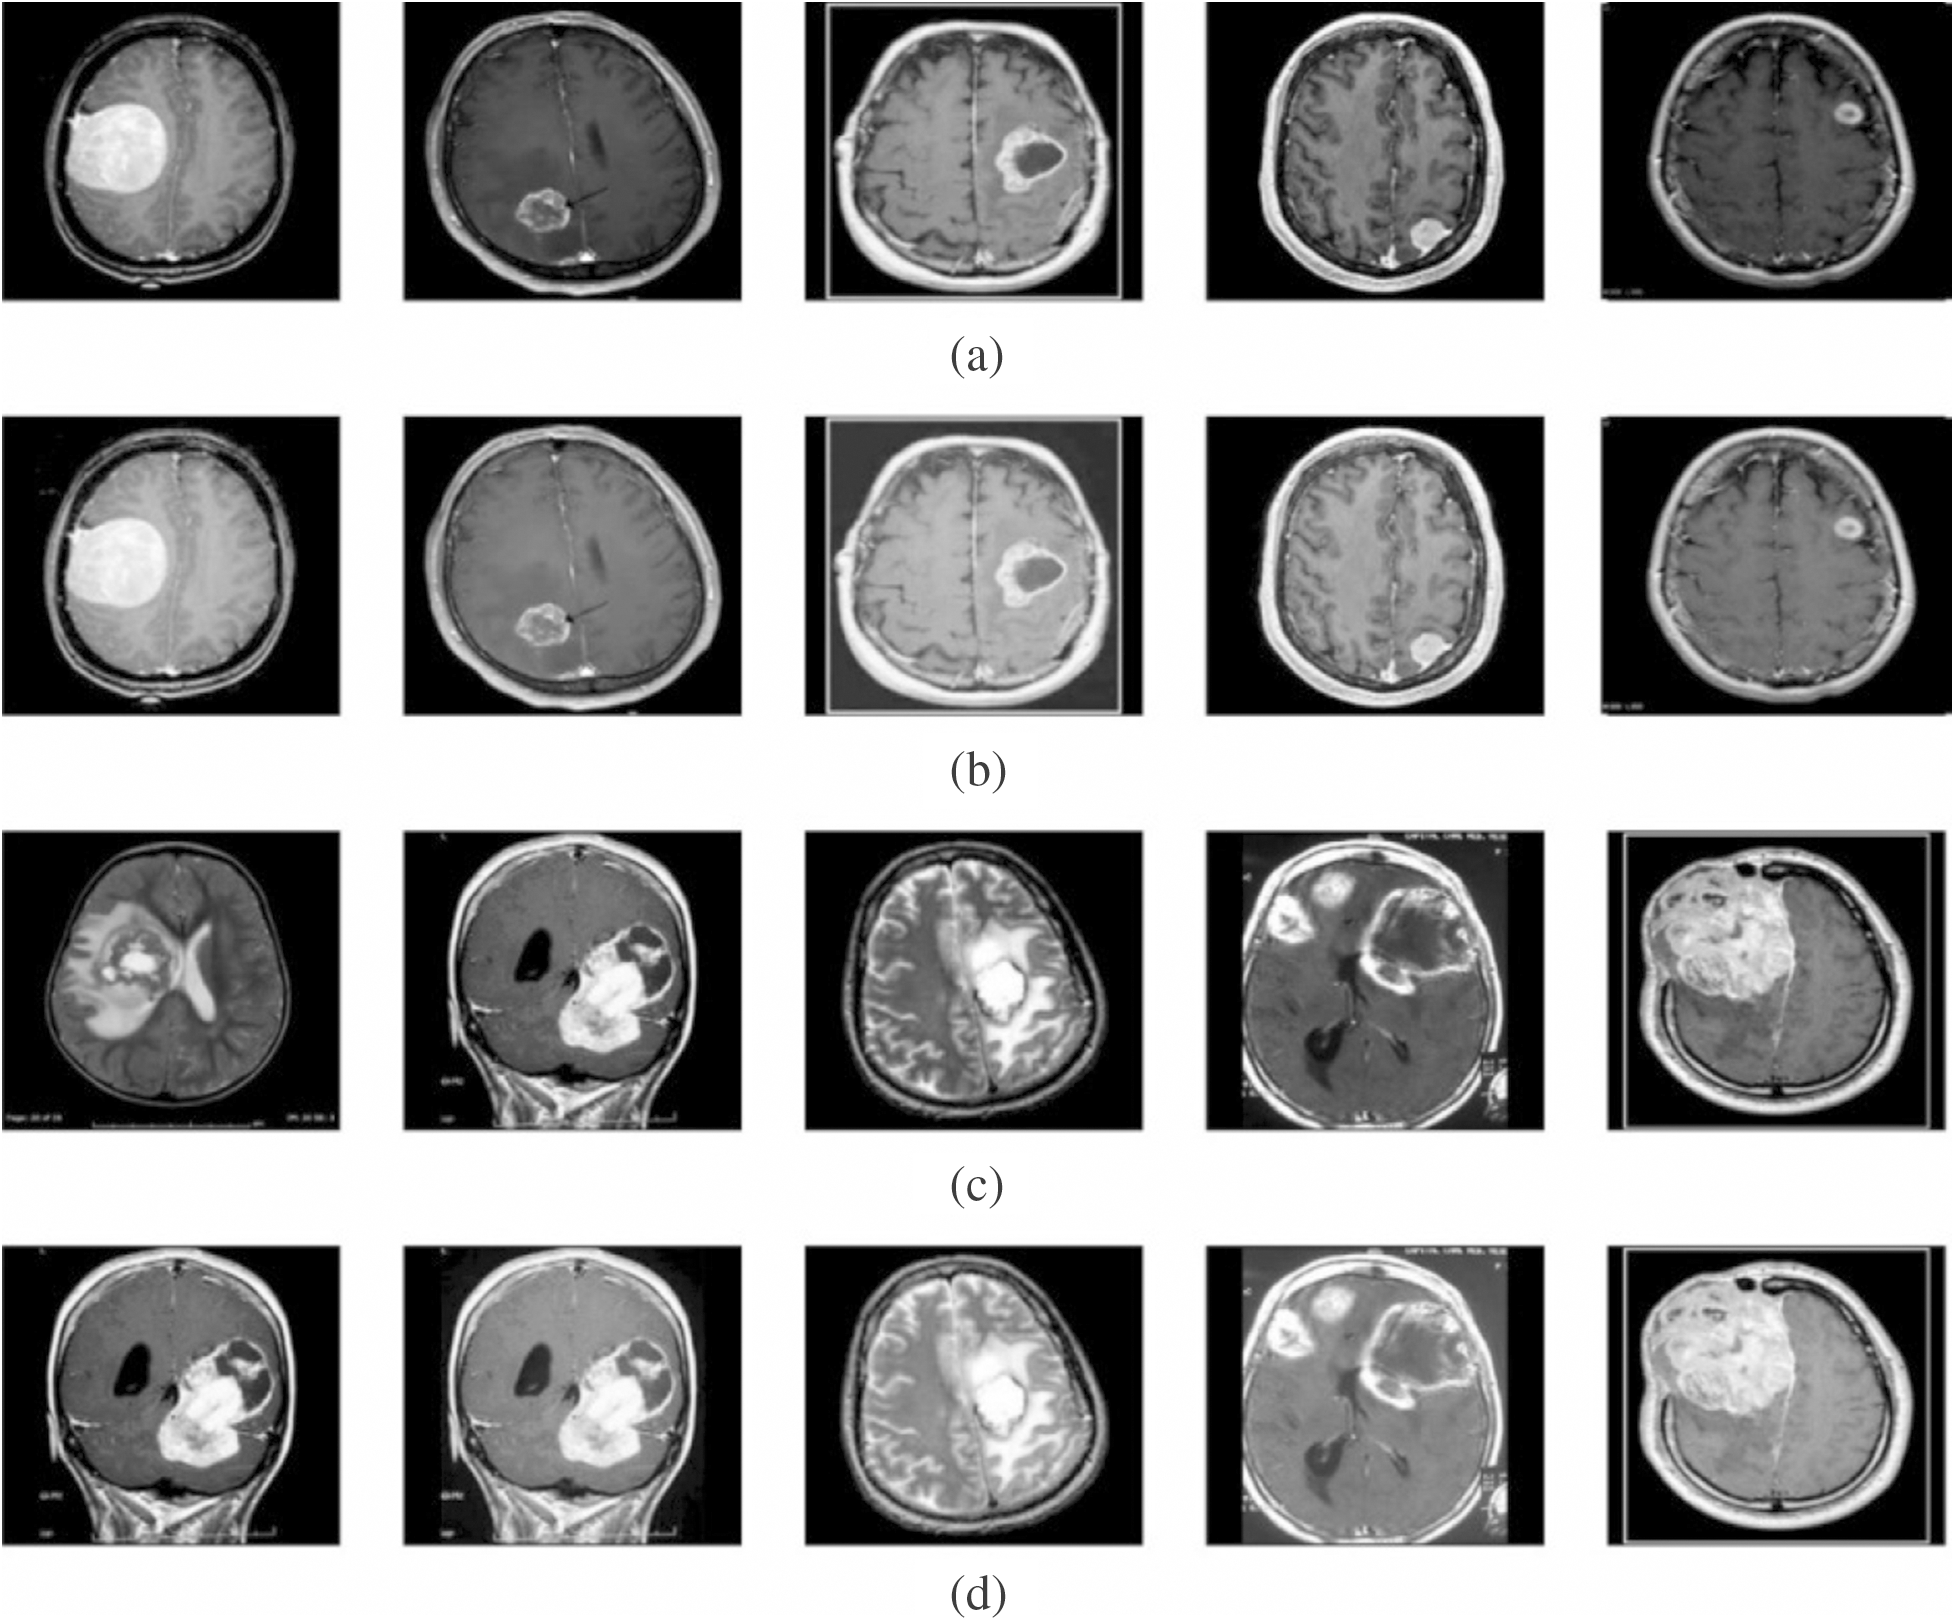
Figure 3: Visualization of pre-processed results. (a) and (c) Original image. (b) and (d) Contrast enhanced image
Next, Fig. 4 shows the resultant images from the segmentation process. The first and third rows indicate the contrast-enhanced images, whereas the corresponding segmented images are provided in the second and fourth rows. The figure clearly states that the images are properly segmented using the presented model.
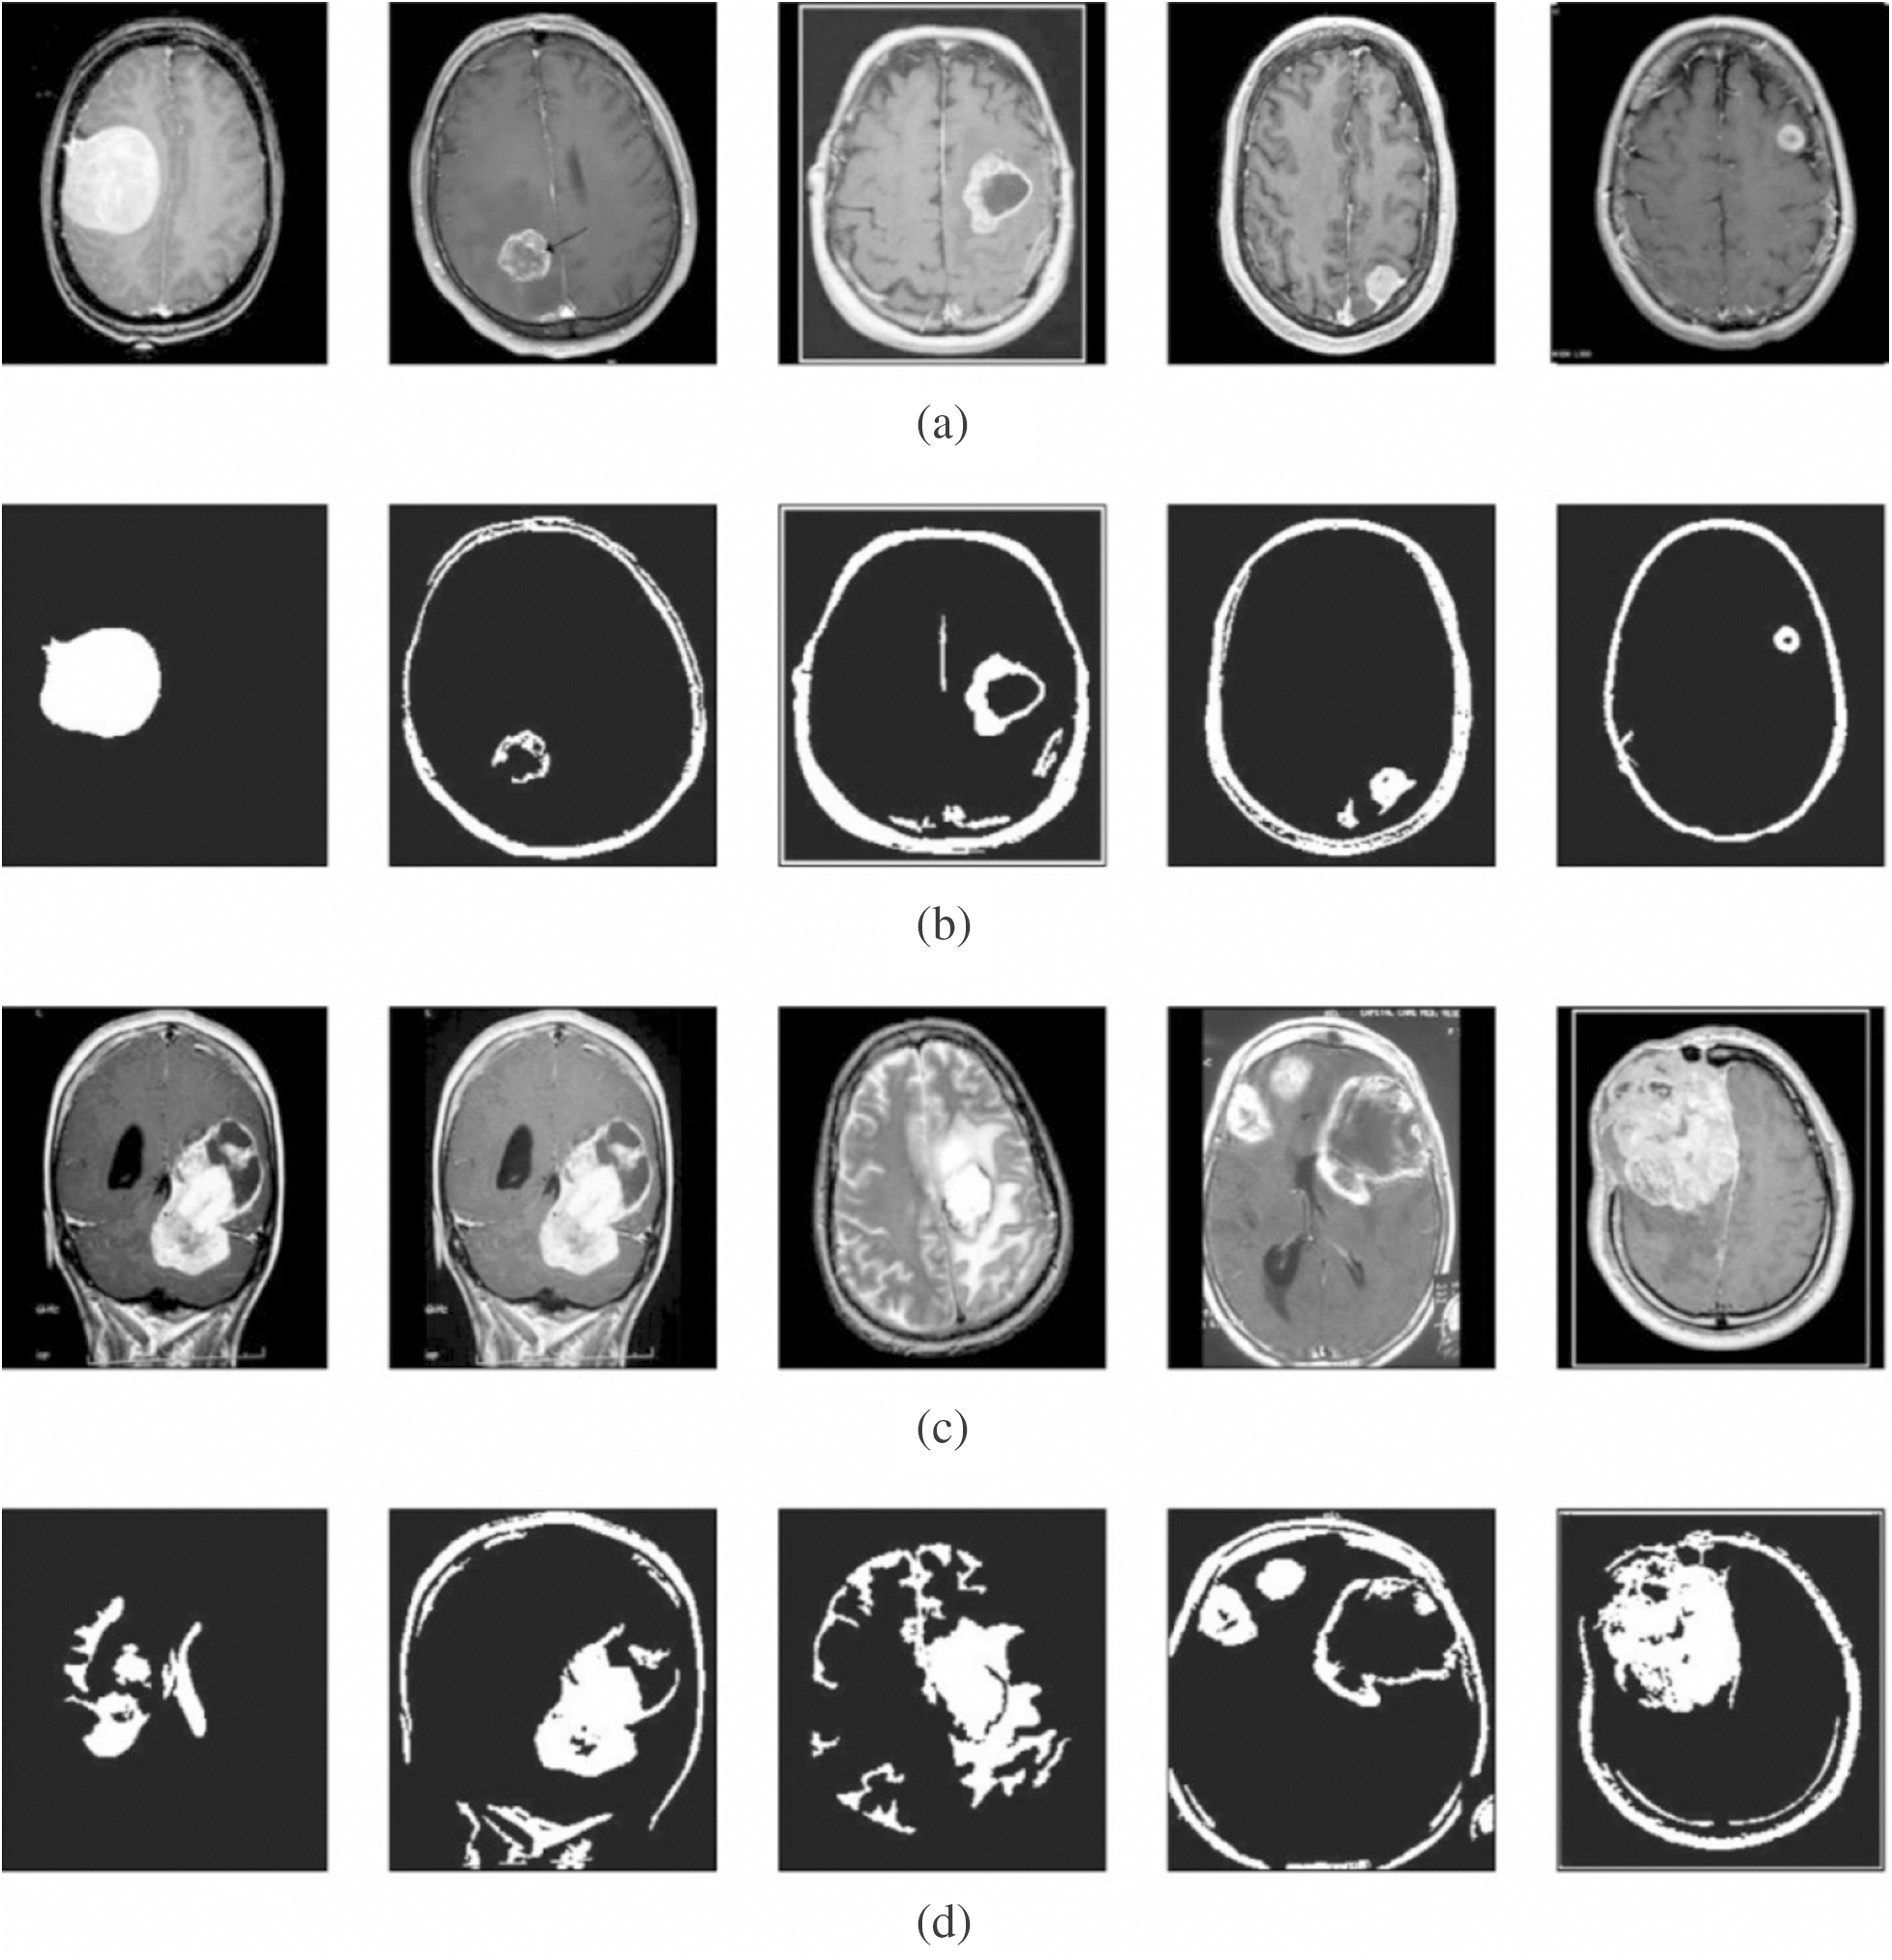
Figure 4: Visualization of segmentation results. (a) and (c) Contrast enhanced image. (b) and (d) Segmented image
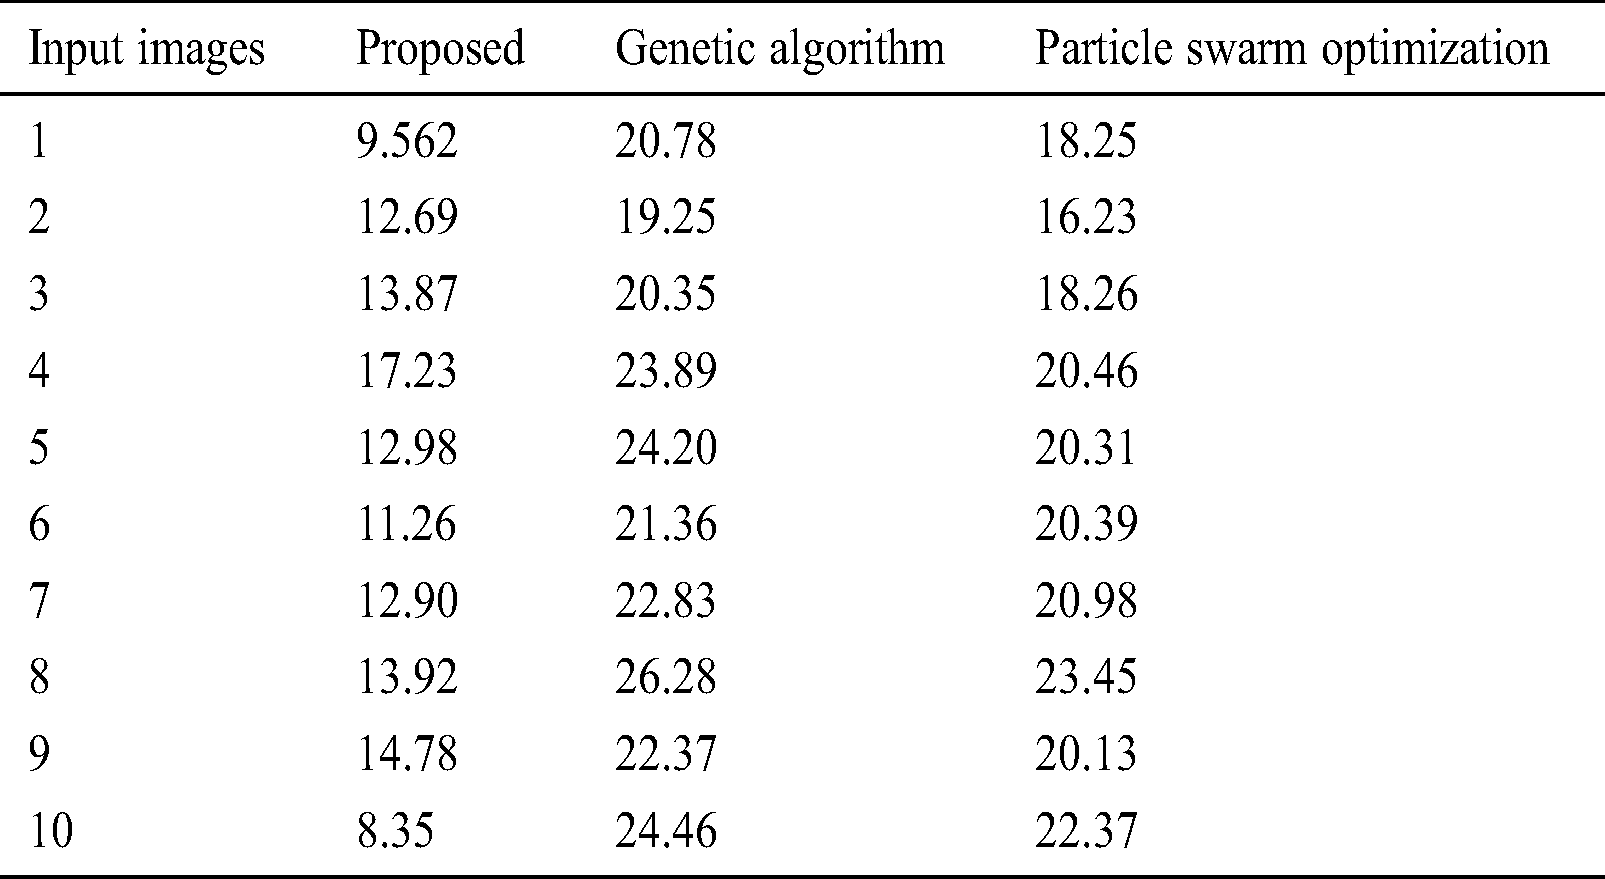
To further ensure the results attained by the presented PST-CED model, a detailed comparative analysis was conducted with GA and PSO algorithms. Tab. 1 and Fig. 5 shows the investigation of the results obtained from the presented and compared models in terms of MSE. The table values exhibit that the PST-CED model attained the least MSE compared to GA and PSO algorithms.
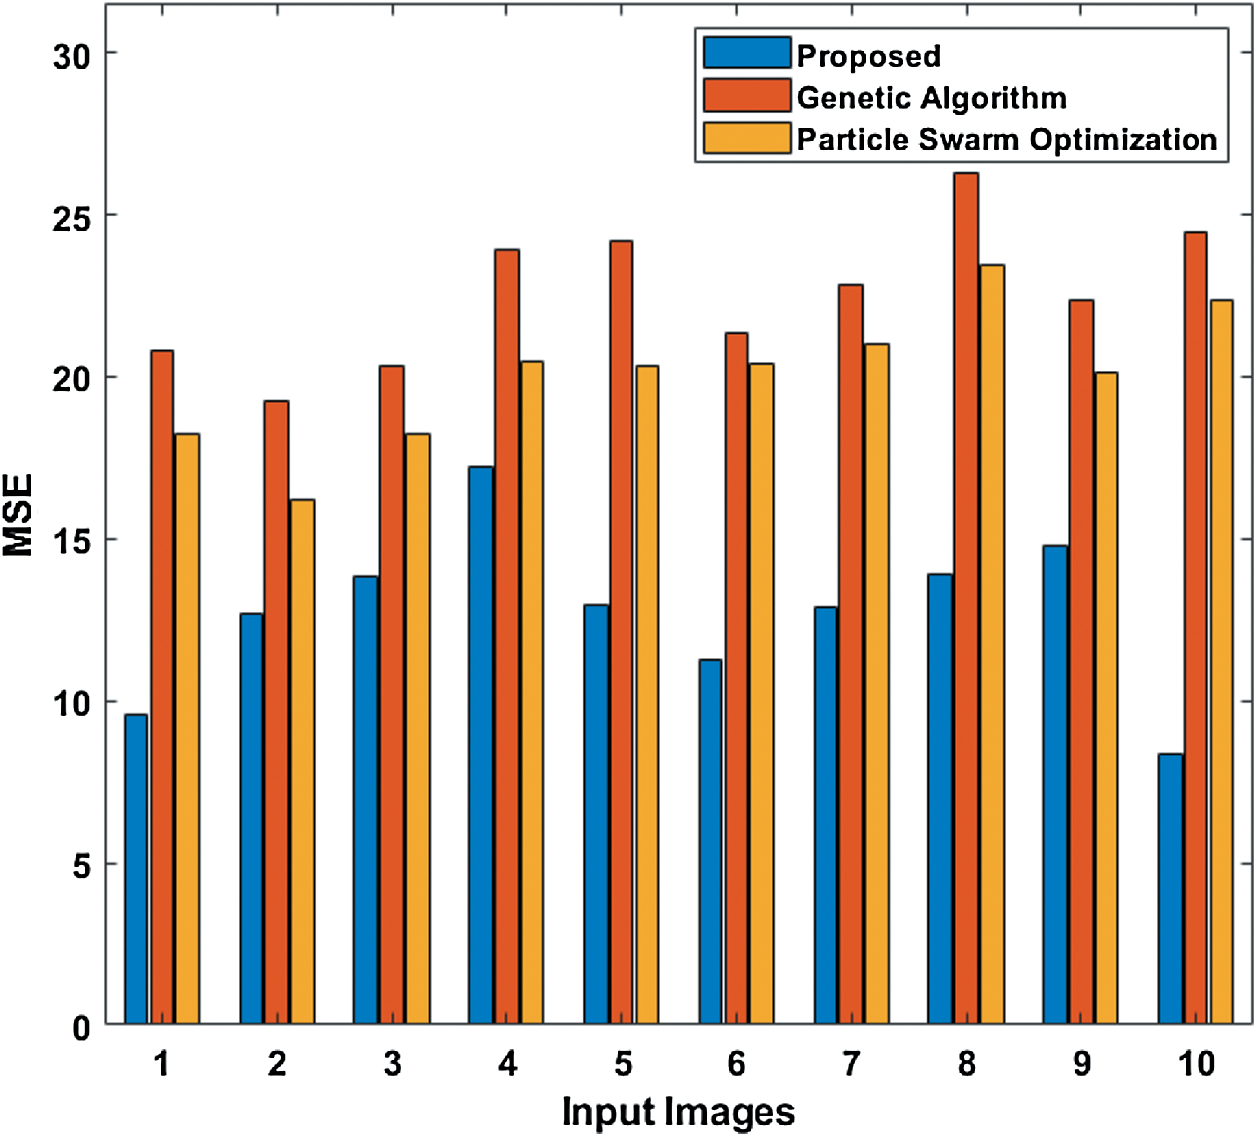
Figure 5: Comparison of various segmentation models in terms of MSE
Table 1: Results of the segmentation analysis in terms of MSE
Tab. 2 and Fig. 6 show the performance attained by the presented and compared models in terms of PSNR. The table value pointed out that the PST-CED model achieved the highest PSNR over GA and PSO algorithms.
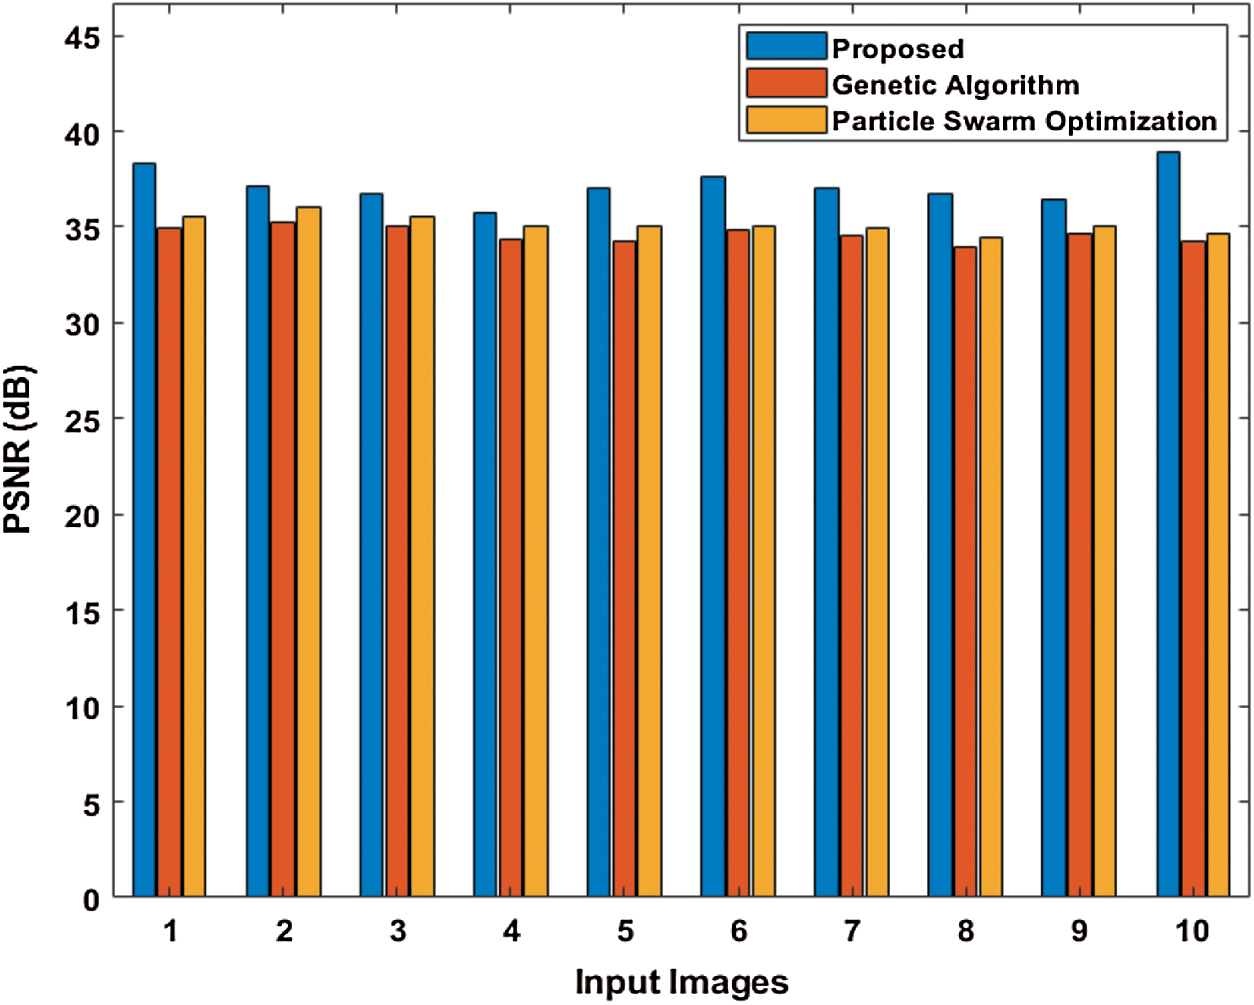
Figure 6: Comparison of various segmentation models in terms of PSNR
Table 2: Results of the segmentation analysis in terms of PSNR

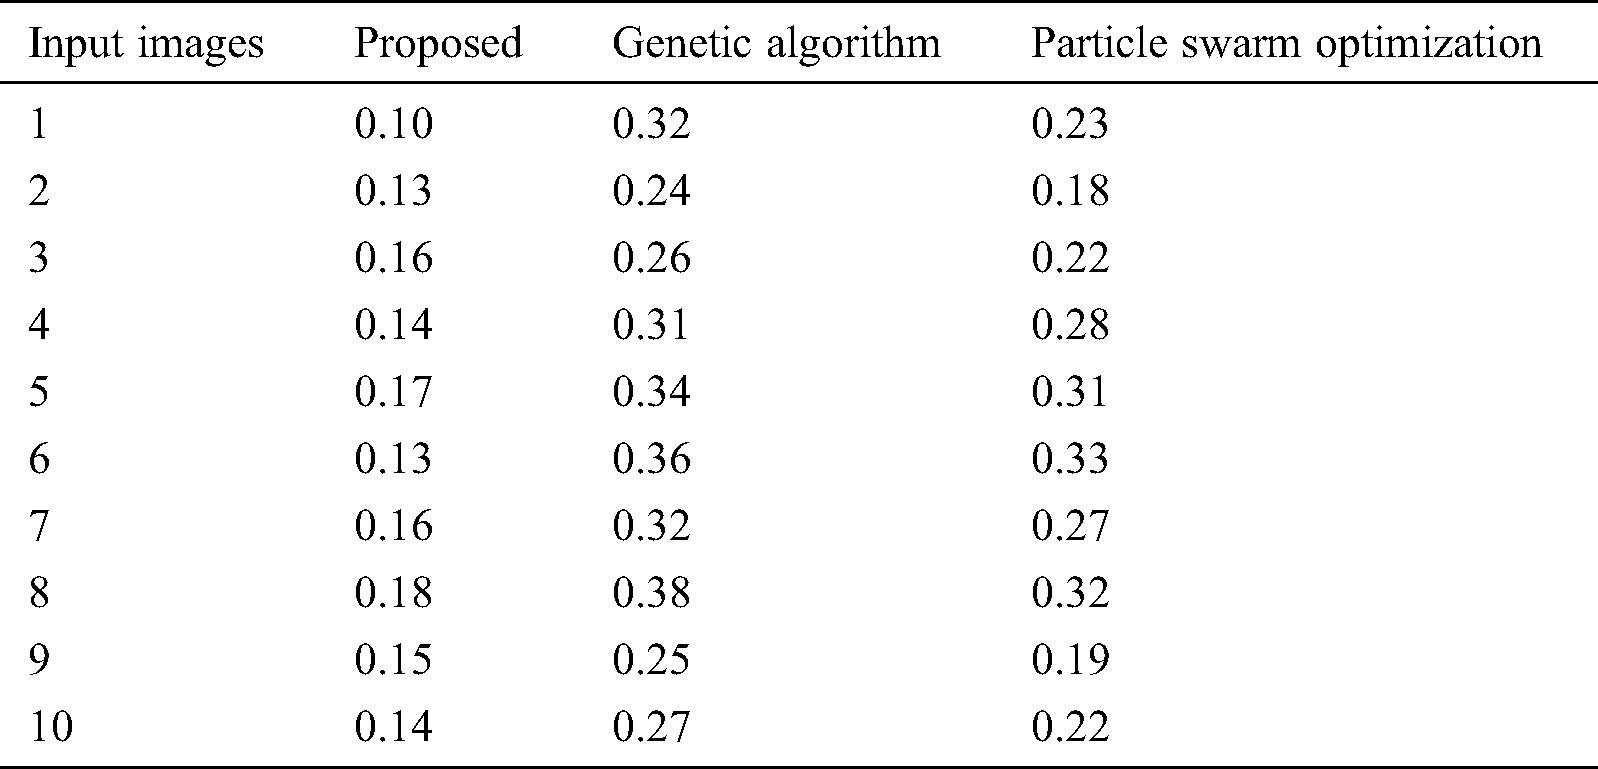
Tab. 3 compares the outcome of diverse models interms of detection accuracy rate (DR). The table values indicate that the PST-CED model attained the highest DR over GA and PSO algorithms. Tab. 3 and Fig. 7 compare the outcome of diverse models interms of CT. The table values indicate that the PST-CED model attained the least CT over GA and PSO algorithms. These values indicate that the minimum CT was achieved by the proposed model with all the applied test input images. Based on the tables and graphs given above, it is evident that the presented PST-CED model offered maximum segmentation outcome with minimum CT, maximum DR, minimum MSE, and maximum PSNR on all the test images applied. Hence, it can be deemed as an appropriate tool for segmenting MRI BT images.
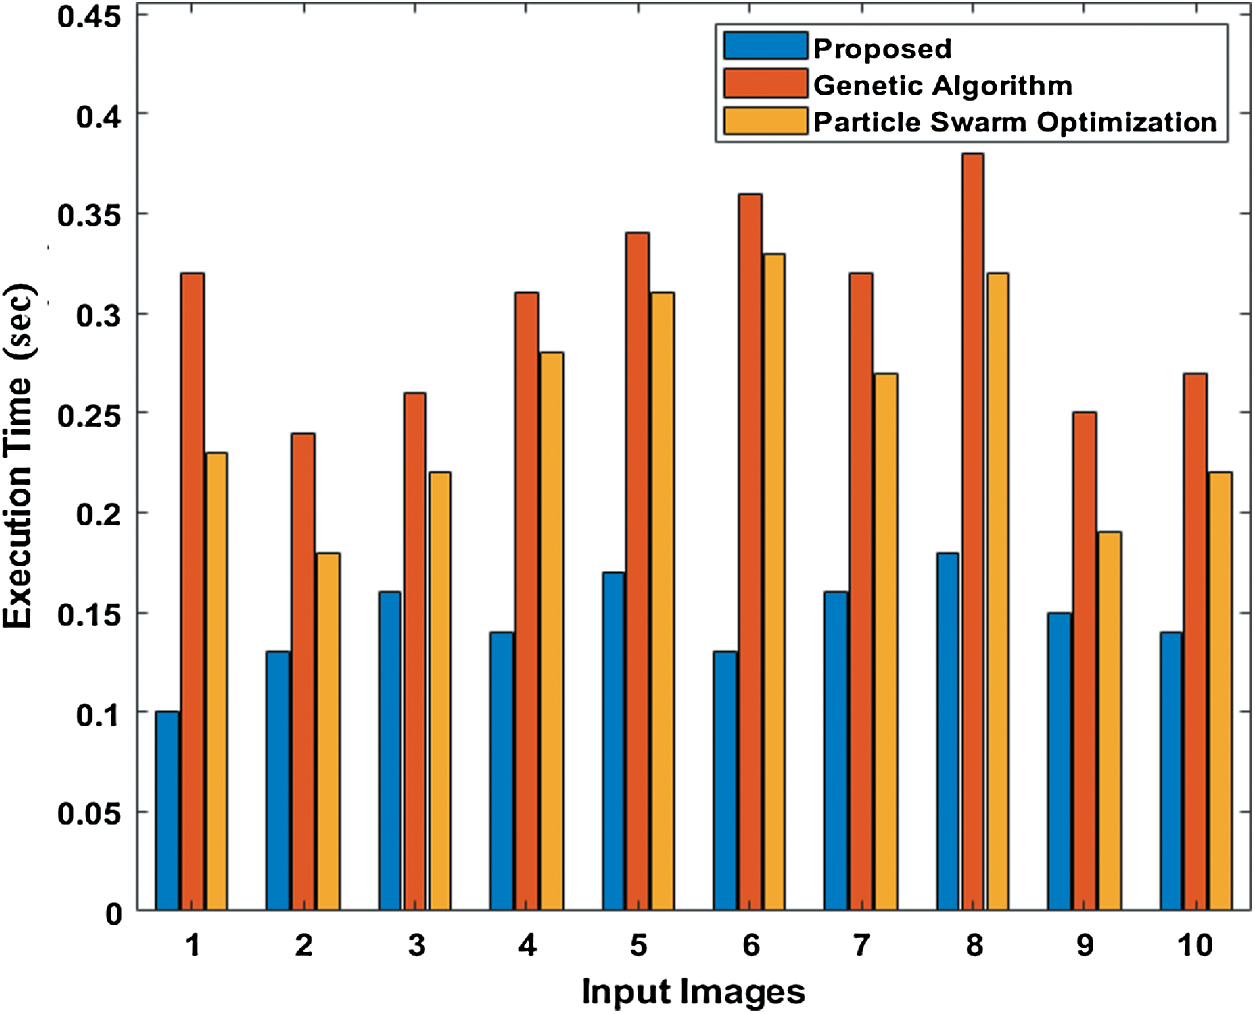
Figure 7: Comparison of various segmentation models interms of CT
Table 3: CT analysis of various models
This paper has presented an effective PST-CED model for the segmentation of MRI BT images. It depends upon the comparison of successive segmentation outcomes and selects the one that offered the highest similarity. The presented PST-CED method involves a series of pre-processing steps to improve the visual quality of the input images. Then, the PST-CED method was applied on the enhanced images. The PST-CED technique was tested with benchmark MRI images and a detailed comparative analysis was conducted with state-of-the-art methods under various measures. The simulation results exhibited that the presented PST-CED model offered maximum segmentation outcome with minimum CT, maximum DR, minimum MSE, and maximum PSNR on all the applied test images. As a part of the future scope, the presented model can be employed in a real-time environment.
Funding Statement: The author(s) received no specific funding for this study.
Conflicts of Interest: The authors declare that they have no conflicts of interest to report regarding the present study.
1. T. Wang, N. Manohar, Y. Lei, A. Dhabaan, H. K. Shu et al. (2018). , “MRI-based treatment planning for brain stereotactic radiosurgery: Dosimetric validation of a learning-based pseudo-CT generation method,” Medical Dosimetry, vol. 44, no. 3, pp. 199–204. [Google Scholar]
2. S. Bauer, T. Fejes, J. Slotboom, R. Wiest, L. P. Nolte et al. (2012). , “Segmentation of brain tumor images based on integrated hierarchical classification and regularization,” in Proc. of the MICCAIBraTS Workshop, Miccai Society, Nice, France, pp. 1–11. [Google Scholar]
3. S. Kotte, R. K. Pullakura and S. K. Injeti. (2018). “Optimal multilevel thresholding selection for brain MRI image segmentation based on adaptive wind driven optimization,” Measurement, vol. 130, pp. 340–361. [Google Scholar]
4. L. Wang, G. Chen, D. Shi, Y. Chang, S. Chan et al. (2018). , “Active contours driven by edge entropy fitting energy for image segmentation,” Signal Processing, vol. 149, pp. 27–35. [Google Scholar]
5. K. Kamnitsas, C. Ledig, V. F. J. Newcombe, J. P. Simpson, A. D. Kane et al. (2017). , “Efficient multi-scale 3D CNN with fully connected CRF for accurate brain lesion segmentation,” Medical Image Analysis, vol. 36, pp. 61–78. [Google Scholar]
6. V. J. Nagalkar and S. S. Asole. (2012). “Brain tumor detection using digital image processing based on soft computing,” Journal of Signal and Image Processing, vol. 3, no. 3, pp. 102–105. [Google Scholar]
7. W. L. Nowinski. (2017). “Human brain atlasing: Past, present and future,” Neuroradiology Journal, vol. 30, no. 6, pp. 504–519. [Google Scholar]
8. E. Abdel-Maksouda, M. Elmogyb and R. Al-Awadi. (2015). “Brain tumor segmentation based on a hybrid clustering technique,” Egypt Information Journal, vol. 16, no. 1, pp. 71–81. [Google Scholar]
9. L. H. Juang and M. N. Wu. (2010). “MRI brain lesion image detection based on color-converted K-means,” Measurement, vol. 43, no. 7, pp. 941–949. [Google Scholar]
10. A. Islam, S. M. S. Reza and K. M. Iftekharuddin. (2013). “Multifractal texture estimation for detection and segmentation of brain tumors,” IEEE Transaction on Biomedical Engineering, vol. 60, no. 11, pp. 3204–3215. [Google Scholar]
11. S. Ramathilagama, R. Pandiyarajan, A. Sathy, R. Devi and S. R. Kannan. (2011). “Modified fuzzy c-means algorithm for segmentation of T1–T2 weighted brain MRI,” Journal of Computational and Applied Mathematics, vol. 235, no. 6, pp. 1578–1586. [Google Scholar]
12. S. Madhukumar and N. Santhiyakumari. (2015). “Evaluation of k-Means and fuzzy C-means segmentation on MR images of brain,” Egyptian Journal of Radiology and Nuclear Medicine, vol. 46, no. 2, pp. 475–447. [Google Scholar]
13. A. Ism, C. Direkoglu and M. Sah. (2016). “Review of MRI based brain tumor image segmentation using deep learning methods,” in Proc. of 12th Int. Conf. on Application of Fuzzy Systems and Soft Computing, Vienna, Austria, pp. 317–324. [Google Scholar]
14. J. Mohana, V. Krishnaveni and G. Yanhui. (2014). “A survey on the magnetic resonance image denoising methods,” Biomedical Signal Processing and Control, vol. 9, pp. 56–69. [Google Scholar]
15. F. Xing, Y. Xie and L. Yang. (2016). “Automatic learning-based framework for robust nucleus segmentation,” IEEE Transactions on Medical Imaging, vol. 35, no. 2, pp. 550–556. [Google Scholar]
16. G. Yang, T. Nawaz, T. R. Barrick, F. A. Howe and G. Slabaugh. (2015). “Discrete wavelet transform based whole spectral and sub spectral analysis for improved brain tumor clustering using single voxel MR spectroscopy,” IEEE Journal of Biomedical and Health Informatics, vol. 62, pp. 2860–2866. [Google Scholar]
17. O. R. Camacho, M. Forero and J. Menéndez. (2017). “A tuning method for diatom segmentation techniques,” Applied Sciences, vol. 7, no. 8, pp. 762. [Google Scholar]
18. G. Urban, M. Bendszus, F. A. Hamprecht and J. Kleesiek. (2014). “Multimodal brain tumor segmentation using deep convolutional neural networks,” in MICCAI Multimodal Brain Tumor Segmentation Challenge (BraTSProc.: Winning Contribution, Boston, Massachusetts, USA, pp. 31–35. [Google Scholar]
19. Y. T. Chen, J. J. Tao, L. Y. Liu, J. Xiong, R. L. Xia et al. (2020). , “Research of improving semantic image segmentation based on a feature fusion model,” Journal of Ambient Intelligence and Humanized Computing. [Google Scholar]
20. Z. Liu, B. Xiang, Y. Song, H. Lu and Q. Liu. (2019). “An improved unsupervised image segmentation method based on multi-objective particle, swarm optimization clustering algorithm,” Computers, Materials & Continua, vol. 58, no. 2, pp. 451–461. [Google Scholar]
21. W. Wang, Y. T. Li, T. Zou, X. Wang, J. Y. You et al. (2020). , “A novel image classification approach via Dense-MobileNet models,” Mobile Information Systems, vol. 2020, no. 7602384, pp. 1–8. [Google Scholar]
22. Y. J. Luo, J. H. Qin, X. Y. Xiang, Y. Tan, Q. Liu et al. (2020). , “Coverless real-time image information hiding based on image block matching and dense convolutional network,” Journal of Real-Time Image Processing, vol. 17, no. 1, pp. 125–135. [Google Scholar]
23. W. J. Li, Y. X. Cao, J. Chen and J. X. Wang. (2017). “Deeper local search for parameterized and approximation algorithms for maximum internal spanning tree,” Information and Computation, vol. 252, pp. 187–200. [Google Scholar]
 | This work is licensed under a Creative Commons Attribution 4.0 International License, which permits unrestricted use, distribution, and reproduction in any medium, provided the original work is properly cited. |