DOI:10.32604/iasc.2020.013189
| Intelligent Automation & Soft Computing DOI:10.32604/iasc.2020.013189 | |
| Article |
Brent Oil Price Prediction Using Bi-LSTM Network
1Faculty of Information Technology, Ton Duc Thang University, Ho Chi Minh City, Vietnam
2Faculty of Information Technology, Ho Chi Minh City Open University, Ho Chi Minh City, Vietnam
3Informetrics Research Group, Ton Duc Thang University, Ho Chi Minh City, Vietnam
*Corresponding Author: Tuong Le. Email: lecungtuong@tdtu.edu.vn
Received: 29 July 2020; Accepted: 26 September 2020
Abstract: Brent oil price fluctuates continuously causing instability in the economy. Therefore, it is essential to accurately predict the trend of oil prices, as it helps to improve profits for investors and benefits the community at large. Oil prices usually fluctuate over time as a time series and as such several sequence-based models can be used to predict them. Hence, this study proposes an efficient model named BOP-BL based on Bidirectional Long Short-Term Memory (Bi-LSTM) for oil price prediction. The proposed framework consists of two modules as follows: The first module has three Bi-LSTM layers which help learning useful information features in both forward and backward directions. The last fully connected layer is utilized in the second module to predict the oil price using important features extracted from the previous module. Finally, empirical experiments are conducted and performed on the Brent Oil Price (BOP) dataset to evaluate the prediction performance in terms of several common error metrics such as Mean Square Error (MSE), Mean Absolute Error (MAE), Root Mean Square Error (RMSE), and Mean Absolute Percentage Error (MAPE) among BOP-BL and three state-of-the-art models (for time series forecasting) including Long Short-Term Memory (LSTM), the combination of Convolutional Neural Network and LSTM (CNN-LSTM), and the combination of CNN and Bi-LSTM (CNN-Bi-LSTM). The experimental results demonstrate that the BOP-BL model outperforms state-of-the-art methods for predicting Brent oil price on the BOP dataset.
Keywords: Oil price prediction; Bi-LSTM Network; time series prediction
Nowadays, many applications of artificial intelligence in various areas such as data mining systems [1–3], business intelligence [4,5], sales predictions [6,7], medical and health care [8], smart agriculture [9,10], and energy consumption prediction [11–13] have been developed. For the bankruptcy prediction problem, Le et al. [4,5] developed several advanced techniques for dealing with the class imbalance problem for effectively predicting the company bankruptcy in South Korea. Moreover, Bohanec et al. [6] introduced a novel general explanation method inside their intelligent system for sales forecasting. Meanwhile, Tsoumakas [7] summarized a number of machine learning techniques for food sales prediction accompanied by a detailed analysis. For medical and health care, Hemanth et al. [8] developed a novel model based on the deep learning technique for abnormal brain image classification. The proposed model is based on the modification in the fully connected layer of the Conventional Deep Convolution Neural Network (DCNN), which reduces the computational complexity without compromising the accuracy of the model. In computer vision, Vo et al. [9] developed an effective model for the herbal plant classification problem. The proposed model combines the deep convolution features with an ensemble-based classifier to improve the performance. Moreover, several machine learning models [10–13] for energy consumption prediction were developed. These models play a significant role in drawing up a national energy development policy in the fourth industrial revolution.
Recently, several techniques for time series prediction are utilized in a number of price prediction problems such as stock price trend prediction [14,15], housing price prediction [16], and water price prediction [17]. The problem of oil price prediction is one of the interesting and necessary issues in artificial intelligence since it presents a big influence in various areas of society. Several studies [18–21] using machine learning are conducted for dealing with the above problem on various datasets. In these studies, several techniques such as Multi-Recurrent Network [18], LSTM [19], ARFIMA [20], and Deep Belief Network [21] are used to predict oil prices and they obtained the positive results. Recently, the U.S. Energy Information Administration released the Brent Oil Price (BOP) dataset that includes daily time-series information of oil prices from 1987 to 2019. Several studies are conducted by utilizing LSTM and the combination of CNN and LSTM for predicting oil prices on the BOP dataset. However, the performance results of the above methods need to be improved because LSTM only considers a sequence in forward direction. Therefore, this study proposes an effective model based on Bi-LSTM for Brent oil price prediction on the BOP dataset. The key idea of the Bi-LSTM model [22] is that it considers a sequence in both forward and backward directions. Hence, it will help the proposed model improve performance in predicting Brent oil prices. The main contributions of this study are as follows. (1) We utilize Bi-LSTM architecture in the first module, which consists of three Bi-LSTM layers, to learn the useful information features in forward and backward directions. (2) The fully connected layer is used in the second module to predict oil prices from the important features extracted from the previous Bi-LSTM layers. (3) The efficient model (BOP-BL model) is developed by combining the first and second modules for predicting the oil prices. (4) Finally, the experiments are conducted to compare the performance results among the proposed model and three state-of-the-art models for time series prediction on the BOP dataset. The experimental results indicate that our model outperforms other experimental methods in terms of several common metrics.
The rest of this article is organized as follows. Section 2 summarizes the related works on time series prediction, recurrent neural network, and the combination of CNN and sequence-based models. The material and method are introduced in Section 3. In this section, this study presents the details of the BOP dataset in Section 3.1. The proposed framework to predict the oil price is illustrated in Section 3.2. Next, Section 4 provides the experimental results of the proposed model and other methods on the experimental dataset. The conclusions as well as future directions are presented in Section 5.
The problem of time series prediction is one of the important problems in machine learning with various practical applications such as stock price trend prediction [14,15], housing price prediction [16], and water price prediction [17]. Zhang et al. [14] introduced a system for the stock price trend prediction which is a combination of random forest, imbalance learning, and feature selection. The experiments on the seven-year Shenzhen Growth Enterprise dataset demonstrated that the proposed method outperforms several existing methods in terms of accuracy and return per trade. Meanwhile, Lei et al. [15] proposed an effective model by improving the prediction capacity of the stock price trend. They first introduced a Rough Set technique to reduce the feature dimensions of the stock price trend. Then, the Wavelet Neural Network was applied to predict the stock trend efficiently. For the problem of housing price prediction, Montero et al. [16] developed a mixed method for predicting house prices in Madrid city. The proposed model allows the estimation of the smoothing parameters as well as the other parameters of the model. The experimental results in this study confirm that the proposed model can obtain promising results for the house price prediction problem. Moreover, Ziyao et al. [17] developed a model to deal with water price prediction in the western United States based on the random forest regression technique.
The Recurrent Neural Network (RNN) known as one of the effective approaches refers to tackling the sequential problem or temporal aspects of data as time series. Many previous studies have utilized the RNN as well as several variants of RNN such as Long-Short-Term Memory (LSTM), and Bidirectional Long-Short-Term Memory (Bi-LSTM) to obtain promising results in various applications. Recently, Le et al. [23] proposed a novel framework for the flood forecasting problem, which is an important component in the water resource management system. In this study, the daily discharge and rainfall data of Da river located in the north of Vietnam were used to put into the LSTM model to forecast the flood. The experimental results indicated that their model obtains impressive results, where it reached 99%, 95%, and 87% in Nash-Sutcliffe efficiency (NSE) metric corresponding to one-day, two-day, and three-day flowrate, respectively. In addition, a method based on the LSTM model was introduced by Cai et al. [24] to identify the normal and abnormal behavior on the earthquake precursor data. Though the empirical results, this study proved that the proposed LSTM-based model obtained promising results for detecting anomalies on earthquake precursor data. Later, Xie et al. [25] proposed an attention-based LSTM model to classify speech emotion problems. To improve the performance of speech emotion recognition, the authors utilized the frame-level speech features combined with attention-based LSTM. Specifically, the waveform was utilized to extract frame-level speech features and to replace traditional statistical features. This process could capture the timing relations in the original speech through the sequence of frames of speech. Their experiments were conducted on the CASIA, eNTERFACE, and GEMEP emotion corpora datasets. The results proved that the attention-based LSTM outperforms the state-of-the-art methods for speech emotion classification. Recently, Zhu et al. [26] utilized LSTM to adopt an anomaly detection algorithm for KPI prediction. Meanwhile, Yan et al. [27] predicted the number of COVID-19 confirmed cases using LSTM. Using the obtained results from this model, the government can control the pandemic by applying the appropriate policies. Moreover, the RNN-based model is adopted in many natural language processing applications such as the sentiment classification problem. For example, Huang et al. [28] proposed a topic information-based Bi-LSTM model for sentiment classification. Specifically, Bi-LSTM learns the topic information by capturing the sensitive representation of the polysemous word under circumstance, and Latent Dirichlet Allocation (LDA) generates the topic information. The advantage of the information-based Bi-LSTM model is to allow capturing the meaning of the polysemous word and long sequence information automatically. Their proposed model was performed on two real-world datasets including SemEval 2013 and IMDB. The experimental results demonstrated the effectiveness of their proposed model for the task of benchmark sentiment classification.
Besides, several studies have adopted the combination of CNN and sequence-based models. The idea behind these approaches is to improve the effectiveness of the model by utilizing CNN to extract and reduce the feature dimensions and then the sequenced model to predict for specific values. This approach improves not only the performance of the predictive models but also time consumption [11,12,29]. Le et al. [11] proposed a different method utilizing Bi-LSTM instead of LSTM for electric energy consumption prediction. The results showed that the modified model improved the performance of the prediction model and time consumption. Later, Kim et al. [12] developed an effective method that relied on the combination of Convolutional Neural Network (CNN) and LSTM for forecasting electric energy consumption. Also, Vo et al. [29] developed an effective method for Vietnamese sign language recognition (VSLR) in the video sequence. First, the proposed model utilized a CNN-based model to extract the feature information on each frame of the input video. Then, the LSTM-based model was utilized to learn on the extracted features from the previous CNN step. Finally, a soft-max function was adapted to predict the class of sign words. The experimental results in this study confirmed that this approach improved the performance of the predictive model compared with the state-of-the-art methods for this problem. Hanson et al. [30] proposed the Bidirectional Convolutional LSTM (BiConvLSTM) for the detection of violence such as the Hockey Fights, Movies, and Violent Flows in the video sequence. They also introduced a novel method named Spatio-Temporal Encoder (STE) which built on the BiConvLSTM architecture. The experimental results in this study indicated that STE outperforms other methods for the problem of violence detection. In addition, image captioning that combines computer vision and natural language processing is widely being concerned by the research community recently. The existing studies showed that the combination of a deep convolutional neural network and the sequence-based model improves the performance for this problem. Wang et al. [31] proposed an end-to-end deep Bi-LSTM model to tackle the image captioning problem. This model aims to convert input images into sentences. Their experiments were conducted on four benchmark datasets including Flickr8K, Flickr30K, MSCOCO, and Pascal1K. The proposed method obtained the highly competitive performance on caption generation and image-sentence retrieval. Besides, Le et al. [32] introduced a novel model called sAtt-BLSTM convNet to address the problem of sarcasm detection. The model was considered as the hybrid of soft attention-based Bi-LSTM and CNN applying global vectors for word representation. Most of the existing studies based on the combinations of CNN-based models and sequence-based models indicated that these methods gained the improved performances on the kind of data which contains the diverse characteristics feature of data. However, this study recognizes that the combination of the CNN-based and sequence-based model is not able to improve performance in the case of the limited characteristics of data. The reason is that the CNN-based models may lose the essential features due to the limited characteristics of data.
The BOP dataset provides the time series of the daily oil prices from 1987 to 2019. There is a total of 8,217 observations of daily oil prices collected by the U.S. Energy Information Administration. Each observation in this dataset consists of the date and oil price. Two visualizations of the BOP dataset are shown in Figs. 1 and 2. Fig. 1 describes the change in oil prices while Fig. 2 shows the trend of oil prices in the period from 1987 to 2019.
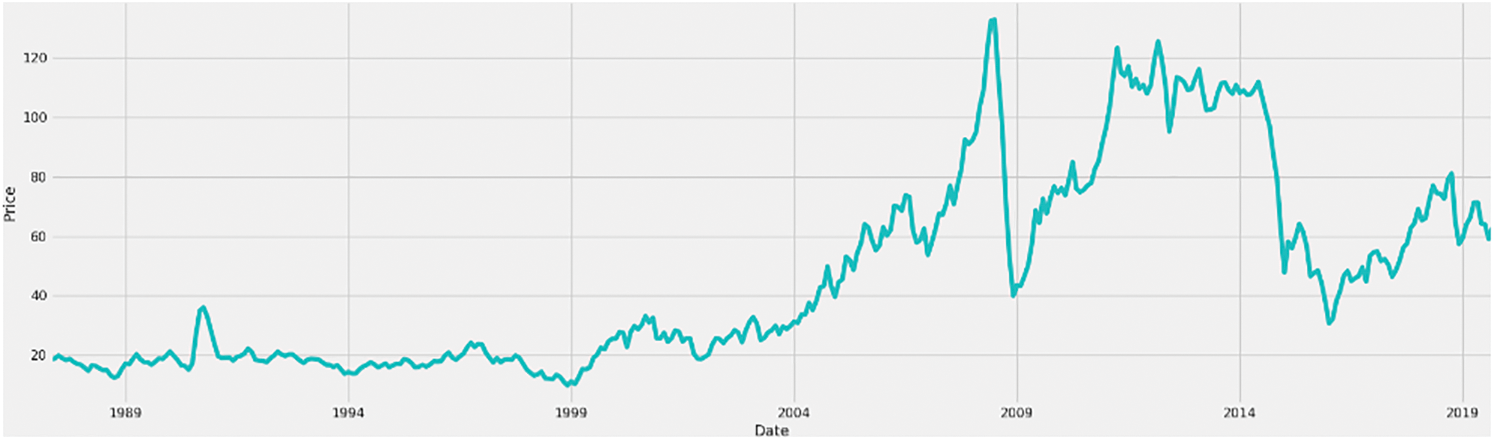
Figure 1: The changes of oil prices from 1987 to 2019
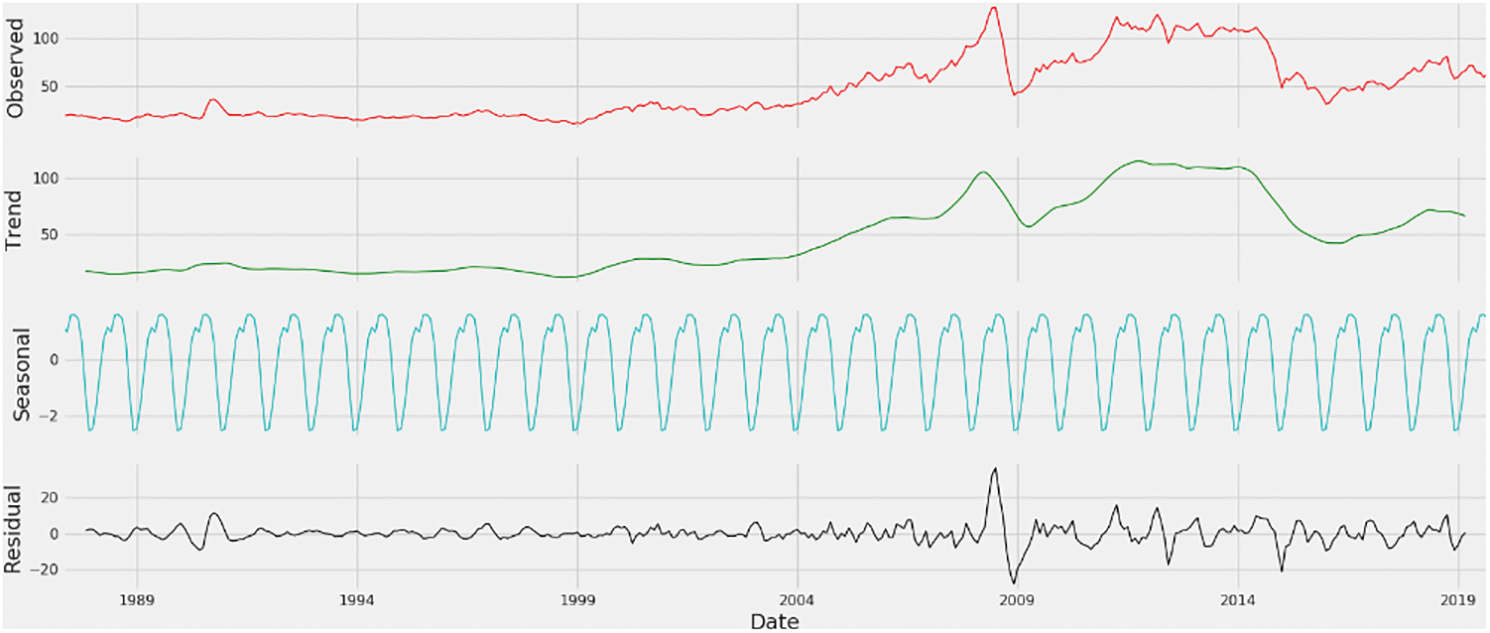
Figure 2: Graph of the trend of oil prices from 1987 to 2019
According to Fig. 1, the trend of oil prices seems to change from 2004 to 2019 intricately. From the end of 2004 to the beginning of 2008, the oil price rapidly increases. However, it suddenly decreases from the end of 2008 to 2009 due to the economic crisis. Later, the oil price continually increases from 2009 and maintains until the end of 2015. Therefore, this figure shows the trend of abnormal change in oil prices.
Fig. 2 clearly shows the irregular trend of the oil prices when it is observed according to trend, seasonal and residual components from the beginning of 2004 to 2009. In the preprocessing step, we clean BOP dataset by removing the missing values. Then, this study normalizes the data. Finally, BOP dataset is separated into training and testing sets with 7:3 ratio to learn and evaluate the experimental models.
3.2 BOP-BL: The Proposed Framework for Oil Price Prediction
According to the characteristics of the oil price dataset analyzed in the previous section, we propose an efficient framework named BOP-BL for predicting the Brent oil prices. The proposed framework utilizes Bi-LSTM in the first module for capturing the information in forward and backward directions of oil price time series. The overview of the training phase is summarized as follows. First, the input vectors from the BOP dataset are passed into the first Bi-LSTM layer in the first module to learn the essential features related to the changes in oil price trends. In other words, the first layer captures the essential information in forwarding and backward directions of oil price time series. After that, the outputs of the first layer are continuously put into two remaining Bi-LSTM layers in the first module to refine the useful information for the next step. Finally, the second module that has a fully connected layer is utilized to reduce the feature dimensions based on the obtained features from the previous module to predict oil prices. In the testing phase, the proposed framework puts the feature vectors of the test set into the trained model to predict oil prices. The overview of the proposed framework is illustrated in Fig. 3.
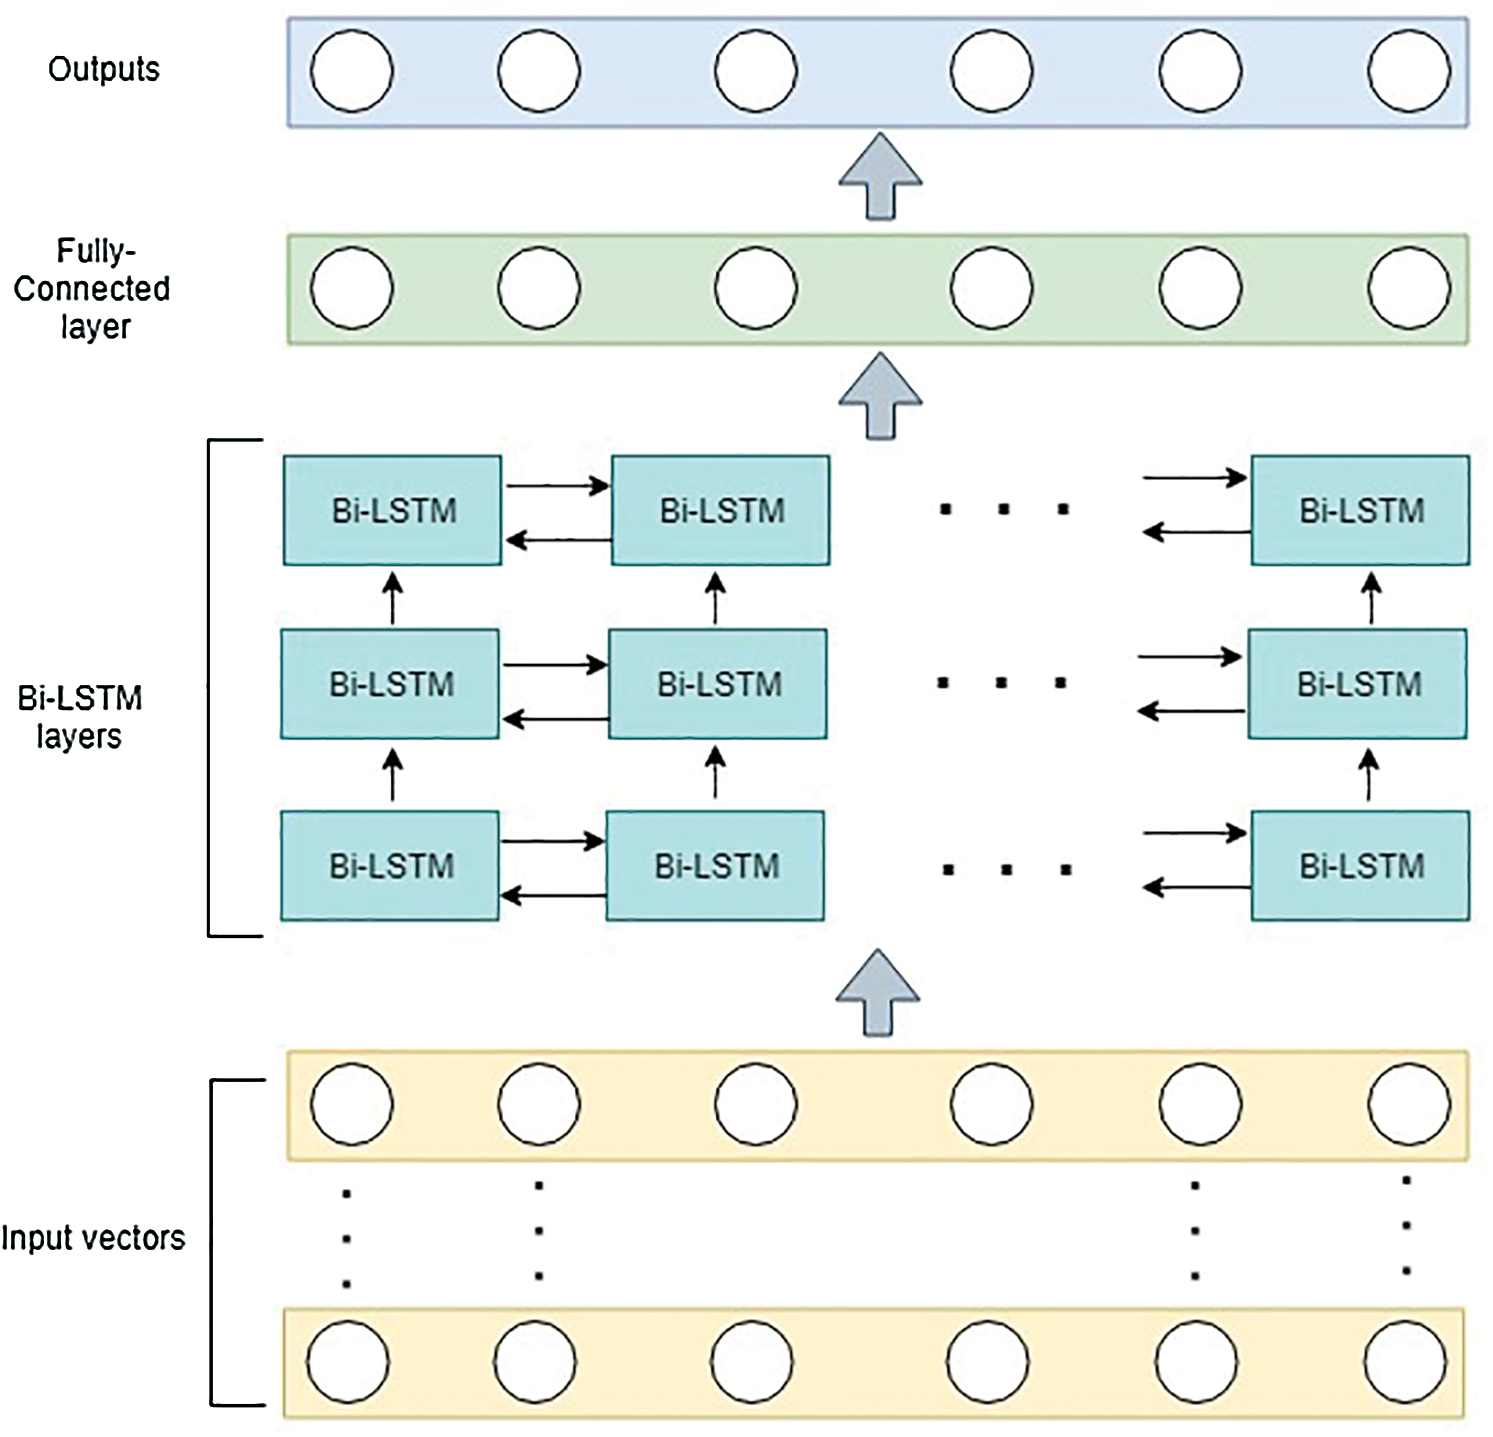
Figure 3: The overview of BOP-BL framework
To understand our proposed framework, the feature vector from the BOP dataset  is considered as a sequence. Then, it is put into the Bi-LSTM module to capture the essential information of feature vectors. To easy understand Bi-LSTM, we firstly brief the LSTM network. This network is known as a special kind of RNN in the context of the sequence problem. LSTM is proposed to address not only the long-term dependency problem but also the vanishing gradient problem in the traditional RNN model. This network is based on several gates inside each LSTM cell. Each LSTM cell is formulated as follows.


where  is the hidden vector of tth step, and
  ,
, ,
, , and
, and are the input gate, forget gate, memory cell, and output gate, respectively. A sigmoid function is denoted by
  , in which the output value of this function is from 0 to 1. In Eqs. (3) and (5), the notation
  is known as the Hadamard product. LSTM only preserves the forward direction. This strategy loses useful information from the backward direction. Thus, it impacts the effectiveness of the forecast model in some time series datasets that have irregular trend. On the other hand, the predictive models need more information not only in a forward direction but also in a backward direction due to the relation of features in both directions. Therefore, Bi-LSTM is developed and considered as an extension of the LSTM network. Bi-LSTM can preserve information of input vectors both directions. The outputs of Bi-LSTM are obtained by the integrated forward-and-backward process of the LSTM network which formulated by Eq. (6).

where  is the output of Bi-LSTM network;
  and
and  are the outputs of LSTM network in forward and backward directions respectively at tth step.
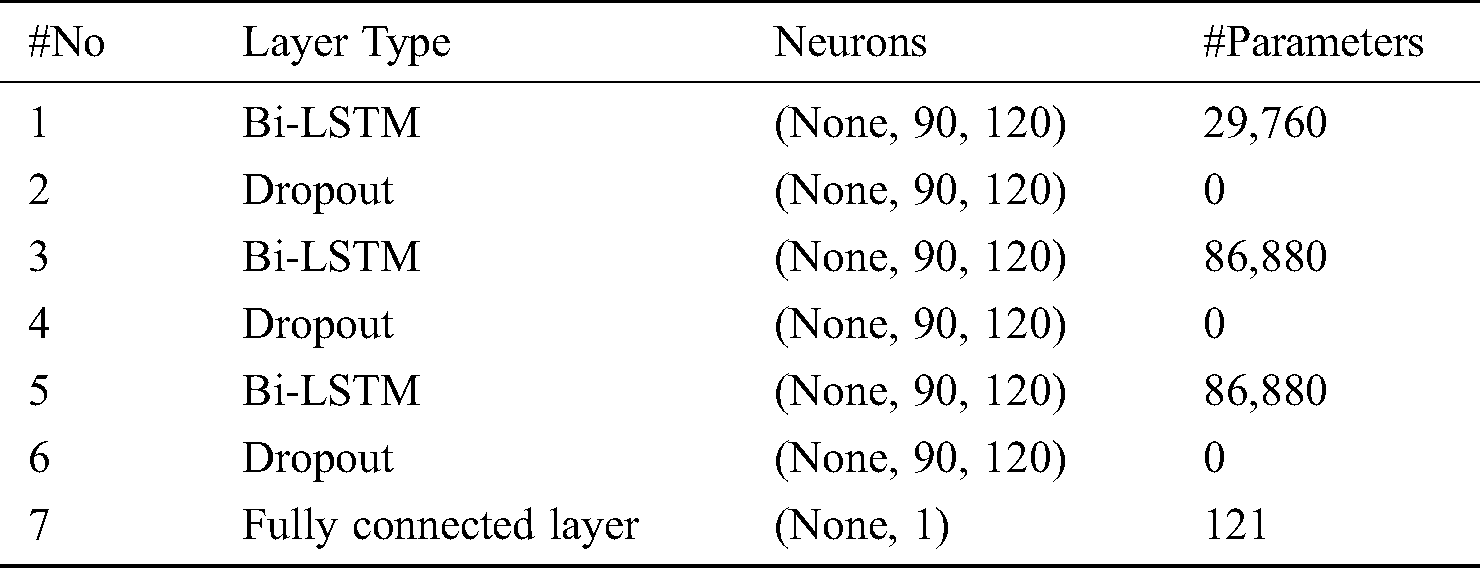
Finally, the outputs of the first module are passed into one fully connected layer (the second module) to generate the oil price in our framework (see Fig. 3). Tab. 1 shows the structure and configuration details of the proposed framework.
Table 1: The structure and configuration details of BOP-BL model
This section compares the performance results among the proposed method and the state-of-the-art methods for time series prediction including LSTM, CNN-LSTM, CNN-Bi-LSTM approaches to verify the effectiveness of BOP-BL model for the oil price prediction problem. Notice that the experimental methods are performed in the same environment. In the first method namely LSTM, this study utilizes three LSTM layers in the first module following with one fully connected layer in the second module. In addition, the CNN-LSTM model consists of two CNN layers, two LSTM layers, and one fully connected layer. Meanwhile, the CNN-Bi-LSTM model utilizes Bi-LSTM instead of LSTM in the same architecture of the CNN-LSTM model. The Keras library is utilized as a background framework for all experimental methods. The experimental computer is with CPU core i7 (2.7 GHz), 16 GB RAM, and GPU 940MX. Moreover, all experimental models are trained in 50 epochs, and a batch size of 15. The Adam optimizer algorithm is applied in the experimental methods for optimizing with an initializing learning rate of 0.001.
In addition, this study utilizes four performance metrics in time series prediction problems such as MSE, RMSE, MAE, and MAPE. Each metric shows a different meaning in time series prediction. MSE metric measures the average of the squares of errors while RMSE metric considers how spread out these residuals are by the standard deviation of prediction errors. Moreover, MAE metric measures the average magnitude of the prediction errors. Finally, MAPE represents the accuracy of the model prediction. The following equations show how to calculate the above-mentioned error metrics.


where y and  in the above equations denote the actual value and the predicted value from the prediction model, respectively.
Firstly, this study conducts the experiment on the stability and convergence of BOP-BL model. Fig. 4 illustrates loss values in training phase (the red line) and the loss values in testing phase (the blue line) over fifty epochs. These results indicate that the proposed method achieves the stable loss value in both the training and testing over ten epochs. Thus, it has demonstrated that our proposed method quickly reaches stability and generalization in ten epochs. In other words, our model is time efficient.
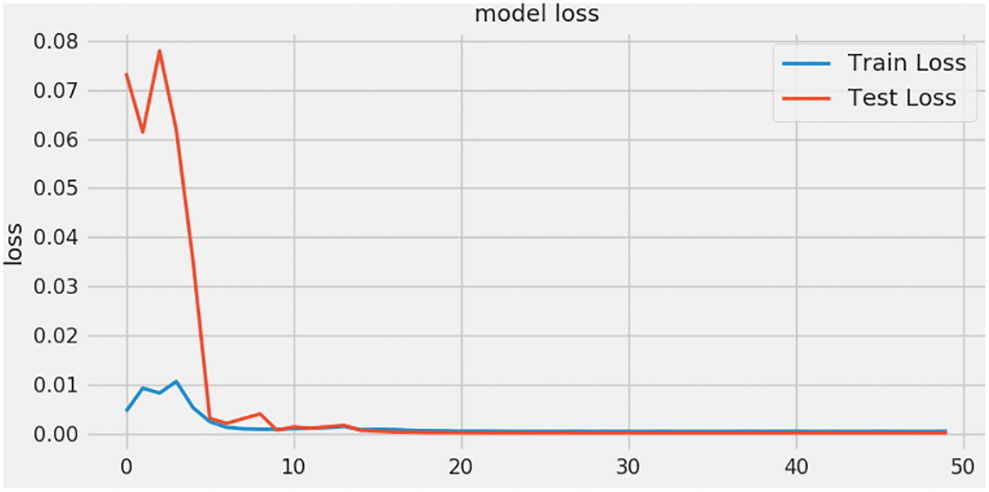
Figure 4: The loss values of BOP-BL model in training and testing phases
The experimental results illustrated in Fig. 5 indicate that the complex models based on CNN such as CNN-LSTM and CNN-Bi-LSTM do not obtain good performance results for BOP dataset. The subgraphs in Figs. 5b and 5c show the predictive results obtained from both CNN-LSTM and CNN-Bi-LSTM models by the red line. These subgraphs indicate that the predicted oil prices of two above models are hard to fit with the actual price represented by the blue line. On the contrary, Figs. 5a and 5d indicate that the predicted oil prices of LSTM model and the proposed method match the actual price. Therefore, LSTM model and the proposed method achieve better results compared with CNN-LSTM and CNN-Bi-LSTM models. In addition, it could be easy to observe that the predicted oil prices of our proposed approach are better than those of the LSTM, CNN-LSTM and CNN-Bi-LSTM models.
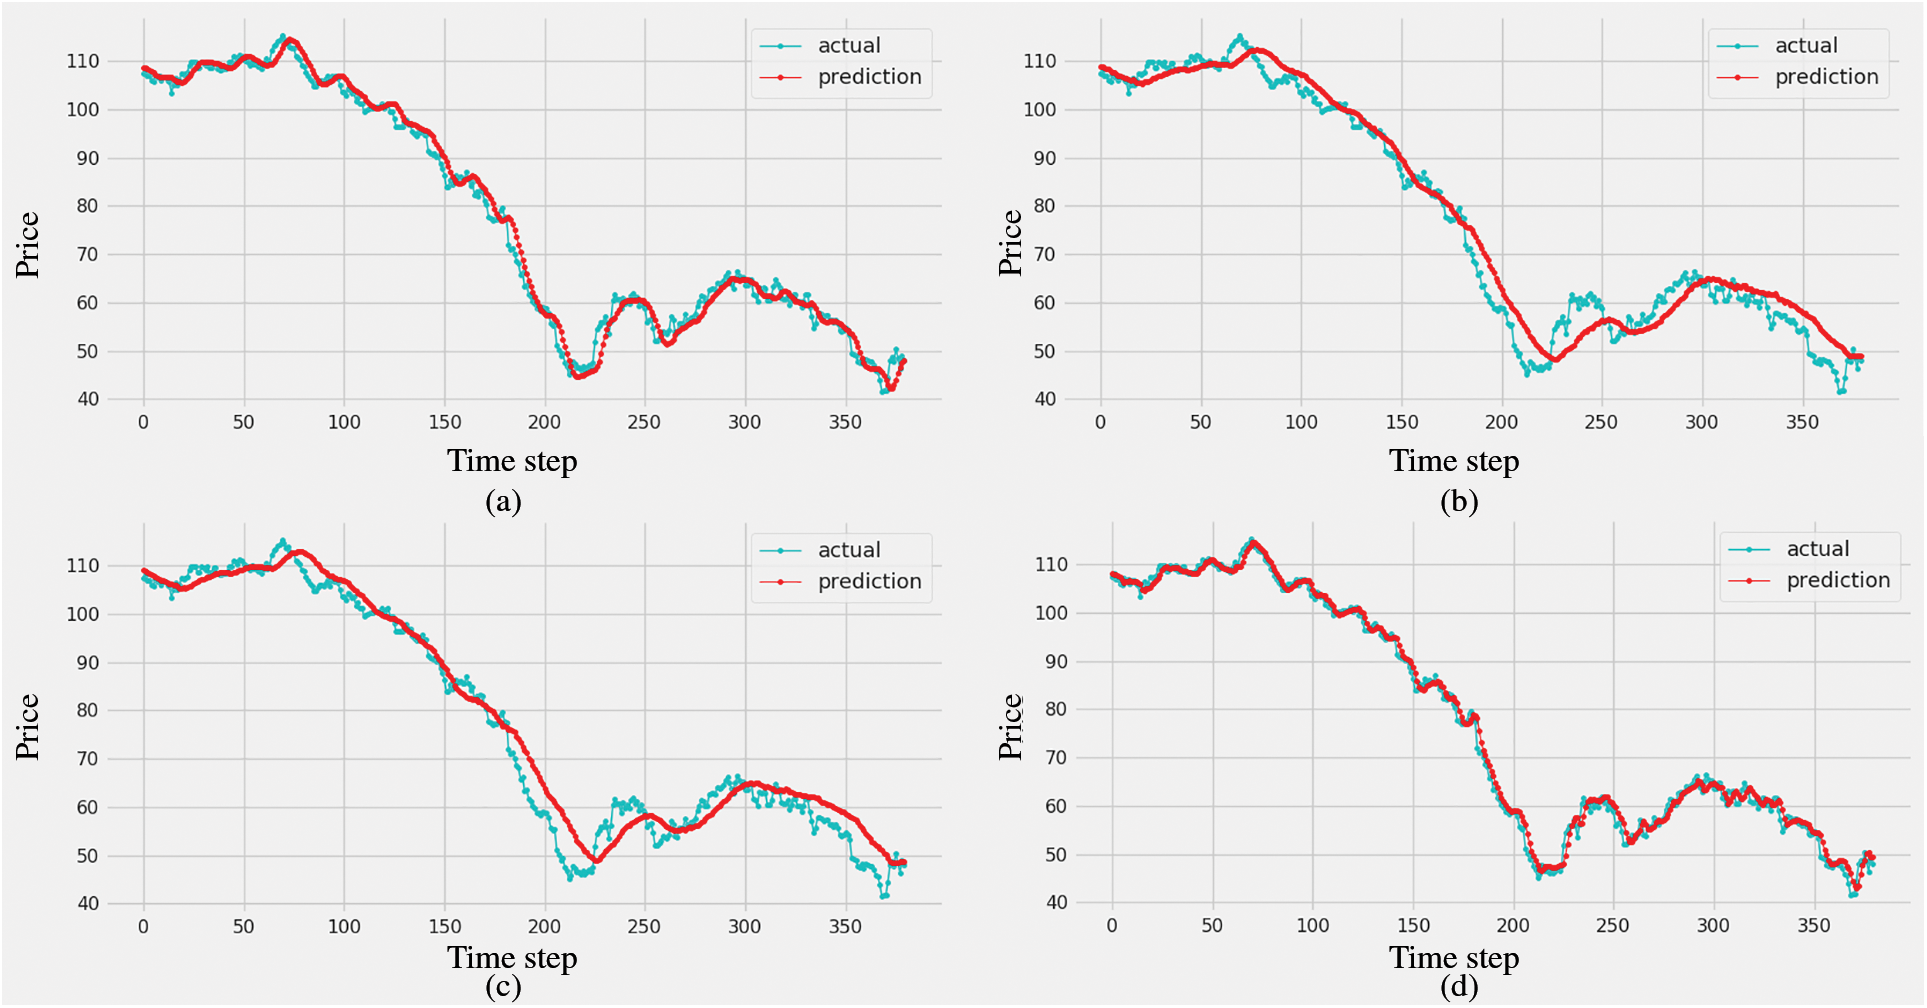
Figure 5: Results of the proposed method and the other methods with ground truth values on the testing set: (a) LSTM, (b) CNN-LSTM, (c) CNN-Bi-LSTM, and (d) BOP-BL
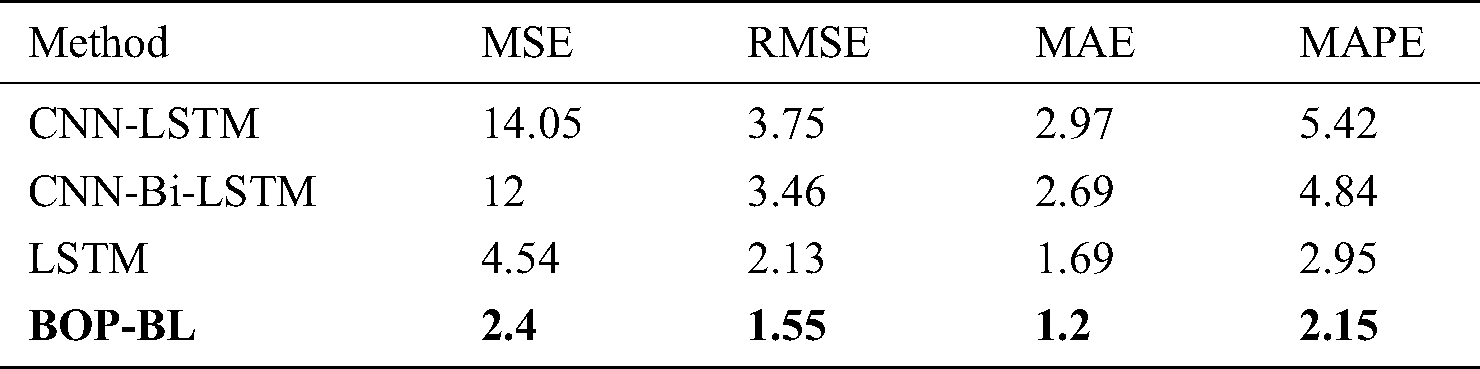
Next, the experimental results for the BOP dataset are presented in Tab. 2 which indicates that our method outperforms other experimental methods in terms of four above-mentioned metrics including MSE, RMSE, MAE, and MAPE. First, CNN-LSTM method obtains 14.05 and 5.42 while CNN-Bi-LSTM model achieves 12, and 4.84 in MSE and MAPE, respectively. Meanwhile, LSTM and BOP-BL models achieve better error metrics with only 4.54 and 2.4 for MSE and 2.95 and 2.15 for MAPE, respectively. Therefore, CNN-based approaches are inefficient compared with the sequence-based approaches including LSTM and Bi-LSTM. Moreover, the proposed model achieves the lowest errors compared with the other experimental methods in terms of MSE and MAPE metrics. For RMSE metric, BOP-BL method also outperforms other experimental methods. Specifically, our proposed method achieves the lowest RMSE error with only 1.55, that improves 0.58, 2.2, and 1.91 compared with LSTM, CNN-LSTM, and CNN-Bi-LSTM, respectively. In addition, BOP-BL model also obtains the best value at 1.2 in MAE metric while LSTM, CNN-LSTM, and CNN-Bi-LSTM achieves 1.69, 2.97, and 2.68 in MAE metric, respectively. The details are shown in Tab. 2.
Table 2: Performance results of experimental methods for the BOP dataset
Based on the empirical analysis from Fig. 5 and Tab. 2, the CNN-based approaches seem ineffective for the BOP dataset. The cause of this problem can be explained as follows. In these approaches, the first CNN module is utilized to extract the features as well as reduce the feature dimensions. However, it also can lose the essential features that reduce the predictive performance of these models. In addition, LSTM only preserves the forward directions that also loses the essential features. Therefore, the proposed model is recommended in the problem of oil trend prediction for BOP dataset.
In this study, we developed an efficient framework based on the Bi-LSTM network for predicting Brent oil prices for the BOP dataset. The proposed framework named BOP-BL consists of two modules as follows. The Bi-LSTM network is utilized in the first module to preserve the essential information of input features in both forward and backward directions, while a fully connected layer is used in the second module to predict the oil prices. The experiments are conducted on the BOP dataset to indicate that the proposed framework is superior to the state-of-the-art methods for time series prediction including LSTM, CNN-LSTM, and CNN-Bi-LSTM in terms of several popular metrics including MSE, RMSE, MAE, and MAPE. In addition, the empirical analysis of this study also confirms that the sequence-based models such as Bi-LSTM and LSTM are more effective than the complex models such as CNN-LSTM, and CNN-Bi-LSTM on the POP dataset. Therefore, BOP-BL and the models based on Bi-LSTM are recommended to predict the oil price.
In the future, we intend to utilize Bayesian optimization to improve the performance of the proposed model for predicting the oil price following time series. Besides, we will continuously compare the efficiency of the proposed model by extension of the oil price dataset or by trying it on another dataset.
Funding Statement: The author(s) received no specific funding for this study.
Conflicts of Interest: The authors declare that they have no conflicts of interest to report regarding the present study.
1. B. Vo, H. Bui, T. Vo and T. Le. (2020). “Mining top-rank-k frequent weighted itemsets using WN-list structures and an early pruning strategy,” Knowledge-Based Systems, vol. 201–202, 106064. [Google Scholar]
2. B. Vo, T. Le, W. Pedrycz, G. Nguyen and S. W. Baik. (2017). “Mining erasable itemsets with subset and superset itemset constraints,” Expert Systems with Applications, vol. 69, pp. 50–61.
3. G. Nguyen, T. Le, B. Vo and H. B. Le. (2015). “EIFDD: An efficient approach for erasable itemset mining of very dense datasets,” Applied Intelligence, vol. 43, no. 1, pp. 85–94. [Google Scholar]
4. T. Le, M. T. Vo, B. Vo, M. Y. Lee and S. W. Baik. (2019). “A hybrid approach using oversampling technique and cost-sensitive learning for bankruptcy prediction,” Complexity, vol. 2019, no. 2, 8460934. [Google Scholar]
5. T. Le, B. Vo, H. Fujita, N. T. Nguyen and S. W. Baik. (2019). “A fast and accurate approach for bankruptcy forecasting using squared logistics loss with GPU-based extreme gradient boosting,” Information Sciences, vol. 494, pp. 294–310. [Google Scholar]
6. M. Bohanec, M. Kljajić Borštnar and M. Robnik-Šikonja. (2017). “Explaining machine learning models in sales predictions,” Expert Systems with Applications, vol. 71, pp. 416–428. [Google Scholar]
7. G. Tsoumakas. (2019). “A survey of machine learning techniques for food sales prediction,” Artificial Intelligence Review, vol. 52, no. 1, pp. 441–447. [Google Scholar]
8. D. J. Hemanth, J. Anitha, A. Naaji, O. Geman, D. E. Popescu et al. (2019). , “A modified deep convolutional neural network for abnormal brain image classification,” IEEE Access, vol. 7, pp. 4275–4283. [Google Scholar]
9. H. A. Vo, H. T. Dang, B. T. Nguyen and V. H. Pham. (2019). “Vietnamese herbal plant recognition using deep convolutional features,” International Journal of Machine Learning and Computing, vol. 9, no. 3, pp. 363–367. [Google Scholar]
10. H. A. Vo, H. S. Le, M. T. Vo and T. Le. (2019). “A novel framework for trash classification using deep transfer learning,” IEEE Access, vol. 7, no. 1, pp. 178631–178639. [Google Scholar]
11. T. Le, M. T. Vo, B. Vo, E. Hwang, S. Rho et al. (2019). , “Improving electric energy consumption prediction using CNN and Bi-LSTM,” Applied Sciences, vol. 9, no. 20, 4327. [Google Scholar]
12. T. Y. Kim and S. B. Cho. (2019). “Predicting residential energy consumption using CNN-LSTM neural networks,” Energy, vol. 182, pp. 72–81. [Google Scholar]
13. T. Le, M. T. Vo, T. Kieu, E. Hwang, S. Rho et al. (2020). , “Multiple electric energy consumption forecasting using a cluster-based strategy for transfer learning in smart building,” Sensors, vol. 20, no. 9, pp. 2668. [Google Scholar]
14. J. Zhang, S. Cui, J. Xu, Q. Li and T. Li. (2018). “A novel data-driven stock price trend prediction system,” Expert Systems with Applications, vol. 97, pp. 60–69. [Google Scholar]
15. L. Lei. (2018). “Wavelet neural network prediction method of stock price trend based on rough set attribute reduction,” Applied Soft Computing, vol. 62, pp. 923–932. [Google Scholar]
16. J. M. Montero., R. Mínguez and G. Fernández-Avilés. (2018). “Housing price prediction: Parametric versus semi-parametric spatial hedonic models,” Journal of Geographical Systems, vol. 20, no. 1, pp. 27–55. [Google Scholar]
17. X. Ziyao, J. Lian, L. Bin, K. Hua, K. Xu et al. (2019). , “Water price prediction for increasing market efficiency using random forest regression: A case study in the western united states,” Water, vol. 11, no. 2, 228. [Google Scholar]
18. O. Orojo, J. Tepper, T. M. McGinnity and M. Mahmud. (2019). “A multi-recurrent network for crude oil price prediction,” in Proc. SSCI, Xiamen, China, pp. 2940–2945. [Google Scholar]
19. Z. Cen and J. Wang. (2019). “Crude oil price prediction model with long short term memory deep learning based on prior knowledge data transfer,” Energy, vol. 169, pp. 160–171. [Google Scholar]
20. H. Abdollahi and S. B. Ebrahimi. (2020). “A new hybrid model for forecasting Brent crude oil price,” Energy, vol. 200, 117520. [Google Scholar]
21. J. Chen, Y. Hao, H. Wang, T. Wang and D. Zheng. (2019). “Futures price prediction modeling and decision-making based on DBN deep learning,” Intelligent Data Analysis, vol. 23, no. S1, pp. 53–65. [Google Scholar]
22. A. Graves and J. Schmidhuber. (2005). “Framewise phoneme classification with bidirectional LSTM and other neural network architectures,” Neural Networks, vol. 18, no. 5–6, pp. 602–610. [Google Scholar]
23. X. H. Le, V. H. Ho, G. Lee and S. Jung. (2019). “Application of long short-term memory neural network for flood forecasting,” Water, vol. 11, no. 7, pp. 1387. [Google Scholar]
24. C. Yin, M. L. Shyu, Y. X. Tu, Y. T. Teng and X. X. Hu. (2019). “Anomaly detection of earthquake precursor data using long short-term memory networks,” Applied Geophysics, vol. 16, no. 3, pp. 257–266. [Google Scholar]
25. Y. Xie, R. Liang, Z. Liang, C. Huang, C. Zou et al. (2019). , “Speech emotion classification using attention-based LSTM,” IEEE/ACM Transactions on Audio, Speech, and Language Processing, vol. 27, no. 11, pp. 1675–1685. [Google Scholar]
26. H. Zhu, F. Meng, S. Rho, M. Li, J. Wang et al. (2019). , “Long short-term memory networks based anomaly detection for KPIs,” Computers, Materials & Continua, vol. 61, no. 2, pp. 829–847. [Google Scholar]
27. B. Yan, J. Wang, Z. Zhang, X. Tang, Y. Zhou et al. (2020). , “An improved method for the fitting and prediction of the number of COVID-19 confirmed cases based on LSTM,” Computers, Materials & Continua, vol. 64, no. 3, pp. 1473–1490. [Google Scholar]
28. Y. Huang, Y. J. Hasan, Q. Jiang and C. Li. (2018). “A topic BiLSTM model for sentiment classification,” in Proc. ICIAI, Shanghai, China, pp. 143–147. [Google Scholar]
29. H. A. Vo, V. H. Pham and T. B. Nguyen. (2019). “Deep learning for Vietnamese sign language recognition in video sequence,” International Journal of Machine Learning and Computing, vol. 9, no. 4, pp. 440–445. [Google Scholar]
30. A. Hanson, P. Koutilya, S. Krishnagopal and L. Davis. (2018). “Bidirectional convolutional LSTM for the detection of violence in videos,” in European Conf. on Computer Vision, Munich, Germany, pp. 280–295. [Google Scholar]
31. C. Wang, H. Yang and C. Meinel. (2018). “Image caprioning with deep bidirectional LSTMs and multi-task learning,” ACM Transactions on Multimedia Computing, Communications, and Applications, vol. 14, no. 1, pp. 40. [Google Scholar]
32. L. H. Son, A. Kumar, S. R. Sangwan, A. Arora, A. Nayyar et al. (2019). , “Sarcasm detection using soft attention-based bidirectional long short-term memory model with convolution network,” IEEE Access, vol. 7, no. 1, pp. 23319–23328. [Google Scholar]
 | This work is licensed under a Creative Commons Attribution 4.0 International License, which permits unrestricted use, distribution, and reproduction in any medium, provided the original work is properly cited. |